Article

Effects of Planting, Vegetation Management, and Pre-Commercial Thinning on the Growth and Yield of Lodgepole Pine Regenerated after Harvesting in Alberta, Canada

by
W. Richard Dempster
Forest Growth Organization of Western Canada (FGrOW), fRI Research, Hinton, AB T7V 1V3, Canada
Forests 2022, 13(6), 929; https://doi.org/10.3390/f13060929
Submission received: 29 April 2022 / Revised: 4 June 2022 / Accepted: 8 June 2022 / Published: 14 June 2022
(This article belongs to the Special Issue Silviculture and Management of Boreal Forests)

Abstract

:
A large long-term field trial was established in the Upper and Lower Foothills sub-regions of the Canadian boreal forest to monitor the effects of planting, vegetation management, and pre-commercial thinning on the development of lodgepole pine stands following harvesting. Data collected at the end of the trial’s regeneration phase, 17 to 20 years after its establishment, were tested for treatment effects and projected to rotation age. Planting generally improved stocking and increased projected growth and yield of lodgepole pine. On modal sites, planted trees were often greatly outnumbered by natural regeneration; however, on others, typically with either poorer or richer soils, satisfactory restocking was not achieved without planting. Control of competing vegetation by herbicide application facilitated regeneration of pine where it was otherwise difficult or impossible on sites with excessive herbaceous or hardwood competition. Pre-commercial thinning accelerated the growth of individual trees and was projected to shorten rotations in dense stands. Responses to the treatments varied depending on environmental factors. Particular treatments may be effective to meet management objectives under some site conditions but unnecessary or counterproductive elsewhere.

1. Introduction

The Upper and Lower Foothills of Alberta are fire-prone sub-regions of the Canadian Boreal Forest. Lodgepole pine (Pinus contorta Dougl. ex Loud. var. latifolia Engelm.) has assumed a dominant position over much of the area in the wake of fire. Trembling aspen (Populus tremuloides Michx.) and balsam poplar (Populus balsamifera L.) frequently occur with pine in the Lower Foothills sub-region at elevations of less than 1200 m, but they are scarcer in the Upper Foothills [1]. Average fire cycles are estimated to have been in the order of 80 to 100 years historically, and fire is unlikely to be eliminated from the ecosystem [2]. Nevertheless, timber harvesting is undertaken on public lands with the intent of replacing fire, at least to some extent, as the agent of stand renewal. Clear-cutting, in combination with mechanical site preparation, has been demonstrated to be effective for the natural regeneration of lodgepole pine [3,4], with the potential to increase timber productivity relative to that of fire-origin stands [5].
Sustained yield timber management and reforestation have been legislated requirements on Alberta public lands since 1949. Reforestation is regulated pursuant to the Reforestation Standard of Alberta (RSA) [6]. The standard requires the assessment of regeneration performance in each harvested opening relative to yields assumed in a forest management plan approved by the Government of Alberta. The plans are prepared by industrial holders of forest management agreements and must demonstrate compliance with requirements for sustained yield timber production, stipulated by the Government, before timber harvesting can be undertaken on public lands. Performance surveys are conducted 12 to 14 years after harvest in order to determine whether adequate regeneration has occurred to maintain the levels of long-term timber production assumed in the plan. This involves collecting data on juvenile stand attributes for input to an approved growth and yield model forecasting mean annual increment of merchantable timber volume at rotation age.
The adoption of a reforestation standard linking regeneration performance with timber production objectives provided impetus to an already growing interest in quantifying the effects of reforestation practices on stand development. In the year 2000, a consortium of 10 forest management agreement holders in western Alberta identified the effects of planting, vegetation management, and pre-commercial thinning on the development of lodgepole pine stands following harvesting as being the highest priorities for cooperative growth and yield research. This led to the establishment of the Regenerated Lodgepole Pine (RLP) field trial to investigate and monitor these effects under experimentally controlled conditions [7].
Until two decades ago, Alberta field experiments into the responses of lodgepole pine to silvicultural treatments were mainly confined to fire-origin stands [8]. However, unsurprisingly, given the species’ wide distribution and planting as an exotic, worldwide knowledge about its growth and yield in plantations and naturally regenerated stands is considerable. The implications of the species’ botanical characteristics for management have been well-studied and widely recognized for some time [9]. Such characteristics include a serotinous cone habit, precocious and prolific seed production, high seed viability and germinative energy, frost-hardiness, an ability to survive a wide variety site and soil conditions, and rapid juvenile growth, all of which contribute to aggressive regeneration following disturbance [10]. Resulting stand densities are often so high that height and diameter growth is reduced, thereby limiting the production of merchantable timber [11,12]. Immature lodgepole pine in Alberta, as elsewhere, is subject to a wide range of pests and diseases, such as root collar weevils [13], gall rusts [14], and Armillaria [15].
Lodgepole pine’s regenerative propensity often gives reforestation managers a choice between planting and natural regeneration. The planting of the species is commonplace in Alberta as a means of ensuring reforestation objectives are met as quickly as possible. Little formal research into planting efficacy and espacement has previously been undertaken in the province. However, in British Columbia results of at least two espacement studies have been published [16,17].
The management of competing vegetation, primarily using herbicides, is an integral part of modern forestry practice in many parts of the world [18]. Glyphosate herbicide is widely used in Alberta during coniferous reforestation to control competition from hardwood tree species (trembling aspen and balsam poplar) and aggressive grass species [19].
Most pre-commercial thinning of lodgepole pine in western Canada has been conducted in dense height-repressed stands of fire-origin. In Alberta, Stewart and Savail [20] reported the latest results of four juvenile spacing and pre-commercial thinning trials established between 1954 and 1984 in fire-origin stands aged 7 to 28 years. Long-term pre-commercial thinning trials of lodgepole pine in second-growth stands were undertaken and evaluated in British Columbia [21,22].
Sweden established its first lodgepole pine plantations in the 1920s. By the 1980s, it had a stand management program aimed at growing the species on short rotations (45 to 60 years), with little or no thinning [23]. Reductions in both thinning intensity and rotation lengths have more recently been advocated in Sweden as adaptations to increased risks associated with climate change [24].
The following paper summarizes analyses of the latest data collected 17 to 20 years after the establishment of the Alberta RLP trial. The objective was to evaluate, in lodgepole pine stands established after clear-cut harvesting, the effects of reforestation treatments on subsequent stand development. The selected reforestation treatments were:
  • Planting (planting density, and planting versus natural regeneration);
  • Early vegetation management (“weeding”) to control hardwood, shrub, and herbaceous competition;
  • Pre-commercial thinning to remove the natural regeneration of trees surplus to the designated planting density.
The effects of these treatments were tested on juvenile stand conditions at the end of the regeneration phase of stand development, and on growth and yield projected to rotation age. The influence of uncontrolled site and stand variables on treatment responses was also investigated to the extent permitted by the experimental design. The null hypotheses tested were that the treatments had no effect on stand development and, where such hypotheses were proved false, that the responses were not influenced by other site and stand variables.

2. Materials and Methods

The Alberta Regenerated Lodgepole Pine (RLP) trial consists of 102 installations planted with regular lodgepole pine nursery stock at six different target densities: 0, 816 (3.5 m), 1111 (3.0 m), 1600 (2.5 m), 2500 (2.0 m), and 4444 (1.5 m) trees ha−1. Equivalent espacements are shown in brackets. The target densities were selected to embrace the full range of planting densities applied operationally in regional reforestation practice. Seven of the installations were excluded from analyses because of treatment violations (mostly unintended aerial herbicide application). The study area consists of 10 forest management agreement areas, with the number of installations allocated to each approximately proportional to pine-leading productive forest area. All installations were located in the Upper and Lower Foothills natural sub-regions, between latitudes 51.5 and 54.7° N and between elevations 840 and 1620 m above sea level. Figure 1 illustrates the geographic distribution of the installations.
Each installation was split two ways to create 4 treatment plots: control (C), weed (W), thin (T), and weed-plus-thin (WT). A measurement plot (0.1 ha), 16 regeneration/sapling sub-plots (each 10 m2), and 4 sub-plots for assessing top height (each 100 m2), were placed in each 0.25 ha treatment plot (see Figure 2).
The vegetation management treatment (“weeding”) usually involved the backpack chemical spraying of glyphosate on competitive sites, at application rates of between 4.5 and 6.0 L ha−1, averaging 5.5 L ha−1. The W and WT plots were weeded during the first 8 years after cut, as required to keep vegetative competition below threshold levels. Thresholds were defined as 1000 stems ha−1 for hardwood tree species and a level of 80% of the Comeau Competition Index for shrubs, forbs, and grasses. (The latter index is defined as the sum of the products of percentage of cover and height of competitor species, divided by crop height [25]). Weeding was not required where competition was below threshold levels. Some plots, on marginally competitive sites with only light or patchy herbaceous vegetation cover and hardwood densities of about 1000 stems ha−1 or less, were weeded manually with hand tools. As a result of this strategy, W and WT plots on 50 of the 95 installations analyzed were chemically treated, and the remaining W and WT plots were weeded manually (16 installations) or not at all (29 installations).
The T and WT plots were thinned at stand ages between 11 and 15 years (average 13 years), when crowns were approaching closure and the average tree height was 3 to 5 m. Where the ingress of natural regeneration resulted in the target density being exceeded, planted installations were thinned to their target planting densities. In non-planted installations the target post-thinning density was set at 4444 trees ha−1. Hardwoods and shrubs over 30 cm in height were also cut down. Retained trees were, to the extent possible, well-spaced, healthy, co-dominant, or dominant lodgepole pine with good form and vigour and no serious disease or damage.
During the first 14 years of the trial, detailed tree measurements were mostly restricted to sub-samples of planted trees. In 2015, an expanded protocol was introduced, involving the detailed measurement of all live trees ≥1.3 m in height occurring in the 16 sub-plots and of all planted trees throughout the measurement plot. Top height was assessed on circular sub-plots as per the RSA protocol [6]. The last complete set of measurements for all installations was acquired during 2017 and 2018, 17 growing seasons following planting and (on average) 18 years after harvest. Measurements for a further two years were acquired from a sub-set of plots, with emphasis on those occurring in stands with persistently high levels of aspen competition.
All installations were classified according to the Alberta’s ecological classification system. The classification procedure followed was as described in comprehensive field guides for the ecosites of west-central and southwestern Alberta [26,27]. It involved initial site reconnaissance before the placement of each installation, followed by determination of plant species composition and abundance and important soil properties. The latter, facilitated by digging shallow soil pits, included soil texture, drainage, and depth of the organic surface layer (containing litter, fungi and humus). By reference to the guides, the resulting information, together with geographic location, topographic position, slope, and aspect, was used to identify the natural sub-region, ecosite (ecological units developed under similar environmental condition), soil moisture regime, and soil nutrient regime.
The analyses described below included assessments of stand conditions at the last full measurement (17 growing seasons after planting of the trial) and rates of change (periodic annual increment) during the transition from the regeneration to growth phases of stand development, between growing seasons 15 and 19. The end of the regeneration phase was recognized in this study as the point in time by which the total density of planted and naturally regenerated pine has culminated and is beginning to decline as a result of mortality offsetting ingress. This transitionary stage of the rotation was considered the most relevant for predicting subsequent stand development, because conventional growth and yield models approved for use in Alberta simulate stand dynamics only after density has culminated [28,29,30].
Variables investigated and reported in Section 3 below are, except where otherwise stated, confined to lodgepole pine. Emphasis was placed on those attributes recognized by the RSA system of yield projection, namely:
  • Age: average total age, in years since germination, of the 100 largest-diameter trees ha−1;
  • Top height: average height of the 100 largest-diameter trees ha−1;
  • % stocking: percentage of 10 m2 regeneration sub-plots occupied by at least one live tree ≥1.3 m in height;
  • Density: number of live trees ha−1 ≥1.3 m in height;
  • Basal area: total basal area ha−1 of live trees, measured at 1.3 m above ground level.
The following related attributes linked to tree and stand development were also investigated:
  • Average height: average total height of all trees ≥1.3 m in height;
  • Live crown ratio (LCR): average ratio of crown length to total height;
  • Quadratic mean diameter breast-height (DBH): measured 1.3 m above ground level.
The Alberta Growth and Yield Projection System (GYPSY) was used to project future growth and yield. GYPSY [30] is a stand-level model developed and approved by the Government of Alberta to support timber supply analysis and forest management planning, and to provide a link between post-harvest regeneration performance and future growth and yield. It utilizes a series of sub-models for top height, percent stocking, density (spatial and non-spatial), basal area increment (spatial and non-spatial), and total and merchantable volume. Data from fire-origin and managed stands, used in its development and testing, covered a wide range of stand densities. The model does not explicitly forecast responses to management treatments. The following variables were predicted for each treatment plot in the RLP trial from age, top height, % stocking, density, and basal area, measured 17 growing seasons after planting:
  • Site index: top height at 50 years’ breast-height age;
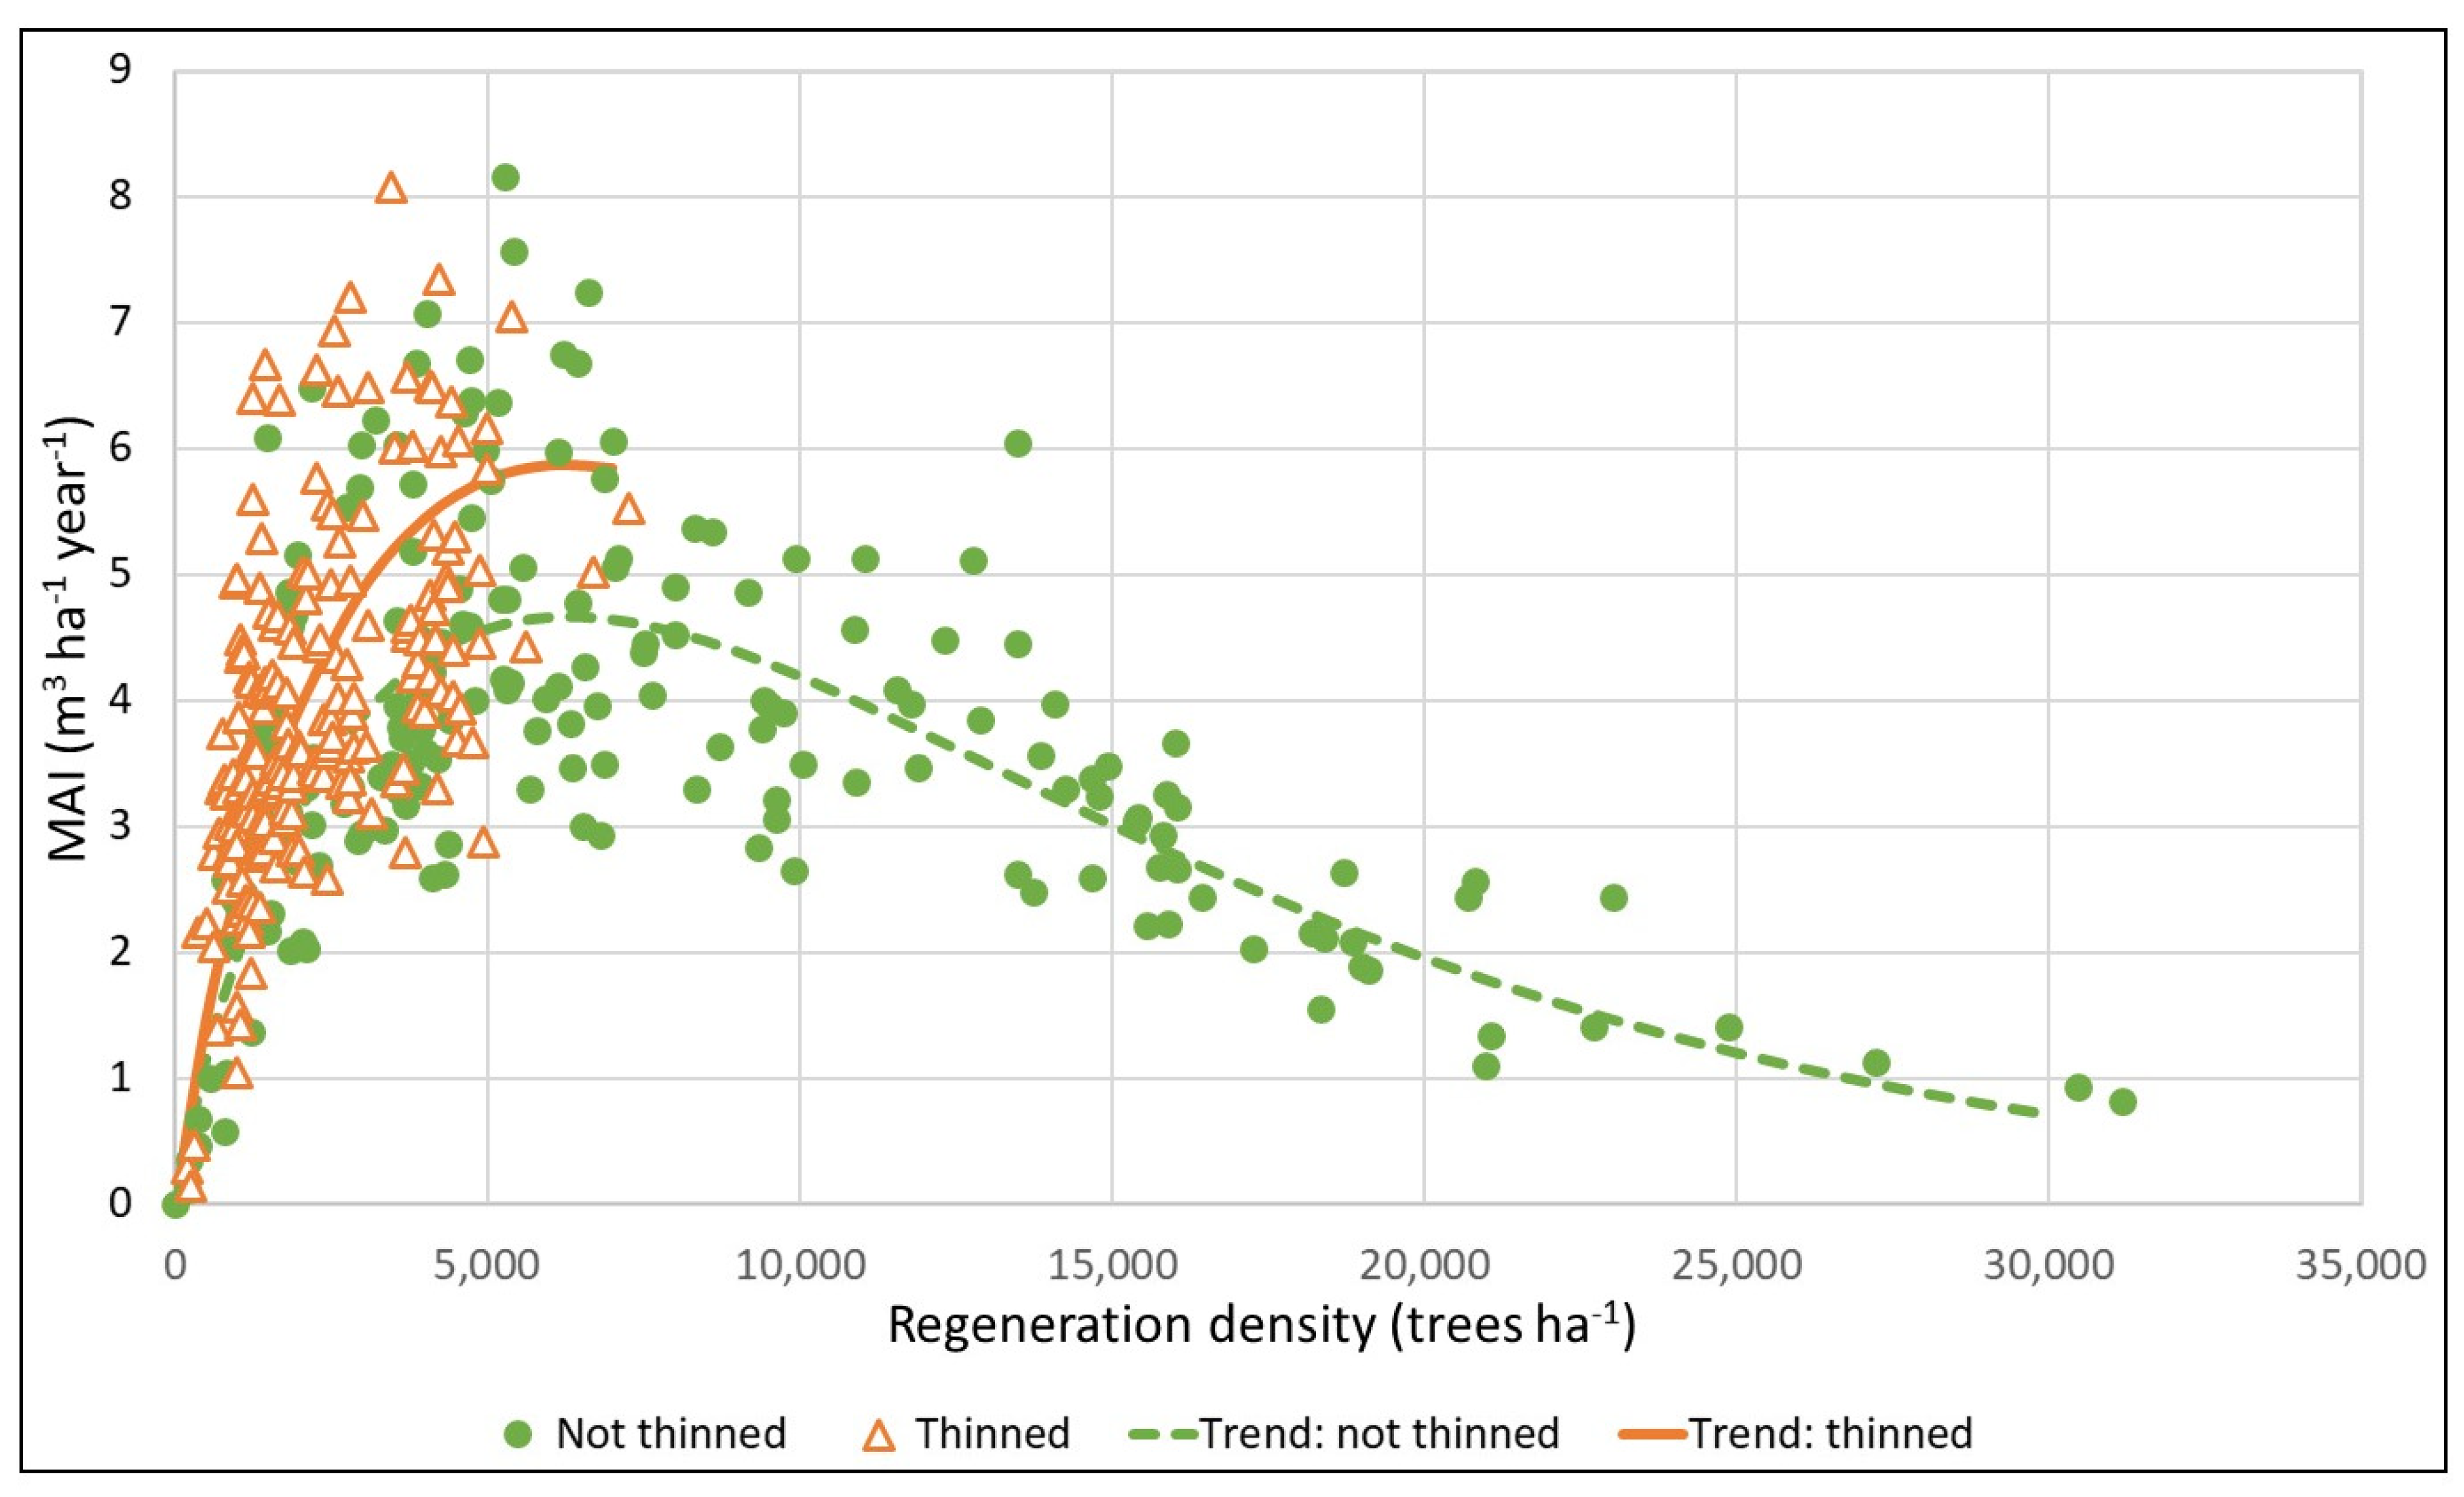
  • MAI: maximum gross merchantable mean annual volume increment;
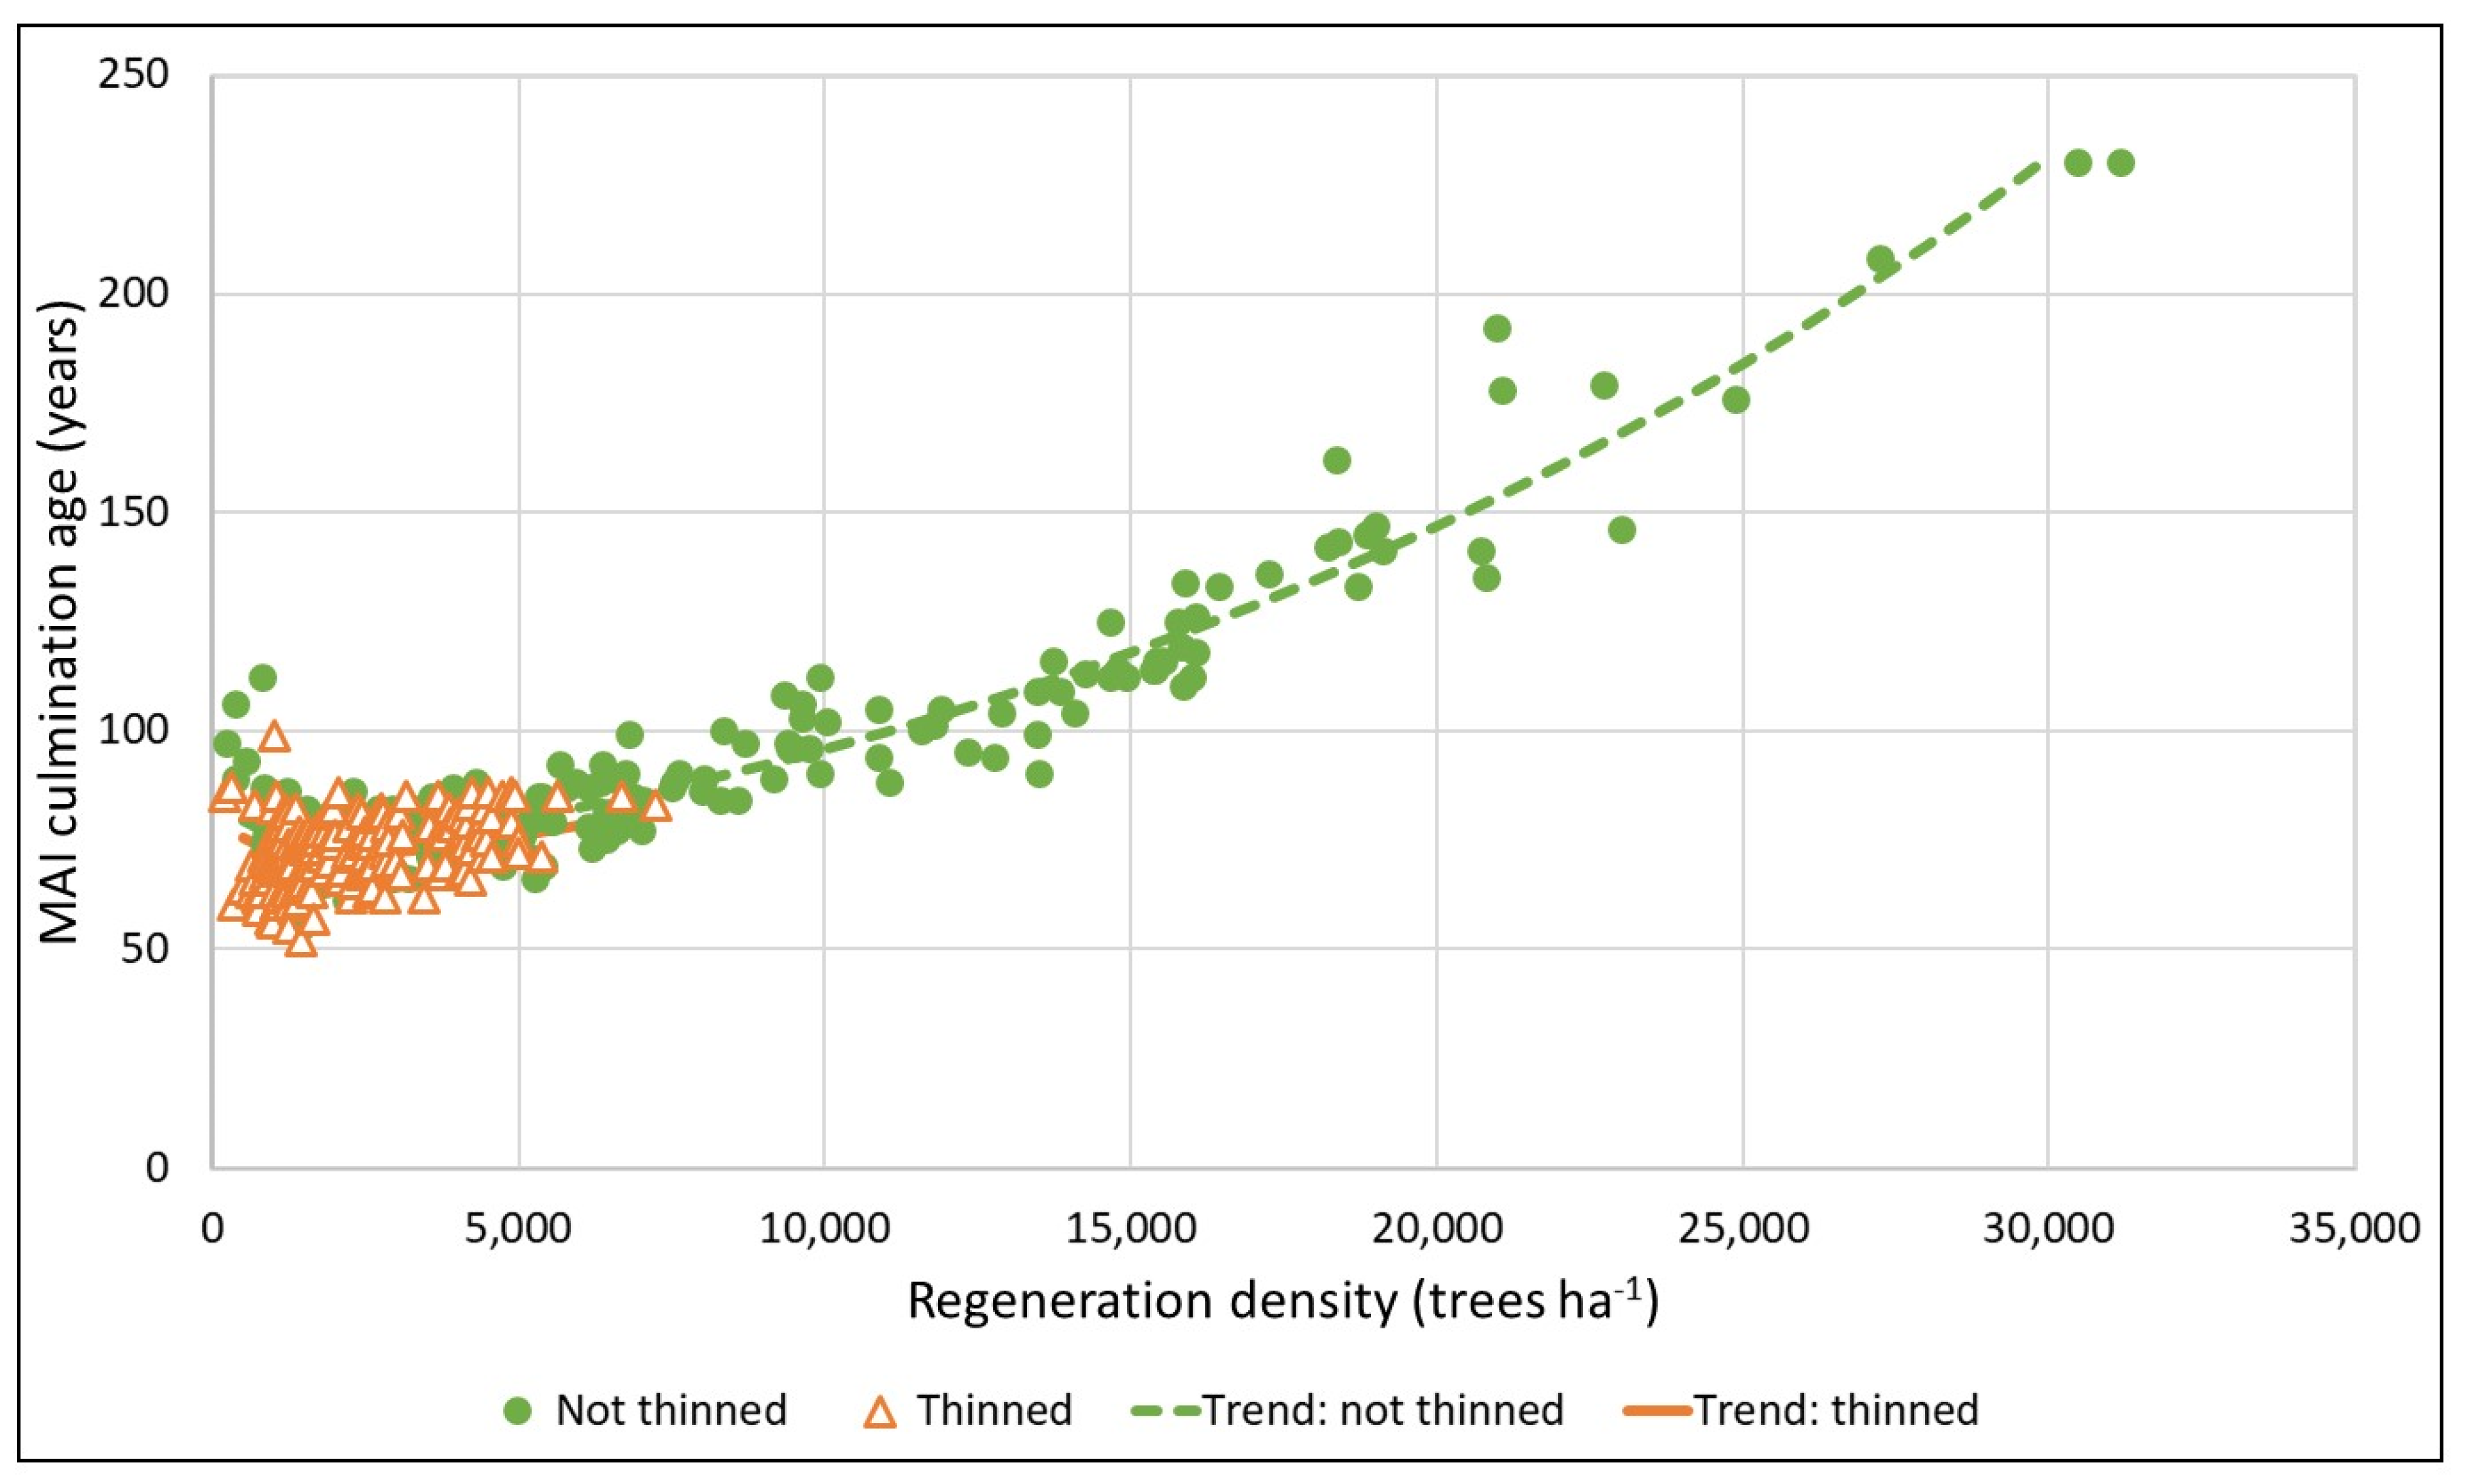
  • Culmination age: years after harvest at which merchantable MAI culminates (this is equated with rotation age in RSA yield projection system).
Merchantable MAI was computed at the following minimum utilization limits, currently prevalent in Alberta: 15 cm stump diameter over-bark, 10 cm top diameter inside-bark, 0.3 m stump height, and 3.66 m minimum merchantable length. No deductions were made for defect, decay, or breakage.
Treatment effects were analyzed with a mixed-effects analysis of variance (ANOVA) model. The REML (restricted maximum likelihood) method was used for model fitting; and the Tukey–Kramer HSD method was applied to test for differences among mean responses to categorical treatment and site variables [31]. The RLP trial has a two-layered split-plot design. (In split-plot terminology, the installations are considered as “whole-plots” and the treatment plots as “sub-plots”.) The effects of planting density were tested with respect to variation between installations, while weeding and pre-commercial thinning were tested against variation within installations. The weeding and thinning effect tests used the residual error for the denominator of their F-statistics, whereas the F-statistics for the planting effect were tested against the nested effect of installations within planting density. The installation effect was declared as random, while planting, weeding and thinning were all fixed effects. Planting and thinning treatments were not independent of each other because planted plots were thinned to the target planting density. This option was selected in the original experimental design and layout because a full factorial design (i.e., with each planting density replicated against each post-thinning density) was not practically achievable. In order to improve the distinction of planting and thinning effects, analyses of variance were conducted with and without splitting the data into thinned and non-thinned sub-sets.
Site and stand variables not controlled by the experimental design were introduced into the analyses as covariates. These included natural sub-region, soil nutrient and moisture classes, type of site preparation, elevation, latitude, slope, and cone density (lodgepole pinecones per m2 on the ground at time of trial establishment).

3. Results

3.1. Stand Conditions 17 Growing Seasons after Planting

Table 1 summarizes the means and standard deviations by treatment (planting density, weeding, and thinning) of lodgepole pine stand variables measured 17 growing seasons after the planting of the trial. A total of 95 installations and 380 treatment plots were used in the analysis. Each mean and standard deviation shown in Table 1 is based on 16 treatment plots for planting densities 816 to 4444 and on 15 treatment plots for the “0” planting density.
Table 2 shows the significance probabilities (Prob > F) of the F-tests for the main treatment effects and their interactions. The response variables tested were non-transformed, except for density, where a logarithmic transformation reduced skewness and kurtosis and improved the distributions of residuals. The second-order interaction (Plant × Thin × Weed) was not significant for any response variable. The only first-order interaction to show high levels of statistical significance was Plant × Thin. Average height, LCR, DBH, percent stocking, stand density, and basal area all showed significant interactions between planting and thinning. This result was consistent with the planting and thinning treatments not being independent of each other, as explained in Section 2. Tests for age were confined to natural regeneration in the 15 non-planted installations, which contained a total of 60 treatment plots.
The percent of stocking and basal area ha−1 showed a significant positive trend with planting density in both thinned and non-thinned plots. The effects of planting density on other attributes tended to be complicated and masked by generally high and variable amounts of natural regeneration. Although planting density is shown as affecting stand density in Table 2, the trend was not statistically significant in non-thinned plots, suggesting the effect may have resulted from thinning back to the target planting density, rather than from the original planting density itself. DBH declined significantly with planting density in thinned plots, but again there was no significant overall trend with planting density in non-thinned plots. However, when planted stock and natural regeneration were analyzed separately, both demonstrated statistically significant inverse trends between mean DBH and planting density, in thinned and non-thinned plots, suggesting that both planting density and thinning affected DBH. Planting effects on top height, average height, and live crown ratio (LCR) were non-significant, although the test value for LCR in Table 2 indicates marginal significance.
Vegetation management (“weeding”) significantly increased top height, average height, LCR, DBH, percent stocking, density, and basal area. It also increased the average age (i.e., reduced the regeneration delay) of ingress occurring in non-planted installations. Responses to the treatment were related to aspen and balsam poplar competition. (Hereon, “aspen” refers to combined aspen and balsam poplar.) No significant effect of aspen was found in installations where its densities were less than 1000 stems ha−1 in the control plots. In installations where untreated aspen densities were higher, average basal area of pine was substantially larger in non-thinned weeded plots (18.0 m2 ha−1) than in non-thinned plots that were not weeded (7.7 m2 ha−1). A significant inverse relationship (R-square = 0.70, see Equation (1)) was found between pine basal area ha−1 (Y) and aspen density (X) in the 29 control plots that had aspen densities exceeding 1000 stems ha−1.
Y = 59.902 − 6.172 (Ln X)
Pine basal area tended to zero at aspen densities of about 15,000 trees ha−1. On installations where chemical treatment had been considered unnecessary, aspen densities were not significantly different between the control (C) and weeded (W) plots, averaging 844 stems ha−1 across both plots where treatment was manual and 148 stems ha−1 where no treatment was undertaken. In installations where chemical weeding was undertaken, the difference in average aspen densities between control and weeded plots (3591 versus 76 stems ha−1) was high in magnitude and statistical significance.
Pine DBH, average height, and LCR were significantly increased by thinning and inversely related to post-thinning density. The thinning treatment reduced both density and basal area. The extent to which this effect may be compensated by increased tree growth is discussed below. Although thinning did not have a significant effect on top height, a statistically significant inverse trend (R-square = 0.14, see Equation (2)) was noted between top height (Y) and pine regeneration density (X) in the 51 non-thinned plots with more than 10,000 trees ha−1 17 growing seasons after planting of the trial.
Y = 783.88 − 0.0077 X

3.2. Stand Dynamics 17 to 19 Growing Seasons after Planting

The last two complete remeasurements of the trial allowed the examination of periodic annual increments over the two-year period between 15 and 17 growing seasons after planting of the trial. This was particularly important for interpreting responses to thinning, in order to avoid confusing the immediate direct effects of the thinning operation from longer term growth effects. No effects of planting were demonstrated. Annual increments are shown averaged by weeding and thinning treatment combinations across all planting densities in Table 3.
Increases in increments shown in Table 3 by weeding for top height, average height, DBH, and basal area ha−1 were all statistically significant, with and without taking age into account, and even though the short interval between measurements resulted in standard deviations being high. While thinning increased DBH increment significantly and substantially, increases shown for top height and average height in Table 3 were small and not statistically significant. Basal area increment remained significantly lower in thinned versus non-thinned plots, indicating that the increase in diameter growth was not yet sufficient to offset the treatment’s reduction of basal area. The rate of LCR decline in thinned plots was half that in the non-thinned. The observed changes in stand density indicate that in non-thinned plots mortality exceeded any continued ingress, while in thinned plots mortality and ingress were approximately balanced.
Significant changes were also noted in aspen over the same two-year period. Aspen densities were observed to be increasing in thinned (T) plots, rather than decreasing as in the control (C) plots. Average rates of change in aspen density were also computed from a sub-set of plots where measurements were taken over a further two years (17 to 19 growing seasons after planting of the trial). Density decreased in the untreated control (C) plots (on average by 274 stems ha−1 year−1), as might be expected from natural self-thinning. In the thinned but non-weeded (T) plots, however, aspen densities significantly increased over the same period, on average by 471 stems ha−1 year−1.

3.3. Impact of Uncontrolled Site and Stand Variables

The effects of experimental treatments, observed 17 growing seasons after the planting of the trial, were influenced and complicated by uncontrolled site and stand factors. Table 4 indicates results of effect tests for covariates, highlighting those that were found to be significant when added to the ANOVA model used to test treatment effects.
Both top height and average height increased with soil nutrient quality (i.e., from poor to rich soil nutrient class) and declined with elevation. They were reduced by drag scarification and high cone densities at establishment. Live crown ratios (LCR) were highest on poor soils and increased with elevation and organic soil depth (LFH). DBH increased with soil nutrient quality and was highest on mounded sites. Density and percent stocking were highest on soils of medium nutrient status and on drag-scarified sites. They increased with elevation and decreased with latitude and depth of organic soil. Basal area showed no average difference between medium and rich soil nutrient classes or between mesic and dry moisture classes, but it was significantly lower on moist soils and soils of poor nutrient status.

3.4. Projected Growth and Yield

Table 5 summarizes means and standard deviations by treatment (planting density, weeding and thinning) for pine site index, maximum merchantable mean annual volume increment (MAI), and age of MAI culmination, as projected by GYPSY from measurements taken 17 growing seasons after harvest. Table 6 shows significance probabilities (Prob > F) of the F-tests for the treatment effects and their interactions. Projected MAI increased with planting density. The weeding increased site index slightly and MAI more substantially. Pre-commercial thinning markedly reduced pine MAI culmination age. A strong relationship, as shown in Figure 3, was observed between the age of MAI culmination age and regeneration density (the total number of planted and naturally regenerated lodgepole pine trees ha−1 17 growing seasons after planting of the trial and 4 to 6 years after thinning). Trends of projected MAI with thinning and regeneration density were more variable. MAI at culmination age tended to increase up to densities between 6000 and 7000 trees ha−1 in both thinned and non-thinned plots and thereafter declined in non-thinned plots (see Figure 4).

4. Discussion

On the most commonly occurring lodgepole pine site types (soils of medium nutrient and mesic moisture status), densities from natural regeneration typically exceeded those achievable by planting, suggesting that planting may not be necessary to restock such sites with pine. However, the stocking of natural regeneration was highly variable. Planting improved the percentage of stocking. It appears to be effective in filling gaps that would otherwise occur in natural regeneration and reducing the risk of reforestation failure. On some sites planting may be essential to achieve satisfactory stocking, particularly those with either poor soil nutrient and moisture conditions or with rich soils where the favourable nutrient status leads to high levels of inter-specific competition. On both rich and poor nutrient regimes, reliance on natural regeneration can result in the percentage of stocking levels of pine falling below 80% (typically regarded in Alberta as the minimum requirement for satisfactory establishment). Increasing planting densities in the RLP trial increased basal area ha−1 but reduced average DBH by the end of the regeneration phase and increased projected mean annual merchantable volume increment at culmination age (MAI).
Responses to planting density observed in the RLP trial concur with those observed for lodgepole pine elsewhere in Canada and in Sweden. In British Columbia, Johnstone and van Thienen [16] reported that, 20 years after planting, wider spacing increased the size and persistence of tree crowns, affecting associated bole characteristics, including diameter and volume. They noted that the lack of a concomitant effect on height growth, also observed in the RLP trial, resulted in the wider-planted trees being shorter than trees of the same diameter at the closer spacings, and at the wider spacings, despite trees being larger and faster growing, both stand basal area and stand total volume were lower. Harper et al. [17] reported results 34 years after the planting of the effects of high plantation densities (2500 to 160,000 trees ha−1) on the growth and yield of lodgepole pine in British Columbia. They found that diameter growth, mean height, and top height declined with increasing density, but total stand productivity increased with increasing density, with no indication of declining at highest densities. The lack of height response to planting density in the RLP trial may simply reflect maximum target densities, being limited to 4444 trees ha−1. This conclusion is supported by the inverse trend of top height with density observed in non-thinned plots with higher levels of natural regeneration. Liziniewicz et al. [32], investigating 23-year-old plantations in southern Sweden, found that diameter growth and volume production varied significantly between espacements. They noted the highest volume of production was at their study’s narrowest spacing of 1.41 m (5000 trees ha−1), which corresponds closely to the culmination of the RLP trial’s trend of projected mean annual volume increment with regeneration density shown in Figure 4.
Results of herbicide application during the first 8 years following harvest suggest that, although control of hardwoods is often unnecessary on soils with medium to low nutrient status, it can be essential for restocking pine on competitive lower-elevation sites with richer soils and a tendency to prolific aspen regeneration. The treatment was highly effective on such sites in reducing aspen competition, and it improved survival, stocking, and growth of pine.
Early manual weeding was largely confined to plots with marginal levels of vegetative competition, where it had no significant effect on aspen stocking or density by the end of the regeneration phase. Increased aspen suckering was observed following later manual thinning of plots which had not previously been chemically weeded. These results are consistent with those of Lindgren and Sullivan [22], who compared the influence of herbicide and alternative vegetation management treatments on conifer plantations in British Columbia and showed that manual vegetative management methods were not effective in providing sustained control of hardwoods.
The results of pre-commercial thinning were generally consistent with those of earlier trials conducted in western Canada [12,20,21,33,34,35], even though most of the latter were conducted in fire-origin stands. Thinning in the RLP trial dramatically increased DBH growth within 4 to 6 years, but so far has shown a less clear and generally non-significant effect on height growth. Thinning increased LCR, reducing the rate at which crowns lift over time. This may contribute to greater growth of individual trees and result in stands having more potential to respond to later commercial thinning; however, as pointed out in other studies [21], this may have negative implications for wood quality.
Figure 3 supports the widely held view that pre-commercial thinning has the potential to shorten rotations by providing more space for faster crown development and growth of retained trees. Growth and yield projections of the RLP trial data to the age of MAI culmination are consistent with conclusions drawn by Johnstone [34] and others that juvenile spacing and pre-commercial thinning can significantly enhance the merchantable yields of excessively dense stands. Figure 4 suggests that thinning may increase merchantable MAI of pine in stands that would otherwise have more than 6000 to 7000 trees ha−1 at the end of the regeneration phase. However, the risks of growth and site occupancy losses are likely to increase as post-thinning densities are reduced. The susceptibility of immature lodgepole pine to damage by insects and diseases has previously created concerns over pre-commercial thinning in west-central Alberta [36]. The trend lines in Figure 4 indicate that thinning to below about 2500 trees ha−1 results in less MAI than would be expected in non-thinned stands where MAI culminates at regeneration densities of 6000 to 7000 trees ha−1. The culmination of projected MAI at relatively high regeneration densities suggests that Swedish strategies for little or light thinning of lodgepole pine [23,24,37] are relevant in Alberta, especially if risks associated with climate change are taken into account.
The measurements of the RLP trial have been completed for the entire regeneration phase of stand development. Results have provided insights, under controlled experimental conditions, into how pine regeneration develops in response to reforestation treatments. However, the prediction of the long-term effects of these treatments currently relies on growth models like GYPSY, which are not based on controlled data definitively representing the different reforestation treatments. Ongoing monitoring is planned by FGrOW to verify, defend, and improve predictions over time.

5. Conclusions

  • Planting is not always necessary to re-establish lodgepole pine in the Alberta foothills, and planted trees are often outnumbered by natural regeneration. However, it reduces the risk of regeneration failure and is essential to restocking pine on some sites. Timber production is expected to increase with planting density, even where natural regeneration is adequate to meet regulated reforestation standards.
  • Herbicide application improves the stocking and growth of lodgepole pine where there is competing hardwood or herbaceous vegetation. It facilitates the regeneration of the species, which would otherwise be difficult or impossible, on sites where such competition is severe. Manual weeding and thinning of aspen are less likely to be effective.
  • Pre-commercial thinning is expected to shorten lodgepole pine rotations and, when applied to dense stands where excessive natural regeneration has occurred, increase future merchantable timber yields based on current utilization standards. Risks and uncertainties, likely to be exacerbated by climate change, increase with thinning weight.
  • Treatment responses vary greatly depending on environmental site factors. Planting, vegetation management, or thinning will each be necessary and justified in some situations but, depending on site conditions and management objectives, redundant or counterproductive in others.

Funding

This research was funded by the Forest Growth Organization of Western Canada (FGrOW), grant number 234.1.1. FGrOW received financial support for this purpose from the following organizations: ANC Timber; Canadian Forest Products; Forest Resource Improvement Association of Alberta (FRIAA); Millar Western Forest Products; Spray Lake Sawmills; West Fraser (Blue Ridge Lumber, Edson and Hinton Woodlands, Sundre Forest Products); and Weyerhaeuser (Grande Prairie and Pembina Timberlands). The APC (article processing charge) was also funded by FGrOW.

Data Availability Statement

Data from this study may be made available via application to the Forest Growth Organization of Western Canada. Any request for data should include a detailed explanation of the purpose of the request and plans for use of the data.

Acknowledgments

This study is the result of long-term commitment, financial support, and technical inputs by the following organizations: Alberta Agriculture, Forestry, and Rural Economic Development; ANC Timber; Canadian Forest Products; Forest Resource Improvement Association of Alberta (FRIAA); fRI Research; Millar Western Forest Products; Spray Lake Sawmills; West Fraser (Blue Ridge Lumber, Edson and Hinton Woodlands, Sundre Forest Products); and Weyerhaeuser (Grande Prairie and Pembina Timberlands). Numerous people, too many to acknowledge individually, contributed to the study, but special thanks are due to Sharon Meredith, who directed the collection of the data on which this article is based, and Julie Duval, who provided GIS and database management support.

Conflicts of Interest

The author declares no conflict of interest.

References

  1. Rowe, J.S. Forest Regions of Canada; Publication No. 1300; Dept. of Fisheries and the Environment, Canadian Forestry Service: Ottawa, ON, Canada, 1972; p. 172.
  2. Andison, D.W. Patterns of age-class distributions on foothills landscapes in Alberta. Ecography 1998, 21, 543–550. [Google Scholar] [CrossRef]
  3. Johnstone, W.D. Ingress of Lodgepole Pine and White Spruce Regeneration Following Logging and Scarification in West-Central Alberta; Information Rep. NOR-X-170; Environment Canada, Canadian Forest Service, Northern Forestry Research Centre: Edmonton, AB, Canada, 1976; p. 12.
  4. Landhäusser, S.M. Impact of slash removal, drag scarification and mounding on lodgepole pine cone distribution and seedling regeneration after cut-to-length harvesting on high elevation sites. Forest. Ecol. Manag. 2009, 258, 43–49. [Google Scholar] [CrossRef]
  5. Huang, S.; Monserud, R.A.; Braun, T.; Lougheed, H.; Bakowsky, O. Comparing site productivity of mature fire-origin and post-harvest juvenile lodgepole pine stands in Alberta. Can. J. For. Res. 2004, 34, 1181–1191. [Google Scholar] [CrossRef]
  6. Alberta Agriculture and Forestry. Reforestation Standard of Alberta; Department of Agriculture and Forestry, Forestry Division, Forest Stewardship and Trade Branch: Edmonton, AB, Canada, 2021; p. 361.
  7. Dempster, W.R.; Meredith, S. A discussion of best management practices for reforestation following harvesting of lodgepole pine in the Alberta Foothills. For. Chron. 2014, 90, 763–770. [Google Scholar] [CrossRef]
  8. Stewart, J.D.; Jones, T.N.; Noble, R.C. Long-Term Lodgepole Pine Silviculture Trials in Alberta: History and Current Results; Natural Resources Canada, Canadian Forest Service, Northern Forestry Centre: Edmonton, AB, Canada, 2006; p. 184.
  9. Wheeler, N.C.; Critchfield, W.B. The distribution and botanical characteristics of lodgepole pine: Biogeographical and management implications. In Lodgepole Pine: The Species and Its Management; Symposium Proceedings; Baumgartner, D.M., Krebill, R.G., Arnott, J.T., Weetman, G.F., Eds.; Washington State Univ.: Pullman, WA, USA, 1985; pp. 1–13. [Google Scholar]
  10. Lotan, J.; Brown, J.; Neuenschwander, L. Role of fire in lodgepole pine forests. In Lodgepole Pine: The Species and Its Management; Symposium Proceedings; Baumgartner, D.M., Krebill, R.G., Arnott, J.T., Weetman, G.F., Eds.; Washington State Univ.: Pullman, WA, USA, 1985; pp. 133–152. [Google Scholar]
  11. Goudie, J.W. The Effects of Density on the Growth and Development of Repressed Lodgepole Pine and Suppressed Inland Douglas Fir; final contract report on Project EP 850.02; BC Ministry of Forests, Res. Br.: Victoria, BC, Canada, 1980.
  12. Farnden, C.; Herring, L. Severely repressed lodgepole pine responds to thinning and fertilization: 19-year results. For. Chron. 2002, 78, 404–414. [Google Scholar] [CrossRef] [Green Version]
  13. Cerezke, H.F. Survival of the weevil Hylobius warreni in lodgepole pine stumps. Can. J. For. Res. 1973, 3, 367–372. [Google Scholar] [CrossRef]
  14. Wolken, J.M.; Blenis, P.V.; Duncan, I. Predicting survival of lodgepole pine stands infected with western gall rust. Can. J. For. Res. 2006, 36, 878–885. [Google Scholar] [CrossRef]
  15. Dempster, W.R. Impact of climate on juvenile mortality and Armillaria root disease in lodgepole pine. For. Chron. 2017, 93, 148–160. [Google Scholar] [CrossRef] [Green Version]
  16. Johnstone, W.D.; van Thienen, F.J. The Effects of Plantation Density on the Growth and Yield of Lodgepole Pine: 20-Year Results; Extension Note 102; B.C. Ministry of Forests and Range, Forest Science Program: Victoria, BC, Canada, 2011; p. 7. [Google Scholar]
  17. Harper, G.J.; Astridge, K.; de Montigny, L. Effects of High Plantation Densities on the Growth and Yield of Lodgepole Pine: 34-Year Results at Barnes Creek (ep770.55); Prov. B.C. Technical Report 115; B.C. Ministry of Forests and Range, Forest Science Program: Victoria, BC, Canada, 2018; p. 45. Available online: www.for.gov.bc.ca/hfd/pubs/Docs/Tr/Tr115.htm (accessed on 21 February 2022).
  18. Wagner, R.G.; Little, K.M.; Richardson, B.; McNabb, K. The role of vegetation management for enhancing productivity of the world’s forests. Forestry 2006, 79, 57–79. [Google Scholar] [CrossRef]
  19. Comeau, P.G.; Fraser, E.C. Plant community diversity and tree growth following single and repeated glyphosate herbicide applications to a white spruce plantation. Forests 2018, 9, 107. [Google Scholar] [CrossRef] [Green Version]
  20. Stewart, J.D.; Salvail, J.C. Evaluation of Precommercial Thinning of Lodgepole Pine from Long-Term Research Installations in Alberta; Canadian Wood Fibre Centre Information Report FI-X-16; Canadian Forest Service, Northern Forestry Centre: Edmonton, AB, Canada, 2017; p. 62.
  21. Johnstone, W.D. The effects of juvenile spacing on 7-year-old lodgepole pine in central British Columbia. West. J. Appl. For. 2005, 20, 160–166. [Google Scholar] [CrossRef]
  22. Lindgren, P.M.F.; Sullivan, T.P. Long-term responses of tree and stand growth of young lodgepole pine to pre-commercial thinning and repeated fertilization. Forest Ecol. Manag. 2013, 307, 155–164. [Google Scholar] [CrossRef]
  23. Hagner, S.O.A. Lodgepole pine management in Sweden: A strategy for higher yield. In Lodgepole Pine: The Species and Its Management; Symposium Proceedings; Baumgartner, D.M., Krebill, R.G., Arnott, J.T., Weetman, G.F., Eds.; Washington State Univ.: Pullman, WA, USA, 1985; pp. 211–217. [Google Scholar]
  24. Subramanian, N.; Bergh, J.; Johansson, U.; Nilsson, U.; Sallnäs, O. Adaptation of forest management regimes in southern Sweden to increased risks associated with climate change. Forests 2016, 7, 8. [Google Scholar] [CrossRef] [Green Version]
  25. Comeau, P.G.; Braumandl, T.F.; Chang-Yi, X. Effects of overtopping vegetation on light availability and growth of Engelmann spruce (Picea engelmannii) seedlings. Can. J. For. Res. 1993, 23, 2044–2048. [Google Scholar] [CrossRef]
  26. Archibald, J.H.; Klappstein, G.D.; Corns, I.G. Field Guide to Ecosites of Southwestern Alberta; Special Report 8; Canadian Forest Service, Northwest Region, Northern Forestry Centre: Edmonton, AB, Canada, 1996; p. 492.
  27. Beckingham, J.D.; Corns, I.G.; Archibald, J.H. Field Guide to Ecosites of West-Central Alberta; Special Report 9; Canadian Forest Service, Northwest Region, Northern Forestry Centre: Edmonton, AB, Canada, 1996; p. 540.
  28. Bokalo, M.; Stadt, K.J.; Comeau, P.G.; Titus, S.J. The validation of the Mixedwood Growth Model (MGM) for use in forest management decision making. Forests 2013, 4, 1–27. [Google Scholar] [CrossRef]
  29. Dempster, W.R.; Gulyas, G. Foothills Reforestation Interactive Planning System, User Guide; Forest Growth Organization of Western Canada: Hinton, AB, Canada, 2021; p. 53. Available online: https://fgrow.friresearch.ca/resource/foothills-reforestation-interactive-planning-system (accessed on 13 April 2022).
  30. Huang, S.; Meng, S.; Yang, Y. A Growth and Yield Projection System (GYPSY) for Natural and Post-Harvest Stands in Alberta; Technical Report Pub. No. T/216; Alberta Sustainable Resource Development: Edmonton, AB, Canada, 2009; p. 22. [Google Scholar]
  31. Anon. JMP Statistics and Graphics Guide; Version 5; SAS Institute Inc.: Cary, NC, USA, 2002; p. 707. [Google Scholar]
  32. Liziniewicz, M.; Eko, M.; Agestum. Effect of spacing on 23-year-old lodgepole pine (Pinus contorta Dougl. var. latifolia) in southern Sweden. Scand. J. For. Res. 2012, 27, 361–371. [Google Scholar] [CrossRef]
  33. Johnstone, W.D.; van Thienen, F.J. The Effects of Precommercial Thinning on the Growth and Yield of Lodgepole Pine, 25-Year Results; Exten. Note 103; B.C. Ministry of Forests and Range, Forest Science Program: Victoria, BC, Canada, 2011; p. 9. [Google Scholar]
  34. Johnstone, W.D. Thinning lodgepole pine. In Lodgepole Pine: The Species and Its Management; Symposium Proceedings; Baumgartner, D.M., Krebill, R.G., Arnott, J.T., Weetman, G.F., Eds.; Washington State Univ.: Pullman, WA, USA, 1985; pp. 253–262. [Google Scholar]
  35. Prescott, C.; de Montigny, L.; Harper, G.J. Eighteen-year growth responses to thinning and fertilization of a height-repressed lodgepole pine stand in interior British Columbia. For. Chron. 2019, 95, 207–221. [Google Scholar] [CrossRef] [Green Version]
  36. Ives, W.G.; Rentz, C.L. Factors Affecting the Survival of Immature Lodgepole Pine in the Foothills of West-Central Alberta; Forestry Canada Information Report NOR-X-330; Northern Forestry Centre: Edmonton, AB, Canada, 1993; p. 49.
  37. Ulvcrona, K.A.; Karlsson, L.; Backlund, I.; Bergsten, U. Comparison of silvicultural regimes of lodgepole pine (Pinus contorta) in Sweden 5 years after precommercial thinning. SilvaFennica 2013, 47, 974. [Google Scholar]
Figure 1. Locations of trial installations. The map shows the number of installations at each location. There are 102 installations in total (17 replications of 6 planting densities).
Forests 13 00929 g001
Figure 2. Arrangement of treatments and sample plots within installations. Installations were planted at one of 6 target densities and split into 4 treatment plots, each of which was sampled by a series of sub-plots.
Forests 13 00929 g002
Figure 3. Trend of projected merchantable MAI culmination age with density of regeneration. Culmination age (Y) is displayed against density of lodgepole pine 17 growing seasons after planting (X). Data points for individual plots are shown relative to trend lines based on the equation: Ln Y = 4.9065 − 0.0937 (Ln X) + 0.00005 (X) + 0.0254 (Thin [No]) → (R-square = 0.7914).
Forests 13 00929 g003
Figure 4. Trend of projected maximum merchantable MAI with density of regeneration. MAI at culmination age (X) is displayed against density of lodgepole pine 17 growing seasons after planting (Y). Data points for individual plots are shown relative to trend lines based on the equation: Ln Y = − 4.9274 + 0.8498 (Ln X) − 0.00014 (X) − 0.1158 (Thin [No]) → (R-square = 0.6041).
Forests 13 00929 g004
Table 1. Stand variables 17 growing seasons after planting: means and standard deviations.
VariableThinningPlanting (Trees ha−1) and Weeding (None, Weed)
08161111160025004444
NoneWeedNoneWeedNoneWeedNoneWeedNoneWeedNoneWeed
Age (years)No thin15.716.318.218.218.218.218.218.218.218.218.218.2
2.71.60.50.50.50.50.50.50.50.50.50.5
Thin15.816.518.218.218.218.218.218.218.218.218.218.2
2.71.90.50.50.50.50.50.50.50.50.50.5
Top ht. (cm)No thin580657684704692727692701686722719724
149146129134128141136132114140119137
Thin559638698714679749667694699724712738
15514998116130123123139109137107133
Avg. ht. (cm)No thin370445430459427479439458425474502519
75123109137108113164161113153114142
Thin409479531581515622525579547573543587
121111124141133135127164122160111145
Live crown ratioNo thin0.640.680.650.670.600.660.620.660.610.640.600.60
0.100.130.130.110.120.130.130.110.120.110.110.11
Thin0.740.750.820.840.760.810.790.790.760.760.680.68
0.060.070.080.080.110.070.100.110.080.090.110.11
DBH (cm)No thin4.165.385.516.165.416.265.335.925.226.056.106.38
0.861.872.352.481.931.782.352.921.502.161.421.68
Thin5.326.349.209.988.7210.368.149.018.078.267.317.73
1.811.252.172.192.441.891.952.541.531.631.121.59
% stockedNo thin75.483.387.984.879.393.090.696.591.496.996.599.2
34.428.117.118.825.19.617.76.419.14.67.63.1
Thin80.481.769.576.280.588.790.691.895.397.398.498.4
29.927.818.411.715.68.611.28.17.74.53.64.3
Density (trees ha−1)No thin785886217954677068787150879789456689766065517194
621376796794580880016045885779155441590844474075
Thin3621351790696211311239167917182221248639903828
18241827302218333243345245550273687444
Basal area (m2 ha−1)No thin10.414.112.312.510.915.911.915.611.916.416.820.0
7.88.28.16.67.76.57.45.17.25.95.96.4
Thin9.711.35.87.67.610.49.111.211.713.617.318.5
6.16.62.63.24.83.24.95.75.25.06.37.0
Means are shown in normal black text, and standard deviations in grey italics.
Table 2. Stand variables 17 growing seasons after planting: significance probabilities (Prob > F values) of treatment effects.
EffectAgeTop HeightAverage HeightLCRDBH% StockedDensityBasal Area
Plantingn/a0.09040.16910.05690.00150.00020.0003<0.0001
Weeding0.0275<0.0001<0.00010.0015<0.00010.00030.0443<0.0001
Thinning0.53110.8801<0.0001<0.0001<0.00010.0666<0.0001<0.0001
Thin × Weed0.91830.49160.20210.06660.72990.34600.45800.1196
Plant × Weedn/a0.04080.25510.11530.26500.20000.73310.5685
Plant × Thinn/a0.74740.0044<0.0001<0.00010.0013<0.00010.0121
Plant × Thin × Weedn/a0.91030.69870.90340.68160.35860.82000.8292
Results of testing the null hypothesis (i.e., that there was no effect of the treatment, or a combination of treatments, on the stand variable) are indicated by the Prob > F statistic. Values of less than 0.05 are considered to indicate a rejection of the hypothesis. Bolded values highlight significant effects and interactions.
Table 3. Periodic annual increments between 15 and 17 growing seasons after planting: means and standard deviations.
VariableNo WeedingWeeding
No ThinThinNo ThinThin
(C)(T)(W)(WT)
Top height (cm)46.546.747.748.8
15.715.318.615.4
Average height (cm)32.233.337.639.9
17.317.620.116.8
Live crown ratio−0.04−0.02−0.04−0.02
0.030.030.030.02
DBH (cm)0.350.520.400.53
0.190.200.190.17
Density (trees ha−1)−10029−1607
579134777131
Basal area (m2 ha−1)1.401.291.661.40
0.870.690.860.71
Means are shown in normal black text, and standard deviations in grey italics.
Table 4. Significance (Prob > F values) and trends of responses to covariates.
Response VariableCategorical CovariatesContinuous Covariates
PrepSNCSMCNSRElevLatLFHCones
Age0.04250.28730.79290.68180.94140.00610.94140.4459
D> M,N
Top height0.0013<0.00010.0060.63980.00830.93340.30840.0413
M> N > DD> C > BM> H
Avg. height<0.0001<0.00010.05980.49360.01290.13090.67610.0045
M> N,DD> C > B
Live crown ratio0.3918<0.00010.05990.08970.00860.14180.00540.8085
B> C,D + +
DBH<0.0001<0.00010.46970.04400.15190.03640.50320.0012
M> D > ND> C > B U> L +
% stocked0.00070.00050.38290.22310.00720.03900.01250.0716
D> M,NC,B> D +
Density<0.0001<0.00010.10160.1008<0.0001<0.00010.0024<0.0001
D> M,NC> B > D ++
Basal area0.2954<0.00010.01260.00030.00160.08730.00240.3135
D,C> BM,X> HU> L+
Prob > F values of less than 0.05 are bolded, indicating a significant effect of the covariate on the response variable. Rankings of mean responses to significant categorical covariates (differences between levels indicated by < or >) and trends (positive or negative) of responses with continuous variables are shown in italics. Prep = mechanical site preparation (Drag, Mound, None), SNC = soil nutrient class (B = poor, C = medium, D = rich), SMC = soil moisture class (X = dry, M = mesic, H = moist), NSR = foothills sub-region (Lower, Upper), Elev = elevation, Lat = latitude, LFH = depth of organic soil (litter, fungus, humus), Slope = percent slope, Cones = ground cone density at establishment.
Table 5. Projected productivity variables: means and standard deviations.
VariableThinningPlanting (Trees ha−1) and Weeding (None, Weed)
08161111160025004444
NoneWeedNoneWeedNoneWeedNoneWeedNoneWeedNoneWeed
Site index (m @ 50 years BH age)No thin20.020.919.720.219.820.419.920.019.720.420.320.4
1.82.82.62.42.52.52.62.42.22.52.32.4
Thin19.320.320.120.419.720.919.319.920.020.420.220.6
2.32.72.12.22.52.32.52.42.12.52.02.3
MAI (m3 ha−1 yr−1)No thin2.783.763.053.642.824.102.974.013.214.284.334.94
1.362.021.021.161.661.521.021.481.361.631.221.54
Thin3.514.092.893.253.113.963.604.144.044.664.805.31
1.601.620.540.771.330.781.130.991.201.271.291.35
MAI culmination age (years)No thin1009997901008910210092908585
173531243625414520251718
Thin868069687267737073727674
1577686776666
Means are shown in normal black text, and standard deviations in grey italics.
Table 6. Projected productivity variables: significance probabilities (Prob > F values) of treatment effects.
EffectSite IndexMAICulm. Age
Plant0.98010.00020.3436
Weed<0.0001<0.00010.0568
Thin0.81350.0052<0.0001
Thin × Weed0.50850.08470.8047
Plant × Weed0.42080.62440.8617
Plant × Thin0.29430.12900.0220
Plant × Thin × Weed0.88730.99350.9168
Bolded Prob > F values highlight significant treatment effects and interactions.
Publisher’s Note: MDPI stays neutral with regard to jurisdictional claims in published maps and institutional affiliations.

