Abstract
The protective value of forests is expected to be affected by climate change. Applied forest management could absorb or enhance such an impact. In this context, we developed a new protective value index (PVI) that includes biometric and topographical indicators of forest stands. Using PVI and the LandClim model, we simulated 100 years with low- and high-intensity cuttings within three climate scenarios to analyze their influence on the protective value of forests included in the soil protection category. The management types had a low impact on PVI during the simulation period. However, the effects of moderate climate intensified in the second half of the simulation period. In contrast, the extreme climate had the highest impact on PVI and its variables throughout the whole period. The forest stands from lower elevation reached a higher protective value than intermediate and high elevation. Although the low-elevation forest stands are the most vulnerable to climate changes, the ongoing adaptation conducts to stands with higher protective value than stable forests from the higher elevation. The PVI is easily adaptable for different forest landscape models and can be widely applied to provide an integrated assessment of the forest protective value and the management measures to maintain or enhance it.
1. Introduction
Climate change seriously impacts forest ecosystems [1], affecting forest stand productivity [2] and increasing the mortality rate [3].
The impact of climate change varies with elevation and a complex topography can create sheltered sites [4]. For example, the low-elevation forest stands have increased the chances of die-off caused by drought [5,6] or to change forest structure and composition [7]. At the same time, higher-elevation forests have better growing conditions with longer vegetation periods because of warmer climate scenarios [8].
The provision of ecosystem services of forests stands included in the soil protection category may be threatened considerably in the coming decades by climatic change [9]. In contrast, forests are still influenced by past management regimes in which climate change had not been considered. The current forest management is important because it can influence the intensity of the expected changes [8].
Soil protection ecosystem services are part of the regulating forest ecosystem services (FES) category [10] and are assessed at local, regional and global scales [11]. Most of the assessments use indicators such as tree species diversity, stand type and root type [12], forest stand density (tree/ha), or percentage of vegetation cover [13].
The landscape modeling studies focused more on indexes for protection against rockfalls and avalanches than landslides [14,15]. On the other hand, the existing indexes to assess the protective value of the forest, such as FPGH (forest protection against gravitation hazards) [16] and LPI (landslide protection index) [17], depend only on biometric indicators and neglect the complex topographical environment [4].
Morphometric indicators, such as aspect and slope, may play an important role in soil protection, the forest stands from a sunny aspect having a higher protective value [18]. Furthermore, forest stands’ structural and species diversity positively affect hazard reduction [19,20,21] and the root distribution has a key role in forest soil stabilization [22]. Regarding forest density, the ideal forest profile stands for a high level of protection is a minimum of 400 trees/ha with a DBH higher than 24 cm [23].
In this context, the paper aims to assess how forest management and climate influence the forest soil protective value by developing, testing and implementing a new index that incorporates biometric and topographical environment variables. Thus, we addressed three research objectives: (i) to create an index that evaluates the protective value of forests; (ii) to test and model the index on diverse forest stands included in the soil protection category; and (iii) to analyze the potential effects of climate change and management strategies on forests included in the soil protection category.
2. Materials and Methods
2.1. Study Area
The Romanian forest area is 7.04 million ha [24], of which 4.16 million ha are in mountain areas. Of the total forest area, 3.14 million ha are owned and managed by the state. The Romanian forests are classified into three main management types: strictly protected forests (no harvest), protection forests and production forests.
For the protection forests, the main management objective is to protect ecosystem services, which are further split into multiple possible categories, depending on the scope: water protection, soil protection, protection against climate changes, society protection, scientific interest and biodiversity conservation [25]. More than 26.7% of state-owned forests belong to the soil protection category [26]. In the protection forests, management is strongly conditioned by the protective function, resulting in limitations to harvest methods and intensity or complete exclusion of forests from timber harvesting [27].
In this respect, we selected four forest districts (FDs) [28,29,30,31] for the diversity of forest stands and elevation gradients. The forest stand attributes, such as stand age, the share of tree species, basal area and production class, were extracted from the forest management plans of the study sites to create the input files for a LandClim model. The information from the input and output files of the LandClim model allowed us to test the developed index on the Pojorâta, Măneciu and Frasin FDs and to forecast the index values for the next 10 decades through modeling in the Râșca FD (Figure 1).
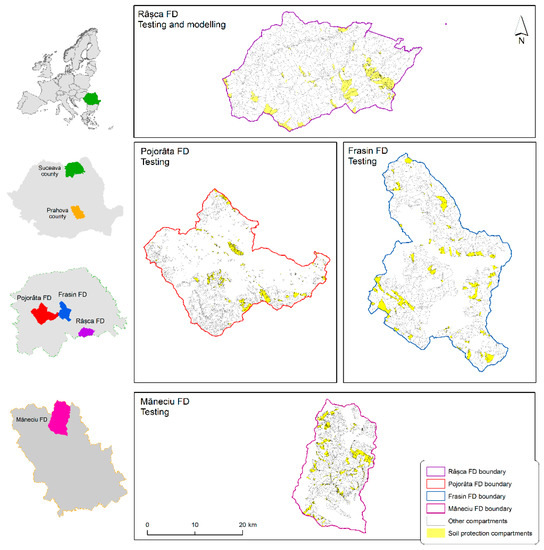
Figure 1.
Location of the study.
In the case of forest stands included in the soil protection category (Table 1), only low-intensity cuttings are allowed, according to the Romanian technical regulations [25].

Table 1.
Forest stands included in the soil protection category.
Three of the selected FDs are in the northern part of Romania and, to complement the study, we chose the Măneciu FD from the central part of the country (Figure 1).
2.2. Developing Protective Value Index (PVI)
When developing the PVI, we considered seven indicators that influence the soil protective value of a forest stand (Equation (1)) and how they fit with the LandClim model or similar landscape models, which allows simulations at high spatial and temporal resolution.
where At—aspect and Se—slope are the values for the matrix cell center; Hsp represents tree species diversity; Hsz represents tree size diversity; Rt describes the rooting system within each cell; St represents the total number of stems with DBH > 24 cm; and Bs represents total biomass of existing tree species with DBH > 24 cm within each cell.
The indicators’ weights (a1 to a7) were assumed to be equal and the indicators’ values were normalized, ranging between 0 and 1. Therefore, the PVI varies between 0—low protective and 1—high protective value of forests.
Aspect and slope indicators were determined using the digital elevation model (DEM) constructed using topographical plans with a 1:5000 scale. The topo to raster module of the ArcGIS 9.3 software was used to generate the elevation model and compute slopes and aspect data within the spatial analyst extension. Every raster created had a 25-square-meter cell size. The normalized aspect varies between 0 to 180 degrees and the slope values in raster cells range between 0° to exceptionally 85°.
Tree species diversity (Hsp) was computed using Shannon’s entropy index [32], considering the number of species and their relative abundance from a matrix cell.
where S is the number of species within a cell; ni is the number of individuals from i species; and N is the total number of individuals within a cell.
Tree size diversity (Hsz) was computed using the post hoc index of Staudhammer and LeMay (2001) [33], which corresponded to the mean of the Shannon entropy index applied to diameter (HDBH) and height (HH) classes. We defined a 5 cm class for DBH and a 4 m class for height.
The root system indicator describes the rooting system in each cell. For every species, the root type was defined according to the literature [34,35], being identified as three root types: flat—low (1), tap—medium (2) and heart—high effect in stabilizing soil (3) (Table S2). The root indicator resulted from a mean value of root types weighted by stem number for every species in each cell.
Stems and biomass indicators represent the number of stems and, respectively, the biomass of trees with a DBH higher than 24 cm found in one cell.
2.3. LandClim Model
For our study, we used the forest landscape model LandClim [36] to identify the effect of climate and management on the protective value of forests included in the soil protection category.
LandClim is a spatially explicit process-based model that incorporates competition-driven forest dynamics and landscape-level disturbances to simulate forest dynamics on a landscape scale [37]. It was designed to examine the impact of climate change and forest management [38].
It simulates forest growth in 25 by 25 m cells, using simplified versions of tree recruitment, growth and competition processes commonly included in forest gap models [38].
Forest growth is determined by climatic parameters, soil properties and topography, land use and forest management, and large-scale disturbances. Individual cells are linked together by the spatially explicit seed dispersal processes, landscape disturbances and forest management. Forest dynamics within each cell are simulated by following tree age cohorts, where cohorts are characterized by the mean biomass of an individual tree and the number of trees in the cohort [38].
The LandClim model has been applied to several case studies with a different ecological focus. In particular, it has been used to test palaeoecological hypotheses by simulating past forest dynamics [39,40,41], to assess the impact of climate change and disturbance regimes on ecosystem goods and services [38,42,43] and to simulate the evolution of biomass and species composition in the northeastern Carpathian Mountains [44].
The control file of the LandClim model requires different input files to run the model (Figure 2).
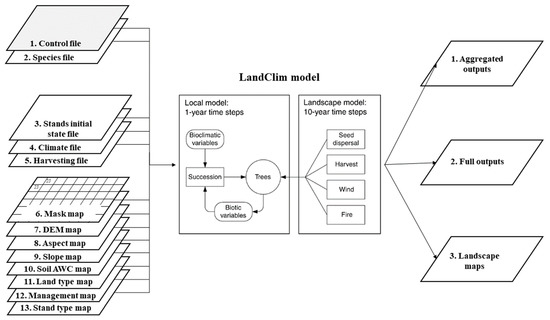
Figure 2.
Scheme of LandClim model implementation, loose adaptation from the schematic of LANDIS model [45].
The modeling was done for Râșca FD, which also was selected in the Fundive project because of its environmental complexity, species diversity and data availability [46]. We conducted simulation experiments with two contrasting management scenarios: current management with low-intensity cuttings and a business-as-usual management with high-intensity cuttings, each within three different climate scenarios (for more information about the LandClim model input data, aggregation and analysis of output data, see Supplementary Material).
2.4. Climate Scenarios
In the Râșca FD (tested and modeled) in 2010, the mean annual temperature was 6.5 °C and total annual precipitation 750 mm [28]. Three different regional circulation models driven by the A1B emission scenario [47] were used to simulate the state of forests under climate change. Although the simulated climate scenarios were heterogeneous across the study area, the temperature and precipitation had a lapse rate with increasing altitude.
The HADCM3 climate projection was the most extreme, with the largest increase in summer temperature and decrease in precipitation, the ECHAM5 climate was moderate and CCSM3 projected the slightest changes in climate (Figure S1). All these scenarios projected dryer conditions, but depending on the climate scenario, the average growing season temperature over the simulation area increased between 2.1 and 5.4 °C. At the same time, precipitation decreased between 118 and 285 mm in the simulation period’s last decade compared with the first decade, 2010–2020 [44].
The climate scenarios (CCSM3, ECHAM5 and HADCM3) from the A1B emission scenario were compared with recent RCP scenarios (rcp2.6, rcp4.5, rcp6.0 and rcp8.5) [48] extracted from the CCSM4 general circulation model. The results showed that the A1B climate scenarios do not differ from the RCP scenarios and do not have extreme values (Figure S2).
2.5. Management Types
In the last three decades, forest management in Romania was influenced by the transition to a marked-based economy. It is preponderantly based on the natural regeneration of forests within the shelterwood system, with artificial regeneration used in certain forest types or complementary to natural regeneration. The silvicultural systems include low- to medium-intensity thinning (precommercial and commercial), which are done in the first three-quarters of the harvesting age [49].
Main harvests are applied according to the management plan, ensuring continuity of harvest, considering the functions set for each compartment and species physiology. Clear cuts are limited to 3 ha for spruce only, while the shelterwood system is applied with a harvesting rate of a maximum of 30%/intervention (after harvesting age). Low-intensity management (less than 10% of standing volume/decade) is applied in the case of important protection functions and planned separately [50].
In LandClim, for forest stands included in the soil protection category, two management types were implemented, reflecting the current management practices in Romania [44].
In the current management (low intensity) a proportion of 0.10 per cohort/decade was targeted for harvesting (Table S1), describing a management oriented to biodiversity conservation [51,52].
The second management type, business as usual (high intensity) aims to create multifunctional forests through a shelterwood system. According to the Romanian technical regulations, thinnings were scheduled without exceeding 15% of standing volume before forest operation.
2.6. Data Processing
The study location maps and input geomorphological variables were produced using ArcGIS 9.3. The data were further processed using packages “stats”, “vegan”, “sqldf”, “ggplot2”, “FactoMineR” and “VCD” from RStudio. The PVI indicators histograms were smoothed with a density function because of the continuous and variable data of the analyzed FDs. All model outputs were analyzed in the statistical software R, version 3.6.2 [53].
3. Results
3.1. PVI Testing on Diverse Forest Stands Included in the Soil Protection Category
The forest stands included in the soil protection category were mainly located on shaded aspects, except for the Măneciu FD. Regarding slope distribution, in the Măneciu and Pojorâta FDs, more forest stands were located on steep slopes (Table 2).
Table 2.
PVI and indicators for assessing the protective value of forests included in the soil protection category.
Regardless of tree species diversity (Hsp), the tree size diversity (Hsz) was higher in all analyzed forest districts. The root system indicator showed that the higher stabilizing effect was given by forest stands with a low tree-species diversity as those from the Măneciu FD. Only a few forest stands reached a high tree density (Pojorâta FD). In terms of standing biomass, irrespective of tree species or tree size diversity, the standing biomass stock was low in most forest stands, with some exceptions.
The forest stands dominated by coniferous species tend to have a lower protective value than mixed and hardwood deciduous stands.
The mixed forest stands from the Râșca, and Frasin FDs showed a decreasing protective value along the elevation gradient, which was also observed in forest stands dominated by coniferous. Instead, deciduous forest stands with low tree-species diversity showed an increased protective value against soil erosion (Table 3).
Table 3.
PVI evolution in forest stands included in the soil protection category along the elevation gradient.
3.2. Influence of Management and Climate Scenarios on PVI and Its Indicators
The mean PVI evolution in the first 50 years has been influenced more by climate than management scenarios. However, in the last 50 years of the simulation period, the slight differences between low- and high-intensity management continued in mild and extreme climate projections.
The positive effects of high-intensity management on PVI and its indicators can be observed only in the second half of the moderate climate simulation (Figure 3). However, overall, the differences between management types did not strongly influence PVI and indicators evolution.
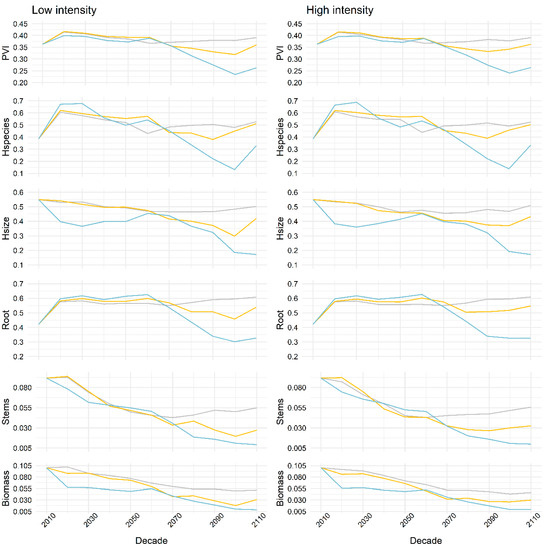
Figure 3.
Mean PVI and dynamic indicators evolution in mild climate (CCSM3–grey line), moderate climate (ECHAM5–orange line) and extreme climate (HADCM3–blue line) with, respectively, low-intensity and high-intensity management.
The in-depth analysis reveals that on low elevation (500 m) during the first half of the low-intensity management simulation the resulting forest stands reach a high protective value mainly in a mild and moderate climate. Instead, in the second half, the protective value of forests started to decrease in moderate and extreme climate scenarios. The influence of high-intensity management was observed only in a moderate climate
Once, with increasing elevation (800 m and 1100 m), the protective value of forests decreases in all climate and management scenarios. On the other hand, high-intensity management tends to increase the protective value of forests in all climate scenarios compared to low-intensity management (Figure 4).
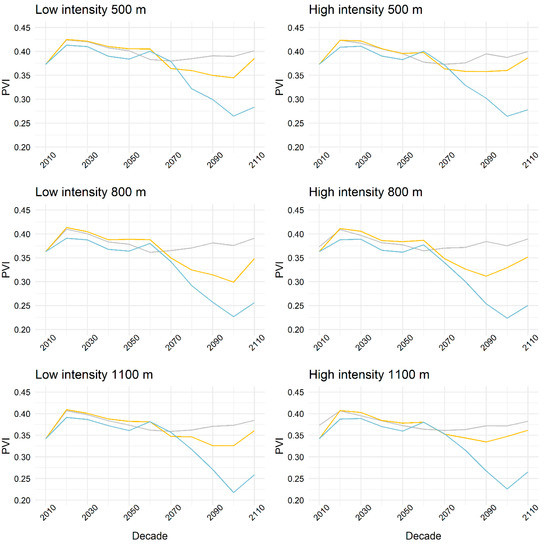
Figure 4.
PVI dynamic on elevation classes in mild climate (CCSM3—grey line), moderate climate (ECHAM5—orange line) and extreme climate (HADCM3—blue line) with, respectively, low- and high-intensity management.
3.3. Potential Effects of Climate Change and Management Strategies on Forests Included in the Soil Protection Category
The management types simulated had an important influence on biomass stock (Figure S3), impacting species composition and biomass dynamics regarding climate, management and elevation.
In a mild climate and high-intensity management, the biomass stock was low at the 500 m and 800 m elevation classes. Therefore, in the second half of the simulation, the biomass of pioneer species (as Populus tremula L., Betula pendula Roth and Carpinus betulus L.) started to increase. On the other hand, the low-intensity management led to increased biomass stocks at all elevation classes, mainly because of the biomass growth of Fagus sylvatica L. and Abies alba Mill. (Figure 5a).
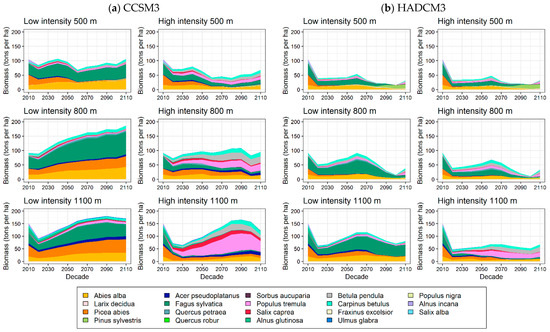
Figure 5.
Species composition and biomass dynamic between 2010 and 2110, in respect to elevation (500 m, 800 m and 1100 m classes), management strategies (low- and high-intensity management), and climate scenarios (mild–CCSM3 (a) and extreme–HADCM3 (b)).
The extreme climate canceled the effects of low- and high-intensity management at 500 m and 800 m elevation classes because of the reduced productivity of all existing species. The exception was in the low-intensity management at high elevation (Figure 5b).
4. Discussion
4.1. The PVI and Indicators Evolution in Diverse Forest Stands
Our results indicate that the forest stands from shaded slopes had a lower protective value in the analyzed forest districts, in accordance with other findings in the literature [18].
The rooting system has an essential role in soil stabilization. We observed that hardwood deciduous forest stands had a higher protective value because of high structural diversity [22].
The protection provided by forests included in the soil protection category depended on species diversity and species-specific tree density [51,54]. A high level of protection can be reached by the ideal forest density [23], which was only exceptionally in our study case because of difficult growing conditions.
4.2. Influence of Management and Climate Scenarios on PVI and Its Indicators
Climate change directly impacts FES provision and the increasing drought reduces forest biomass and supports the transition to more drought-resistant species [16,55]. In the Râșca FD, the increasing effects of drought intensified the decrease of standing biomass, mainly in high-intensity management (Figure 5). In the second half of the simulation period, forest biodiversity increased once the standing biomass decreased in the mild climate.
In the same period of moderate climate simulation, the high-intensity management tends to create stands with a high protective value.
There was no difference between management types regarding PVI evolution in the extreme climate scenario. This was mainly explained by the productivity drop of all species under this scenario and by the long process of the natural shift to more adapted species [56], which starts to occur only during the second half of the simulation period.
In the first 50 years, there was no difference between low and high-intensity management regarding PVI evolution. Instead, in the last 50 years, high-intensity management led to a high protective value. However, choosing the management should not ignore the effects of management intensity on species composition and standing biomass as in the shelterwood system [57].
4.3. Potential Effects of Climate Change and Management Strategies on Forests Included in the Soil Protection Category
In mountain regions, the impact of climate change on tree species is often elevation- and site-dependent, the shifts in species composition along elevation gradients reflecting elevation dependence on temperature and precipitation [55]. Therefore, the changes in species composition and biomass play a significant role in reducing the impact of climate change [55,58]. In low-intensity management, the increase was given by existing species, while in high-intensity management, the increase was due to Populus tremula L., Betula pendula Roth., Carpinus betulus L. species, which replaced Fagus sylvatica L., Picea abies (L.) H. Karst and Abies alba Mill (Figure 5).
Nonetheless, the forest stands from low elevations (500 m) were the most exposed to drought, which led to lower standing biomass and a fast shift to more adapted species in the first decades.
At intermediate elevation (800 m), the low-intensity management kept the same dominant species and increased biomass stock. On the contrary, standing biomass stock decreased in high-intensity management caused by drought impacts on Norway spruce [59] and European beech [9], but these contrasting values of biomass stocks did not influence the protective value of forests.
At high elevation (1100 m), in high-intensity management and contrasting climate scenarios (Figure 5a,b), were differences in biomass stocked and forest composition (shifted to more adapted species) [55]. Thus, in the first decades, the forest protective value was lower than low and intermediate elevations. A similar trend is observed in low-intensity management [17].
4.4. Limitations of PVI
The main PVI limitation is the equal weight of the indicators. Some studies considered indicators, such as tree size diversity [17,60], total stems [61,62], biomass and slope, as primarily important, assigning higher weights, while aspect and tree species diversity were graded with lower weights. Other studies applied a multi-criteria decision support system to assign weights [51]. This approach summed up stakeholders’ preferences on forest ecosystem indicators regarding forest administration. Thus, assigning weights to PVI indicators using the above-mentioned techniques would improve the results. However, such an addition would require complementary studies on indicator prevalence, which are not available at this point.
Other limitations for simple applicability of the PVI can be: (i) input data, which in this study are from forest management plans and need to be adapted to the LandClim input file requiring minimum programming experience, (ii) increased computational time given by the number of climate and management strategies simulated and (iii) the weights assigned for a different case study may differ, depending on regional forest experts.
These barriers recommend an improvement of PVI by adding or improving some indicators. In addition, testing more intensive management would be necessary to identify its effects on PVI and indicators.
5. Conclusions
The proposed index (PVI) estimates the forest protective value on soil, including topographic and stand-related variables. The PVI evolution was sensitive to tree species and size diversity. The lower values of PVI are mainly a consequence of the low values of density and biomass of forest stands located on shaded aspects.
The influence of management types was reduced during the simulation period. The moderate climate effects intensified in the second half of the simulation period, while the extreme climate had the highest impact on PVI and its indicators.
The forest stands from a lower elevation had a higher protective value than those from intermediate and high elevations. Even if such forest stands are the most vulnerable to climate changes, the ongoing adaptation is likely to create stands with higher protective value than stable forests from a higher elevation.
The PVI provided to the forest managers an assessment of the protective value of forest stands included in the soil protection category. The simulation of low- and high-intensity management in contrasting climate scenarios highlighted different trends of PVI. These results could assist forest managers in maintaining the forest protective value by choosing proper forestry measures to ensure climate change adaptation.
The PVI was designed to not depend on one landscape model but to be easily adaptable and to be widely applied, not only on forest stands included in the soil protection category.
Supplementary Materials
The following are available online at https://www.mdpi.com/article/10.3390/f13060916/s1. 1. LandClim model description, References [63,64] are cited in the supplementary materials. Figure S1. Rolling average of mean temperature (°C) and precipitation sum (mm), Figure S2. Comparing A1B scenarios (CCSM3, ECHAM5 and HADCM3) with RCP scenarios (RCP2.6, RCP4.5, RCP6.0 and RCP8.5), Figure S3. Harvested biomass from forest stands included in the soil protection category, Table S1. Harvesting parameters for business as usual (BAU) and conservative management (CONS) types, Table S2. Root type for forest species simulated in Râșca FD.
Author Contributions
Conceptualization, C.C.; methodology, C.C., G.D., I.B.; writing—original draft preparation, C.C., I.B.; writing—review and editing, C.C., O.B.; supervision. All authors have read and agreed to the published version of the manuscript.
Funding
C.C. acknowledges funding from the European H2020 Grant 817903 EFFECT and G.D., I.B. and O.B. acknowledge funding from the Ministry of Research, Innovation and Digitalization within Program 1—Development of national research and development system, Subprogram 1.2—Institutional Performance—RDI excellence funding projects, under contract no. 10PFE/2021.
Data Availability Statement
Not applicable.
Conflicts of Interest
The authors declare no conflict of interest.
References
- Thomas, J.; Brunette, M.; Leblois, A. The Determinants of Adapting Forest Management Practices to Climate Change: Lessons from a Survey of French Private Forest Owners. For. Policy Econ. 2022, 135, 102662. [Google Scholar] [CrossRef]
- Ma, W.; Zhou, X.; Liang, J.; Zhou, M. Coastal Alaska Forests under Climate Change: What to Expect? For. Ecol. Manag. 2019, 448, 432–444. [Google Scholar] [CrossRef]
- Senf, C.; Buras, A.; Zang, C.S.; Rammig, A.; Seidl, R. Excess Forest Mortality Is Consistently Linked to Drought across Europe. Nat. Commun. 2020, 11, 6200. [Google Scholar] [CrossRef] [PubMed]
- Albrich, K.; Rammer, W.; Seidl, R. Climate Change Causes Critical Transitions and Irreversible Alterations of Mountain Forests. Glob. Chang. Biol. 2020, 26, 4013–4027. [Google Scholar] [CrossRef]
- Duduman, M.-L.; Vasian, I. Effects of Volatile Emissions of Picea Abies Fresh Debris on Ips Duplicatus Response to Characteristic Synthetic Pheromone. Notulae Botanicae Horti Agrobotanici Cluj-Napoca 2012, 40, 308–313. [Google Scholar] [CrossRef][Green Version]
- Valdes-Correcher, E.; Moreira, X.; Augusto, L.; Barbaro, L.; Bouget, C.; Bouriaud, O.; Branco, M.; Centenaro, G.; Csoka, G.; Damestoy, T.; et al. Search for Top-down and Bottom-up Drivers of Latitudinal Trends in Insect Herbivory in Oak Trees in Europe. Glob. Ecol. Biogeogr. 2021, 30, 651–665. [Google Scholar] [CrossRef]
- Schuler, L.J.; Bugmann, H.; Snell, R.S. From Monocultures to Mixed-Species Forests: Is Tree Diversity Key for Providing Ecosystem Services at the Landscape Scale? Landsc. Ecol. 2017, 32, 1499–1516. [Google Scholar] [CrossRef]
- Thrippleton, T.; Lüscher, F.; Bugmann, H. Climate Change Impacts across a Large Forest Enterprise in the Northern Pre-Alps: Dynamic Forest Modelling as a Tool for Decision Support. Eur. J. For. Res. 2020, 139, 483–498. [Google Scholar] [CrossRef]
- Elkin, C.; Gutiérrez, A.G.; Leuzinger, S.; Manusch, C.; Temperli, C.; Rasche, L.; Bugmann, H. A 2 °C Warmer World Is Not Safe for Ecosystem Services in the European Alps. Glob. Chang. Biol. 2013, 19, 1827–1840. [Google Scholar] [CrossRef]
- Assessment, M.E. Ecosystems and Human Well-Being: Wetlands and Water; World Resources Institute: Washington, DC, USA, 2005; ISBN 1569735972. [Google Scholar]
- Terranova, O.; Antronico, L.; Coscarelli, R.; Iaquinta, P. Soil Erosion Risk Scenarios in the Mediterranean Environment Using RUSLE and GIS: An Application Model for Calabria (Southern Italy). Geomorphology 2009, 112, 228–245. [Google Scholar] [CrossRef]
- Dupire, S.; Bourrier, F.; Monnet, J.M.; Bigot, S.; Borgniet, L.; Berger, F.; Curt, T. The Protective Effect of Forests against Rockfalls across the French Alps: Influence of Forest Diversity. For. Ecol. Manag. 2016, 382, 269–279. [Google Scholar] [CrossRef]
- Zhao, C.; Yang, N.; Wang, Z.; Liu, S.; Dong, X.; Xin, W. Benefit Assessment of Soil and Water Conservation from Cropland to Forest in Hilly Loess Plateau at Qinghai. Springerplus 2013, 2, S7. [Google Scholar] [CrossRef] [PubMed]
- Blattert, C.; Lemm, R.; Thees, O.; Lexer, M.J.; Hanewinkel, M. Management of Ecosystem Services in Mountain Forests: Review of Indicators and Value Functions for Model Based Multi-Criteria Decision Analysis. Ecol. Indic. 2017, 79, 391–409. [Google Scholar] [CrossRef]
- Cordonnier, T.; Berger, F.; Elkin, C.; Lämås, T.; Martinez, M. Models and Linker Functions (Indicators) for Ecosystem Services. FP7-289437-ARANGE/D2.2, 2013. Available online: http://www.arange-project.eu/wpcontent/uploads/ARANGE-D2.2_linkerfunctions.pdf (accessed on 10 December 2021).
- Briner, S.; Elkin, C.; Huber, R. Evaluating the Relative Impact of Climate and Economic Changes on Forest and Agricultural Ecosystem Services in Mountain Regions. J. Environ. Manag. 2013, 129, 414–422. [Google Scholar] [CrossRef] [PubMed]
- Zlatanov, T.; Elkin, C.; Irauschek, F.; Lexer, M.J. Impact of Climate Change on Vulnerability of Forests and Ecosystem Service Supply in Western Rhodopes Mountains. Reg. Environ. Chang. 2017, 17, 79–91. [Google Scholar] [CrossRef]
- Bangroo, S.A.; Najar, G.R.; Rasool, A. Effect of Altitude and Aspect on Soil Organic Carbon and Nitrogen Stocks in the Himalayan Mawer Forest Range. Catena 2017, 158, 63–68. [Google Scholar] [CrossRef]
- Song, Z.; Seitz, S.; Li, J.; Goebes, P.; Schmidt, K.; Kühn, P.; Shi, X.; Scholten, T. Tree Diversity Reduced Soil Erosion by Affecting Tree Canopy and Biological Soil Crust Development in a Subtropical Forest Experiment. For. Ecol. Manag. 2019, 444, 69–77. [Google Scholar] [CrossRef]
- Park, J.; Kim, H.S.; Jo, H.K.; Jung, B. The Influence of Tree Structural and Species Diversity on Temperate Forest Productivity and Stability in Korea. Forests 2019, 10, 1113. [Google Scholar] [CrossRef]
- Duduman, G.; Barnoaiea, I.; Avăcăriței, D.; Barbu, C.O.; Coșofreț, V.-C.; Dănilă, I.-C.; Măciucă, A.; Drăgoi, M. Aboveground Biomass of Living Trees Depends on Topographic Conditions and Tree Diversity in Temperate Montane Forests from Slătioara-Rarău Area (Romania). Forests 2021, 12, 1507. [Google Scholar] [CrossRef]
- Schwarz, M.; Preti, F.; Giadrossich, F.; Lehmann, P.; Or, D. Quantifying the Role of Vegetation in Slope Stability: A Case Study in Tuscany (Italy). Ecol. Eng. 2010, 36, 285–291. [Google Scholar] [CrossRef]
- Frehner, M.; Wasser, B.; Schwitter, R. Nachhaltigkeit Und Erfolgskontrolle Im Schutzwald. Wegleitung für Pflegemassnahmen Wäldern mit Schutzfunktion, Vollzug Umwelt; Bundesamt für Umwelt (BAFU): Ittigen, Switzerland, 2005. [Google Scholar]
- IFN Inventarul Forestier National Ciclul 2 (2013–2018). Available online: http://roifn.ro/site/ifn-ciclul-ii/ (accessed on 29 October 2020).
- Normele Tehnice Privind Elaborarea Amenajamentelor Silvice, Mmodificarea Prevederilor Acestora și Schimbarea Categoriei de Folosință a Terenurilor din Fondul Forestier. Monitorul Oficial nr. 730 din 23.08.2018. Available online: https://lege5.ro/Gratuit/gi4tcojugmyq/ordinul-nr-766-2018-pentru-aprobarea-normelor-tehnice-privind-elaborarea-amenajamentelor-silvice-modificarea-prevederilor-acestora-si-schimbarea-categoriei-de-folosinta-a-terenurilor-din-fondul-forest (accessed on 15 January 2022).
- RNP Regia Națională a Pădurilor (ROMSILVA) Aspecte Generale Fond Forestier. Available online: http://www.rosilva.ro/articole/prezentare_generala__p_178.htm (accessed on 29 October 2020).
- Alberdi, I.; Bender, S.; Riedel, T.; Avitable, V.; Boriaud, O.; Bosela, M.; Camia, A.; Cañellas, I.; Castro Rego, F.; Fischer, C.; et al. Assessing Forest Availability for Wood Supply in Europe. For. Policy Econ. 2020, 111, 102032. [Google Scholar] [CrossRef] [PubMed]
- Anonymous. Forest Management Plan of Râșca Forest District; ICAS: Suceava State Forest Administration, Romania, 2010. [Google Scholar]
- Anonymous. Forest Management Plan of Frasin Forest District; ICAS: Suceava State Forest Administration, Romania, 2010. [Google Scholar]
- Anonymous. Forest Management Plan of Pojorâta Forest District; ICAS: Suceava State Forest Administration, Romania, 2010. [Google Scholar]
- Anonymous. Forest Management Plan of Măneciu Forest District; ICAS: Prahova State Forest Administration, Romania , 2010. [Google Scholar]
- Shannon, C.E. A Mathematical Theory of Communication. Bell Syst. Tech. J. 1948, 27, 379–423. [Google Scholar] [CrossRef]
- Staudhammer, C.L.; LeMay, V.M. Introduction and Evaluation of Possible Indices of Stand Structural Diversity. Can. J. For. Res. 2001, 31, 1105–1115. [Google Scholar] [CrossRef]
- Clinovschi, F. Dendrologie; Editura Universităţii Suceava: Suceava, Romania, 2005; ISBN 973-666-157-1. [Google Scholar]
- Stănescu, V.; Șofletea, N.; Popescu, O. Woody Forest Flora of Romania; Editura Ceres: București, Romania, 1997. (In Romanian) [Google Scholar]
- Bugmann, H. A Review of Forest Gap Models. Clim. Chang. 2001, 51, 259–305. [Google Scholar] [CrossRef]
- Schumacher, S.; Bugmann, H.; Mladenoff, D.J. Improving the Formulation of Tree Growth and Succession in a Spatially Explicit Landscape Model. Ecol. Modell. 2004, 180, 175–194. [Google Scholar] [CrossRef]
- Schumacher, S.; Bugmann, H. The Relative Importance of Climatic Effects, Wildfires and Management for Future Forest Landscape Dynamics in the Swiss Alps. Glob. Chang. Biol. 2006, 12, 1435–1450. [Google Scholar] [CrossRef]
- Henne, P.D.; Elkin, C.M.; Reineking, B.; Bugmann, H.; Tinner, W. Did Soil Development Limit Spruce (Picea Abies) Expansion in the Central Alps during the Holocene? Testing a Palaeobotanical Hypothesis with a Dynamic Landscape Model. J. Biogeogr. 2011, 38, 933–949. [Google Scholar] [CrossRef]
- Schwörer, C.; Henne, P.D.; Tinner, W. A Model-Data Comparison of Holocene Timberline Changes in the Swiss Alps Reveals Past and Future Drivers of Mountain Forest Dynamics. Glob. Chang. Biol. 2014, 20, 1512–1526. [Google Scholar] [CrossRef]
- Thrippleton, T.; Dolos, K.; Perry, G.L.W.; Groeneveld, J.; Reineking, B. Simulating Long-Term Vegetation Dynamics Using a Forest Landscape Model: The Post-Taupo Succession on Mt Hauhungatahi, North Island, New Zealand. N. Z. J. Ecol. 2014, 38, 26–38. [Google Scholar]
- Elkin, C.; Reineking, B.; Bigler, C.; Bugmann, H. Do Small-Grain Processes Matter for Landscape Scale Questions? Sensitivity of a Forest Landscape Model to the Formulation of Tree Growth Rate. Landsc. Ecol. 2012, 27, 697–711. [Google Scholar] [CrossRef]
- Temperli, C.; Bugmann, H.; Elkin, C.M. Cross-Scale Interactions among Bark Beetles, Climate Change, and Wind Disturbances: A Landscape Modeling Approach. Ecol. Monogr. 2013, 83, 383–402. [Google Scholar] [CrossRef]
- Bouriaud, L.; Bouriaud, O.; Elkin, C.; Temperli, C.; Reyer, C.; Duduman, G.; Barnoaiea, I.; Nichiforel, L.; Zimmermann, N.; Bugmann, H. Age-Class Disequilibrium as an Opportunity for Adaptive Forest Management in the Carpathian Mountains, Romania. Reg. Environ. Chang. 2015, 15, 1557–1568. [Google Scholar] [CrossRef]
- Mladenoff, D.J. LANDIS and Forest Landscape Models. Ecol. Modell. 2004, 180, 7–19. [Google Scholar] [CrossRef]
- Baeten, L.; Verheyen, K.; Wirth, C.; Bruelheide, H.; Bussotti, F.; Finér, L.; Jaroszewicz, B.; Selvi, F.; Valladares, F.; Allan, E.; et al. A Novel Comparative Research Platform Designed to Determine the Functional Significance of Tree Species Diversity in European Forests. Perspect. Plant Ecol. Evol. Syst. 2013, 15, 281–291. [Google Scholar] [CrossRef]
- IPCC Climate Change 2007: Impacts, Adaptation and Vulnerability. In Contribution of Working Group II to the Fourth Assessment Report of the Intergovernmental Panel on Climate Change; Parry, M.L., Canziani, O.F., Palutikof, J.P., van der Linden, P.J., Hanson, E.C., Eds.; Cambridge University Press: Cambridge, UK, 2007; ISBN 9780080449104. [Google Scholar]
- Pachauri, R.K.; Allen, M.R.; Barros, V.R.; Broome, J.; Cramer, W.; Christ, R.; Church, J.A.; Clarke, L.; Dahe, Q.; Dasgupta, P. Climate Change 2014: Synthesis Report. Contribution of Working Groups I, II and III to the Fifth Assessment Report of the Intergovernmental Panel on Climate Change; IPCC: Geneva, Switzerland, 2014; ISBN 9291691437. [Google Scholar]
- Nichiforel, L.; Duduman, G.; Scriban, R.E.; Popa, B.; Barnoaiea, I.; Drăgoi, M. Forest Ecosystem Services in Romania: Orchestrating Regulatory and Voluntary Planning Documents. Ecosyst. Serv. 2021, 49, 101276. [Google Scholar] [CrossRef]
- Anonymous Normele Tehnice Pentru îngrijirea și Conducerea Arboretelor 2. 2000. Available online: http://bucuresti.gardaforestiera.ro/files/12495_Norm%202.pdf (accessed on 10 November 2021).
- Thrippleton, T.; Blattert, C.; Bont, L.G.; Mey, R.; Zell, J.; Thürig, E.; Schweier, J.; Mina, M. A Multi-Criteria Decision Support System for Strategic Planning at the Swiss Forest Enterprise Level: Coping With Climate Change and Shifting Demands in Ecosystem Service Provisioning. Front. For. Glob. Chang. 2021, 4, 113. [Google Scholar] [CrossRef]
- Coșofreț, C.; Bouriaud, L. Which silvicultural measures are recommended to adapt forests to climate change? A literature review. Ser. II For. Wood Ind. Agric. Food Eng. 2019, 12, 13–34. [Google Scholar] [CrossRef]
- R Core Team R: A Language and Environment for Statistical Computing. Available online: https://www.r-project.org/ (accessed on 20 May 2019).
- Mina, M.; Bugmann, H.; Cordonnier, T.; Irauschek, F.; Klopcic, M.; Pardos, M.; Cailleret, M. Future Ecosystem Services from European Mountain Forests under Climate Change. J. Appl. Ecol. 2017, 54, 389–401. [Google Scholar] [CrossRef]
- Thrippleton, T.; Cailleret, M.; Bugmann, H. Projecting Forest Dynamics Across Europe: Potentials and Pitfalls of Empirical Mortality Algorithms. Ecosystems 2020, 23, 188–203. [Google Scholar] [CrossRef]
- Williams, M.I.; Dumroese, R.K. Preparing for Climate Change: Forestry and Assisted Migration. J. For. 2013, 111, 287–297. [Google Scholar] [CrossRef]
- Botequim, B.; Bugalho, M.N.; Rodrigues, A.R.; Marques, S.; Marto, M.; Borges, J.G. Combining Tree Species Composition and Understory Coverage Indicators with Optimization Techniques to Address Concerns with Landscape-Level Biodiversity. Land 2021, 10, 126. [Google Scholar] [CrossRef]
- Huber, N. Towards Robust Projections of Future Forest Dynamics: Why There Is No Silver Bullet to Cope with Complexity. Ph.D. Thesis, ETH Zurich, Zürich, Switzerland, 2019. [Google Scholar]
- Hartl-Meier, C.; Zang, C.; Dittmar, C.; Esper, J.; Göttlein, A.; Rothe, A. Vulnerability of Norway Spruce to Climate Change in Mountain Forests of the European Alps. Clim. Res. 2014, 60, 119–132. [Google Scholar] [CrossRef]
- Briner, S.; Huber, R.; Bebi, P.; Elkin, C.; Schmatz, D.R.; Grêt-Regamey, A. Trade-Offs between Ecosystem Services in a Mountain Region. Ecol. Soc. 2013, 18, 35. [Google Scholar] [CrossRef]
- Cenuşă, R.; Barbu, I. Metodă Pentru Determinarea Gradului de Exercitare a Funcţiilor Ecoprotective În Păduri. Bucovina For. 2004, 12, 69–74. [Google Scholar]
- Gaspar, R. Caracterizarea Hidrologică a Bazinelor Hidrografice Forestiere Mici. Revista Pădurilor 2000, 115, 28–32. [Google Scholar]
- Temperli, C.; Zell, J.; Bugmann, H.; Elkin, C. Sensitivity of Ecosystem Goods and Services Projections of a Forest Landscape Model to Initialization Data. Landsc. Ecol. 2013, 28, 1337–1352. [Google Scholar] [CrossRef]
- Duduman, G.; Bouriaud, O.; Barnoaiea, I.; Drăgoi, M.; Bouriaud, L. Metodology and Preliminary Results of LANDCLIM Application in Mountainous Mixed Forests with Coniferous and Beech from Northern Romania–Draft. 2013, pp. 1–9. Available online: http://www.silvic.usv.ro/motive/preliminary_results_motive.pdf (accessed on 29 March 2022).


Publisher’s Note: MDPI stays neutral with regard to jurisdictional claims in published maps and institutional affiliations. |
© 2022 by the authors. Licensee MDPI, Basel, Switzerland. This article is an open access article distributed under the terms and conditions of the Creative Commons Attribution (CC BY) license (https://creativecommons.org/licenses/by/4.0/).