Article

Impacts of Hurricane Michael on Watershed Hydrology: A Case Study in the Southeastern United States

1
Eastern Forest Environmental Threat Assessment Center, Southern Research Station, US Department of Agriculture Forest Service, Research Triangle Park, NC 27709, USA
2
Eastern Forest Environmental Threat Assessment Center, Southern Research Station, US Department of Agriculture Forest Service, Asheville, NC 28804, USA
*
Author to whom correspondence should be addressed.
Forests 2022, 13(6), 904; https://doi.org/10.3390/f13060904
Submission received: 2 May 2022 / Revised: 3 June 2022 / Accepted: 7 June 2022 / Published: 9 June 2022

Abstract

:
Hurricanes are one of the most significant threats to coastal plain forest ecosystems and urban communities of the southeastern U.S., but their implications for watershed hydrology are unclear. Hurricanes have the potential to alter water balances, causing extensive flooding, biogeochemical cycle disruption, and water quality degradation, saltwater intrusion, and increased nutrient sedimentation export in coastal watersheds. This case study focused on Hurricane Michael, a recent catastrophic event that impacted the Gulf coast, the Florida panhandle, southwestern Georgia, and southeastern Alabama. Through empirical (Double Mass Curve) and process-based ecohydrological modeling (WaSSI model) on long-term streamflow data, we explored whether vegetation damage caused by this hurricane resulted in an increase in streamflow two years after the extreme event. We found that monthly streamflow from the Chipola River watershed with an area of 2023 km2 did not change (<6%) appreciably during the first two years following the storm, arguably because only a fraction of the gauged watershed lost substantial tree cover. However, spatially explicit hydrological modeling suggested that several sub-watersheds with the highest decreases in the Normalized Difference Vegetation Index (NDVI) significantly increased their monthly streamflow in 2019 by up to 22%. These modeled streamflow anomalies subsided by the second growing season when vegetation recovered. Overall, this study suggests that changes in vegetation cover after Hurricane Michael did not have lasting impacts on the hydrology of this watershed, and the hydrology of coastal watersheds may be more resilient to hurricane disturbances than previously thought.

1. Introduction

Recent studies indicate that intense hurricanes within the Atlantic Ocean are increasing [1,2,3,4], altering the landscape and causing significant economic damage. Therefore, it is becoming increasingly urgent to understand the impacts of hurricanes on coastal ecosystems and watersheds. Hurricanes can alter ecosystem processes (e.g., evapotranspiration, runoff, biogeochemical cycles) within forested watersheds. Severe flooding and tree mortality brought on by hurricanes have negatively impacted runoff amount and water quality by releasing chemical and biological pollutants into water sources and promoting algal blooms that result in dead aquatic zones [5,6]. Approximately 10% of the total annual carbon sequestered by US forests can be converted into dead biomass by a single intense hurricane [7]. However, due to the variety of factors that influence hurricane impacts (e.g., hurricane strength, path, and wind duration, rainfall amount, change in forest composition and structure), it is difficult to separate the role of individual factors in evaluating the hydrological impacts [3,8]. Over the past four decades, several studies have examined the mechanisms behind the forest hydrological impacts from extreme disturbances such as hurricanes and cyclones. Following hurricane activity, shifts in tree species community composition could alter evapotranspiration (ET) rates and water budgets in forested watersheds [9]. However, research findings are conflicting. Biomass loss within the bottomland hardwood forests of Louisiana following Hurricane Katrina showed significant variation by species and depended on abiotic factors such as hydrologic and inundation regimes [8]. Alternatively, tree species richness and community composition within Nicaraguan rain forests following the 1988 landfall of Hurricane Joan were largely unaltered [10]. Along the coast, storm surges associated with hurricane events have increased saltwater inundation of coastal ecosystems [11], affecting forest gross ecosystem productivity and ecosystem respiration [12]. However, research has shown forest cover regulates watershed hydrology [1,4,13,14,15,16]. Hurricane activities impact water resources in the southeastern United States by elevating streamflow rates and nutrient export [17]. Hurricanes alter forest evapotranspiration (ET) rates through accelerated leaf abscission and large-scale tree mortality [18]. Within low-gradient coastal plain forests, ET can account for between 70 and 113% of total precipitation loss [19,20].
Furthermore, tree transpiration appears to be the driving component of ET in forests, constituting up to 83% of total ET [20,21]. Streamflow rates within a coastal plain forested watershed in the Santee Experimental Forest increased by up to 50% following Hurricane Hugo in response to forest canopy loss [1,15,22]. Research shows annual carbon sink potential for impacted coastal plain forest ecosystems declined following hurricane activity and maintained below-average pre-storm levels in the years following these events. One study showed prolonged loss of carbon sequestration potential following hurricanes [23]. However, the long-term impacts of hurricane events have yet to be well documented [4,21]. Information on how extreme climate events may affect ecosystems and their hydrologic response is limited but crucial for future planning and mitigation [1,3,13,21]. Due to severe hurricane events, long-term hydrological change may elevate baseflow, groundwater recharge stormflow, and flood potential and reduce water quality [4].
On 8 October 2018, Hurricane Michael made landfall as a Category 5 hurricane on the Florida panhandle near Mexico Beach, FL, USA [24,25,26,27]. The impacts of Hurricane Michael on wetlands and forest dynamics have been assessed [23,28,29,30]. Other studies documenting impacts on longleaf pine ecosystems found approximately 13% of all remaining longleaf pine habitat was impacted, resulting in mortality rates of 88% at the storm’s center [29]. Along the coast, strong storm surges and a sudden increase in streamflow rates from this hurricane also impacted water quality by increasing dissolved and particulate organic carbon concentrations in the area’s primary water sources. This biogeochemical response may create short-term effects on ecosystem biology by causing phytoplankton and algal blooms [30]. However, the impact of this extreme climatic event on the hydrology of watersheds in its path has not been evaluated.
The objective of this study was to assess if or how Hurricane Michael influenced watershed hydrology, specifically the storm’s impacts on streamflow in the following two years. Our analysis addressed the timing when vegetational recovery may have offset hydrologic impacts years after the storm event [1,21]. We hypothesized that departures in streamflow would track Hurricane Michael’s vegetation impacts as measured by changes in the Normalized Difference Vegetation Index (NDVI). NDVI is a valuable indicator of changes in vegetation and canopy cover in response to severe tree crown damage, tree mortality, and premature leaf abscission [31]. Sustained below average NDVI values due to slow recovery rates in subsequent growing seasons may lead to sustained ET reductions and significant increases in discharge at the watershed scale.

2. Materials and Methods

2.1. Study Area

Hurricane Michael caused severe damage across Florida (FL), Georgia (GA), and Alabama (AL), attributed to sustained wind speeds of 259 km/h and localized flooding. Michael produced storm surge inundation heights of 3–4 m above ground level (AGL). Widespread precipitation of 76 to 152 mm was reported along the storm’s track, with localized totals of approximately 254 mm. A total of 16 direct casualties and approximately USD 25 billion in damages were recorded due to the storm [24]. In addition, severe forest damage and mortality were documented in parts of western Florida, southwestern Georgia, and southeastern Alabama. Total forest damage between the three states was estimated to be more than 110 million tons over 2.1 million hectares [25,26,27].
The Chipola River watershed (2023 km2) was chosen as the area of interest for this study due to its location within the track of Hurricane Michael, the availability of pre-disturbance and post-disturbance streamflow data, and the large fractional forest cover (47%) of the watershed (Figure 1). The Chipola River watershed includes a portion of the northern panhandle of Florida and southeastern Alabama and includes the city of Marianna, Florida, and southern portions of Dothan, Alabama. Most forested areas within this watershed are in low gradient areas with water table levels close to the surface. Small streams’ drainage is characterized, and coastal wetlands aid in surface water retention [13]. The average annual precipitation for this area is approximately 1360 mm/yr. The annual temperature across this watershed ranges between 10 and 28 °C. Based on the 2016 National Land Cover Database (NLCD) data product, the Chipola River watershed includes 47% forested land, 35% cultivated land, 8% developed land, and 10% classified as other ecosystems (Figure 1). The majority of forested areas within the watershed are classified by the NLCD as evergreen forest (24%) or woody wetlands (21%). Aerial and ground photographs shown in Figure 2 depict severe forest damage from Hurricane Michael across the Chipola River watershed.

2.2. Vegetation Condition

A valuable metric for tracking change in forest conditions over large areas is the Normalized Difference Vegetation Index (NDVI). The red and near-infrared wavelengths used in this well-known index are vegetation-sensitive, and through satellite imagery, NDVI change can be readily quantified over time. As vegetation and tree canopy cover increases, NDVI increases from 0 to 1. Therefore, decreases in NDVI imply a loss of greenness and productivity. This analysis utilized Sentinel-2 Level-2A (https://developers.google.com/earth-engine/datasets/catalog/COPERNICUS_S2_SR) (accessed on 3 March 2022) 10 m resolution surface reflectance imagery in Google’s Earth Engine (GEE) (https://earthengine.google.com/) (accessed on 3 March 2022). For the Chipola River watershed, we calculated the maximum NDVI values during the growing season to filter out clouds and cloud shadow artifacts. The forest growing season for this area of the southeastern US is defined as spring and early summer; therefore, images from 1 June through 15 July represent the peak growing season [32]. Change in growing season maximum NDVI was used to compare pre-hurricane (2018) and post-hurricane (2019 and 2020) conditions. The resulting NDVI change images were then masked to only include changes in forested lands. This was accomplished by including 2006, 2011, 2016, and 2019 NLCD land cover data layers into the script (forest mask is defined by the classes: deciduous, coniferous, mixed forest, and woody wetlands). The composite pre- and post-disturbance images of the watershed were downloaded as raster data layers into ArcMap to obtain the distribution of all NDVI values measured within the specific period. Frequency graphs of NDVI values for pre- and post-hurricane images were then generated to quantify total change across the watershed.
NDVI data were also sourced from the Sentinel Hub EO Browser online database (https://apps.sentinel-hub.com/eo-browser/) (accessed on 3 March 2022) which provides archived imagery data from Sentinel and other satellite imagery products. We obtained daily Moderate Resolution Imaging Spectroradiometer (MODIS) Terra/Aqua MCD43A4 v006 data to detect NDVI change across various products. MODIS products produce vegetation indices from composite images which capture surface reflectance. They help characterize a range of vegetation status and stress. The watershed boundary was uploaded via shapefile import, and NDVI data was exported corresponding with the same growing season date range mentioned above.

2.3. Climate Data

The United States Geological Survey (USGS) streamflow gauging station 02359000 “Chipola River Near Altha, FL” was identified for this study. This watershed has an above-gauge surface area of approximately 2023 km2. We used daily streamflow records from January 2007 to December 2020. Daily precipitation and temperature data (4 km spatial resolution) from 2007 through 2020 were downloaded from the PRISM Climate Group (https://prism.oregonstate.edu/) (accessed on 5 June 2021). The gridded climate dataset was aggregated to the whole watershed scale and the 12-digit, or sixth-level, Hydrologic Unit Code (HUC12) sub-watershed scale using an area-weighted average method. Monthly precipitation and streamflow totals from January 2007 to December 2020 were downloaded, and the data from the 2007 to 2017 period was used to establish monthly and annual “norms” for comparison.

2.4. Methods for Detecting the Impact of Forest Disturbance on Flow

2.4.1. Daily and Flow Duration Curves

To capture both the pre-disturbance (2007–2017) and post-disturbance (2018–2020) precipitation and streamflow averages in the watershed, precipitation and flow duration curves (i.e., exceedance percent above certainty values) were created to show how flow and precipitation distributions post hurricane might have shifted from expectations. Discharge and precipitation rates were each ranked from largest to smallest and the frequencies of each value were calculated using the equation:
F = ( r a n k n + 1 ) * 100 %
where F equals the frequency in which a specific discharge or precipitation rate occurred, rank is the corresponding rank of the precipitation/discharge rate, and n equals the number of values (days) obtained for each period studied.

2.4.2. Double Mass Curve (DMC)

DMC, the relationship between annual total accumulated precipitation (P) and discharge (Q) over a specific period, has been widely used in hydrologic analysis to detect a shift in the rainfall–runoff relationship (Q/P) due to disturbances other than rainfall patterns [33]. This runoff ratio helps illustrate changes in the amount of rainfall that does not infiltrate the soil and is not drawn up via evapotranspiration. We used this method to estimate the magnitude of streamflow increase due to vegetation change by building simple regression models between accumulated annual P and Q. Then, the measured annual flow was compared to the predicted using the annual model. The difference between measured flow and predicted flow in the post-hurricane years was used to estimate the hydrologic response to vegetation damages caused by Hurricane Michael in October 2018. These regression methods represent a “single watershed” approach instead of a “Paired watershed approach” to detect watershed hydrologic change due to changes in vegetation cover over time.

2.4.3. Water Supply Stress Index (WaSSI) Hydrologic Model

In addition to the empirical hydrologic analysis using flow duration curves and DMC methods, we parameterized a process-based monthly scale ecohydrological model (WaSSI) to detect vegetation-caused hydrologic changes. The WaSSI model [34,35,36] has been tested, validated, and compared to other water balance models in the southeastern US [35,36,37,38,39,40] WaSSI was applied to separate the impact of forest disturbance from climate variability on streamflow during the post-hurricane period (2018–2020).
The WaSSI model was used to calculate monthly ET, surface runoff, soil moisture, and baseflow for each HUC12 subwatershed land cover type using algorithms of the Sacramento Soil Moisture Accounting Model (SAC-SMA) [41,42]. There are 25 HUC12 sub-watersheds in the study watershed. In the WaSSI model, the soil profile is divided into a relatively thin upper layer and a much thicker lower layer that supplies moisture to meet ET demands [43]. Each layer consists of tension water storage (i.e., between soil water tensions of field capacity and the wilting plant point) and free water storage (i.e., soil water tension greater than field capacity). These layers interact to generate surface runoff, lateral water movement from the upper soil layer to the stream (interflow), percolation from the upper soil layer to the lower soil layer, and lateral water movement from the lower soil layer to the stream (baseflow). Monthly ET as water loss is calculated as a function of potential ET [44], precipitation, and leaf area index (LAI) as determined from multisite eddy covariance measurements [36]. Monthly Moderate Resolution Imaging Spectroradiometer (MODIS) LAI used for the WaSSI model was extracted from NASA’s Application for Extracting and Exploring Analysis Ready Samples (APPEEARS) (https://lpdaac.usgs.gov/tools/appeears/) (accessed on 13 January 2022). In addition, 4 km gridded PRISM climate data were used to drive the WaSSI model for validation and scenario runs.
To separate the impact of vegetation damage from climate effects on streamflow, two simulations, one Baseline with actual MODIS LAI and one Scenario assuming no change in LAI, were run from 2018 to 2020. In the Baseline simulation, WaSSI was parameterized using monthly LAI and the PRISM climate data from 2018 to 2020 (post-Hurricane Michael), while the Scenario simulation used monthly LAI from 2017 (i.e., representing no hurricane influence) to exclude the vegetation impact on flow. Therefore, the difference between Baseline and Scenario was the effect of vegetation change on flow.

3. Results

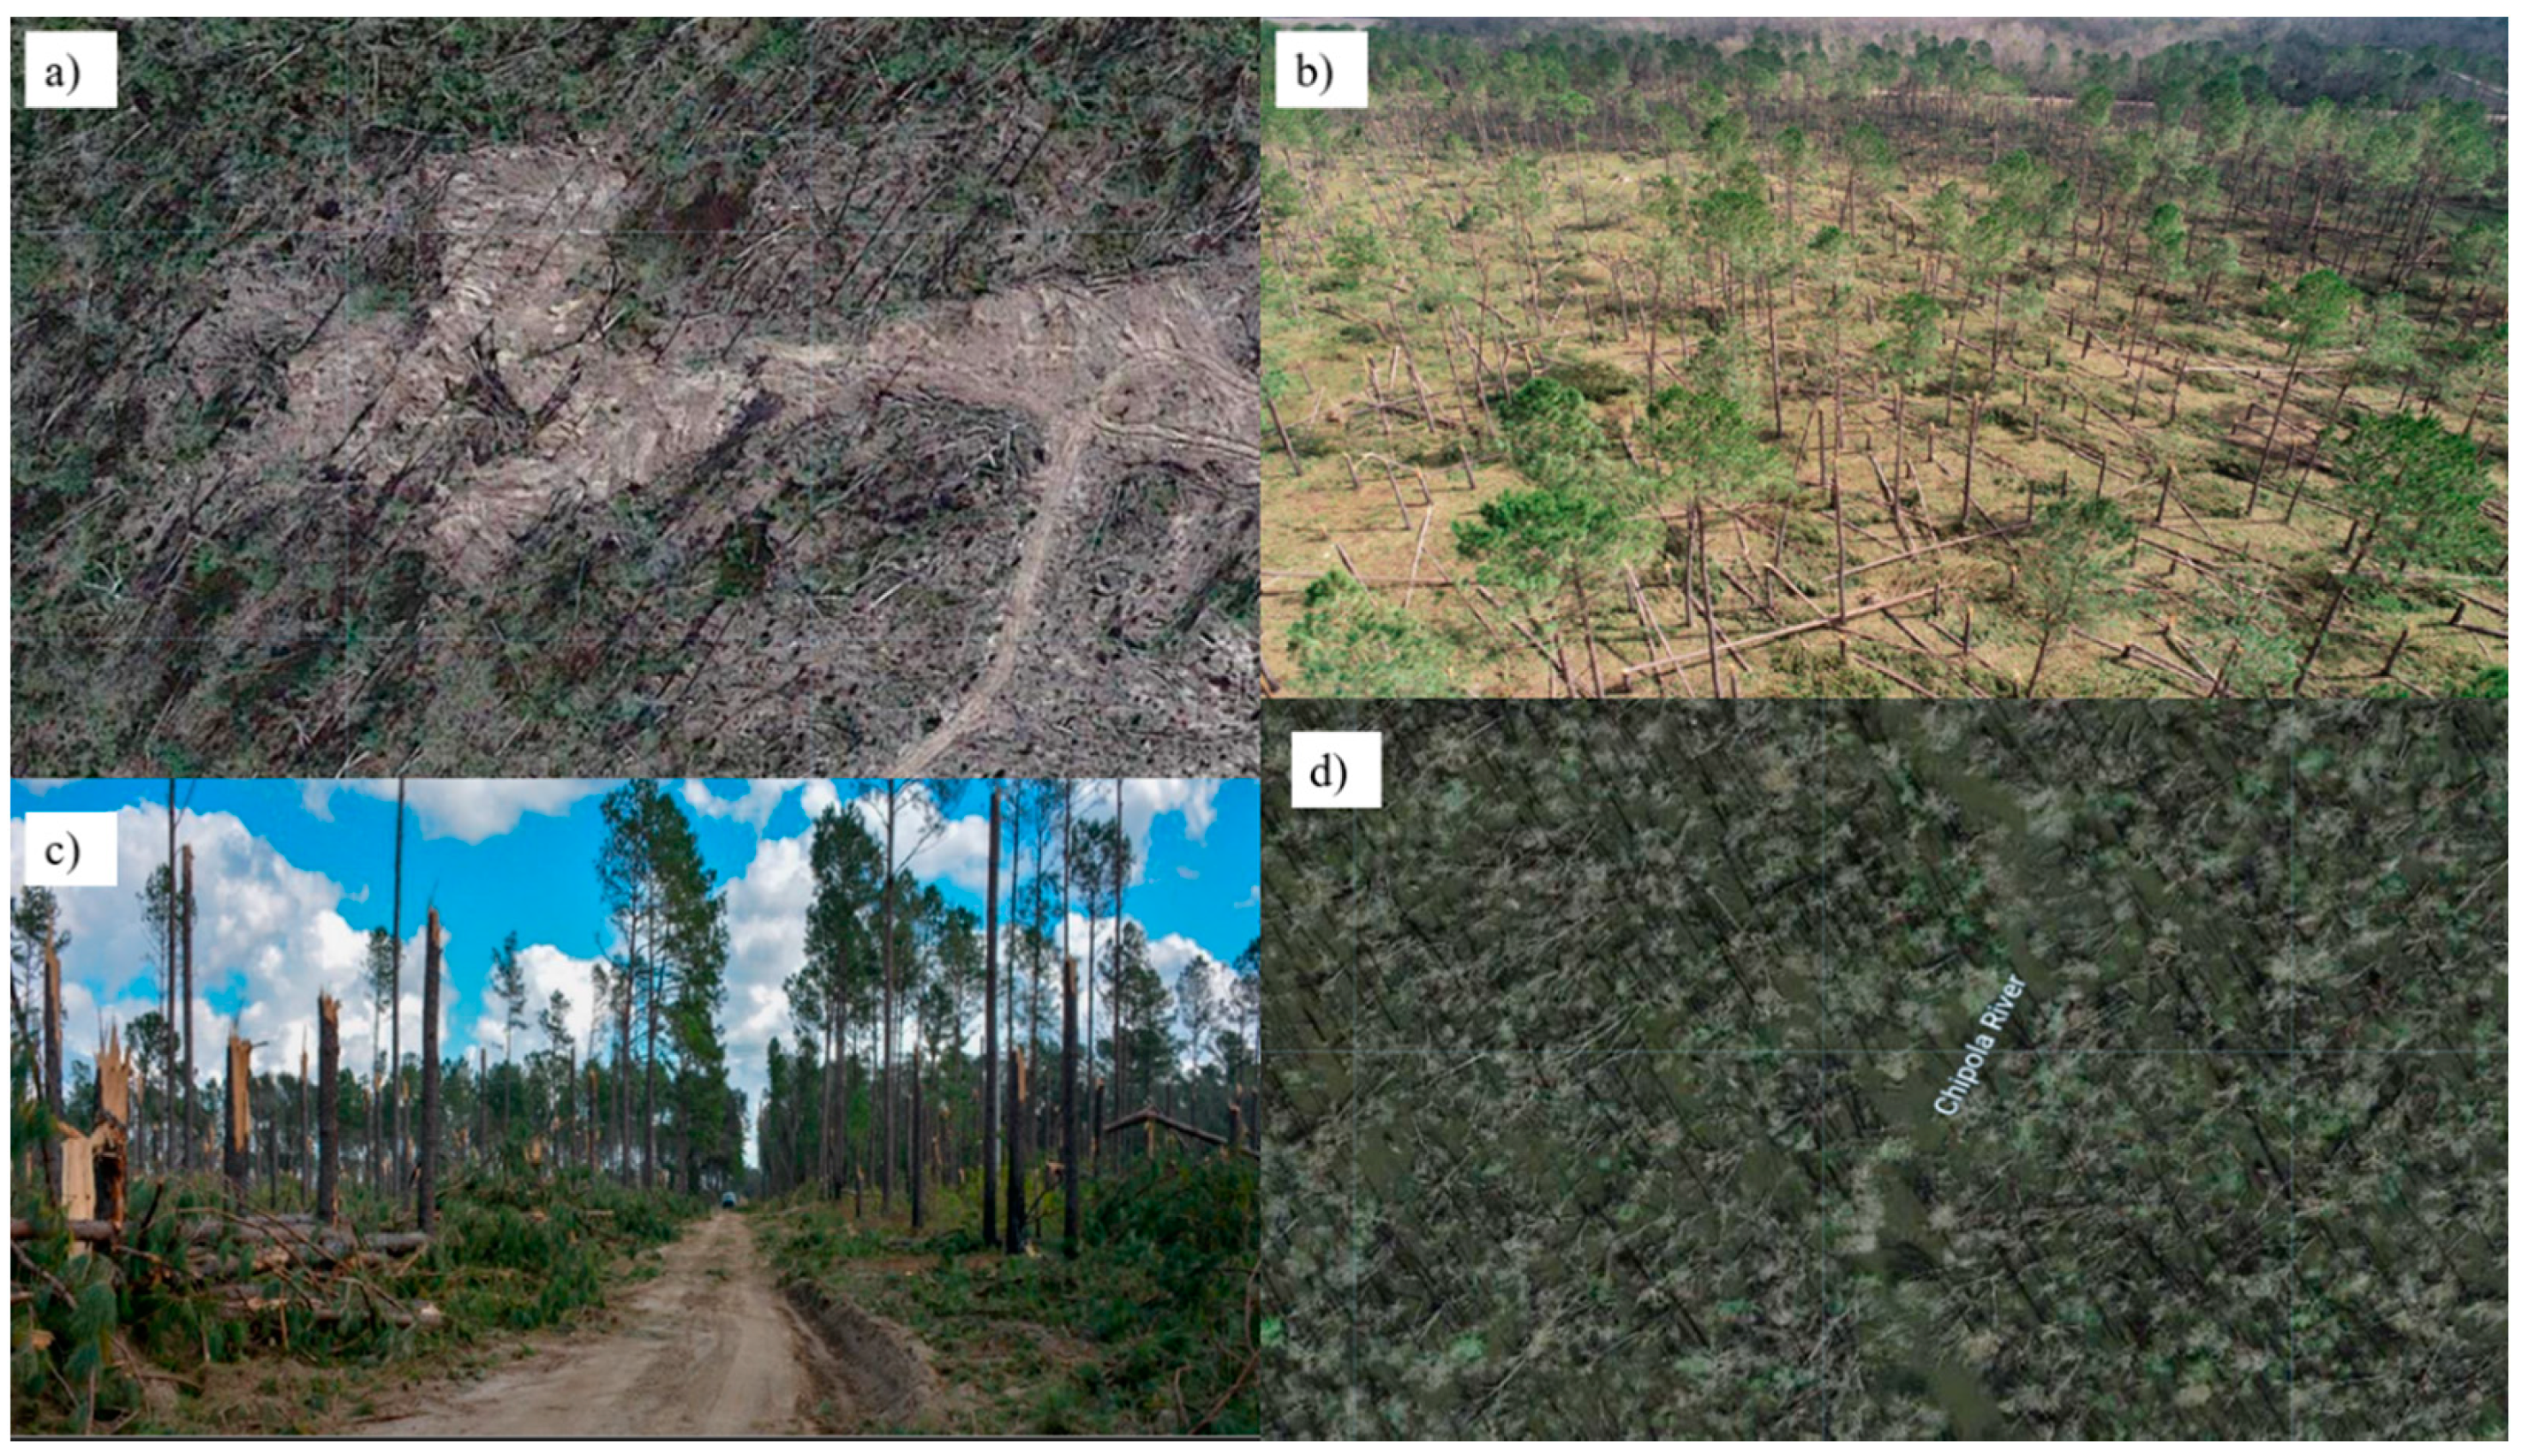
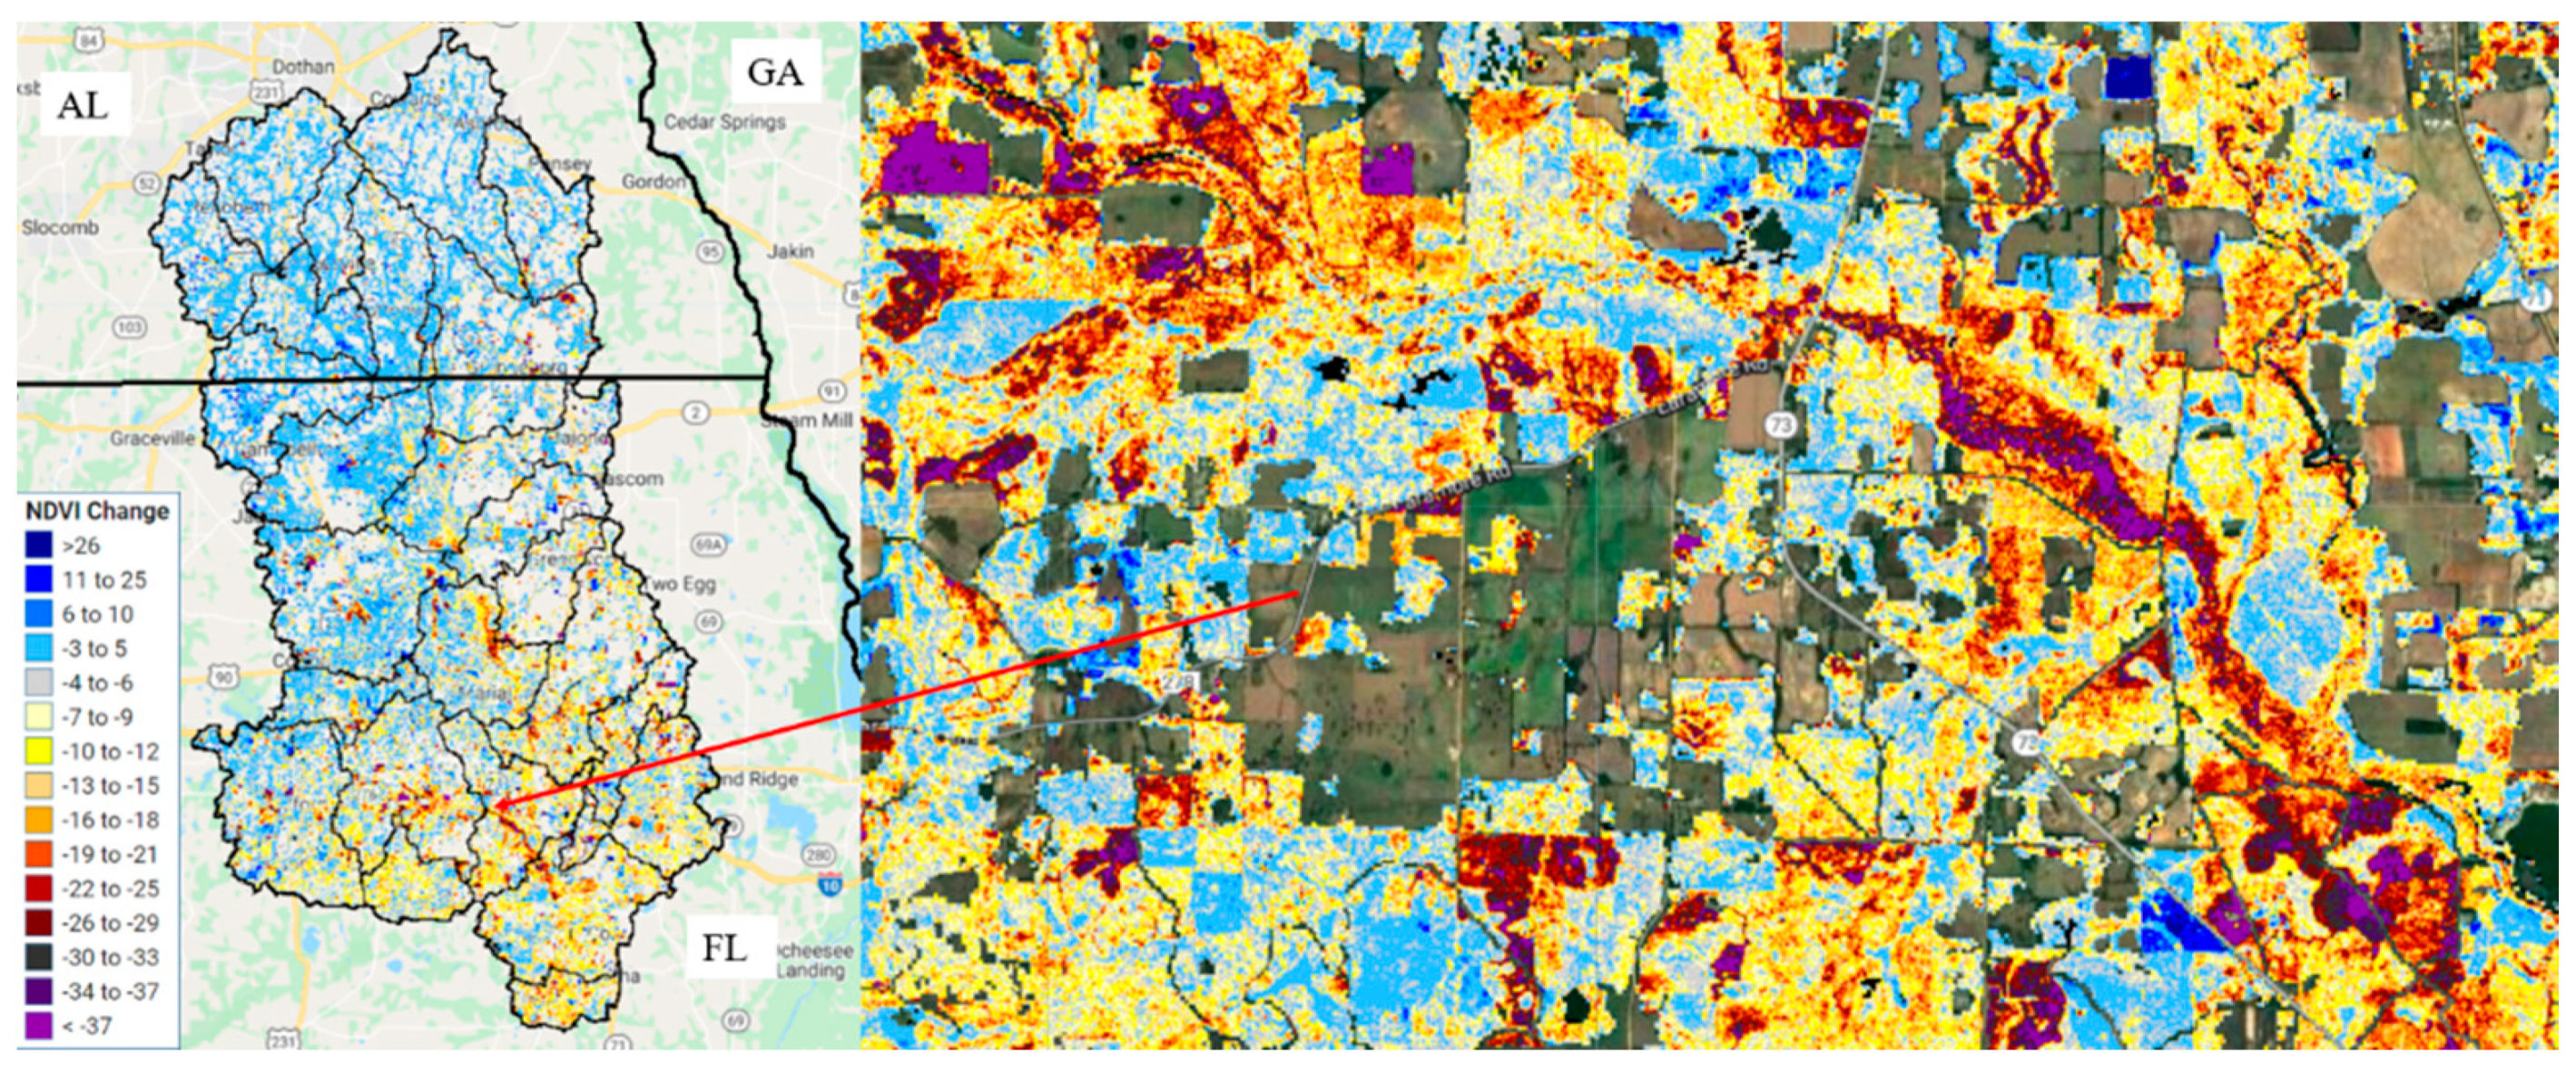
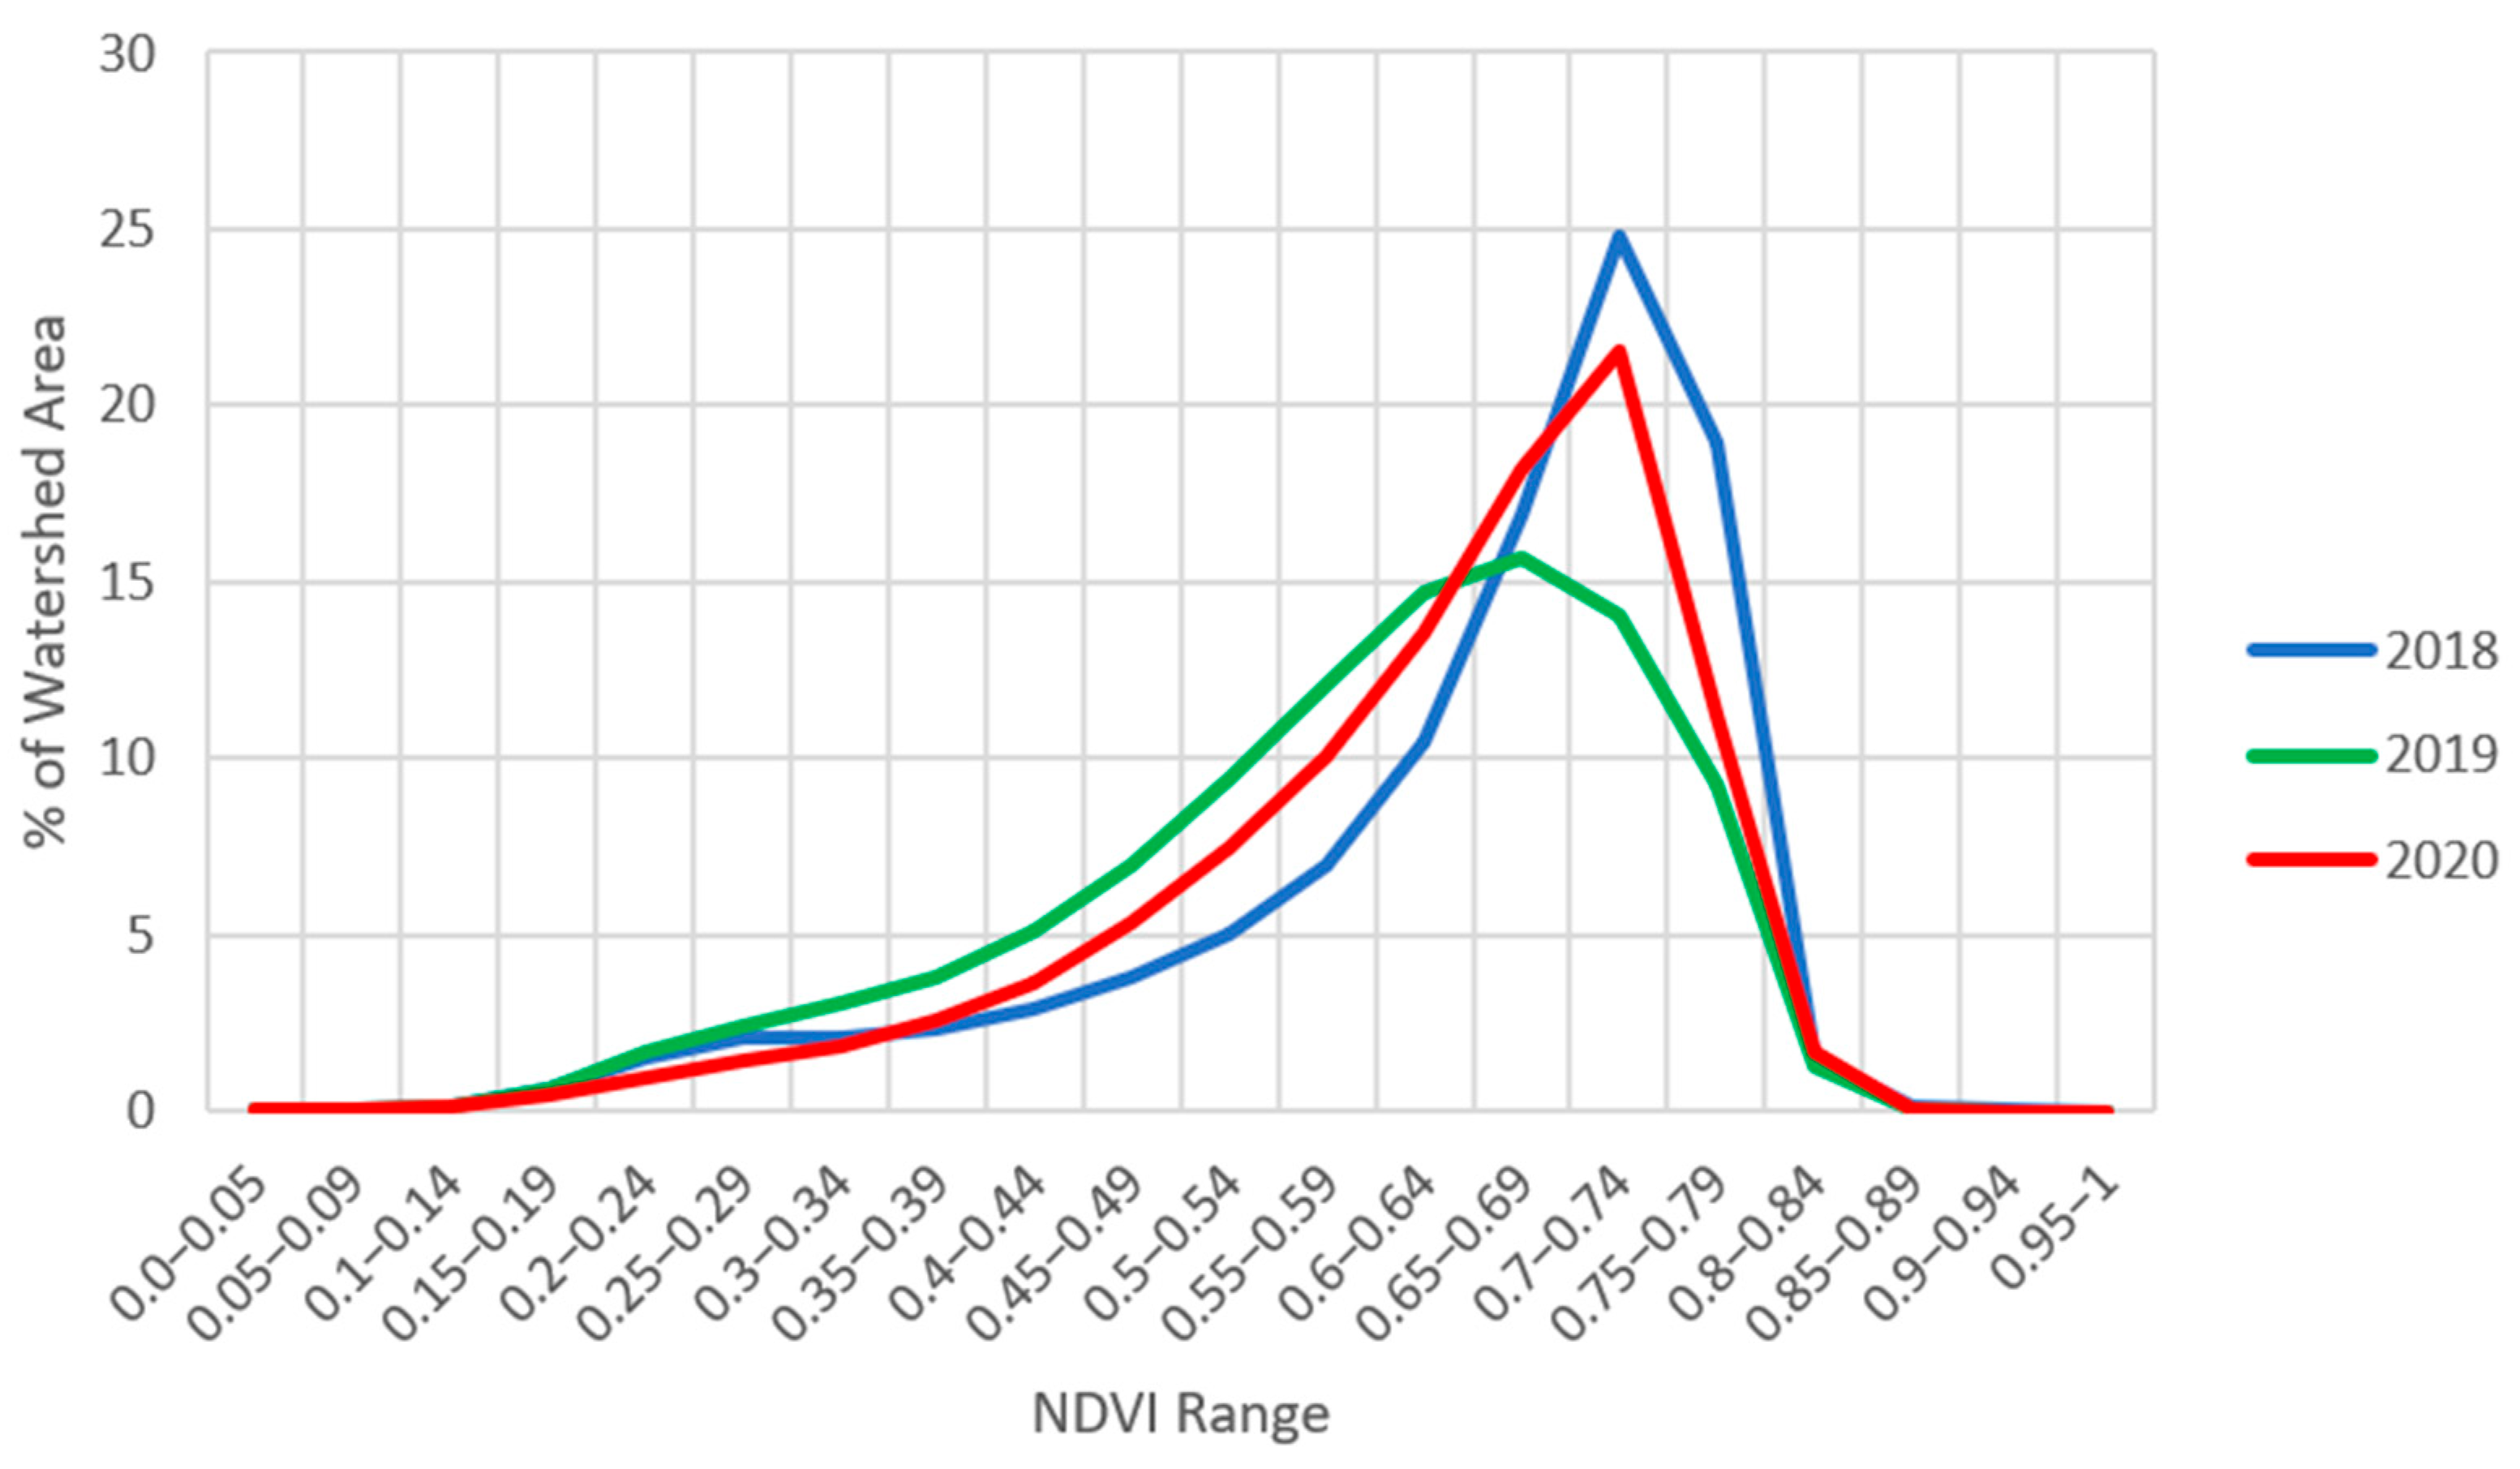
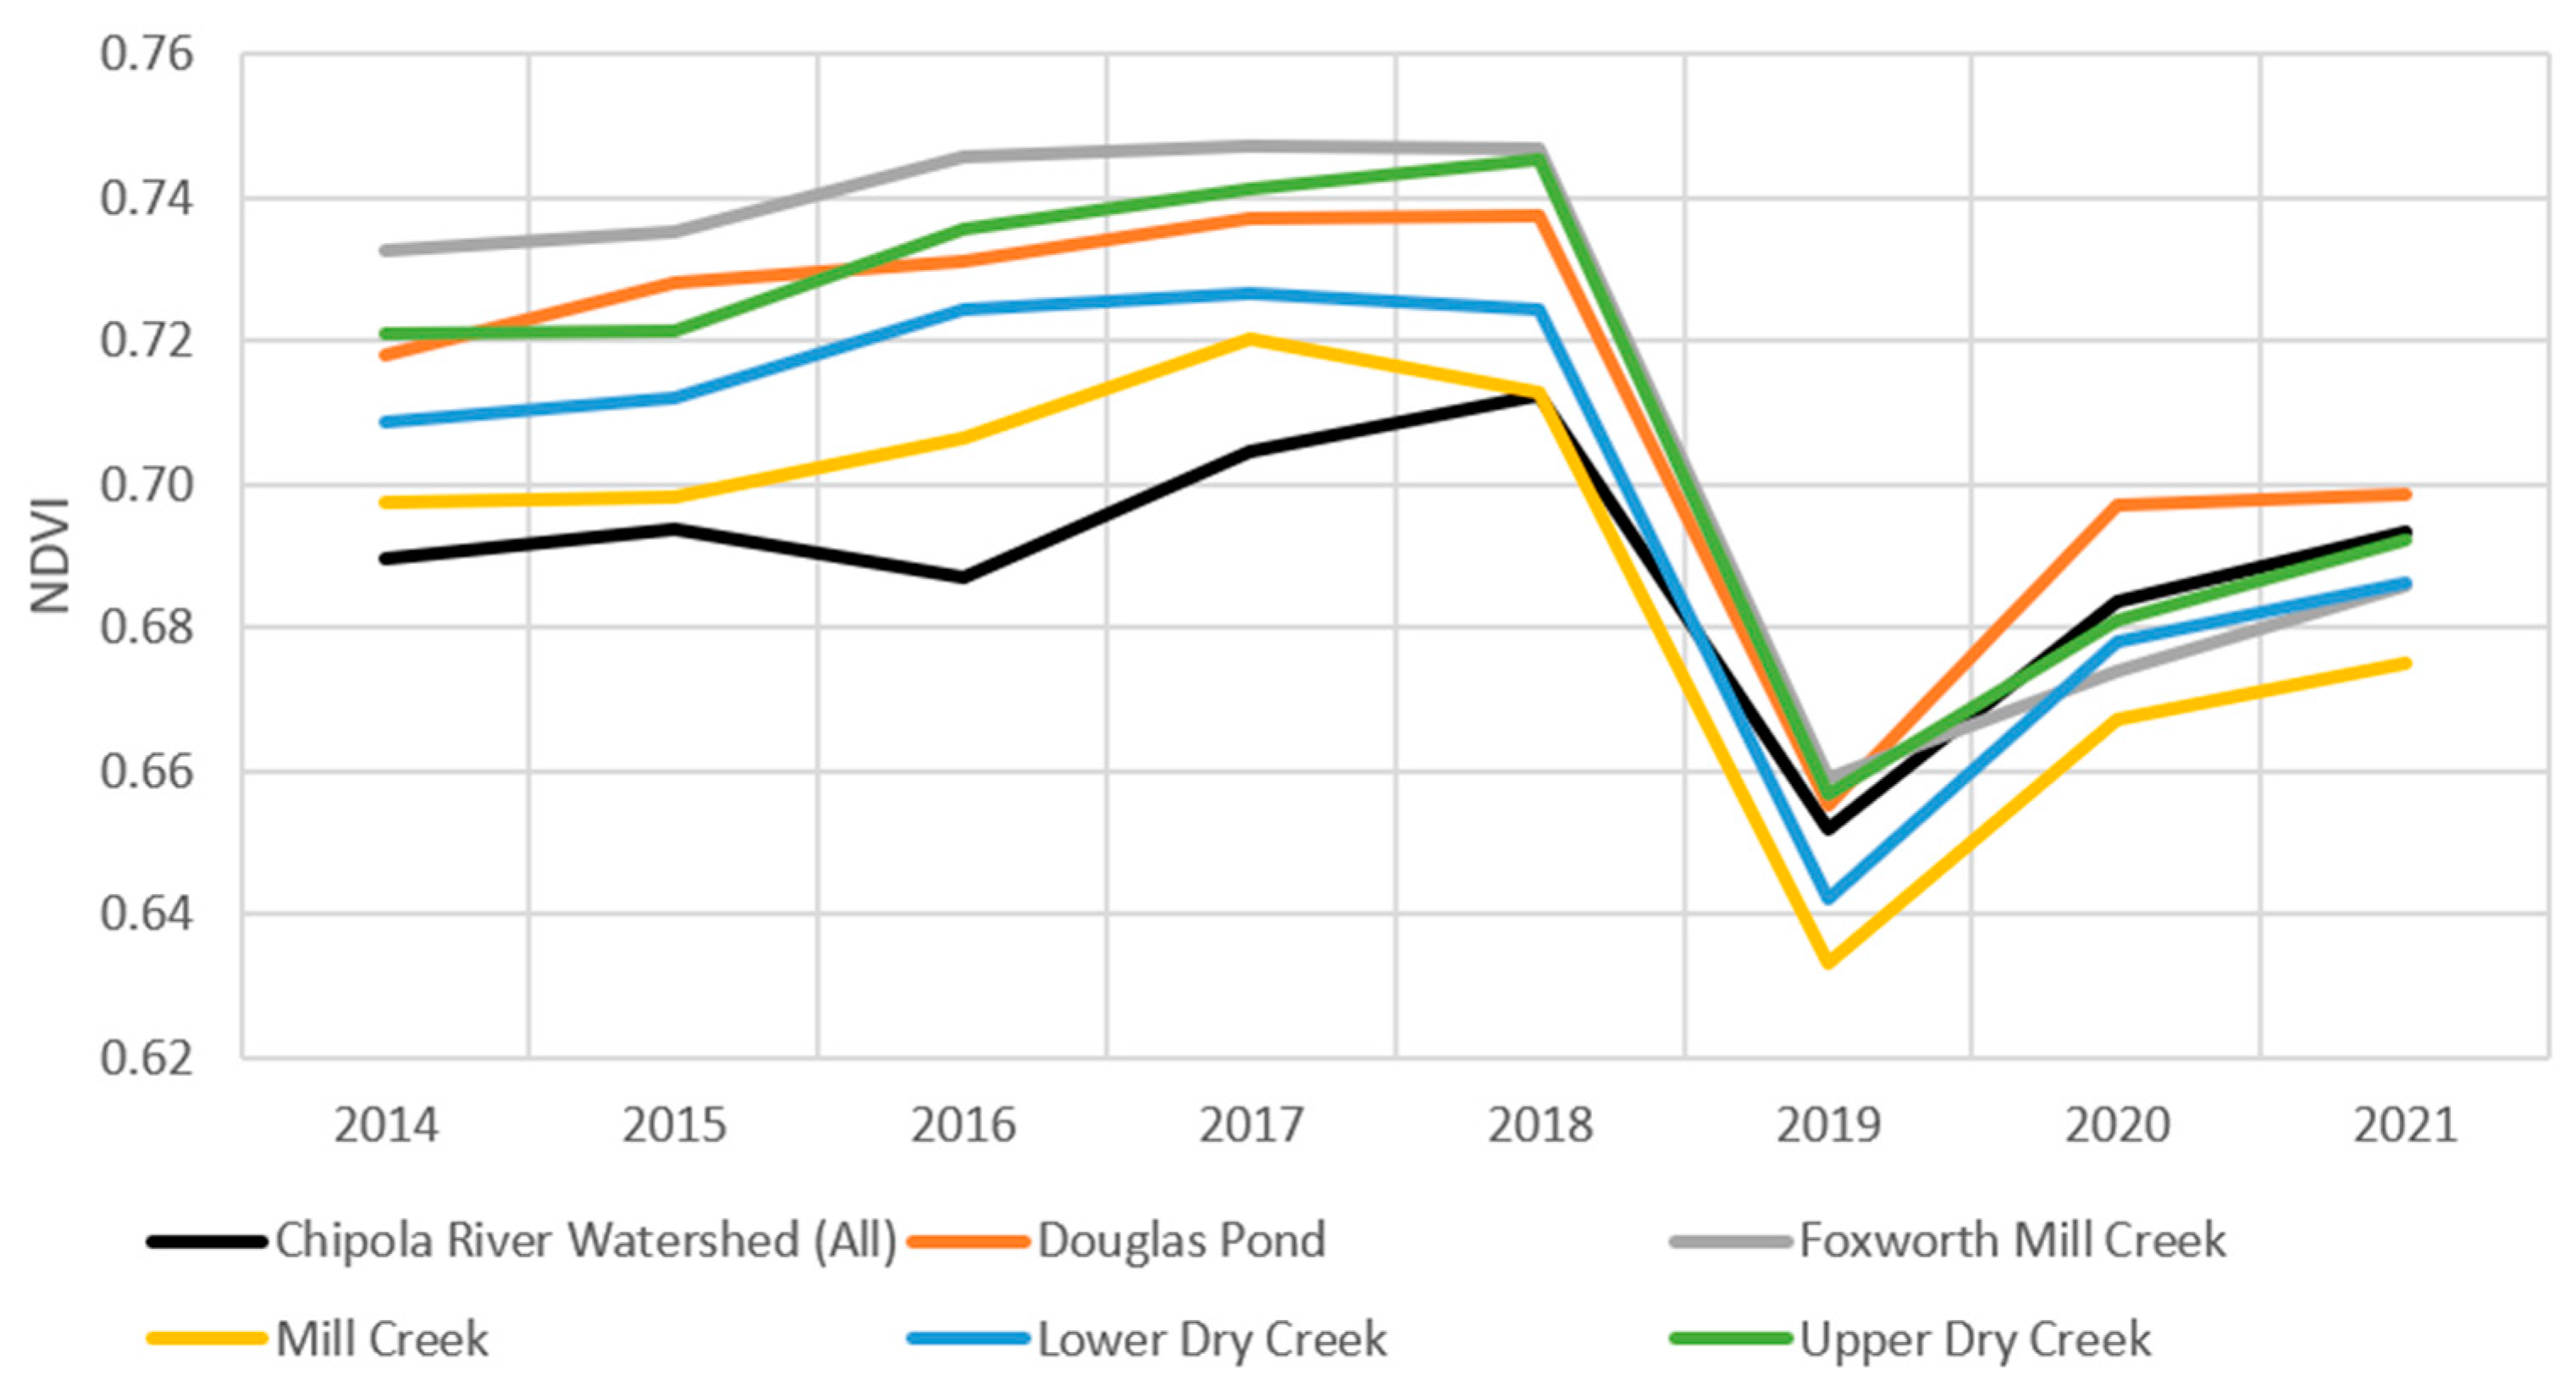
3.1. Forest Disturbance

Utilizing the capabilities of Earth Engine and Sentinel 2 imagery data, we found severe and large-scale forest disturbance within the southern portion of the Chipola River watershed (Figure 3). High-resolution satellite images depict broken stems, damaged crowns, and other impacts on managed forest stands and bottomland riparian systems buffering the Chipola River. These impacts correspond with the timber damage estimates listed in the reports issued by the Alabama, Florida, and Georgia Forestry Commissions. An overall shift in the frequencies of NDVI values between the 2018 and 2019 growing seasons is shown in Figure 4. The average NDVI value dropped from 0.64 to 0.59, illustrating a significant shift to lower values (p < 0.0001). From the 2019 to 2020 growing season, a positive NDVI change was observed (p < 0.0001). This recovery could be explained by the regrowth of early successional species, natural regeneration of previous overstory species, and artificial regeneration efforts by land managers within the area.
Pronounced changes in the growing season MODIS NDVI occurred in five of the HUC12 sub-watersheds close to Hurricane Michael’s path (Figure 5). A significant decline (p-value = 0.04) in NDVI (>10%) was observed for those sub-watersheds in 2019 compared to 2018, and a slight vegetation recovery was seen in 2020. A sharp decrease in growing season NDVI between 2018 and 2019 is illustrated in Figure 5 using the MODIS remote sensing product.

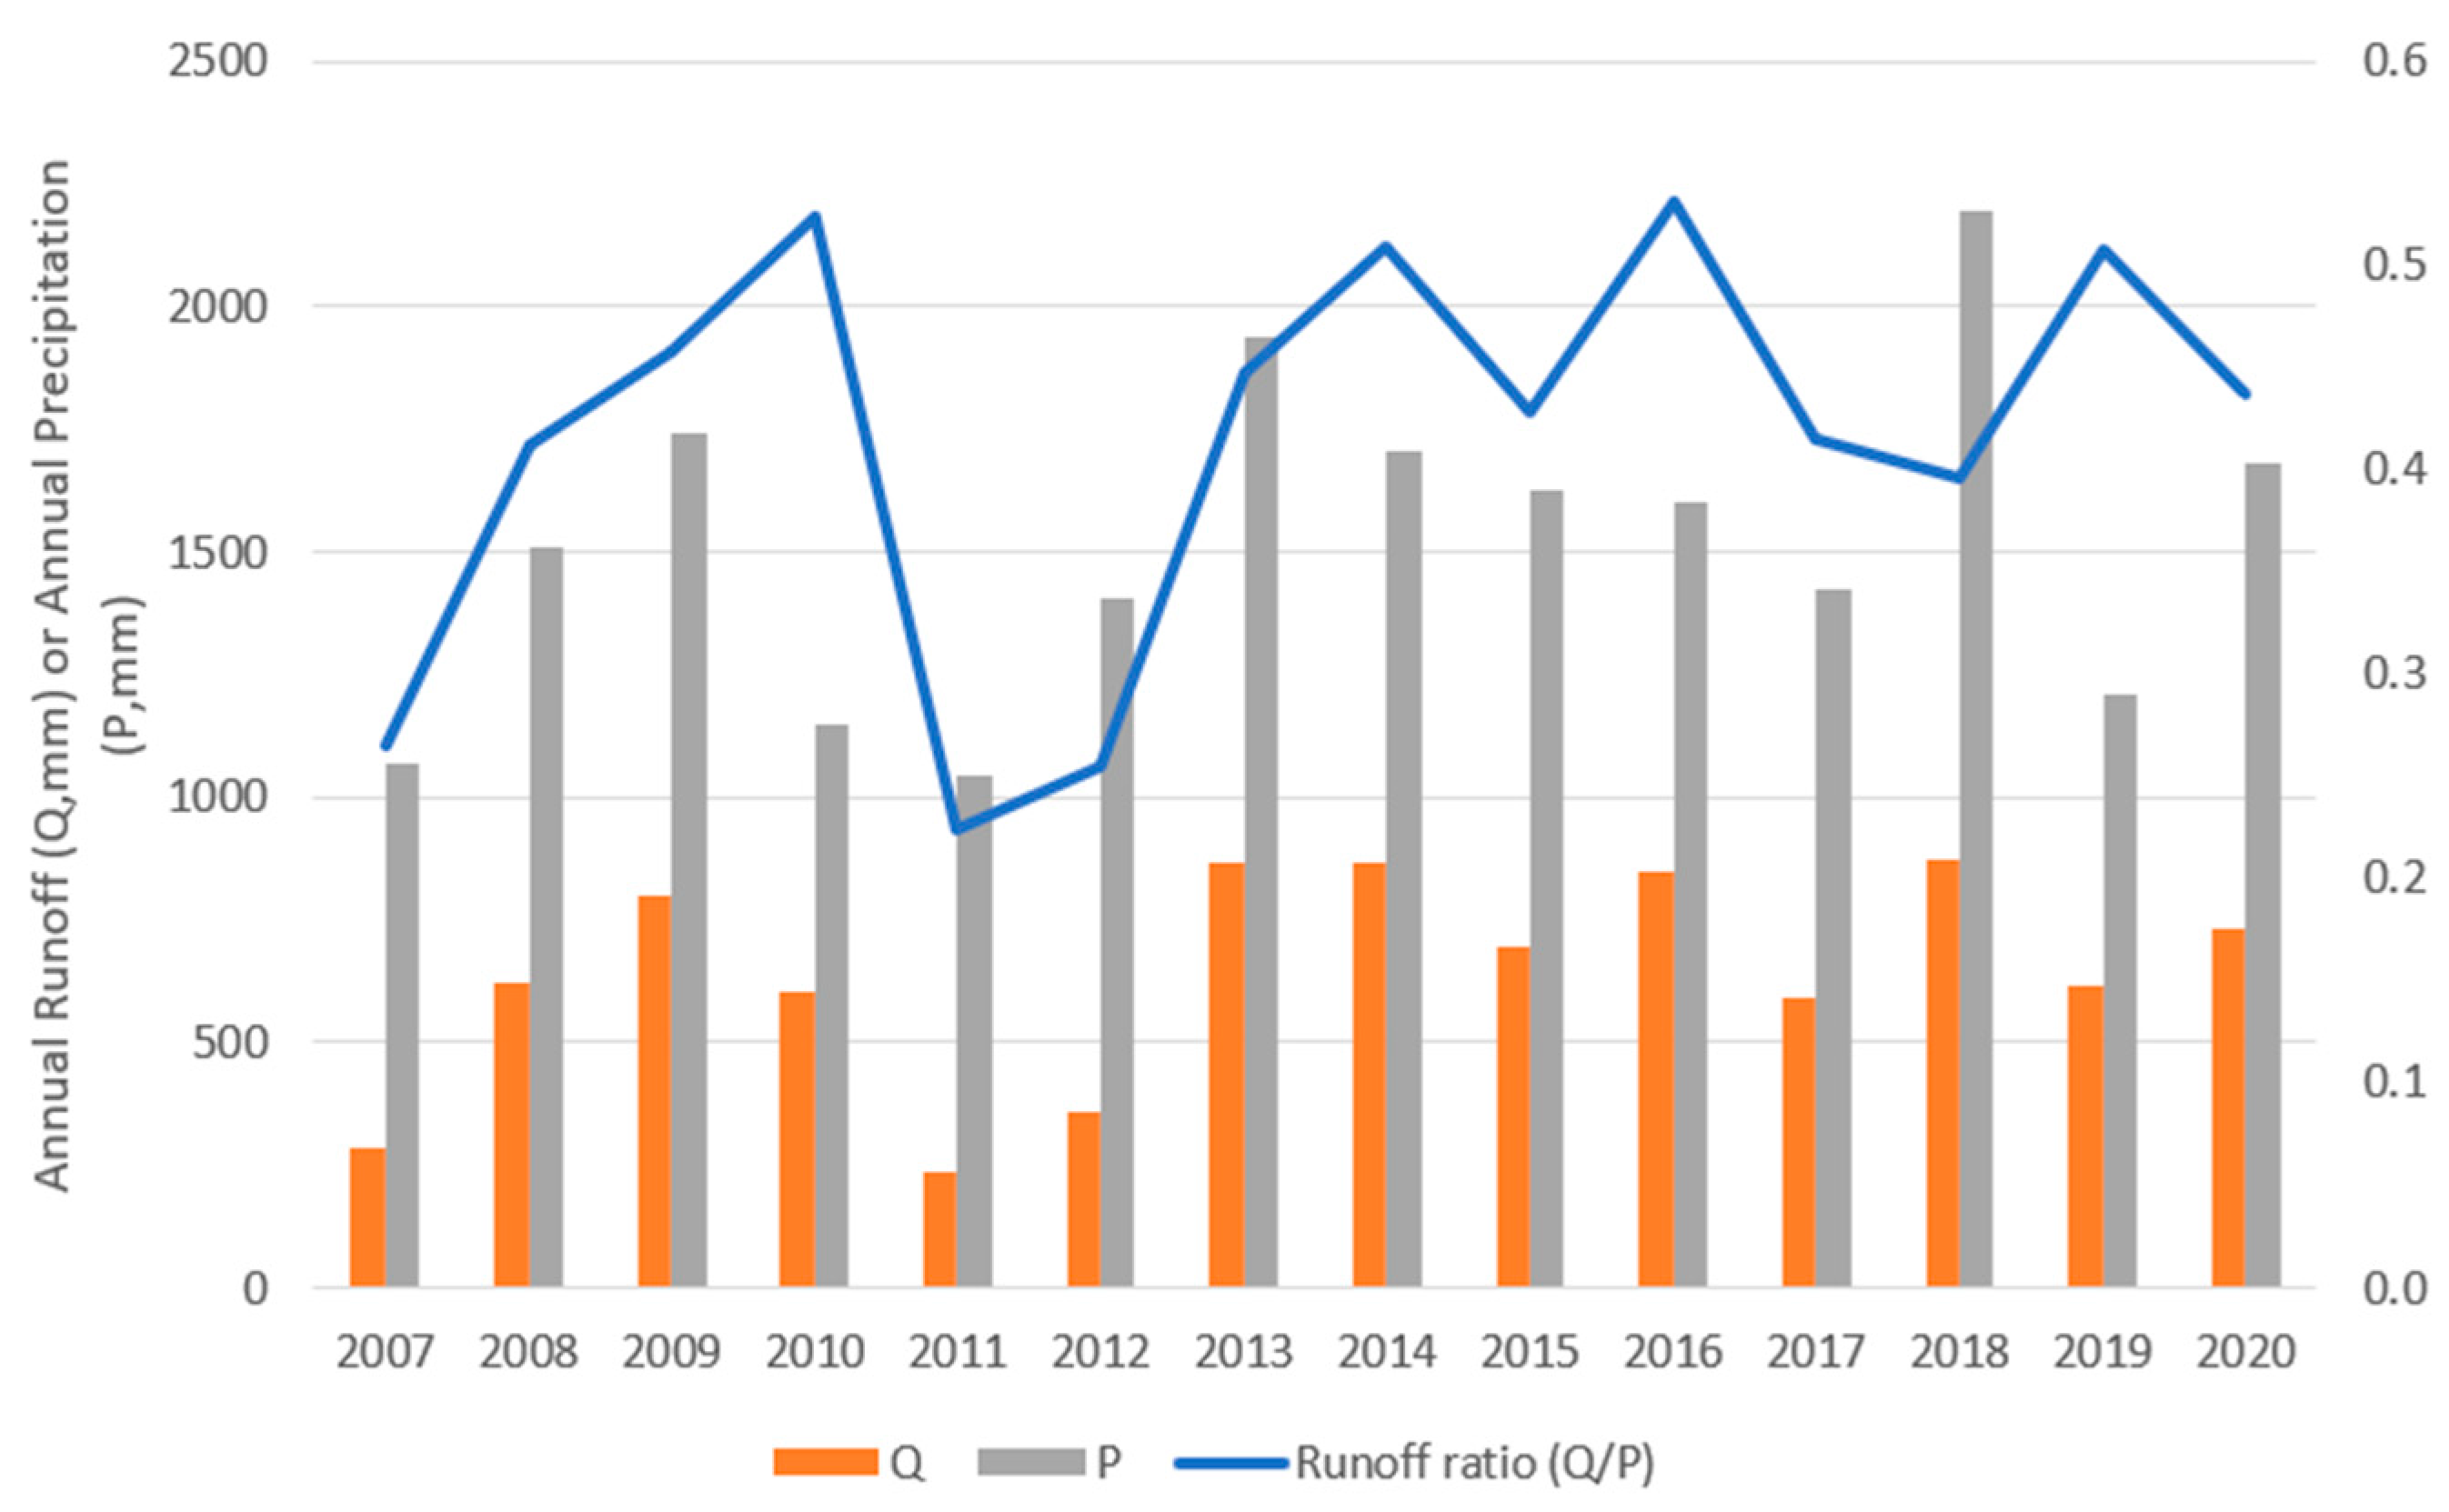
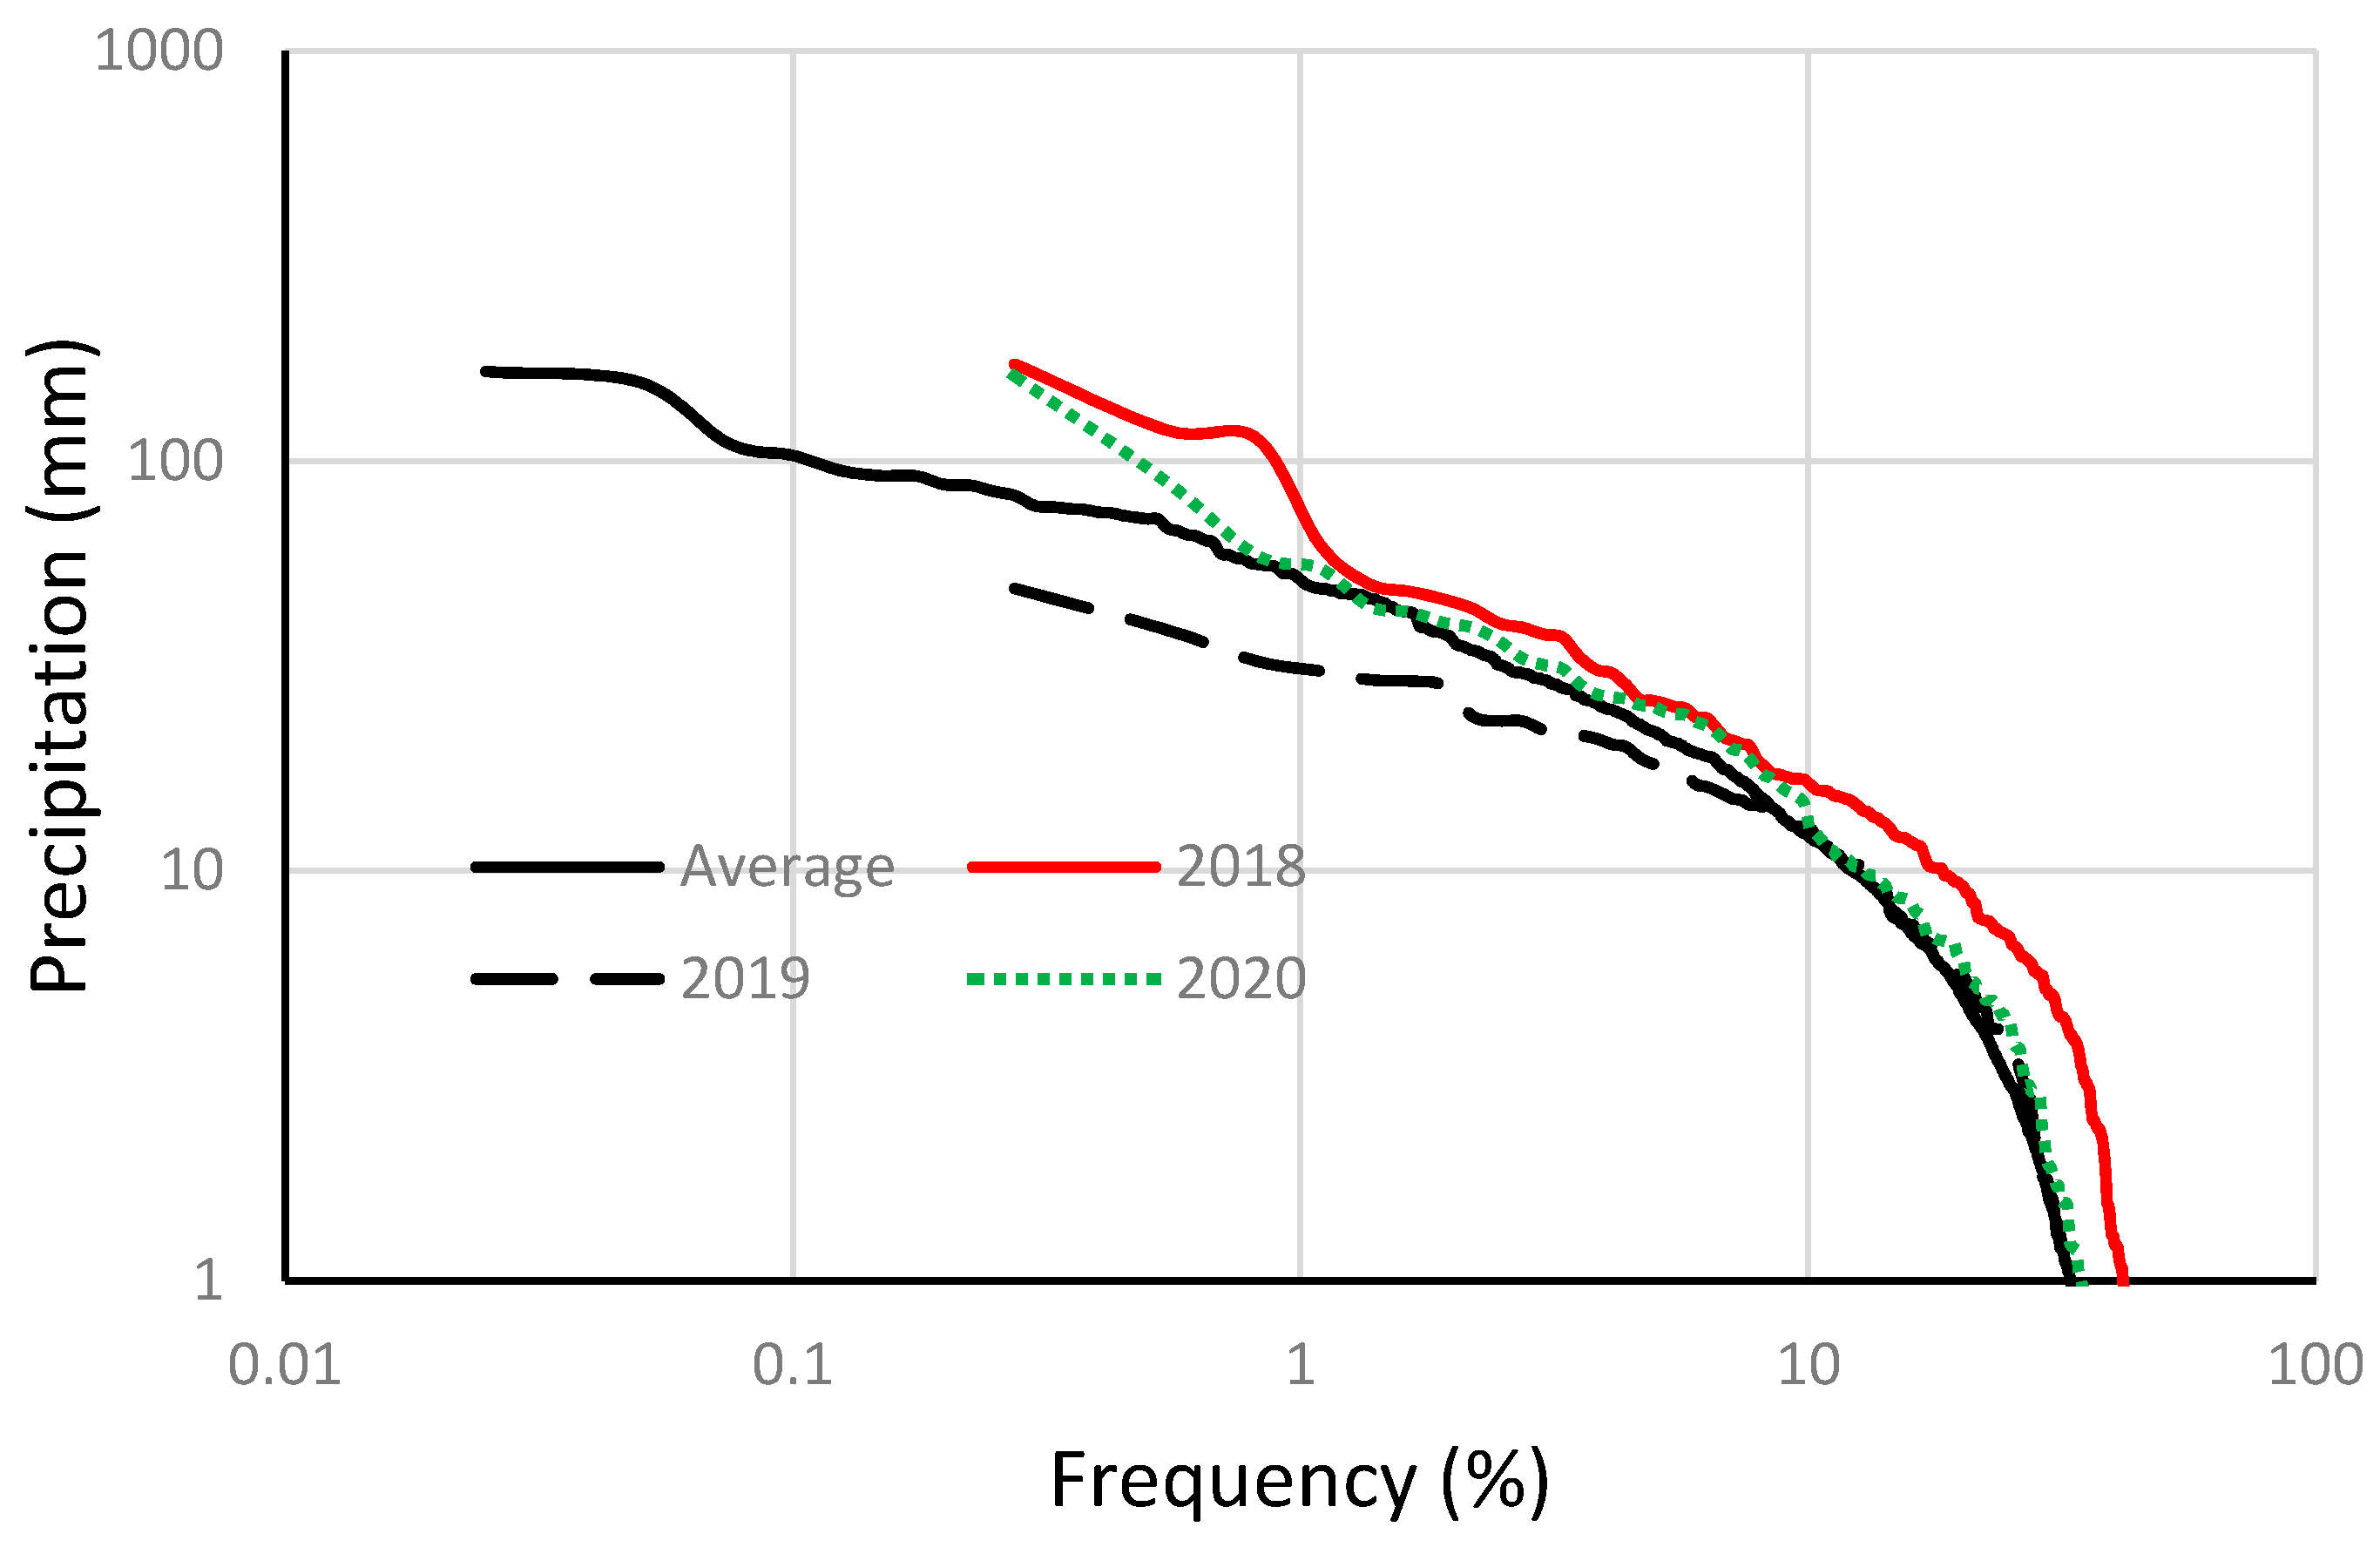
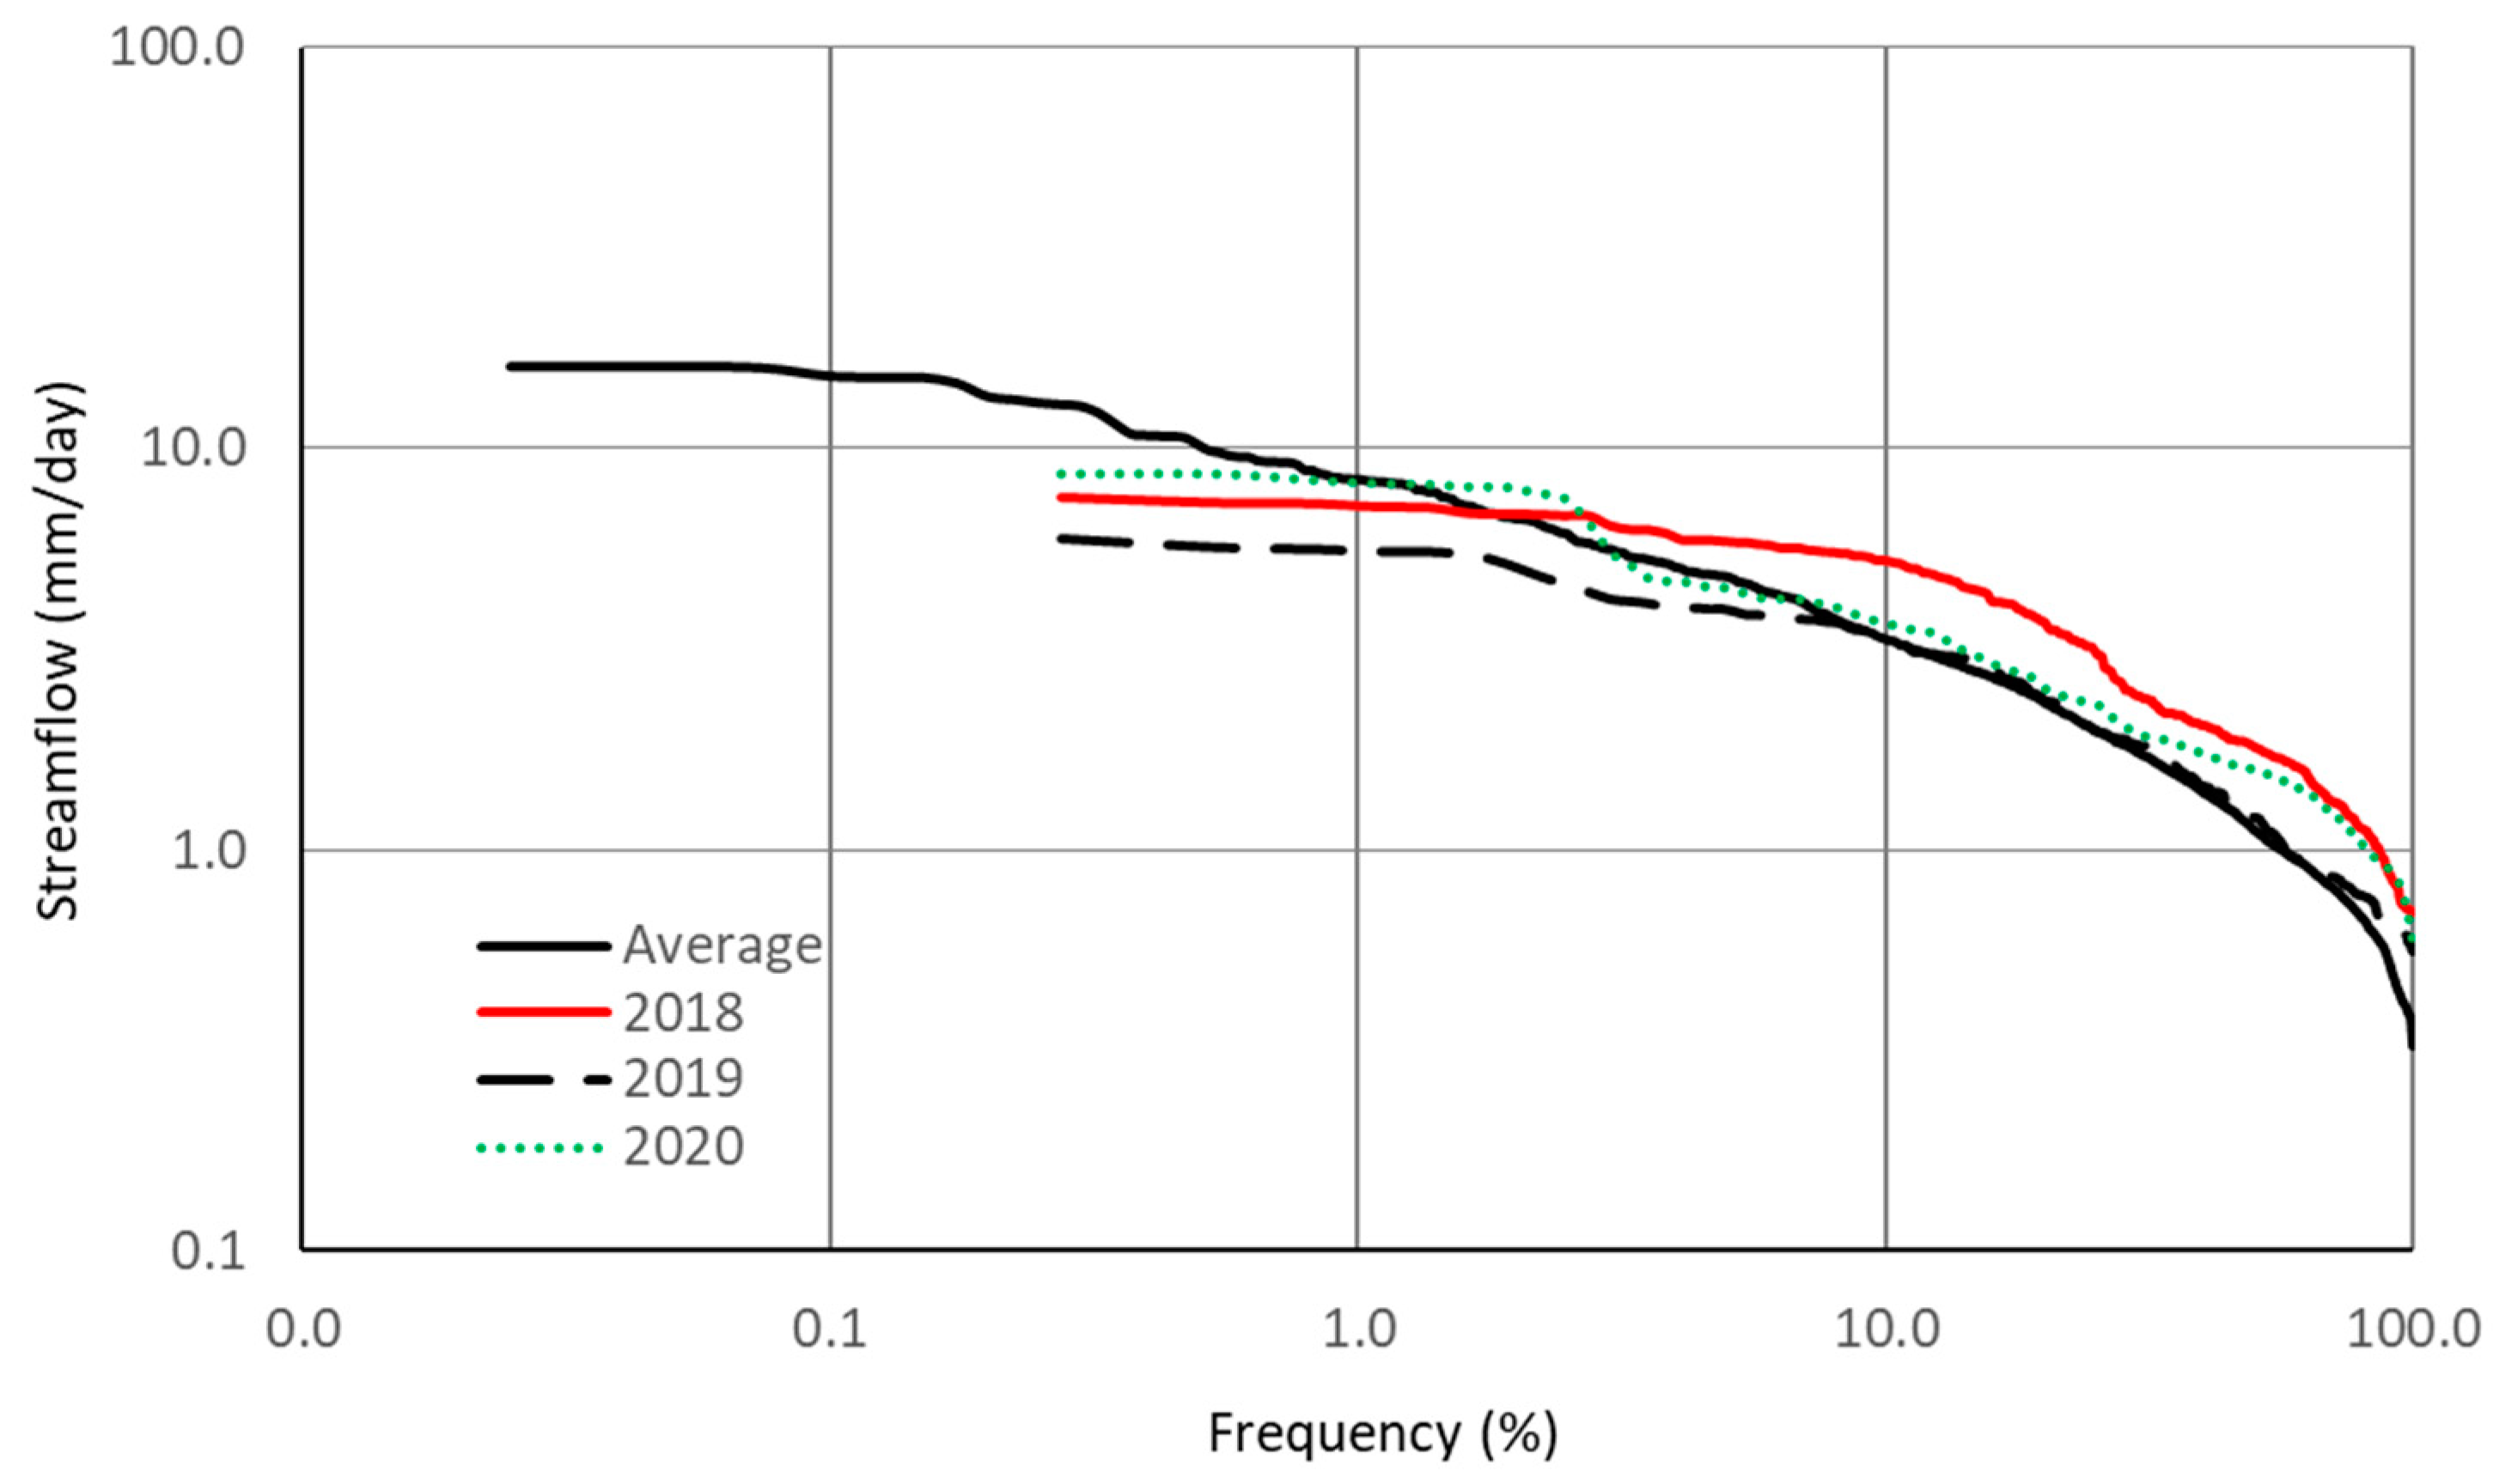
3.2. Precipitation and Streamflow Distribution

During the ten years before the storm, the average annual precipitation in the Chipola River watershed was 1463 mm. This precipitation compares to a yearly total of 2205 mm in 2018, the year Hurricane Michael hit in October. During the three months after the hurricane (October, November, and December of 2018), monthly precipitation totals were 187%, 168%, and 102% higher than the 10-year monthly means. The watershed received below-average rainfall for most months in 2019 compared to the long-term averages. Throughout 2020, precipitation across the watershed was recorded at near-normal rates.
During the ten years before Hurricane Michael (2007–2017), the Chipola River’s mean daily watershed discharge was approximately 1392 cubic feet per second or 1.7 mm/day. During this period, the average gauge height was approximately 11 ft (3.4 m). During 2018, the daily average discharge increased to 1971 cubic feet per second or 2.4 mm per day; however, this increase was not significant (p > 0.05). In the month of the hurricane event (October 2018), streamflow rates were 230% higher than the 10-year pre-hurricane flow values. These discharge rates were sustained into November 2018. Streamflow rates decreased by an average of 18% in 2019 compared to the 10-year average rates. Near-normal discharge rates were recorded over the majority of the 2020 year until observed streamflow were recorded at above-average rates from September through December. At the annual scale, the 2018 streamflow (870 mm) was much higher, but not significant, compared to 10-year “normal” values (642 mm) (p > 0.05). During the following two years, streamflow values were lower (614 mm in 2019) and higher (733 mm in 2020) than the long-term mean but were not significantly different from this mean (p > 0.05). However, the runoff–rainfall ratio (Q/P) (0.40) in 2018 was similar to the long-term mean (0.42). The Q/P for 2019 was 0.51, close to the record high (0.53) that occurred in 2016 after a tropical storm and a category 1 hurricane, both tracked near the Chipola River watershed, but Q/P was recorded at 0.44 in 2020. Measured discharge, precipitation, and corresponding runoff–rainfall ratio for 2007–2020 are shown in Figure 6.
Daily rainfall in 2018 was much above the historical daily average. Additionally, the 2018 storm frequency (all degrees of intensity) was much above the historic storm frequency, Figure 7). Daily rainfall distributions in 2019 and 2020 were close to the historical means for over 95% of rainfall events. However, fewer storms produced less than 20 mm of precipitation during 2019 and 2020 compared to the historic period.
Daily streamflow rates in 2018, similar to precipitation patterns, were higher than the 10-year average for all categories (Figure 8). However, most 2020 streamflow rates (exceedance > 10%) were higher than historical data. For 2019, streamflow distribution was similar to historical patterns but was lower in high flow categories (exceedance < 10%).

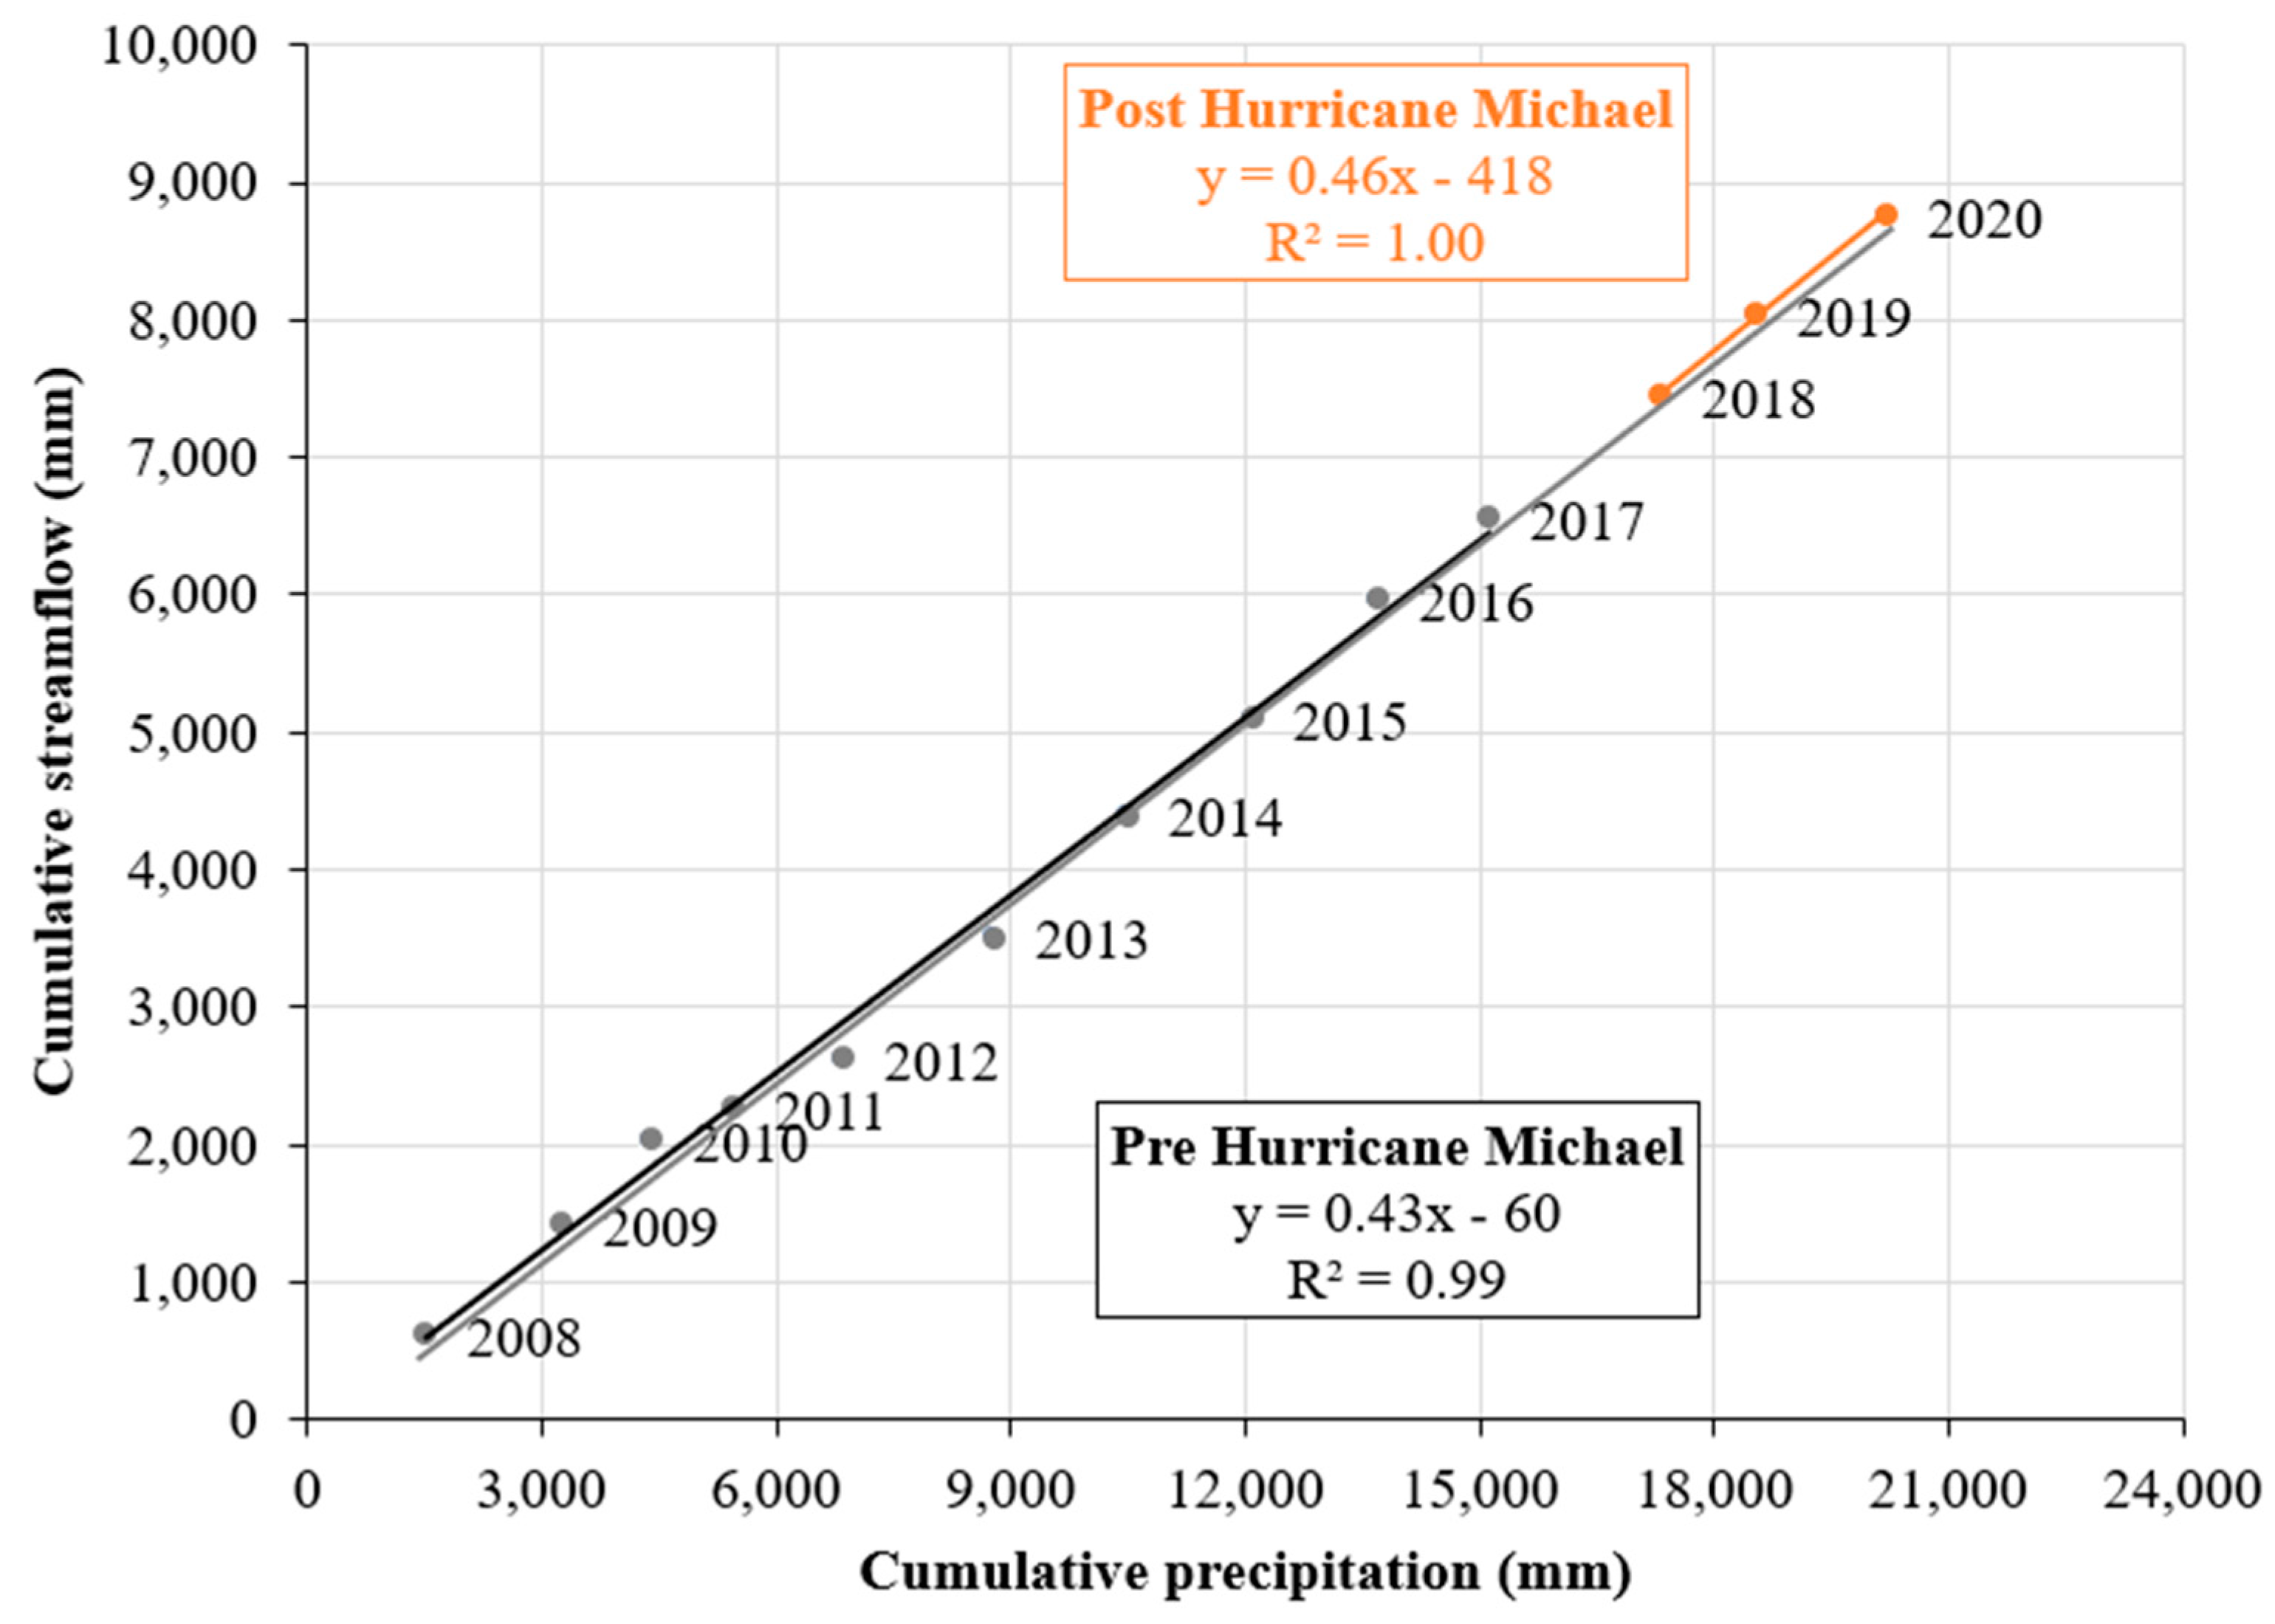
3.3. Streamflow Deviation Due to Hurricane Michael as Determined by the Double Mass Curve (DMC) Method

The DMC curve (Figure 9) shows that 2018 had the expected flow, but 2019 had no significant departure from the regression line developed using 2007–2017 (p > 0.05). Based on the DMC for pre-Hurricane Michael, the expected accumulative flow was 8371 mm in 2019 compared to the measured flow of 8249 mm, suggesting a negative accumulative flow deviation of 121 mm. Because the accumulative deviation in 2018 was −215 mm, the actual flow change in 2019 was determined as 94 mm. Similarly, the change in streamflow of 11 mm was detected for 2020. DMC theory attributed these changes to factors beyond precipitation, such as vegetation change that affected ET. Therefore, the detected magnitudes of increased flow (11–91 mm) were considered within the modeling errors and not significant statistically. From 2007 to 2017, flow change due to factors beyond precipitation by the DMC model varied from +163 mm to −246 mm. Therefore, the slopes of the regression models (0.43 vs. 0.46) for the two periods were not significant (p > 0.1).
Compared to the average annual flow rate of 660 mm/year for the study watershed, the hurricane effect on stream discharge in 2018 is minor and appears insignificant (p > 0.05). However, the double mass curve also showed an alteration to hydrology beginning in the summer of 2012 and lasting into early 2014. This alteration was characterized by a shift to lower streamflow rates, possibly in response to a severe drought event occurring within the same time frame over southeast Alabama and northwestern Florida. This indicates that results by the DMC method might be influenced by extreme drought events when the normal rainfall–runoff relationships change under such conditions.

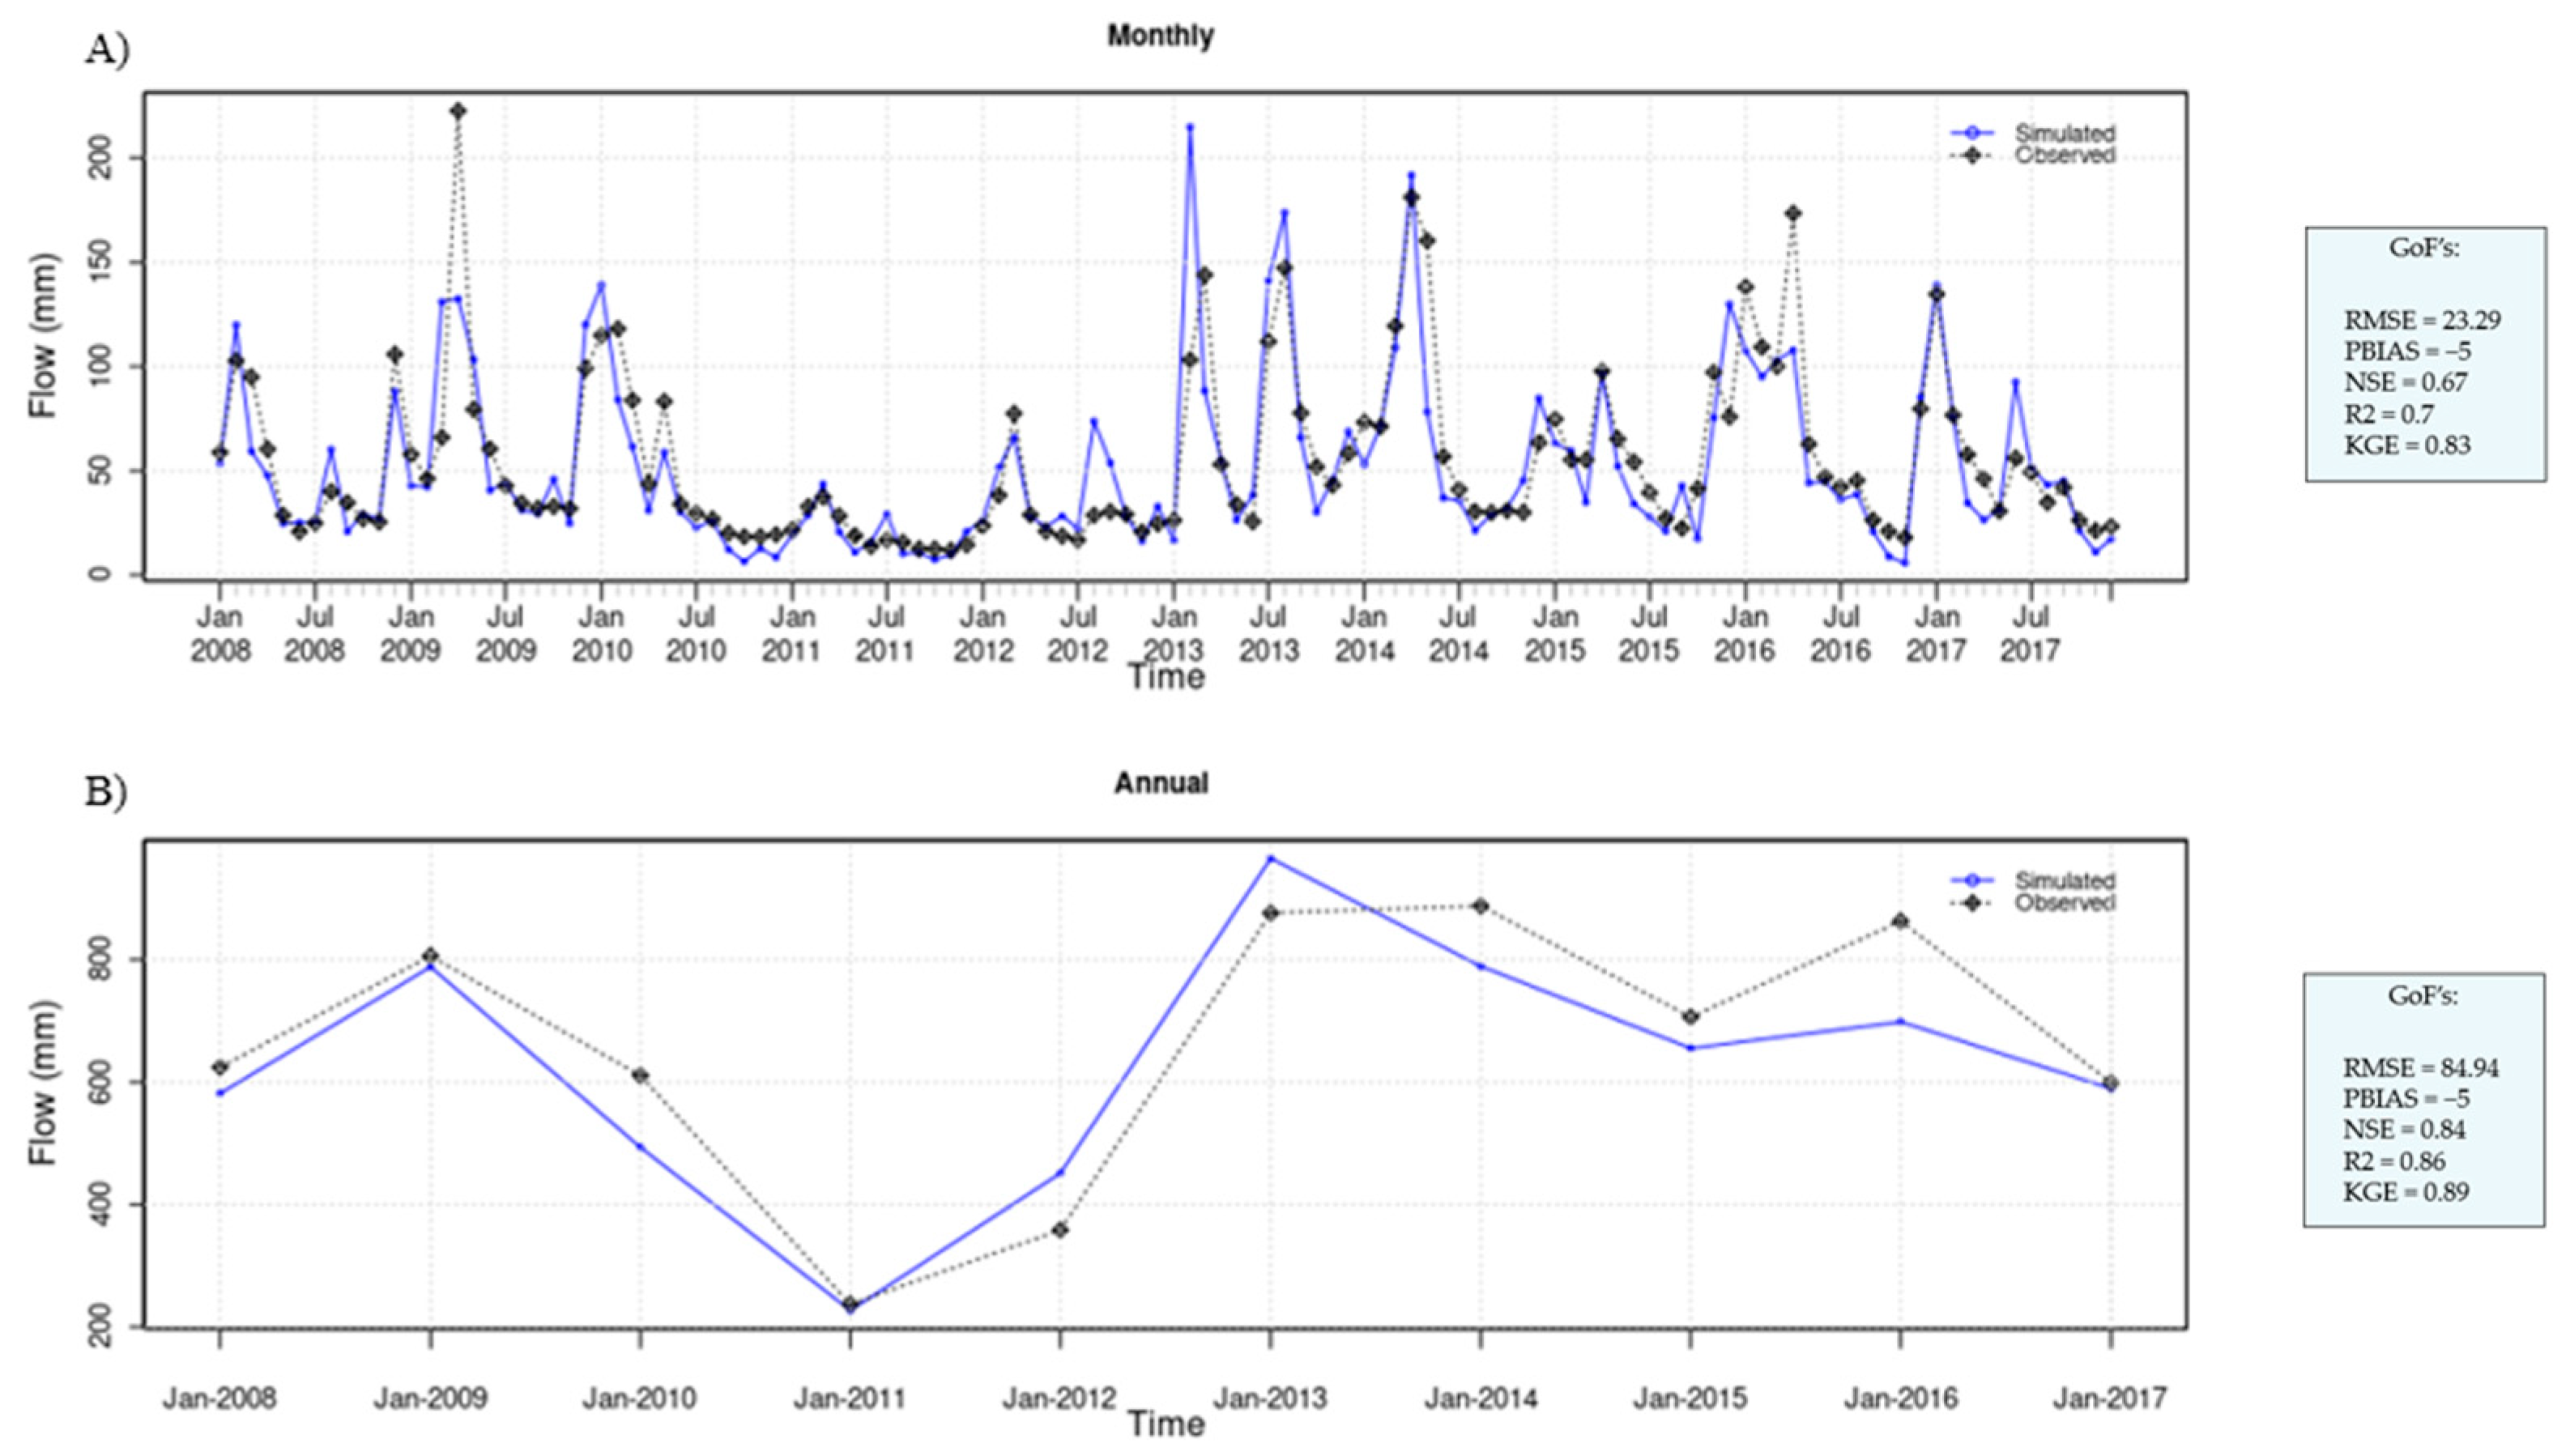
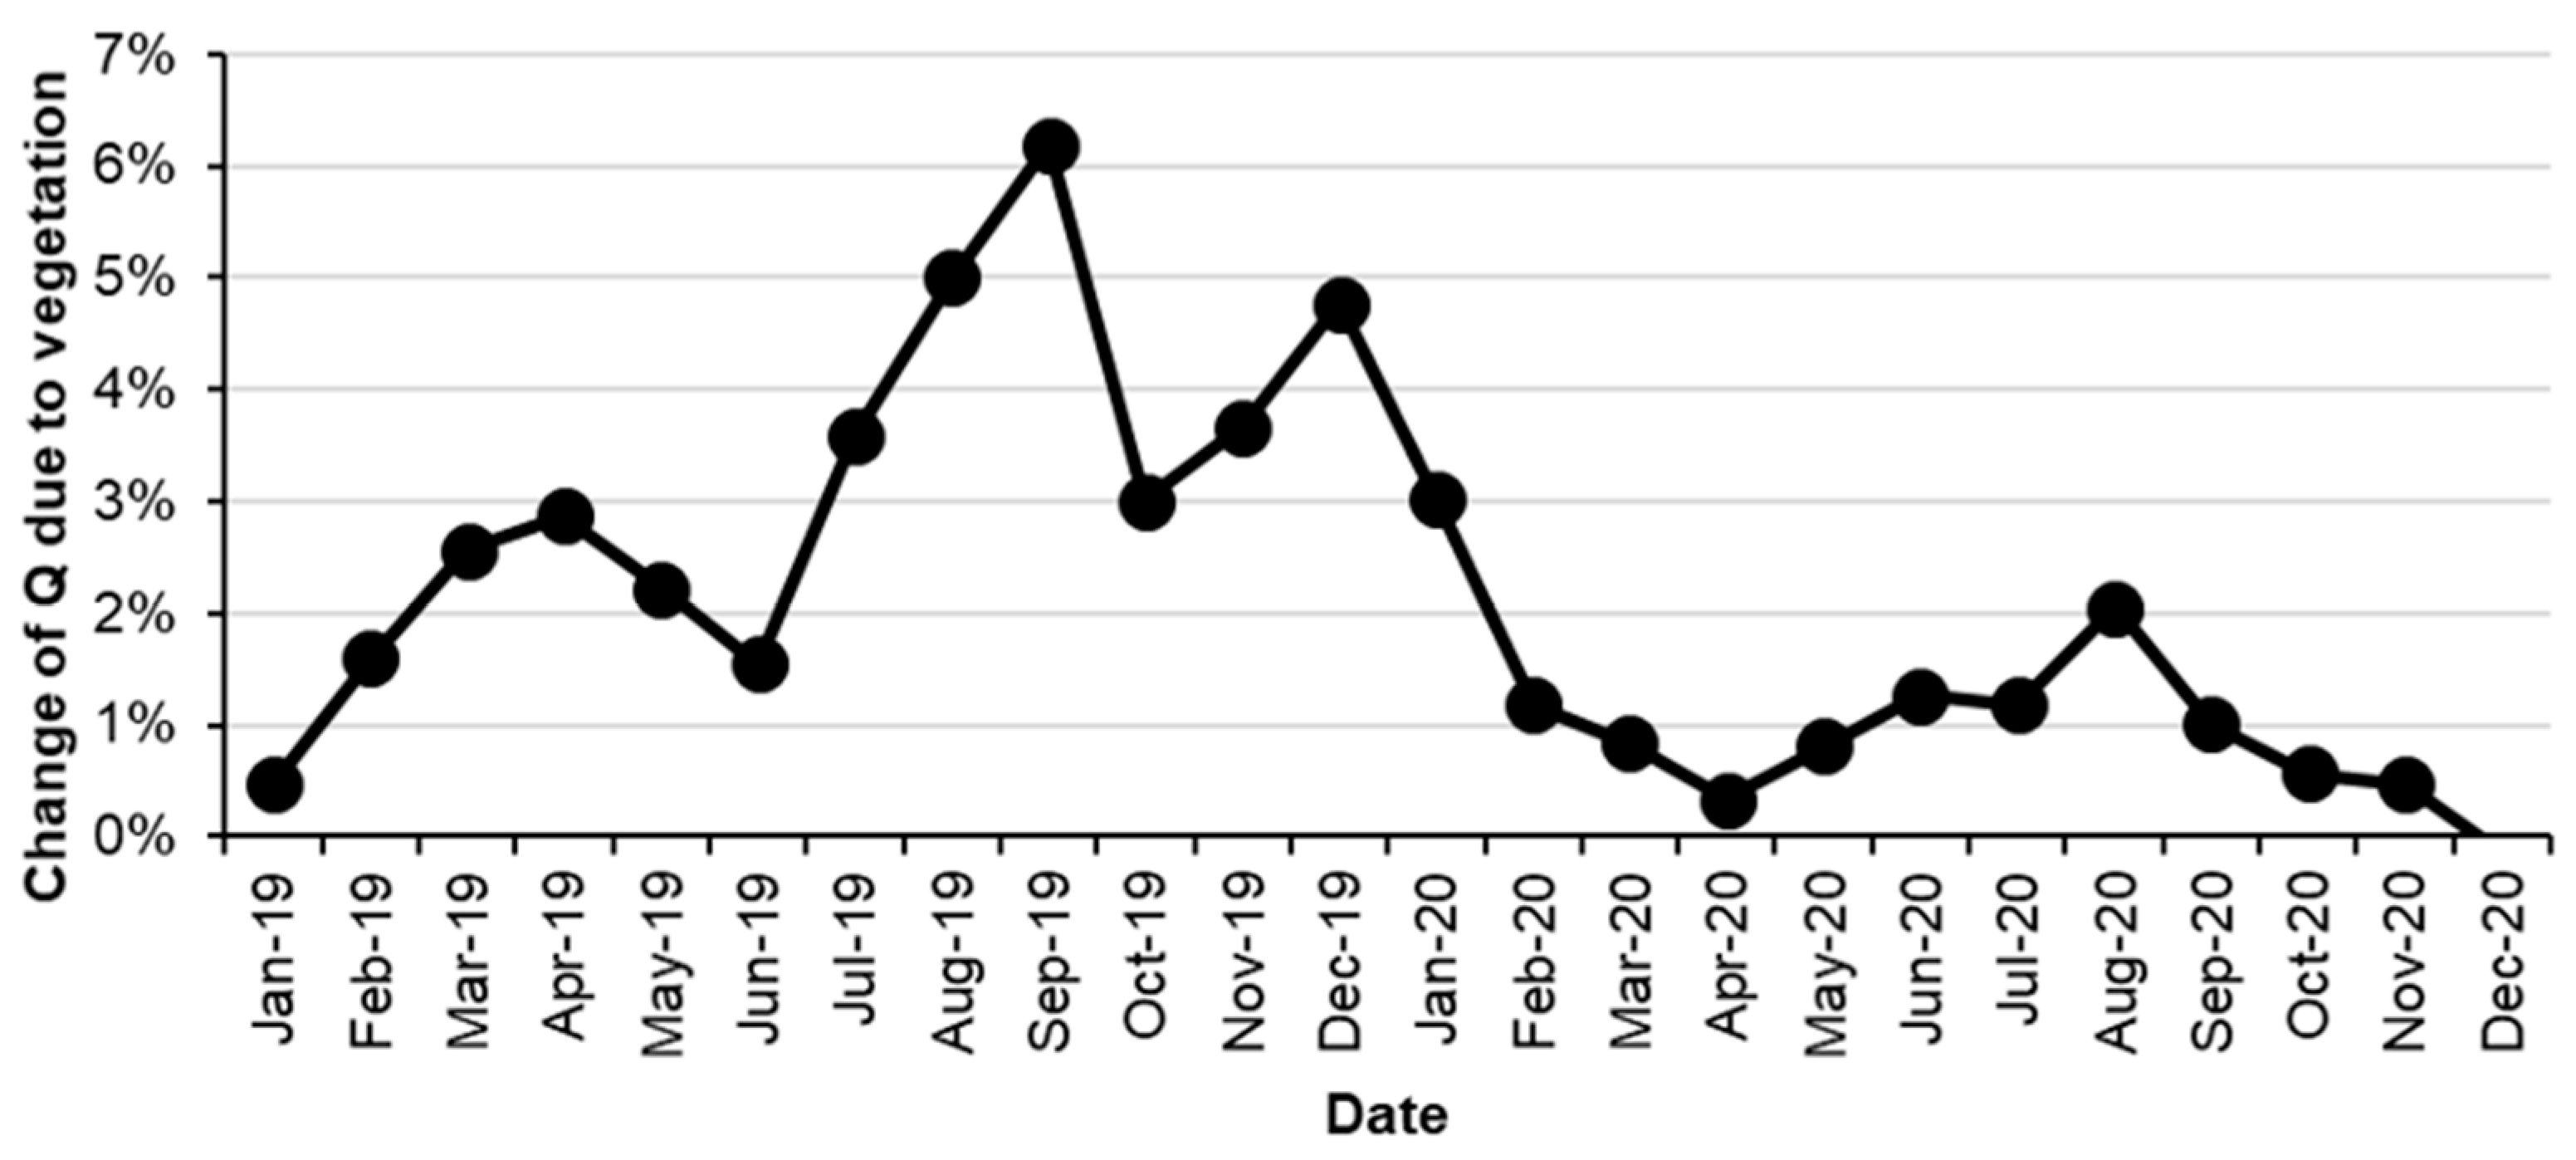
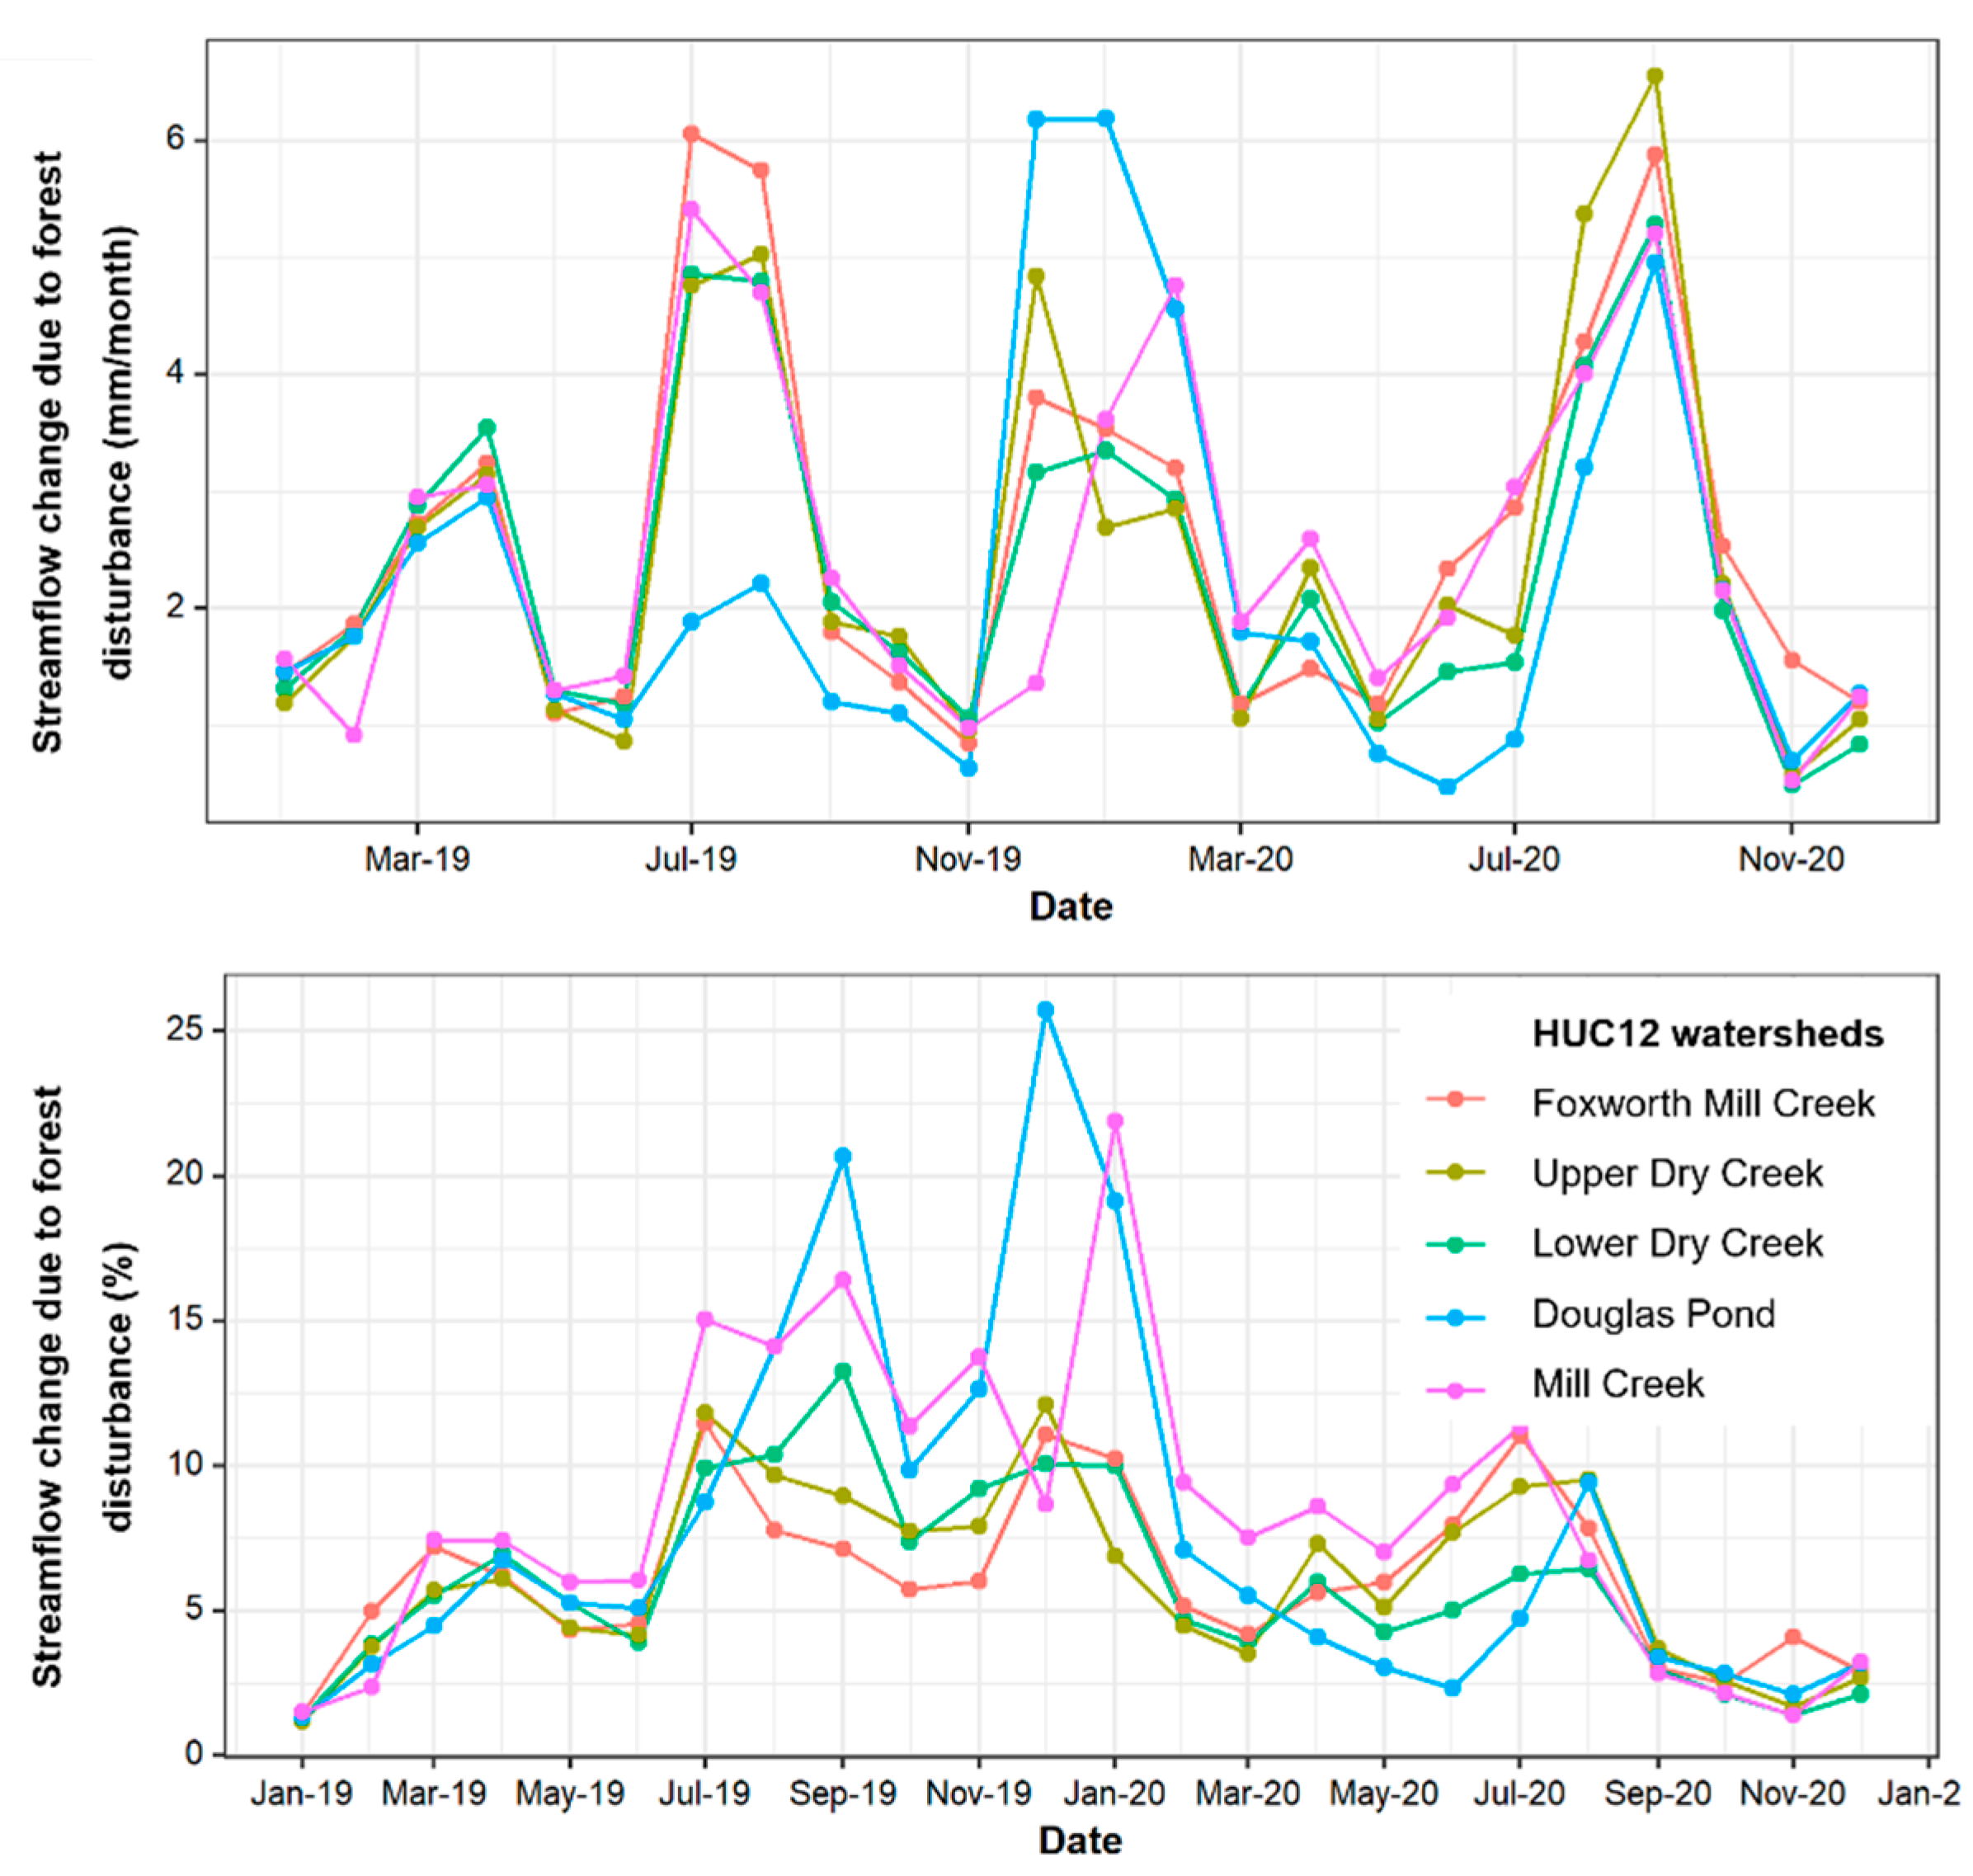
3.4. WaSSI Model Validation and Application

The WaSSI model was validated against observed streamflow data for the period before the 2018 Hurricane Michael. The WaSSI model performed satisfactorily at monthly and annual scales from 2008 to 2017. The model was evaluated with R2, percent bias, and KGE [45], which were 0.7, −5%, 0.83, and 0.86, −5%, and 0.89 on the monthly and annual scales, respectively (Figure 10).
Consistent with the DMC method, the WaSSI scenario run did not detect significant increases in streamflow during 2019 and 2020 (p > 0.05). At the annual scale, LAI change from vegetation damage on streamflow was small, resulting in 12 mm (2.6%) and 7.3 mm (1.0%) increases in inflow in 2019 and 2020. However, the effects of LAI decline were much stronger on the monthly scale in 2019, which led to a more than 5% increase in flow during August and September of 2019 (Figure 11).
The impacts of forest disturbance from Hurricane Michael on streamflow were much higher in the southern part of the Chipola River Watershed, as represented in the five HUC12 sub-watersheds where a considerable decline in NDVI after the disturbance was detected (Figure 3, Figure 4 and Figure 5). The vegetation damage resulted in an average increased flow of 29 mm (6%) (24 mm to 32 mm) during 2019 and 2020. The impact was highest from July 2019 to August 2020 but almost diminished after August 2020 (Figure 11). For example, the NDVI on the Mill Creek subwatershed reduced by an average of 14 % after Hurricane Michael (Figure 12), which resulted in a 27 mm (8%) and 32 mm (6%) increase in streamflow in 2019 and 2020, respectively. Moreover, the forest disturbance increased streamflow by an average of 12% (7–22 %) in July 2019 and July 2020.

4. Discussion

The forest damage sustained by the Chipola River watershed was substantial, and above-average streamflow rates following the hurricane event were recorded. However, the spike in discharge rates was primarily due to the considerable rainfall in the months immediately following Hurricane Michael. Attributing the increased flow to a reduction in the forest canopy or rainfall is difficult, given the influential effects of vegetation on ET. The two different methods used in this study (i.e., DCM and WaSSI) for separating impacts from vegetation loss and climate variability both indicated that there were no significant impacts from forest damage to the rainfall–runoff relationship at this watershed scale.
However, using both empirical and watershed modeling approaches, we found that disturbance impacts varied spatially and watershed-level hydrologic effects depended on the size and severity of the impact of the upstream area affected by the hurricane. Our results show that hydrological impacts were more apparent at the HUC12 subwatershed scale, not at the entire large basin scale. The size of the Chipola River watershed seemed to mask the damage effects. This is supported by global scale reviews showing increases in flow only when more than 20% of forests have been removed [46,47,48]. This is also supported by Grace 2005, where similar small watersheds (0.2–325 ha) located in southeastern Georgia exhibited changes in water yield due to canopy removal [48].
The monthly streamflow increases due to vegetation loss during 2019 (3–6%) were expected, as it was the first growing season following the hurricane. Satellite-based imagery products found that most impacts were to the southern portion of the watershed. The overall NDVI change also supports the results found using Sentinel 2 data (an average 0.05 NDVI decline over 2000 km2). Our study proposes that forest damage and loss resulted in decreased water loss through canopy evaporation and forest transpiration, leading to more available water for groundwater recharge and streamflow. However, our analysis suggests this effect diminished with the recovery of the forest canopy after September 2020 (Figure 9). Other studies have shown how coastal plain forested watersheds previously impacted by hurricane events have recovered quickly despite substantial damage to forest canopies, suggesting that these ecosystems possess some hydrologic resiliency to storm impacts [13]. Coastal plain forests support high levels of biomass production due to climate and nutrient factors [13]; therefore, the resurgence in NDVI values is expected from flourishing understories. Furthermore, other ecosystem types, such as the salt marshes that line the coasts of the Southeastern US and are crucial for storm surge protection and water quality, share some degree of resistance or resilience to hurricane impacts. For example, a post-storm analysis of coastal salt marshes along the Florida panhandle after Hurricane Michael showed that only 2% of the total ecosystem was damaged (e.g., deposition, vegetation loss, erosion, conversion to open water) [28]. Ecosystem recovery may have been affected by lagging impacts from Hurricane Michael. These impacts are primarily due to a hurricane’s ability to alter soil processes. As previously stated, hurricanes influence the nutrient export of an area through erosion and soil leaching and can severely strip soils of nitrogen and phosphorus [49]. This leaching may have drastically reduced nutrient concentrations leading to a longer recovery time.
This study has shown the advantages and disadvantages of empirical and modeling methods to isolate vegetation impacts on streamflow within a specified system. The double mass curve method is a relatively simple analysis; therefore, it is easily applied and provides a robust visualization of breakpoints within the data when used at the annual timescale. Using empirical methods such as this offers greater accuracy when compared to modeling approaches. However, more data are needed, such as observed flow data over long-term periods. Finally, the double mass curve method cannot detect short-term impacts due to fluctuations in soil water storage. Alternatively, the WaSSI modeling method is not limited by spatial or temporal scales and does not require additional long-term observed flow data. However, model calibration can be time-consuming and there is inherent uncertainty with modeling, especially without sufficient data validation. It also factored in soil water change; an important hydrological parameter not accounted for within the DMC method. Finally, the simulated effects of the relationship between flow and vegetation change are highly dependent on the structure of the model used (i.e., ET rates using WaSSI). Further investigation of the lingering impacts of Hurricane Michael on smaller scale watersheds is needed to fully understand its effect on the damaged area and other coastal forested ecosystems.

5. Conclusions

Hurricane Michael resulted in widespread damage to both human infrastructure and coastal plain forest ecosystems within the impact area; therefore, it represented an opportunity to study how the hydrology of these areas may change following large-scale disturbance events. Our study suggested that the forest disturbance of Hurricane Michael did not significantly shift the rainfall–runoff relationship of the Chipola River watershed as a whole. However, forest hydrological modeling suggested that the effects of forest disturbances were much more significant in local sub-watersheds that were close to the hurricane path. We also concluded that watershed hydrology recovered from the hurricane event within two growing seasons. Overall, this study suggests that changes in vegetation cover after Hurricane Michael did not have lasting impacts on the hydrology of this watershed, and the hydrology of coastal watersheds may be more resilient to hurricane disturbances than previously thought. With the severity and intensity of hurricane events projected to increase across the Atlantic and Gulf Coasts, monitoring the ecohydrological resiliency and resistance of watersheds is important for mitigating and adapting to these events for ecosystem functioning. In particular, streamflow monitoring of smaller watersheds is helpful to understand the ecohydrological effects of hurricanes and the watershed recovery processes.

Author Contributions

Conceptualization, G.S. and S.G.M.; Data curation, E.W.; Formal analysis, E.W., N.L. and G.S.; Funding acquisition, S.G.M.; Investigation, E.W., G.S., S.P.N. and W.M.C.; Methodology, E.W., N.L., G.S. and J.B.; Project administration, G.S. and S.G.M.; Software, S.P.N., W.M.C. and J.B.; Supervision, G.S.; Validation, N.L.; Visualization, G.S., S.P.N. and W.M.C.; Writing—original draft, E.W., N.L. and G.S.; Writing—review & editing, E.W., N.L., G.S., S.P.N., W.M.C., M.G. and S.G.M. All authors have read and agreed to the published version of the manuscript.

Funding

Funding support is provided by the USDA Forest Service Southern Research Station.

Conflicts of Interest

The authors declare no conflict of interest.

References

  1. Amatya, D.M.; Trettin, C.C. Long-Term Ecohydrologic Monitoring: A Case Study from the Santee Experimental Forest, South Carolina. J. South Carol. Water Resour. 2020, 6, 46–55. [Google Scholar] [CrossRef]
  2. Bender, M.A.; Knutson, T.R.; Tuleya, R.E.; Sirutis, J.J.; Vecchi, G.A.; Garner, S.T.; Held, I.M. Modeled Impact of Anthropogenic Warming on the Frequency of Intense Atlantic Hurricanes. Science 2010, 327, 454–458. [Google Scholar] [CrossRef] [PubMed] [Green Version]
  3. Chen, X.; Kumar, M.; McGlynn, B.L. Variations in Streamflow Response to Large Hurricane-Season Storms in a Southeastern US Watershed. J. Hydrometeorol. 2015, 16, 55–69. [Google Scholar] [CrossRef]
  4. Dai, Z.; Amatya, D.M.; Sun, G.; Trettin, C.C.; Li, C.; Li, H. Climate Variability and Its Impact on Forest Hydrology on South Carolina Coastal Plain, U.S.A. Atmosphere 2011, 2, 330–357. [Google Scholar] [CrossRef] [Green Version]
  5. Mallin, M.A.; Corbett, C.A. How hurricane attributes determine the extent of environmental effects: Multiple hurricanes and different coastal systems. Estuaries Coasts 2006, 29, 1046–1061. [Google Scholar] [CrossRef]
  6. Miller, P.W.; Kumar, A.; Mote, T.L.; Moraes, F.D.S.; Mishra, D.R. Persistent Hydrological Consequences of Hurricane Maria in Puerto Rico. Geophys. Res. Lett. 2019, 46, 1413–1422. [Google Scholar] [CrossRef] [Green Version]
  7. McNulty, S.G. Hurricane impacts on US forest carbon sequestration. Environ. Pollut. 2002, 116, S17–S24. [Google Scholar] [CrossRef]
  8. Chapman, E.L.; Chambers, J.Q.; Ribbeck, K.F.; Baker, D.B.; Tobler, M.A.; Zeng, H.; White, D.A. Hurricane Katrina impacts on forest trees of Louisiana’s Pearl River basin. For. Ecol. Manag. 2008, 256, 883–889. [Google Scholar] [CrossRef]
  9. Sun, G.; Zuo, C.; Liu, S.; Liu, M.; McNulty, S.G.; Vose, J.M. Watershed Evapotranspiration Increased due to Changes in Vegetation Composition and Structure Under a Subtropical Climate1. JAWRA J. Am. Water Resour. Assoc. 2008, 44, 1164–1175. [Google Scholar] [CrossRef] [Green Version]
  10. Yih, K.; Boucher, D.H.; Vandermeer, J.H.; Zamora, N. Recovery of the Rain Forest of Southeastern Nicaragua After Destruction by Hurrican Joan. Biotropica 1991, 23, 106. [Google Scholar] [CrossRef]
  11. Steyer, G. Landscape Analysis of Vegetation Change in Coastal Louisiana following Hurricanes Katrina and Rita. Ph.D. Thesis, Louisiana State University, Baton Rouge, LA, USA, 2008. [Google Scholar]
  12. Neubauer, S.C. Ecosystem Responses of a Tidal Freshwater Marsh Experiencing Saltwater Intrusion and Altered Hydrology. Estuaries Coasts 2011, 36, 491–507. [Google Scholar] [CrossRef]
  13. Amatya, D.M.; Williams, T.M.; Nettles, J.E.; Skaggs, R.W.; Trettin, C.C. Comparison of Hydrology of Two Atlantic Coastal Plain Forests. Trans. ASABE 2019, 62, 1509–1529. [Google Scholar] [CrossRef]
  14. Bosch, D.D.; Sullivan, D.G.; Sheridan, J.M. Hydrologic impacts of land-use changes in coastal plain watersheds. Trans. ASABE 2006, 49, 423–432. [Google Scholar] [CrossRef]
  15. Sun, G.; Lu, J.; Gartner, D.L.; Miwa, M.; Trettin, C.C. Water budgets of two forested watersheds in South Carolina. In Proceedings of the Awra’s Annual Water Resources Conference, Miami, FL, USA, 6 November 2000. [Google Scholar]
  16. Sun, G.; McNulty, S.G.; Amatya, D.M.; Skaggs, R.W.; Swift, L.W.; Shepard, J.P.; Riekerk, H. A comparison of the watershed hydrology of coastal forested wetlands and the mountainous uplands in the Southern US. J. Hydrol. 2002, 263, 92–104. [Google Scholar] [CrossRef]
  17. Shelby, J.D.; Chescheir, G.M.; Skaggs, R.W.; Amatya, D.M. Hydrologic and water-quality response of forested and agricultural lands during the 1999 extreme weather conditions in eastern north carolina. Trans. ASAE 2005, 48, 2179–2188. [Google Scholar] [CrossRef] [Green Version]
  18. Swank, W.T.; Swift, L.W.; Douglass, J.E. Streamflow Changes Associated with Forest Cutting, Species Conversions, and Natural Disturbances. For. Hydrol. Ecol. Coweeta 1988, 66, 297–312. [Google Scholar] [CrossRef]
  19. Dai, Z.; Trettin, C.C.; Amatya, D.M. Effects of Climate Variability on Forest Hydrology and Carbon Sequestration on the Santee Experimental Forest in Coastal South Carolina; Gen. Tech. Rep. SRS-GTR-172; USDA-Forest Service, Southern Research Station: Asheville, NC, USA, 2013; p. 32.
  20. Sun, G.; Noormets, A.; Gavazzi, M.J.; McNulty, S.G.; Chen, J.; Domec, J.-C.; King, J.S.; Amatya, D.M.; Skaggs, R.W. Energy and water balance of two contrasting loblolly pine plantations on the lower coastal plain of North Carolina, U.S.A. For. Ecol. Manag. 2010, 259, 1299–1310. [Google Scholar] [CrossRef]
  21. Jayakaran, A.D.; Williams, T.M.; Ssegane, H.; Amatya, D.M.; Song, B.; Trettin, C.C. Hurricane impacts on a pair of coastal forested watersheds: Implications of selective hurricane damage to forest structure and streamflow dynamics. Hydrol. Earth Syst. Sci. 2014, 18, 1151–1164. [Google Scholar] [CrossRef] [Green Version]
  22. Amatya, D.M.; Miwa, M.; Harrison, C.A.; Trettin, C.C.; Sun, G. Hydrology and water quality of two first order forested watersheds in Coastal South Carolina (Paper Number 062182). In Proceedings of the ASABE Annual International Meeting, Portland, OR, USA, 9–12 July 2006. [Google Scholar]
  23. Kenney, G.; Staudhammer, C.L.; Wiesner, S.; Brantley, S.T.; Bigelow, S.W.; Starr, G. Hurricane Michael Altered the Structure and Function of Longleaf Pine Woodlands. J. Geophys. Res. Biogeosci. 2021, 126, e2021JG006452. [Google Scholar] [CrossRef]
  24. Beven, J., II; Berg, R.; Hagen, A. National Hurricane Center Tropical Cyclone Report: Hurricane Michael (AL142018). 2019. Available online: https://www.nhc.noaa.gov/data/tcr/AL142018_Michael.pdf (accessed on 2 February 2022).
  25. Florida Forest Service. Hurricane Michael: Initial Value Estimate of Altered, Damaged, or Destroyed Timber in Florida; Florida Forest Service: Tallahassee, FL, USA, 2018.
  26. Bates, C.; McClure, M. Timber Impact Assessment: Hurricane Michael. Forest Health Management Group, Georgia Forestry Commission. Available online: https://gatrees.org/wp-content/uploads/2020/01/Hurricane-MichaelTimber-Impact-Assessment-Georgia-October-10-11-2018-2.pdf (accessed on 3 March 2022).
  27. Alabama Forestry Commission. Storm Damage Assessment Report: Hurricane Michael. In Proceedings of the Alabama Forestry Commission, Montgomery, AL, USA, 10 October 2018. [Google Scholar]
  28. Castagno, K.A.; Tomiczek, T.; Shepard, C.C.; Beck, M.W.; Bowden, A.A.; O’Donnell, K.; Scyphers, S.B. Resistance, resilience, and recovery of salt marshes in the Florida Panhandle following Hurricane Michael. Sci. Rep. 2021, 11, 20381. [Google Scholar] [CrossRef]
  29. Zampieri, N.E.; Pau, S.; Okamoto, D.K. The impact of Hurricane Michael on longleaf pine habitats in Florida. Sci. Rep. 2020, 10, 8483. [Google Scholar] [CrossRef] [PubMed]
  30. D’Sa, E.J.; Joshi, I.D.; Liu, B.; Ko, D.S.; Osburn, C.L.; Bianchi, T.S. Biogeochemical Response of Apalachicola Bay and the Shelf Waters to Hurricane Michael Using Ocean Color Semi-Analytic/Inversion and Hydrodynamic Models. Front. Mar. Sci. 2019, 6, 523. [Google Scholar] [CrossRef]
  31. Wang, Y. Detecting Vegetation Recovery Patterns After Hurricanes in South Florida Using NDVI Time Series. Ph.D. Thesis, University of Miami, Coral Gables, FL, USA, 2012. Available online: https://scholarship.miami.edu/esploro/outputs/graduate/Detecting-Vegetation-Recovery-Patterns-After-Hurricanes/991031447547302976 (accessed on 2 February 2022).
  32. Karels, J. Introduction to Forestry in Florida; Florida Forest Service: Tallahassee, FL, USA, 2012.
  33. Zhang, M.; Wei, X.; Sun, P.; Liu, S. The effect of forest harvesting and climatic variability on runoff in a large watershed: The case study in the Upper Minjiang River of Yangtze River basin. J. Hydrol. 2012, 464, 1–11. [Google Scholar] [CrossRef]
  34. Caldwell, P.V.; Sun, G.; McNulty, S.G.; Cohen, E.C.; Moore Myers, J.A. Modeling Impacts of Environmental Change on Ecosystem Services across the Conterminous United States. In Proceedings of the Observing, Studying, and Managing for Change-Proceedings of the Fourth Interagency Conference on Research in the Watersheds: US Geological Survey Scientific Investigations Report 2011-5169, Fairbanks, AK, USA, 26–30 September 2011; Medley, C.N., Patterson, G., Parker, M.J., Eds.; p. 202. Available online: http://pubs.usgs.gov/sir/2011/5169/ (accessed on 18 December 2021).
  35. Caldwell, P.V.; Sun, G.; McNulty, S.G.; Cohen, E.C.; Moore Myers, J.A. Impacts of impervious cover, water withdrawals, and climate change on river flows in the conterminous US. Hydrol. Earth Syst. Sci. 2012, 16, 2839–2857. [Google Scholar] [CrossRef] [Green Version]
  36. Sun, G.; Caldwell, P.; Noormets, A.; McNulty, S.G.; Cohen, E.; Moore Myers, J.; Domec, J.-C.; Treasure, E.; Mu, Q.; Xiao, J.; et al. Upscaling key ecosystem functions across the conterminous United States by a water-centric ecosystem model. J. Geophys. Res. 2011, 116. [Google Scholar] [CrossRef]
  37. Caldwell, P.V.; Kennen, J.G.; Sun, G.; Kiang, J.E.; Butcher, J.B.; Eddy, M.C.; Hay, L.E.; LaFontaine, J.H.; Hain, E.F.; Nelson, S.A.C.; et al. A comparison of hydrologic models for ecological flows and water availability. Ecohydrology 2015, 8, 1525–1546. [Google Scholar] [CrossRef]
  38. Caldwell, P.V.; Kennen, J.G.; Hain, E.F.; Nelson, S.A.; Sun, G.; McNulty, S.G. Hydrologic Modeling for Flow-Ecology Science in the Southeastern United States and Puerto Rico; e-Gen. Tech. Rep. SRS-246; US Department of Agriculture Forest Service, Southern Research Station: Asheville, NC, USA, 2020; p. 77. Available online: https://www.fdacs.gov/content/download/82204/file/hurricanemichaelinitialtimberdamageestimate_lite.pdf (accessed on 14 March 2022).
  39. Li, C.; Sun, G.; Caldwell, P.V.; Cohen, E.; Fang, Y.; Zhang, Y.; Oudin, L.; Sanchez, G.M.; Meentemeyer, R.K. Impacts of Urbanization on Watershed Water Balances Across the Conterminous United States. Water Resour. Res. 2020, 56. [Google Scholar] [CrossRef]
  40. Schwalm, C.R.; Huntzinger, D.N.; Cook, R.B.; Wei, Y.; Baker, I.T.; Neilson, R.P.; Poulter, B.; Caldwell, P.; Sun, G.; Tian, H.Q.; et al. How well do terrestrial biosphere models simulate coarse-scale runoff in the contiguous United States? Ecol. Model. 2015, 303, 87–96. [Google Scholar] [CrossRef] [Green Version]
  41. Burnash, R.J.C. The NWS river forecast system—Catchment modelling. In Computer Models of Watershed Hydrology; Singh, V.P., Ed.; Water Resources Publications: Littleton, CO, USA, 1995; pp. 311–366. [Google Scholar]
  42. Burnash, R.J.C.; Ferral, R.L.; McGuire, R.A. A Generalized Streamflow Simulation System: Conceptual Modeling for Digital Computers; Joint Federal-State River Forecast, US Department of Commerce, National Weather Service, and State of California, Department of Water Resources: Sacramento, CA, USA, 1973. [Google Scholar]
  43. Koren, V.; Smith, M.; Duan, Q. Use of a priori parameter estimates in the derivation of spatially. In Calibration Watershed Model; American Geophysical Union: Washington, DC, USA, 2003; p. 239. [Google Scholar]
  44. Hamon, W.R. Computation of direct runoff amounts from storm rainfall. Int. Assoc. Sci. Hydrol. Publ. 1963, 63, 52–62. [Google Scholar]
  45. Gupta, H.V.; Kling, H.; Yilmaz, K.K.; Martinez, G.F. Decomposition of the mean squared error and NSE performance criteria: Implications for improving hydrological modelling. J. Hydrol. 2009, 377, 80–91. [Google Scholar] [CrossRef] [Green Version]
  46. Brown, A.E.; Zhang, L.; McMahon, T.A.; Western, A.W.; Vertessy, R.A. A review of paired catchment studies for determining changes in water yield resulting from alterations in vegetation. J. Hydrol. 2005, 310, 28–61. [Google Scholar] [CrossRef]
  47. Zhang, M.; Liu, N.; Harper, R.; Li, Q.; Liu, K.; Wei, X.; Ning, D.; Hou, Y.; Liu, S. A global review on hydrological responses to forest change across multiple spatial scales: Importance of scale, climate, forest type and hydrological regime. J. Hydrol. 2017, 546, 44–59. [Google Scholar] [CrossRef] [Green Version]
  48. Grace, J.M., III. Forest operations and water quality in the south. Trans. ASAE 2005, 48, 871–880. [Google Scholar] [CrossRef] [Green Version]
  49. Sun, J.; Wei, X.; Zhou, Y.; Chan, C.; Diao, J. Hurricanes Substantially Reduce the Nutrients in Tropical Forested Watersheds in Puerto Rico. Forests 2022, 13, 71. [Google Scholar] [CrossRef]
Figure 1. Location of Chipola River watershed (A) in association with hurricane track (blue line), hurricane track and categories over time (B) (https://www.weather.gov/tae/HurricaneMichael2018) (accessed on 15 February 2022), and breakdown of land use and land cover of the study watershed (C).
Forests 13 00904 g001
Figure 2. Aerial and ground imagery of Hurricane Michael damage to both plantation and natural forests. Salvage harvesting efforts within the Chipola River watershed (a), aerial (b) and ground (c) imagery of Hurricane Michael damage from the Alabama Forestry Commission Initial Damage Report [27] (reprinted/adapted with permission from the Alabama Forestry Comission. 2018, Elishia Ballentine), and (d) downed stems and canopy damage to riparian forests surrounding the Chipola River.
Forests 13 00904 g002
Figure 3. Change in growing season NDVI of forested lands between pre-storm (2018) and post-storm (2019–2020) periods within the Chipola River watershed using Google Earth Engine Sentinel 2 Level-2A data. NDVI change output is calculated as absolute change (NDVI value multiplied by 100). Satellite RGB images illustrate post-storm conditions, salvage harvesting, and riparian zone destruction. Within the highlighted areas NDVI levels of 0.77 before the storm dropped to 0.22 within the severely impacted (purple) areas following Hurricane Michael.
Forests 13 00904 g003
Figure 4. Growing season Sentinel-2 NDVI distribution between 2018, 2019, and 2020 within the Chipola River watershed. Average NDVI values were approximately 0.64, 0.59, and 0.62 for 2018, 2019, and 2020.
Forests 13 00904 g004
Figure 5. Changes in average growing season MODIS NDVI of severely impacted HUC12 subwatersheds by Hurricane Michael located in the southern portion of the Chipola River Watershed. Growing season for this analysis was defined as May through October.
Forests 13 00904 g005
Figure 6. Total annual runoff and precipitation and runoff-rainfall ratio for the Chipola River watershed 2007–2020.
Forests 13 00904 g006
Figure 7. Precipitation flow curves for the 11-year (2007–2017) pre-Hurricane Michael and the individual years following the disturbance event in 2018 in Chipola River Watershed.
Forests 13 00904 g007
Figure 8. A comparison of streamflow flow duration curves for pre-Hurricane Michael (2007–2017) and the individual years following the disturbance event in 2018 in Chipola River Watershed.
Forests 13 00904 g008
Figure 9. Double Mass Curve (Accumulative annual precipitation vs. streamflow for the period from 2007 to 2020) for Chipola River Watershed for detecting streamflow change during 2018–2020 due to Hurricane Michael in October 2018.
Forests 13 00904 g009
Figure 10. The WaSSI model validation with (A) monthly and (B) annual measured streamflow at the USGS gauging station Chipola River near Altha, FL, USA, ID No. 02359000.
Forests 13 00904 g010
Figure 11. The monthly impact of vegetation damage on streamflow after Hurricane Michael from 2019 to 2020.
Forests 13 00904 g011
Figure 12. WaSSI modeled effects of Hurricane Michael on monthly flow for five HUC12 due to a decline in NDVI and vegetation damage in the Chipola River Watershed.
Forests 13 00904 g012
Publisher’s Note: MDPI stays neutral with regard to jurisdictional claims in published maps and institutional affiliations.

