Article

Abandoned Fishpond Reversal to Mangrove Forest: Will the Carbon Storage Potential Match the Natural Stand 30 Years after Reforestation?

by
Habagat Mariano
1,
Maricar Aguilos
2,*,
Frandel Louis Dagoc
3,
Bryan Sumalinab
4 and
Ruben Amparado, Jr.
3
1
Department of Environmental Studies, College of Forestry and Environmental Studies, Mindanao State University-Main Campus, Marawi City 9700, Philippines
2
Department of Forestry and Environmental Resources, North Carolina State University, Raleigh, NC 27695, USA
3
Environmental Science Graduate Program, Department of Biological Sciences, College of Science and Mathematics, Mindanao State University-Iligan Institute of Technology, Iligan City 9200, Philippines
4
Department of Mathematics and Statistics, College of Science and Mathematics, Mindanao State University-Iligan Institute of Technology, Iligan City 9200, Philippines
*
Author to whom correspondence should be addressed.
Forests 2022, 13(6), 847; https://doi.org/10.3390/f13060847
Submission received: 22 April 2022 / Revised: 18 May 2022 / Accepted: 27 May 2022 / Published: 29 May 2022

Abstract

:
Mangroves are essential carbon reserves, and their role in carbon sequestration is remarkable. However, anthropogenic pressures such as aquaculture development threatened this highly susceptible ecosystem. Thus, the need to rehabilitate abandoned aquaculture ponds is a must to offset the ecological losses over the economic gains derived from these mangrove land-use changes. Thus, we chose a reforestation site of a once heavily utilized fishpond devastated by a tsunami in the late 1970s in Zamboanga del Sur, Philippines. We then established a similar study plot in a nearby natural mangrove forest as a point of reference. We determined the heterogeneity in vegetation and estimated the aboveground and soil carbon storage capacities. We also examined the distinct changes in species composition and zonation from the seaward towards the landward zones. About 30 years after the abandoned fishpond rehabilitation, we found the tree density of the Rhizopora mucronata Lamk. and Avicenia marina (Forsk.) Vierh-dominated reforestation site was higher (271 trees ha−1) compared to that of the Rhizophora apiculata Blume-dominated natural stand (211 trees ha−1) (p < 0.05). The total aboveground biomass at the natural mangrove forest was 202.02 Mg ha−1, which was close to that of the reforestation site (195.19 Mg ha−1) (p > 0.05). The total aboveground C in the natural mangrove forest was 90.52 Mg C ha−1, while that of the reforestation site was 87.84 Mg C ha−1 (p > 0.05). Surprisingly, the overall soil C content at the natural forest of 249.85 Mg C ha−1 was not significantly different from that of the reforestation site with 299.75 Mg C ha−1 (p > 0.05). There was an increasing soil C content trend as the soil got deeper from 0–100 cm (p < 0.05). The zonation patterns established across the landward to seaward zones did not affect the aboveground and soil carbon estimates (p > 0.05). Our study highlights the effectiveness of abandoned fishpond rehabilitation and calls for continuous restoration of the remaining abandoned aquaculture ponds in the country because of their ability to sequester and store carbon. Lastly, their potential to store huge amounts of carbon that will counterbalance anthropogenic CO2 emissions is likewise highlighted.

1. Introduction

Mangroves are salt-tolerant trees and shrubs that grow within the sheltered marine intertidal zones of the tropics and subtropics. As a whole community, mangroves can thrive in a wide range of harsh environmental conditions and share unique adaptive traits such as salt excreting leaves, exposed breathing root system, and the production of viviparous propagules [1]. Mangrove ecosystems provide livelihoods, essential sources of protein, and coastal protection. Compelling evidence suggests that mangroves play an important role in climate stabilization, possessing carbon storage and sequestration potential greater than that of tropical forests [2]. Mangroves stores up to 455–856 Mg C ha−1 of forest and 6.2–11.0 Pg C ha−1 in the world [3,4,5].
Mangroves are important in the context of climate change [6]. They protect the coastal communities from frequent typhoons and storm surges [7] and provide tidal belts against the rising sea level [8]. However, mangrove forests are one of the most severely threatened and undervalued ecosystems. They are highly susceptible to climate change impacts and anthropogenic activities [9,10], resulting in a 30–50% decline globally [2]. Statistics reveal an alarming global rate of destruction of 3500 ha yr−1 [8], with 0.16%–0.39% annual losses [11,12]. The rate of disappearing mangroves in this century is up to 50% in countries such as India, the Philippines, and Vietnam. In the Americas, they are being cleared faster than tropical rainforests [11,12].
The Philippines is an archipelagic country made up of more than 7107 islands located along the tropical band where mangroves thrive and has one of the longest coastlines in the world, extending up to 36,289 km [13,14]. Hence, the diversity of mangroves is relatively high due to their geographical location. The country holds at least 50% [9] of the world’s approximately 65 mangrove species [15]. It is one of the top-15 most mangrove-rich countries in the world [1]. In 1920, there were 400,000–500,000 hectares of mangroves in the Philippines, but by 1995, there were only about 117,700 hectares [14,16,17]. The decline may be attributed to overexploitation by converting mangroves for aquaculture farming, pollution, human encroachment, and climate change during the last century [18]. Among these factors, aquaculture remains the major cause, as mangroves declined at 5000 ha yr−1 in the 1950s through the 1970s when the government promoted a pro-aquaculture policy [19]. According to Janssen and Padilla (1997) [20], 261,400 ha of formerly mangrove area had been converted to brackish water fishponds. When the mangroves are converted for aquaculture, various ecosystem services are traded for a single use. These changes can lead to further deterioration and decrease of diverse floral and faunal communities leading to drastic changes in species composition [20].
The mangrove forest cover in the Municipalities of Pitogo and Tabina, Zamboanga del Sur, Mindanao Island, Philippines, are among the largest mangrove areas on the Zamboanga Peninsula. However, these mangrove areas significantly declined from 640 hectares in 1947 to 462 hectares in 2000 and further down to 403 hectares in 2010 [21]. The mangrove forest cover in these two towns has declined by around 37% during the last 63 years. This is a significant deviation from the national trend of growing mangrove coverage [17]. This corresponds to an average of 3.8% domestic loss per year, which is 1.8 times higher than the estimated loss worldwide at 2.1% per year (UNEP, 2006). If the mangrove forest cover continues to decline at the current rate, which may further be exacerbated by the conversion of mangrove areas for other uses such as aquaculture, human settlement, and development, the mangrove forest cover in the two municipalities will definitely be lost in less than 26 years [17].
To combat mangrove losses, rehabilitation is highly regarded as an essential management tool [18,22,23]. Management plans to replant abandoned aquaculture lands will make a difference in ameliorating climate change [20]. Having seen the dire condition of abandoned aquaculture ponds in Zamboanga del Sur, mangrove reforestation efforts were initiated in the early 1990s. However, there was no follow-up monitoring and assessment made on the planted mangrove species’ survival and mortality, making it difficult to elucidate how these efforts have improved the ecosystem’s functionality.
Mangrove researchers worldwide appeal to an updated status of the last remaining mangroves, especially on their carbon dynamics, due to their ability to store carbon [24,25]. In an attempt to augment the limited reports on the status of mangrove-reverted abandoned fishponds in the Philippines, we heeded this call by assessing the carbon storage potential of these important mangrove habitats in the Zamboanga Peninsula, 30 years after reforestation. In this study, we established sampling plots around the rehabilitated abandoned fishpond. This is to determine how rehabilitation efforts improved the above-and-belowground carbon storage capacity. We also established a similar study plot in a nearby natural mangrove forest as a point of reference. We determined the heterogeneity in vegetation in both sampling sites and estimated the aboveground and soil carbon. We also examined the changes in carbon stocks from the landward to seaward zones. We hypothesized that since it has been 30 years after the abandoned fishpond rehabilitation, the reforested site must have already fully recovered from this past disturbance. However, we presumed that the above-and-belowground carbon at the reforestation site could not exceed that of the natural stand, given the altered soil’s physical and chemical properties upon fishpond establishment. Our study supports the broader call for abandoned aquaculture rehabilitation and protection of mangrove forests from further destruction to sustain their roles in mitigating the impacts of climate change. We especially highlight the carbon sequestration and storage potentials of mangrove-reverted abandoned fishponds by generating a pool of reliable data and information for sound mangrove forest management interventions.

2. Materials and Methods
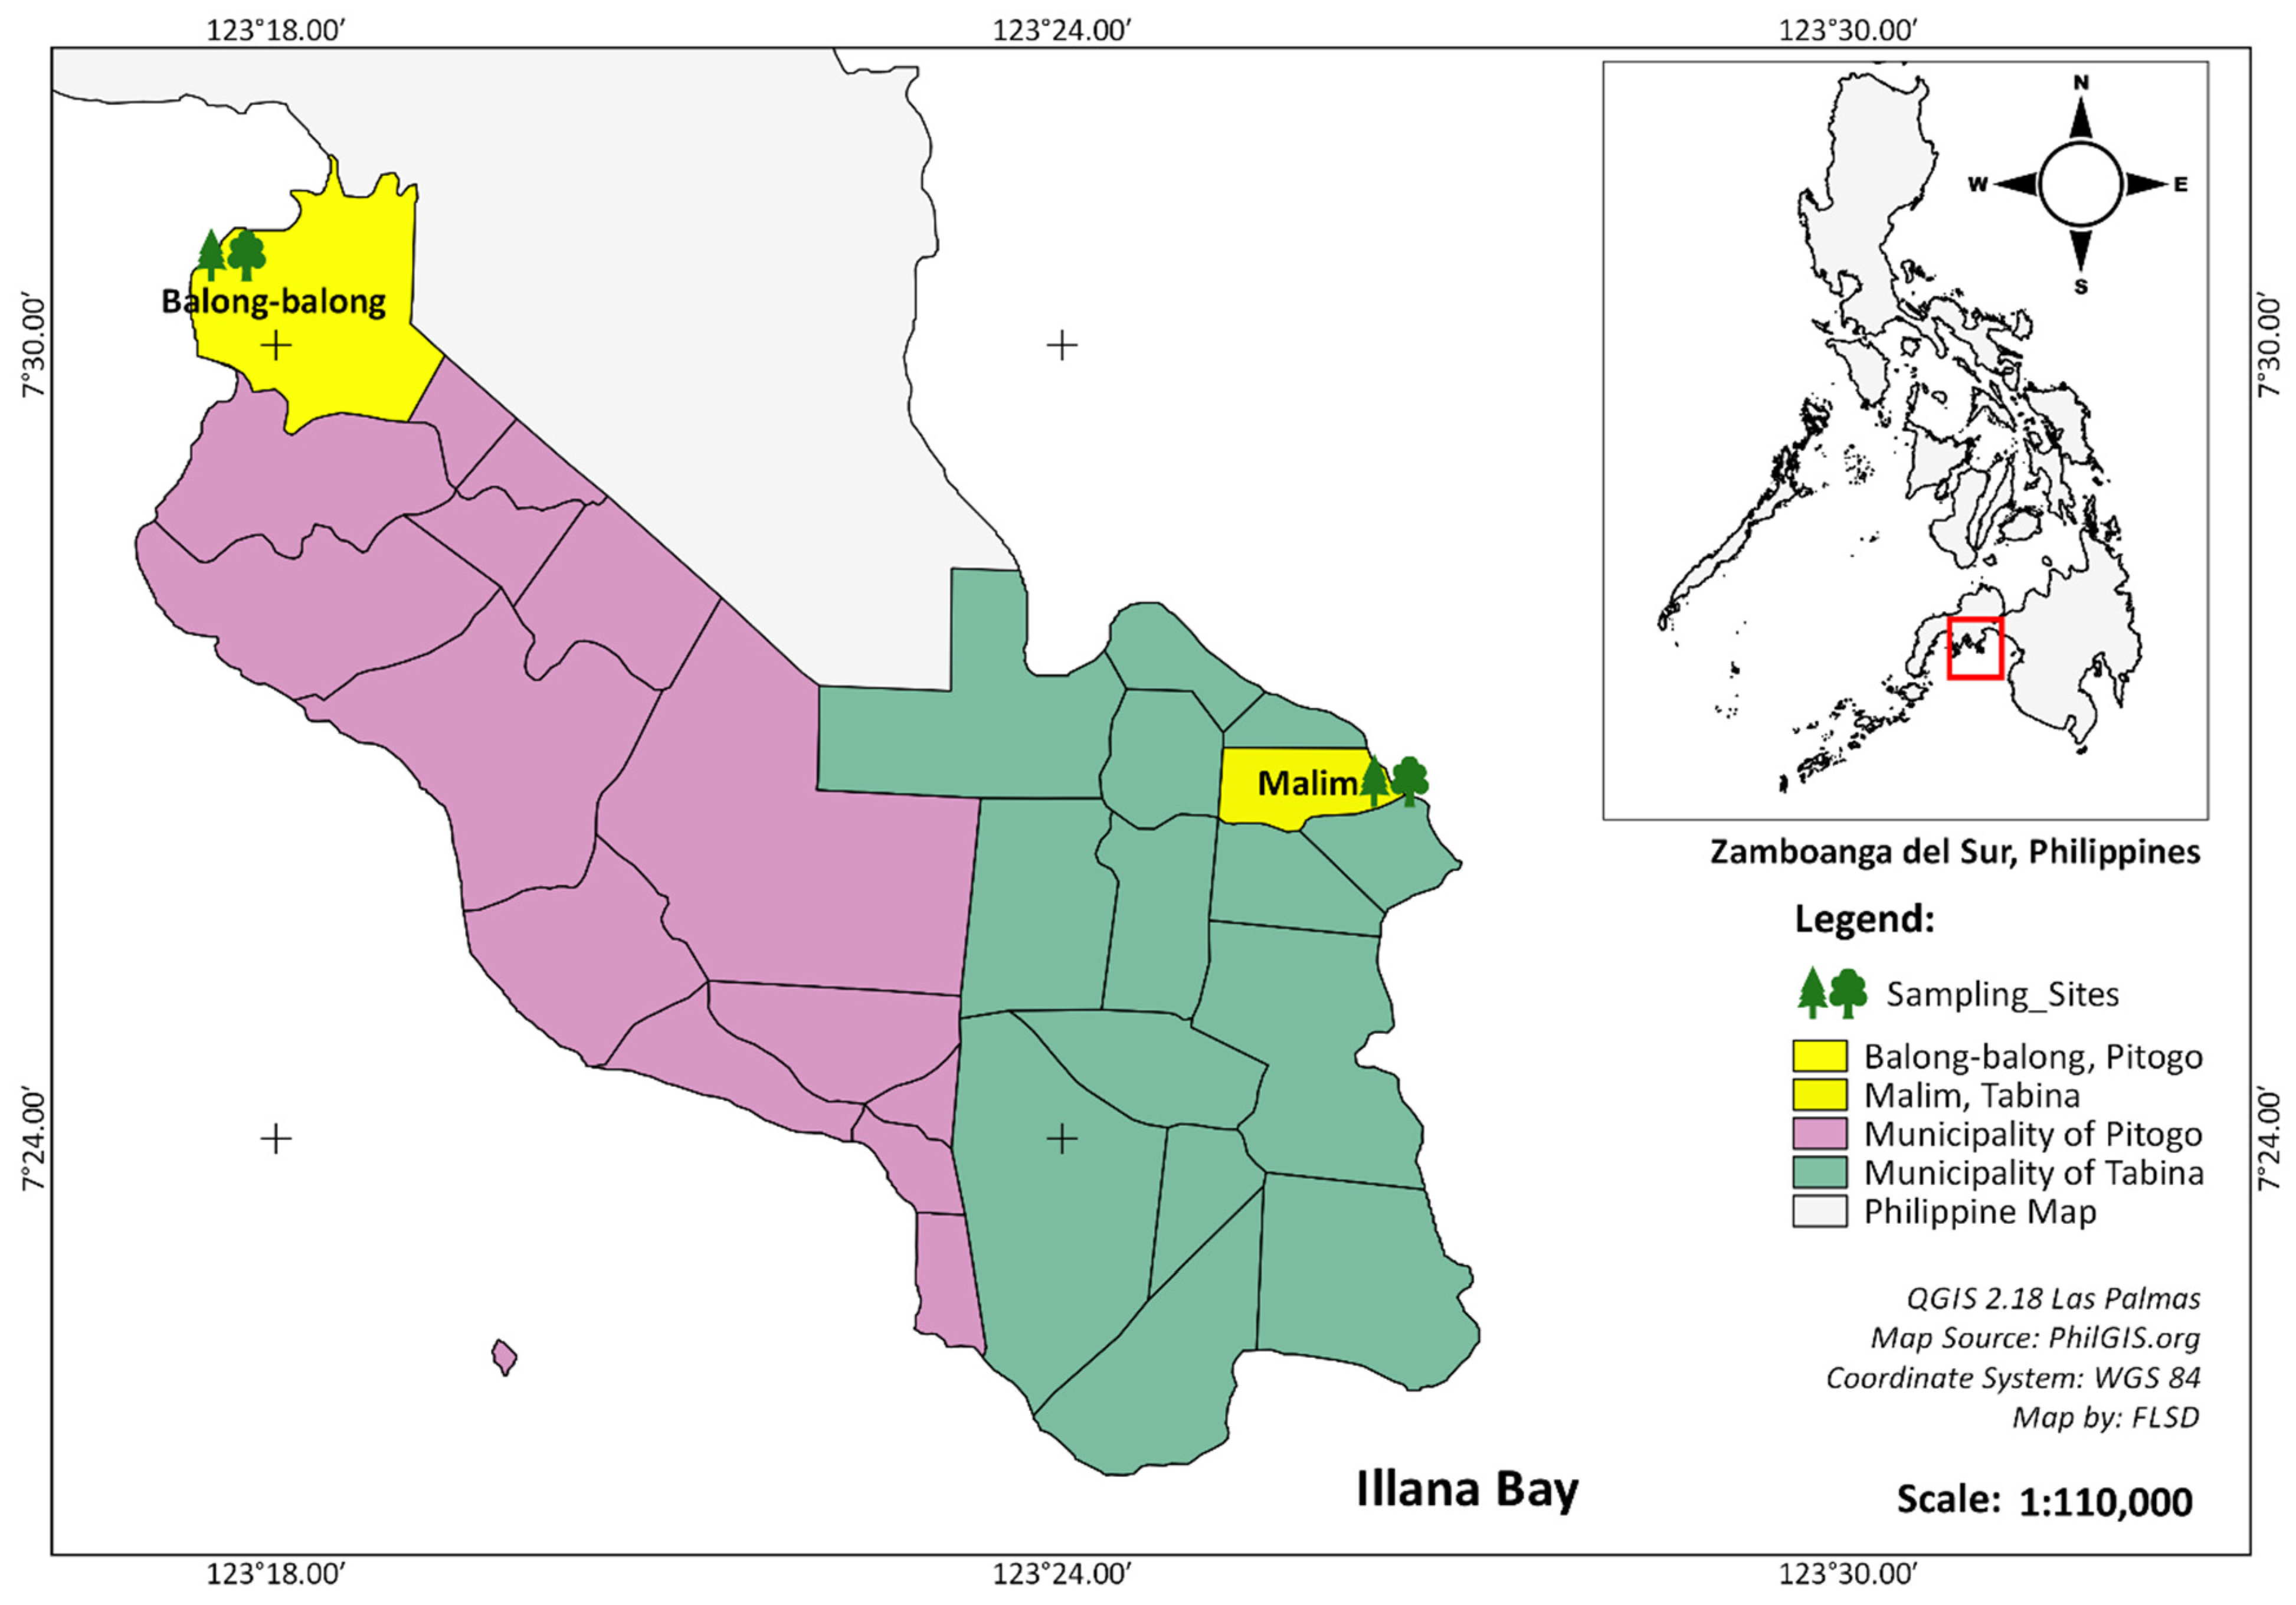
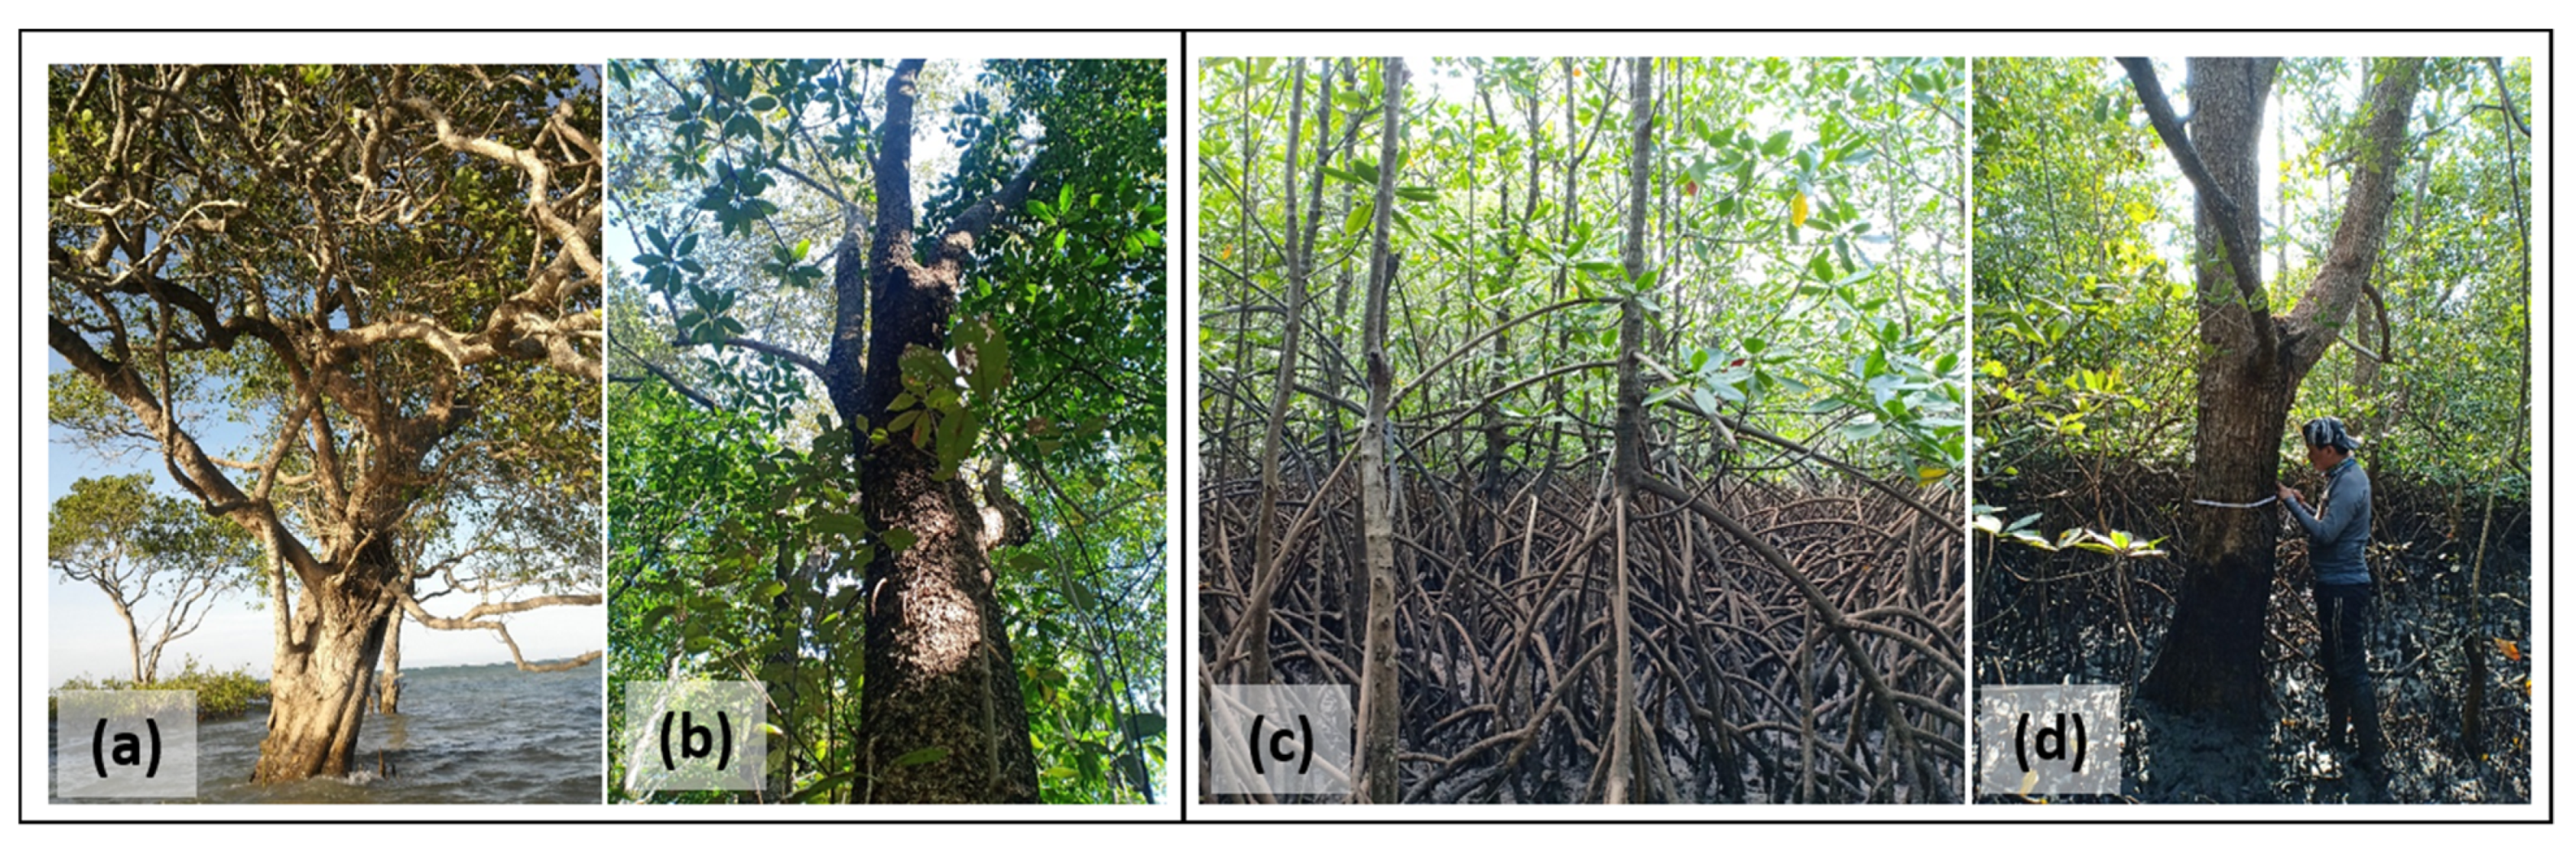
2.1. The Study Site

The study was conducted in the mangrove areas in two municipalities of Zamboanga del Sur, Philippines (Figure 1). The ‘natural stand’ is a 95-hectare marine sanctuary locally known as Tambunan Sanctuary in Malim, Tabina, Zamboanga del Sur (7°26′43″ N and 123°26′28.30″ E). According to the locals, this seafront facing mangrove sanctuary is a >50-year-old naturally grown forest, primarily dominated by the Rhizophoraceae family protected by pagatpat (Sonneratia alba L.). Despite the fact that it faces the sea, the species here are true mangrove species, with no associated mangrove species present. It was declared a municipal sanctuary in 2002 by Municipal Resolution No. 306-03A, otherwise known as “Ordinance Establishing a Marine/Fish Sanctuary”. It is managed by the local government unit (LGU) of Tabina and protected by bantay-gubat officers. Cutting down trees and entering the mangrove area without prior permission from the bantay-dagat officers are strictly prohibited. A reconnaissance survey showed that the natural mangrove stand was dominated by Rhizopora apiculata Blume (locally called Bakawan-lalaki), Rhizopora mucronata Lamk. (Bakawan-babae), and Sonneratia alba (L.) Smith (Pagatpat). The ground was dominated by stilt roots and natural regenerants of Rhizopora species.
The mangrove reforestation site is located in Balong-balong, Pitogo, Zamboanga del Sur (7°30′38″ N and 123°17′37.30″ E) and is about 24 km away from the natural stand. It has an approximate area of 22 hectares. According to the President of the Fisherfolk Association in the locality, the area was a previous natural mangrove forest before but was mostly converted into fishponds as part of the government’s priority program on fishpond development in the countryside between the 1950s and 1960s [9,16]. However, these fishponds were abandoned after a tsunami devastated these fishponds in August 1976. In 1989, the Department of Environment and Natural Resources reclaimed the abandoned fishponds and initiated the mangrove reforestation on this site. Thus, by the time this study was conducted, the reforestation site was already ~30 years old. There were three species planted during the reforestation activity, namely: S. alba, R. mucronata, and R. apiculata, but there were remnant species before replanting that were not cut down during the conversion of the area such as the Avicennia species. The regenerants of these Avicennia species now naturally grow in the area, which is why we recorded five (5) species, including A. marina and A. rumphiana. Similar to the natural mangrove forest, this site is also managed by the local government and protected by the local coastal authorities.
The climate in Zamboanga del Sur is classified as climatic type IV based on the Modified Coronas Climate Classification, where the annual average temperature is 27.06 °C (1999–2018), and annual average rainfall is 1266.5 mm, with less than 100 mm of rain from December to May and 120–180 of rain from June to November [26]. Tabina and Pitogo are both coastal municipalities of Zamboanga del Sur. They are characterized as flat terrain, with an elevation range of 0–10 masl. Both sampling sites are affected by the diurnal tidal variation of seawater. The soil substrate at both the natural and reforested mangrove forest sampling sites is described as sandy to muddy soil, and the tidal range is microtidal (1.46 m mean tidal range), with a mean tidal level of 0.82 m [27].

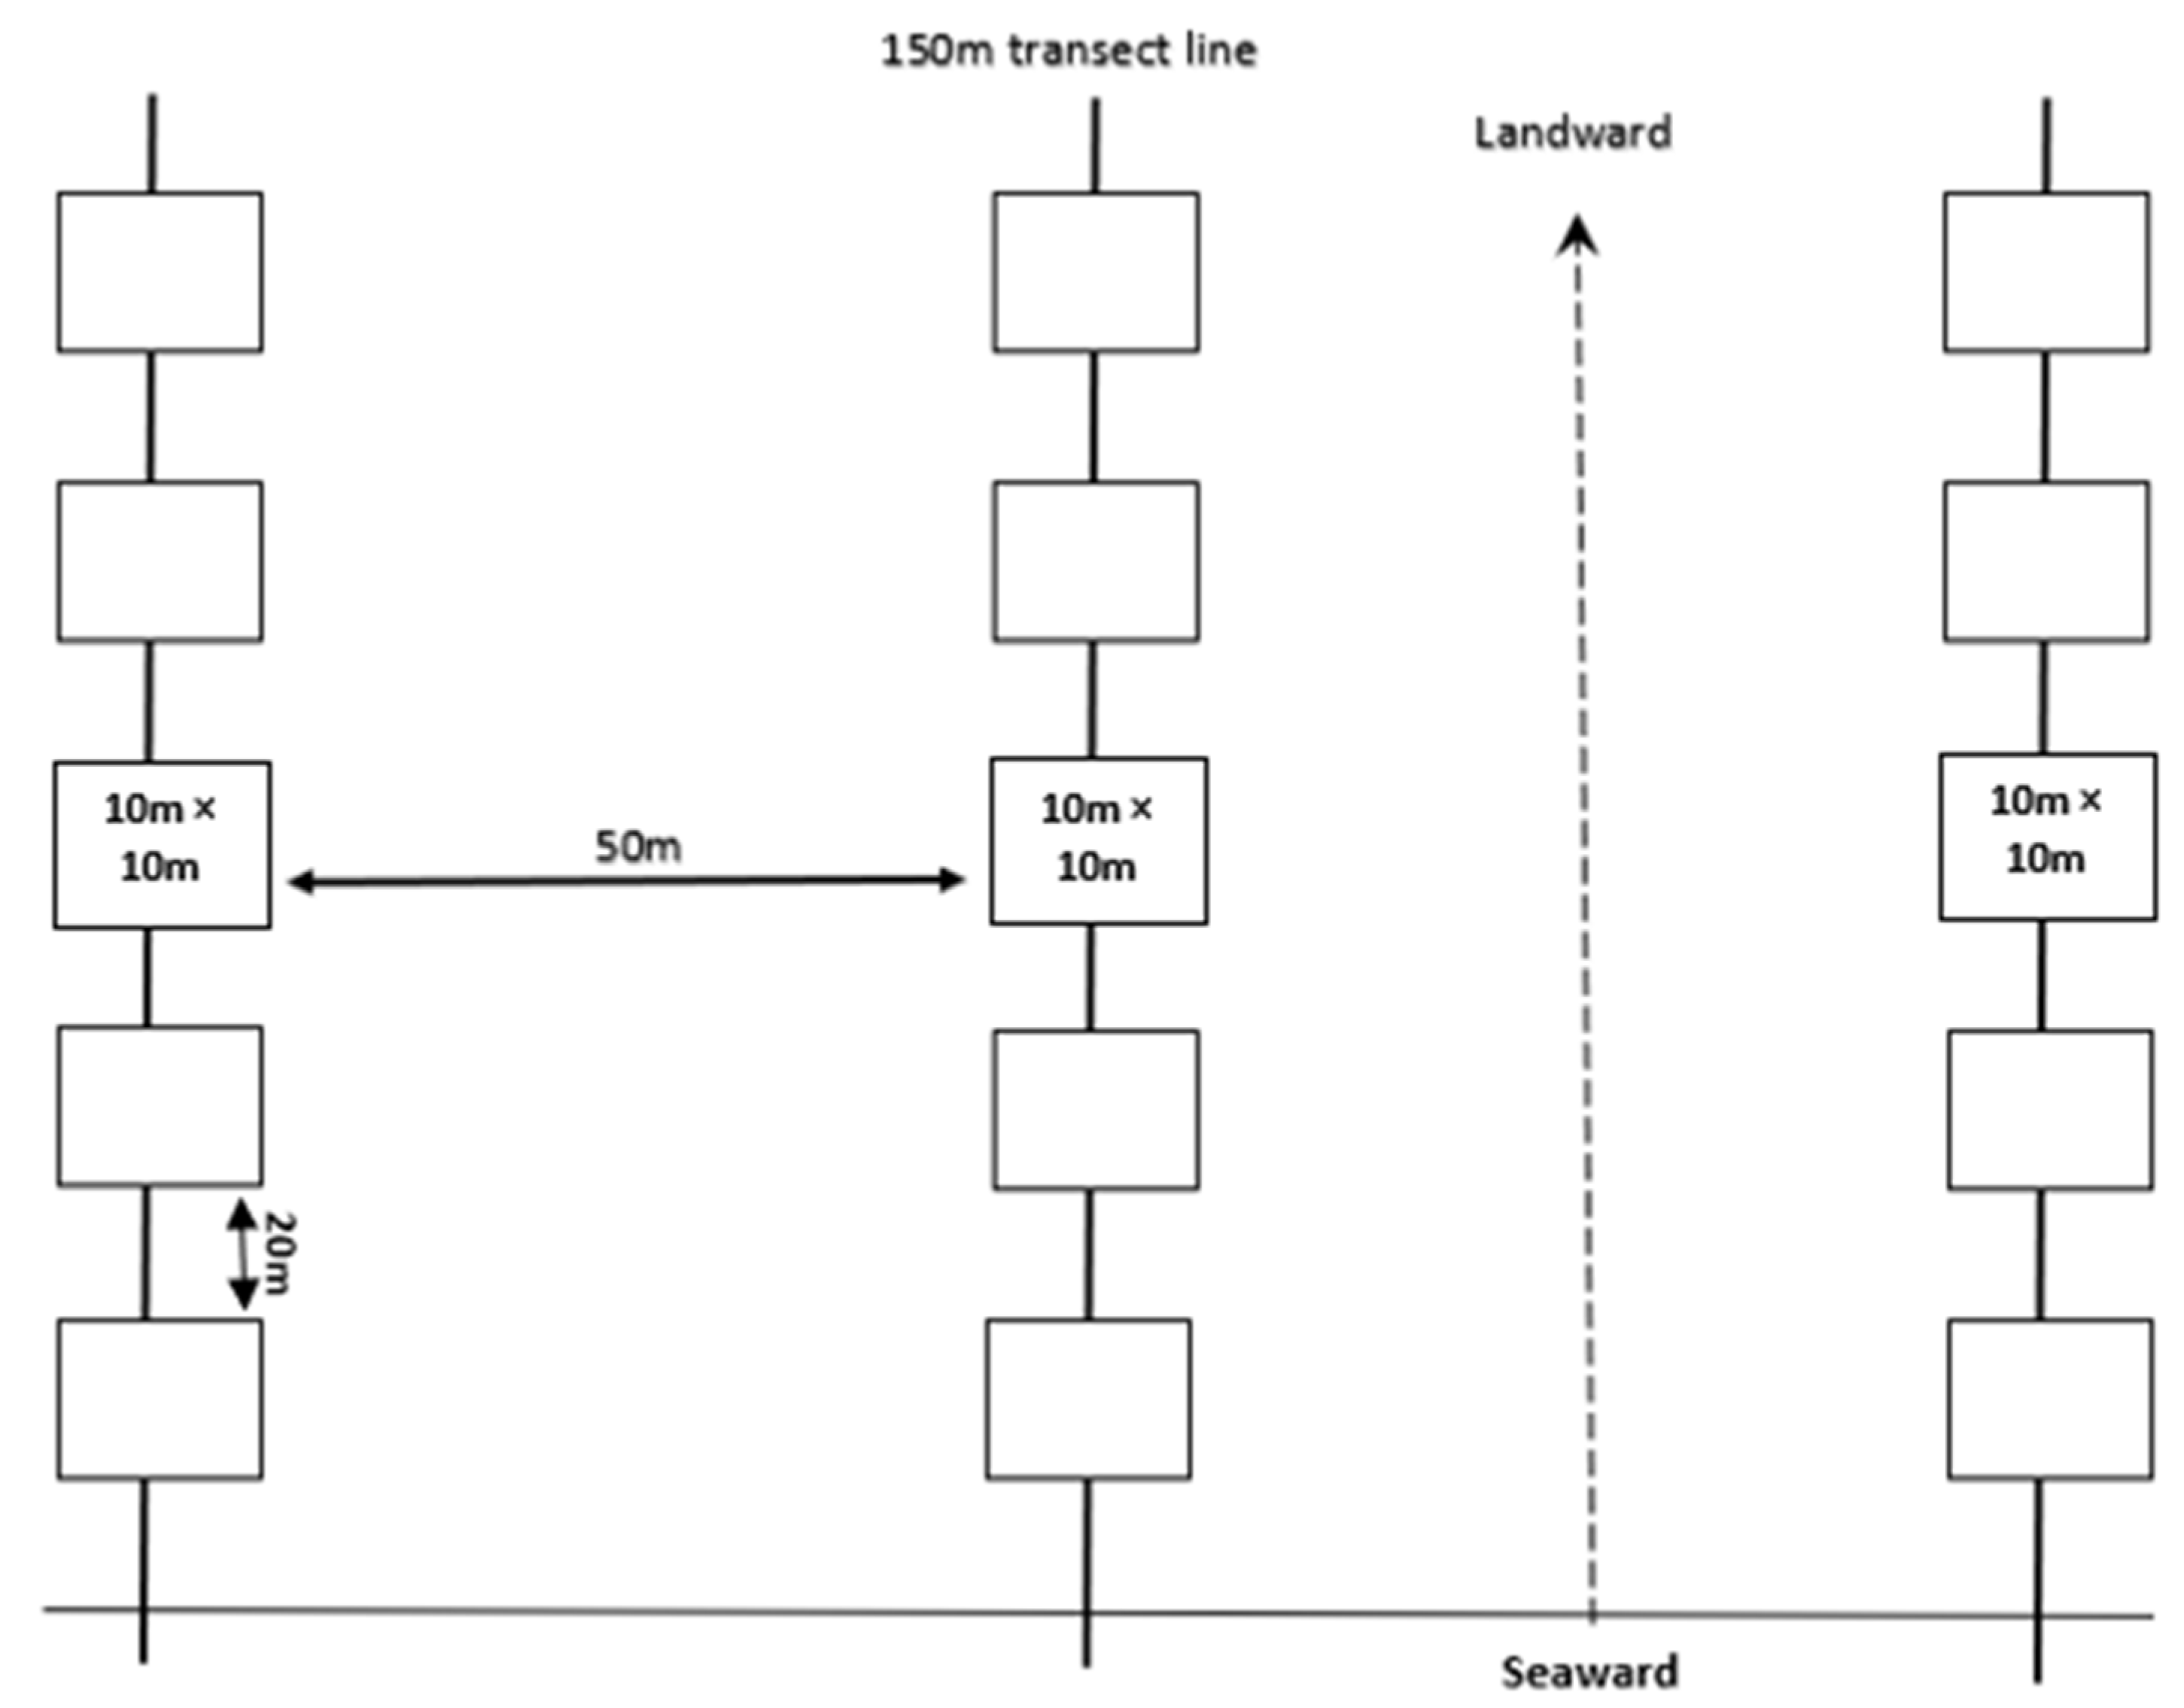
2.2. Sampling Design

Three 150 m transect lines perpendicular to the shoreline were established in both the natural and reforestation sites. The distance between transect lines is 50 m. Five 10 × 10 m quadrats (hereinafter referred to as zones) were established in each 150 m line transect with 20 m distance between plots (Figure 2).
One hundred percent (100%) inventory of trees of at least 4 cm in diameter was performed. The species name, diameter at breast height (dbh), and the total height of each tree were recorded. The trunk circumference (cm) and total height (m) were measured using a tape measure and a clinometer, respectively.

2.3. Tree Biomass and Carbon Stock

The tree biomass density (Mg ha−1) was calculated for the stand using allometric biomass equations, which can predict the total aboveground biomass of the mangrove trees [28,29]. Biomass was converted to the equivalent amount of carbon by multiplying the biomass by 0.45. The average C content value was based on the previous studies conducted by [29,30,31,32].
The study employed the following general allometric equations for mangroves:
b = 0.0509 × ρ × (D)2 × H
where B = Biomass (kg), D = diameter at breast height (m), ρ = wood density (g/cm3), H = height [29].
The live tree carbon component was determined by multiplying the biomass (kg) of each tree (as determined by an allometric equation) by the carbon conversion factor for mangrove species specific to the region. The carbon content was calculated for each sampled tree (Howard et al., 2014).

2.4. Sediment Carbon Stock Determination

Two parameters were determined from each sub-plot to estimate the soil carbon pool, namely (a) dry bulk density and (b) soil organic carbon content (% Corg).
Soil samples were taken from undisturbed portions from each sub-plot chosen randomly using a soil auger (1.3 m high and 6 cm in diameter). Total soil carbon was determined by partitioning the soil horizon into depth intervals of 0–15, 15–30, 30–50, and 50–100 cm, respectively. The bulk density and soil carbon content for each layer were separately determined and analyzed. Separate soil samples were collected for soil bulk density determination and soil organic carbon content (Corg) analysis, respectively. Soil samples for Corg were sent to the Central Mindanao University Soil Laboratory for analysis, while dry bulk density was calculated using the following formula:
Bulk Density (g/cm3) = oven-dried weight of soil/Volume of Soil Corer
where the volume of soil corer = πr2h
Finally, soil organic carbon per hectare was determined using the following formula used by [7,32,33].
Soil carbon (Mg ha−1) = bulk density (g cm−3) × soil depth interval (cm) × %C

2.5. Data Analysis

We tested the significant differences in the tree density, aboveground biomass, and soil carbon stock at different levels in the soil profile separately for each site using Tukey’s HSD Test at the 95% level of confidence. Boxplots and bar plots were carried out using the ggplot2 package [34].
A density plot was generated in order to visualize the distribution of data over a continuous interval. Kernel smoothing allows for smoother distributions by smoothing out the noise. The peaks of the density plot display where values are concentrated over the interval. The y-axis is the probability density per unit on the x-axis. Density represents the probability that a given x value will be at that range. It is normalized such that adding up all the probabilities for the x values should be equal to 1. The density plot was carried out using ggpubr, plotly [35], tidyverse [36], and reshape2 [37] packages. All analyses were processed in R version 4.1.1 [38].

3. Results

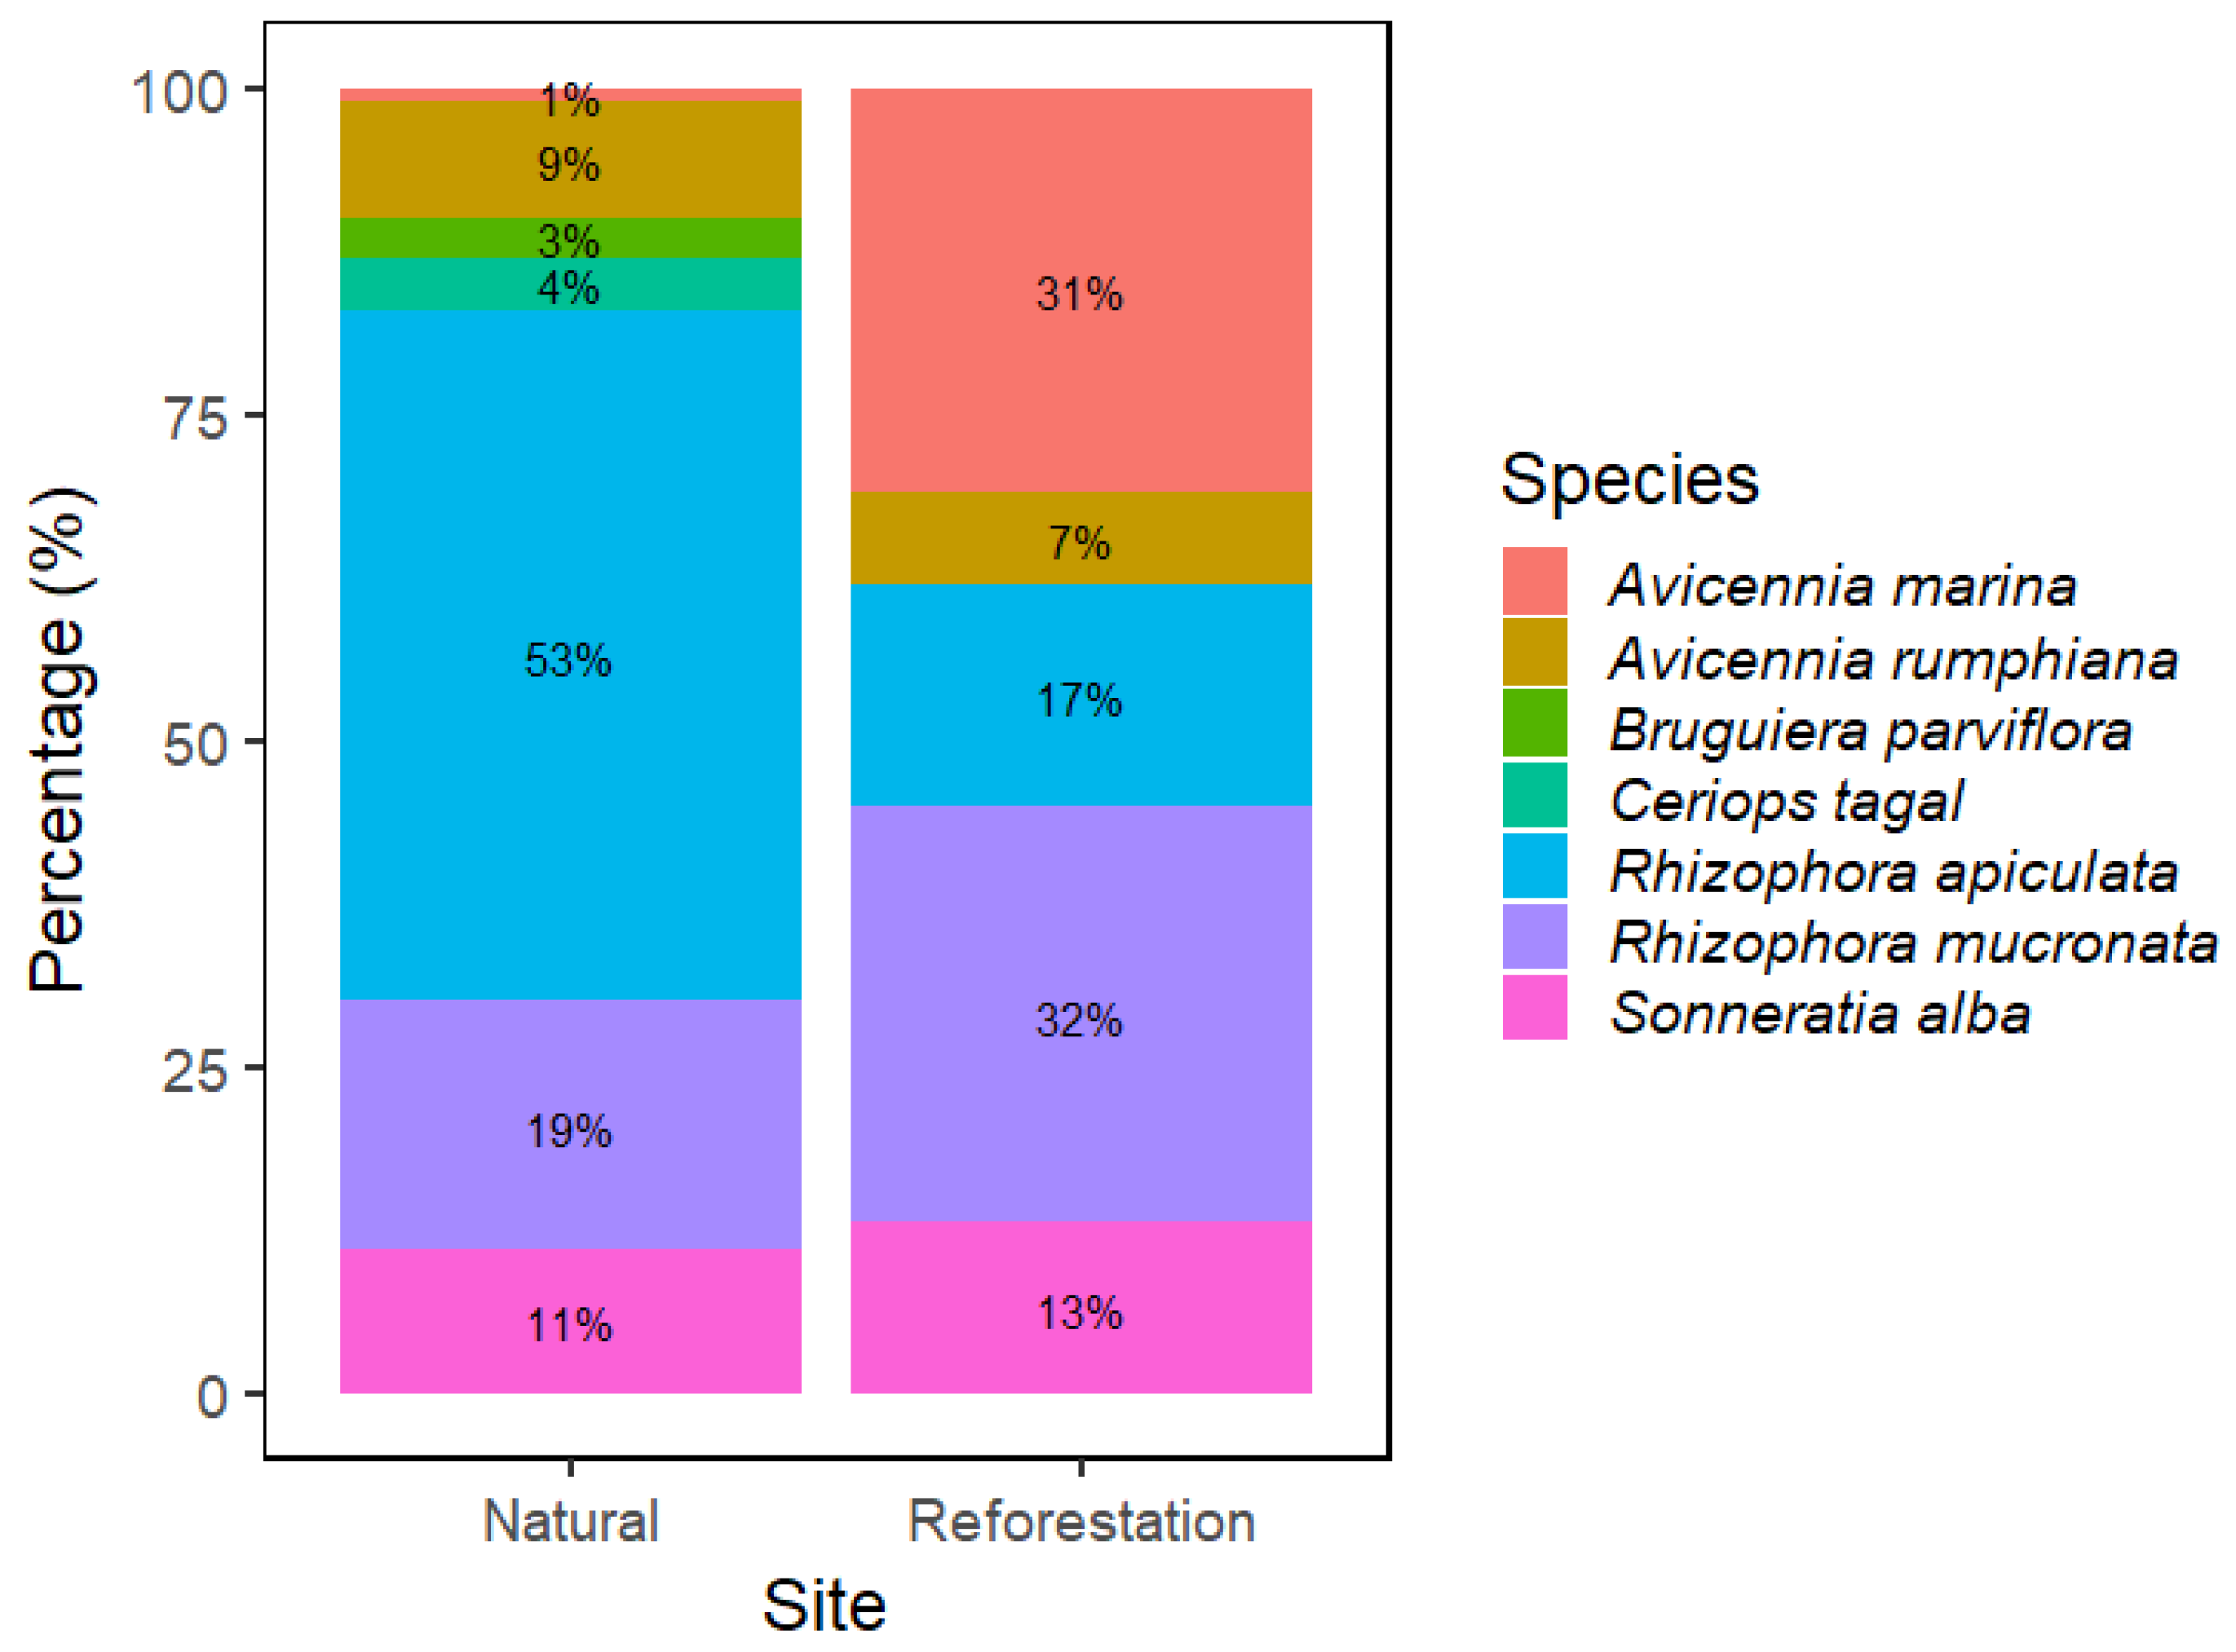
3.1. Major Species Composition

There were seven common species recorded in the natural mangrove stand (Figure 3). Among these species, R. apiculata was dominant, constituting 53% out of the 211 recorded individual trees in all plots. R. mucronata of the same family as R. apiculata had the second-highest number of trees, which composed 19% of the total number of individuals. The high number of Rhizophora species in the area even if the area is facing the open sea because of the presence of S. alba in front.
There were more individual trees recorded at the reforestation site (271 trees) than at the natural mangrove forest across all plots, although only five dominant species existed. Out of these 271 trees, 88 and 84 individuals were R. mucronata and Avicenia marina (Forsk.) Vierh (common name Miapi), respectively (Figure 3). These species constitute 32% and 31% of the total number of species recorded at the reforestation site.

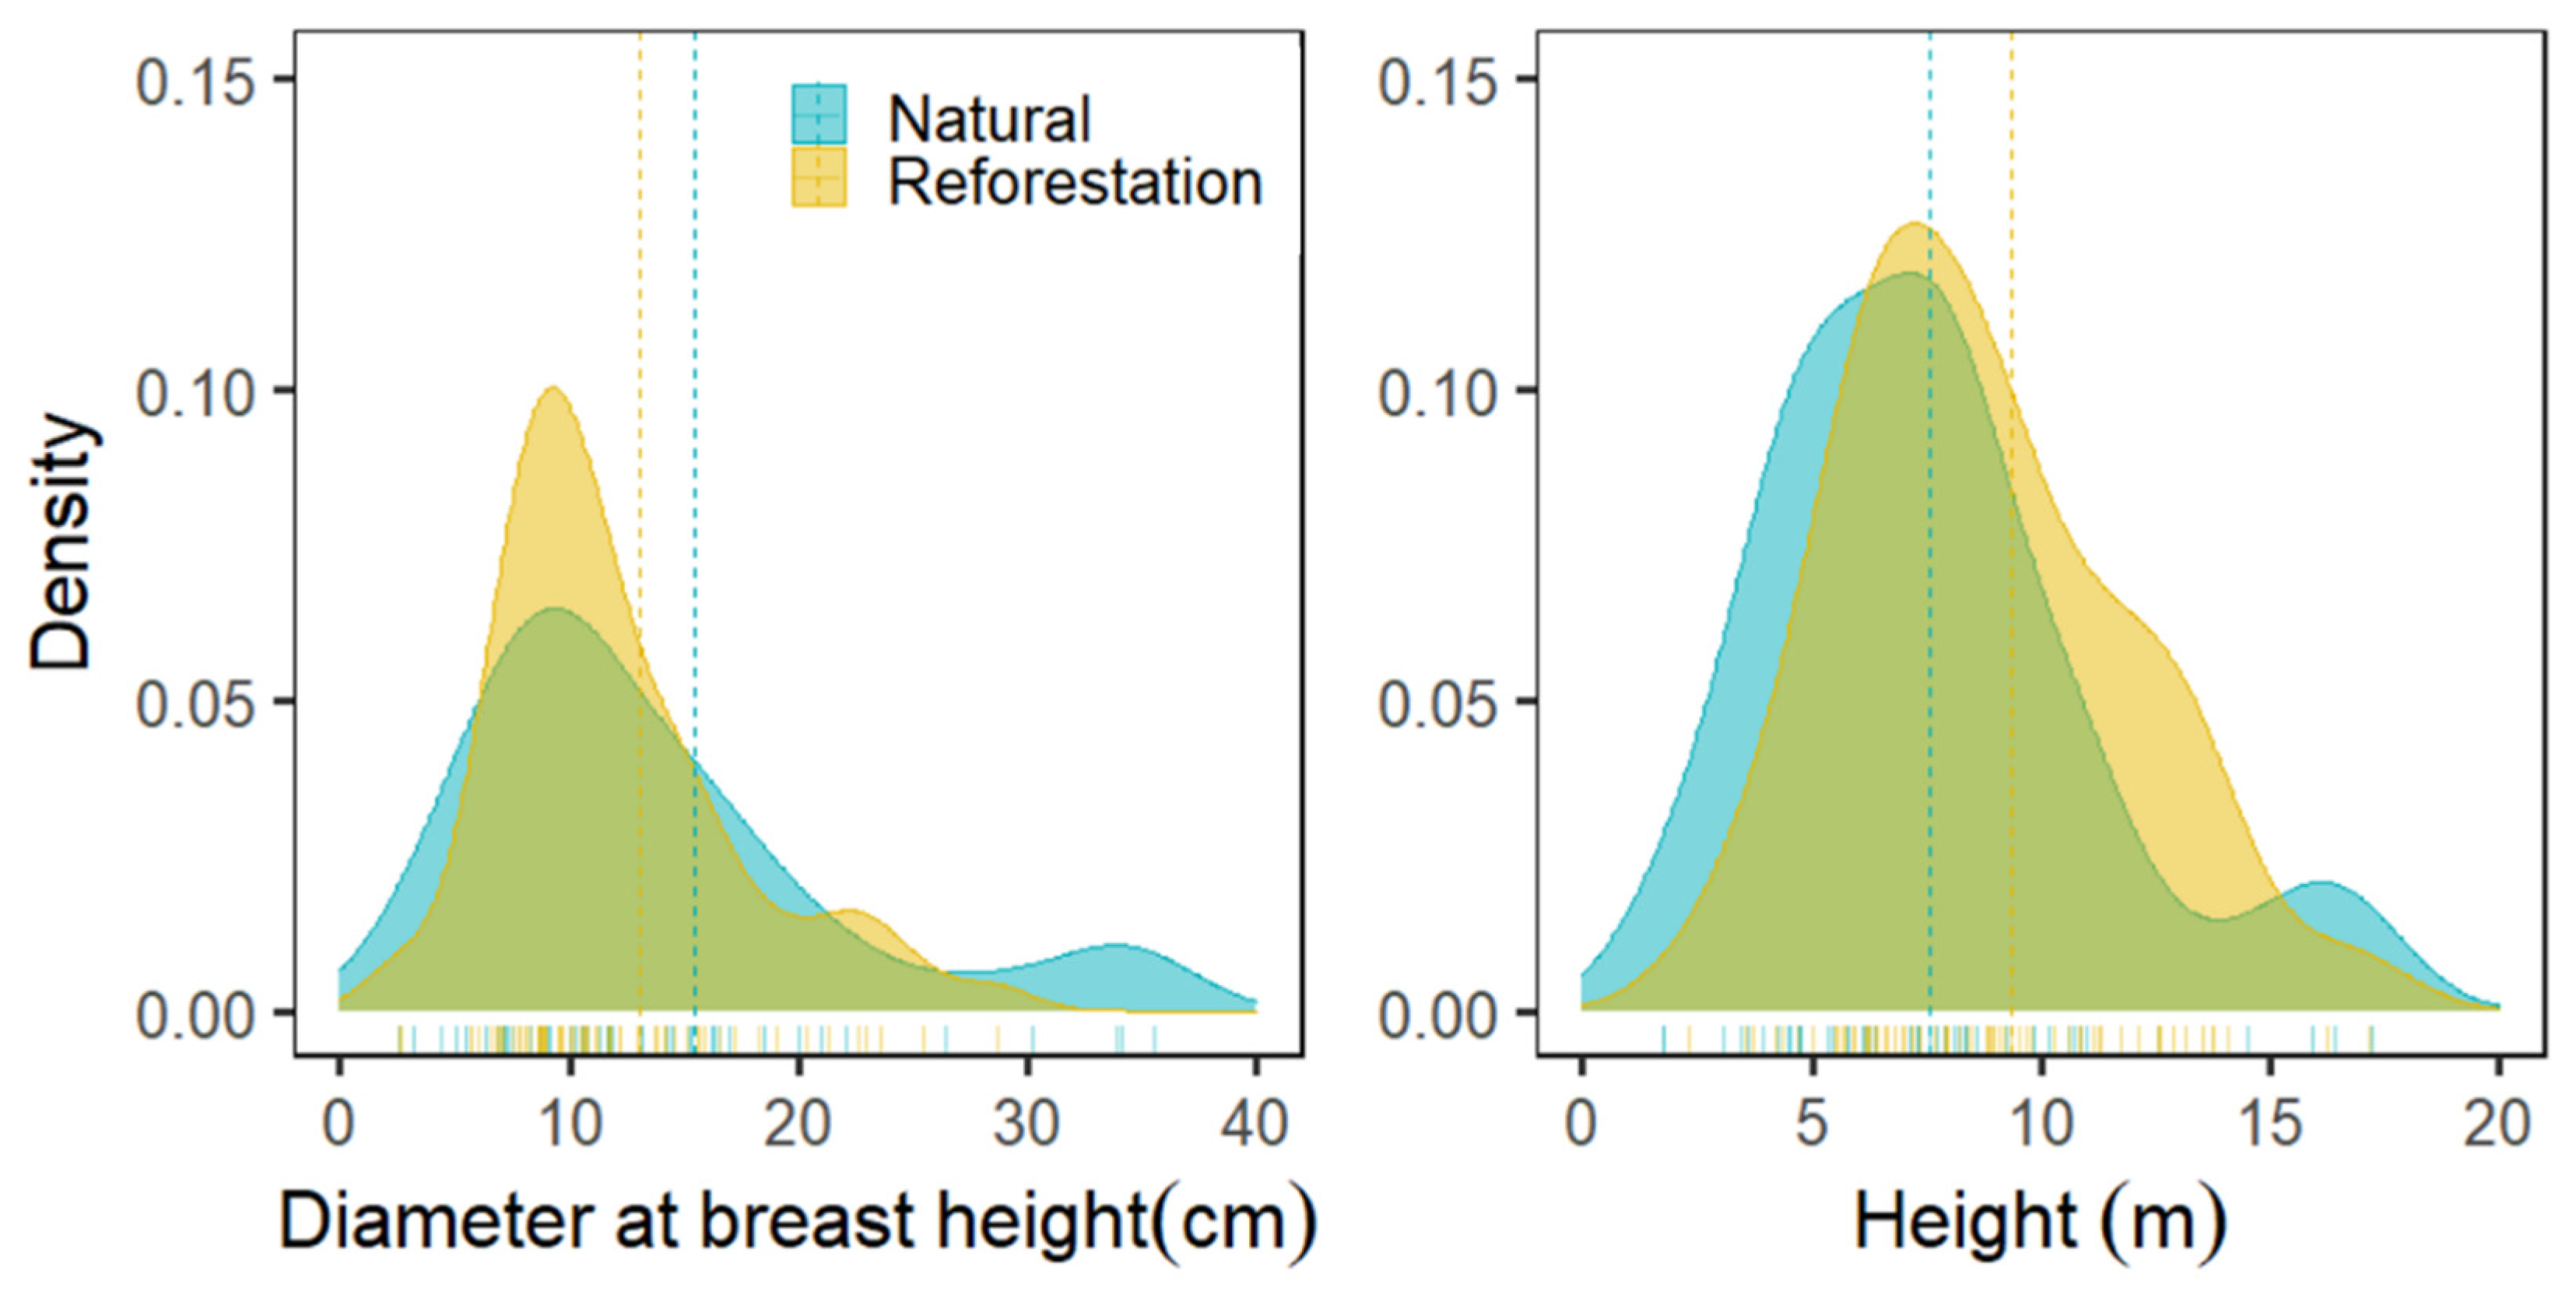
3.2. Diameter and Height Distribution

Based on the diameter at breast height (dbh), the reforestation site had higher dbh in the 5–20 cm diameter classes than the natural stand (Figure 4). However, the natural forest stand had higher dbh in >30 cm diameter classes. In both sites, the species with the highest dbh was Sonneratia alba. The natural forest had higher tree density in extreme low (3–7 m) and high (15–18 m) height classes. However, the reforestation site had a higher density in intermediate heights; the 8–14 m height classes.

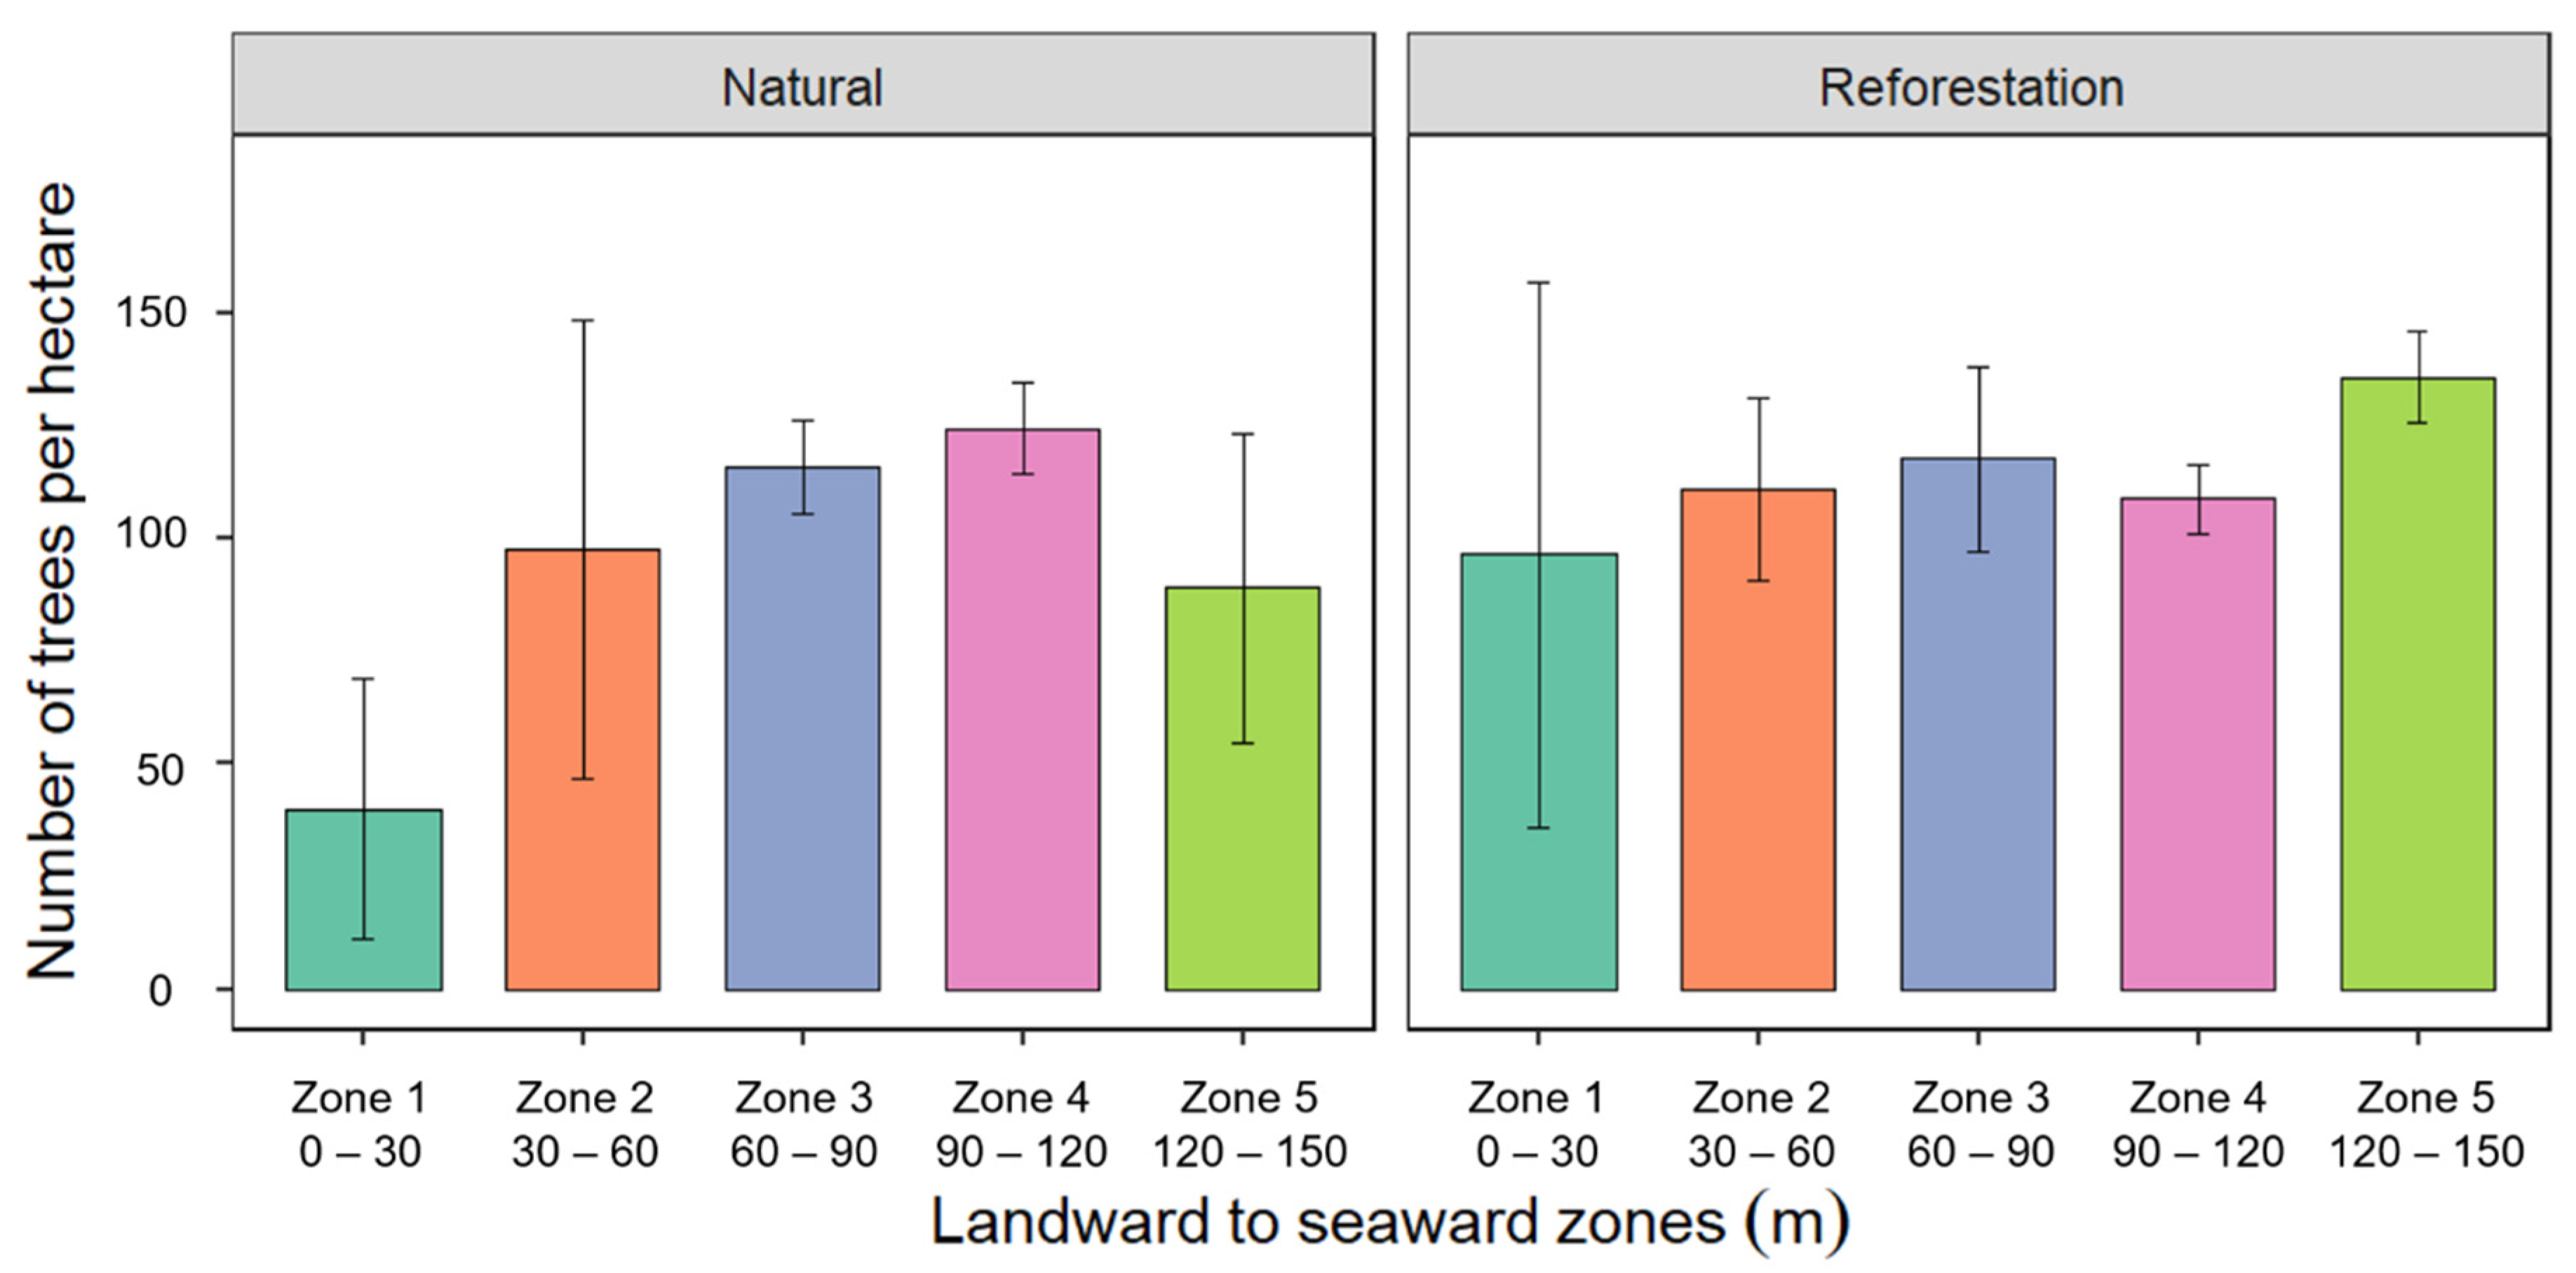
3.3. Tree Density from Landward to Seaward Zones

Extrapolating the tree density on a per hectare basis, we found that the tree density from landward to seaward zones at the natural mangrove forest varied from 36 (Zone 1), 88 (Zone 2), 104 (Zone 3), 112 (Zone 4), to 80 trees ha−1 (Zone 5), with the vegetation more concentrated at the middle zones 2, 3, and 4 (Figure 5). Overall, the total tree density in the natural forest is 420 trees ha−1. However, at the reforestation site, the distribution of trees was fairly distributed all over the five zones with 114, 100, 106, 98, and 124 trees ha−1 for Zones 1, 2, 3, 4, and 5, respectively. The total tree density at the reforestation site was 542 trees ha−1. There were no significant differences within and between each site in the number of trees growing from landward towards the seaward zones (p > 0.05; Figure 5). This result indicates that the topographic position did not affect the distribution of trees in these two studied sites. However, the reforestation site had a higher tree density than the natural mangrove forest (p < 0.05).

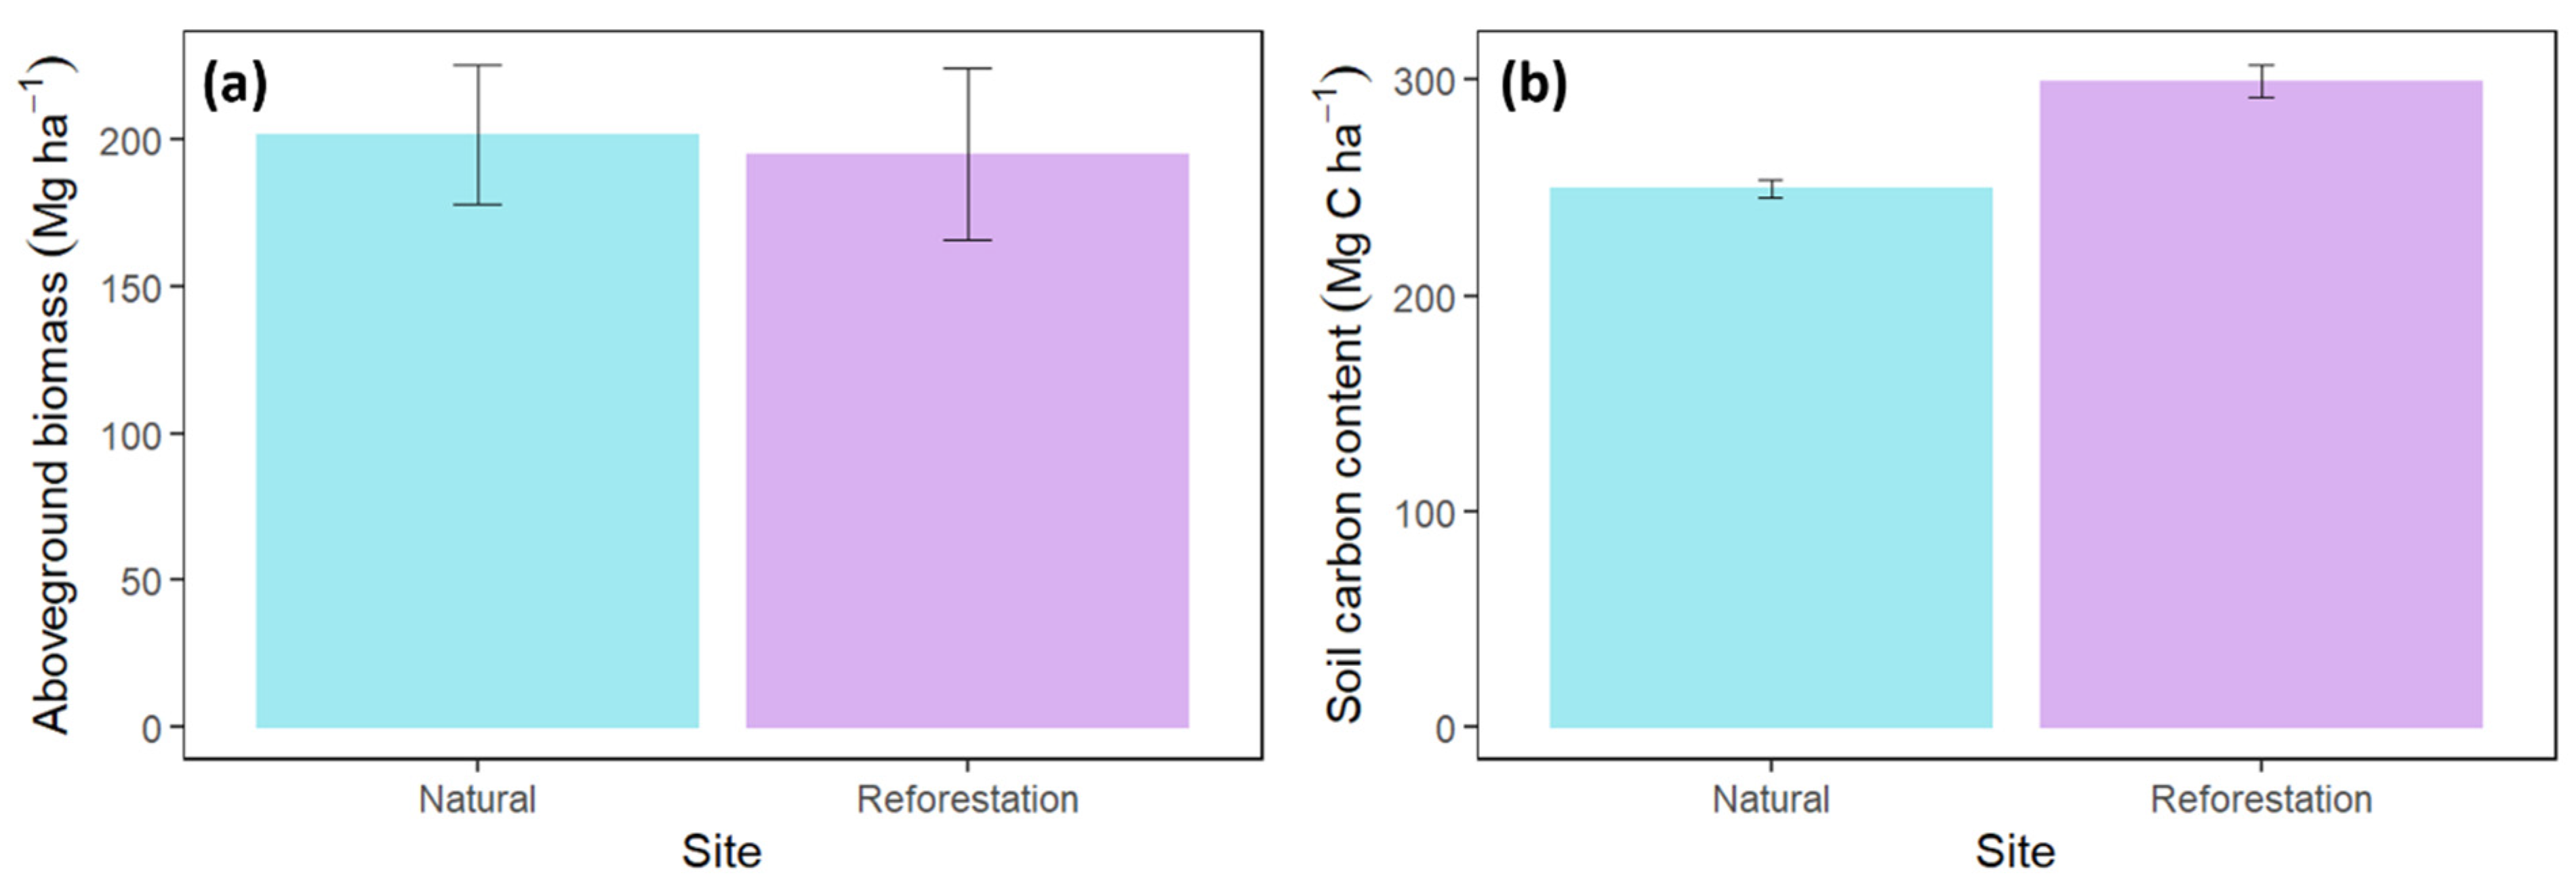
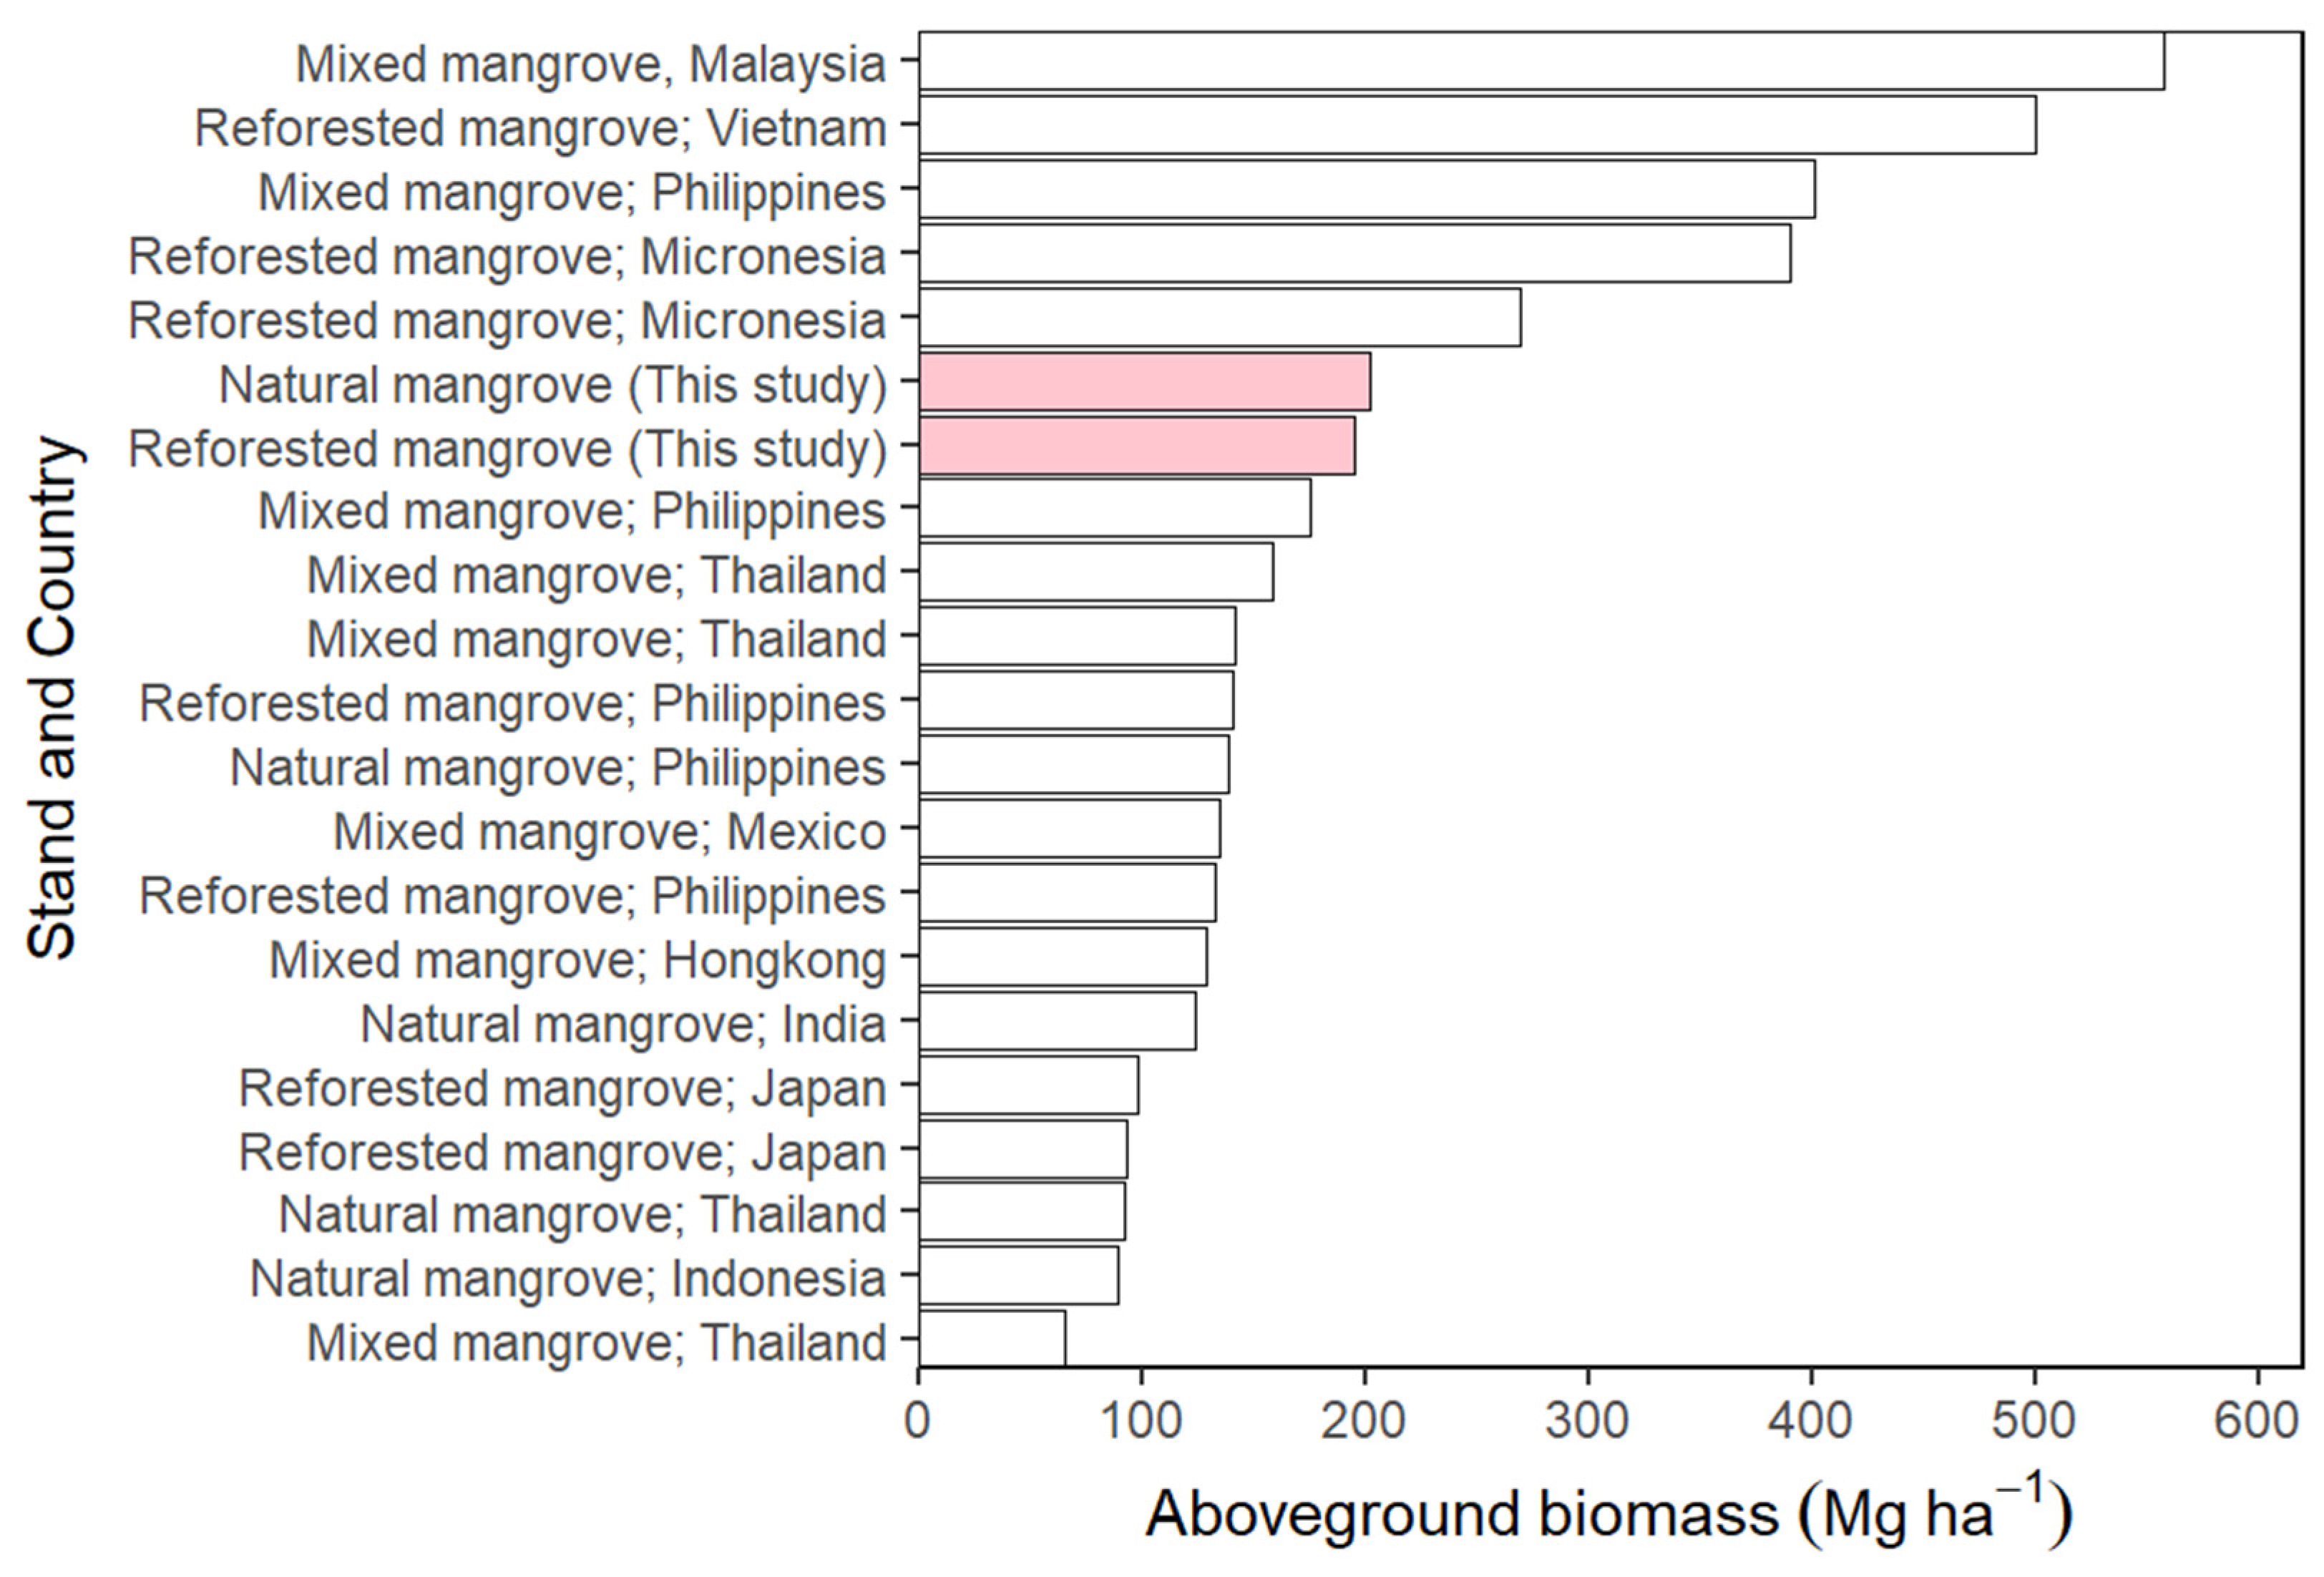
3.4. The Aboveground Biomass

The total average aboveground biomass in the natural mangrove forest was 202.02 ± 24.79 Mg ha−1. Surprisingly, the total average aboveground biomass at the reforestation site was close to that of the natural forest (195.19 ± 29.2 Mg ha−1) (p > 0.05). The average aboveground biomass from landward to seaward zones (Zones 1–5) varied from 60.89 ± 47.81 to 371.64 ± 87.60 Mg ha−1 at the natural stand and 83.22 ± 24.09 to 226.29 ± 63.87 Mg ha−1. However, no significant differences were found in the total average aboveground biomass between the natural and reforested sites (p > 0.05; Figure 6).

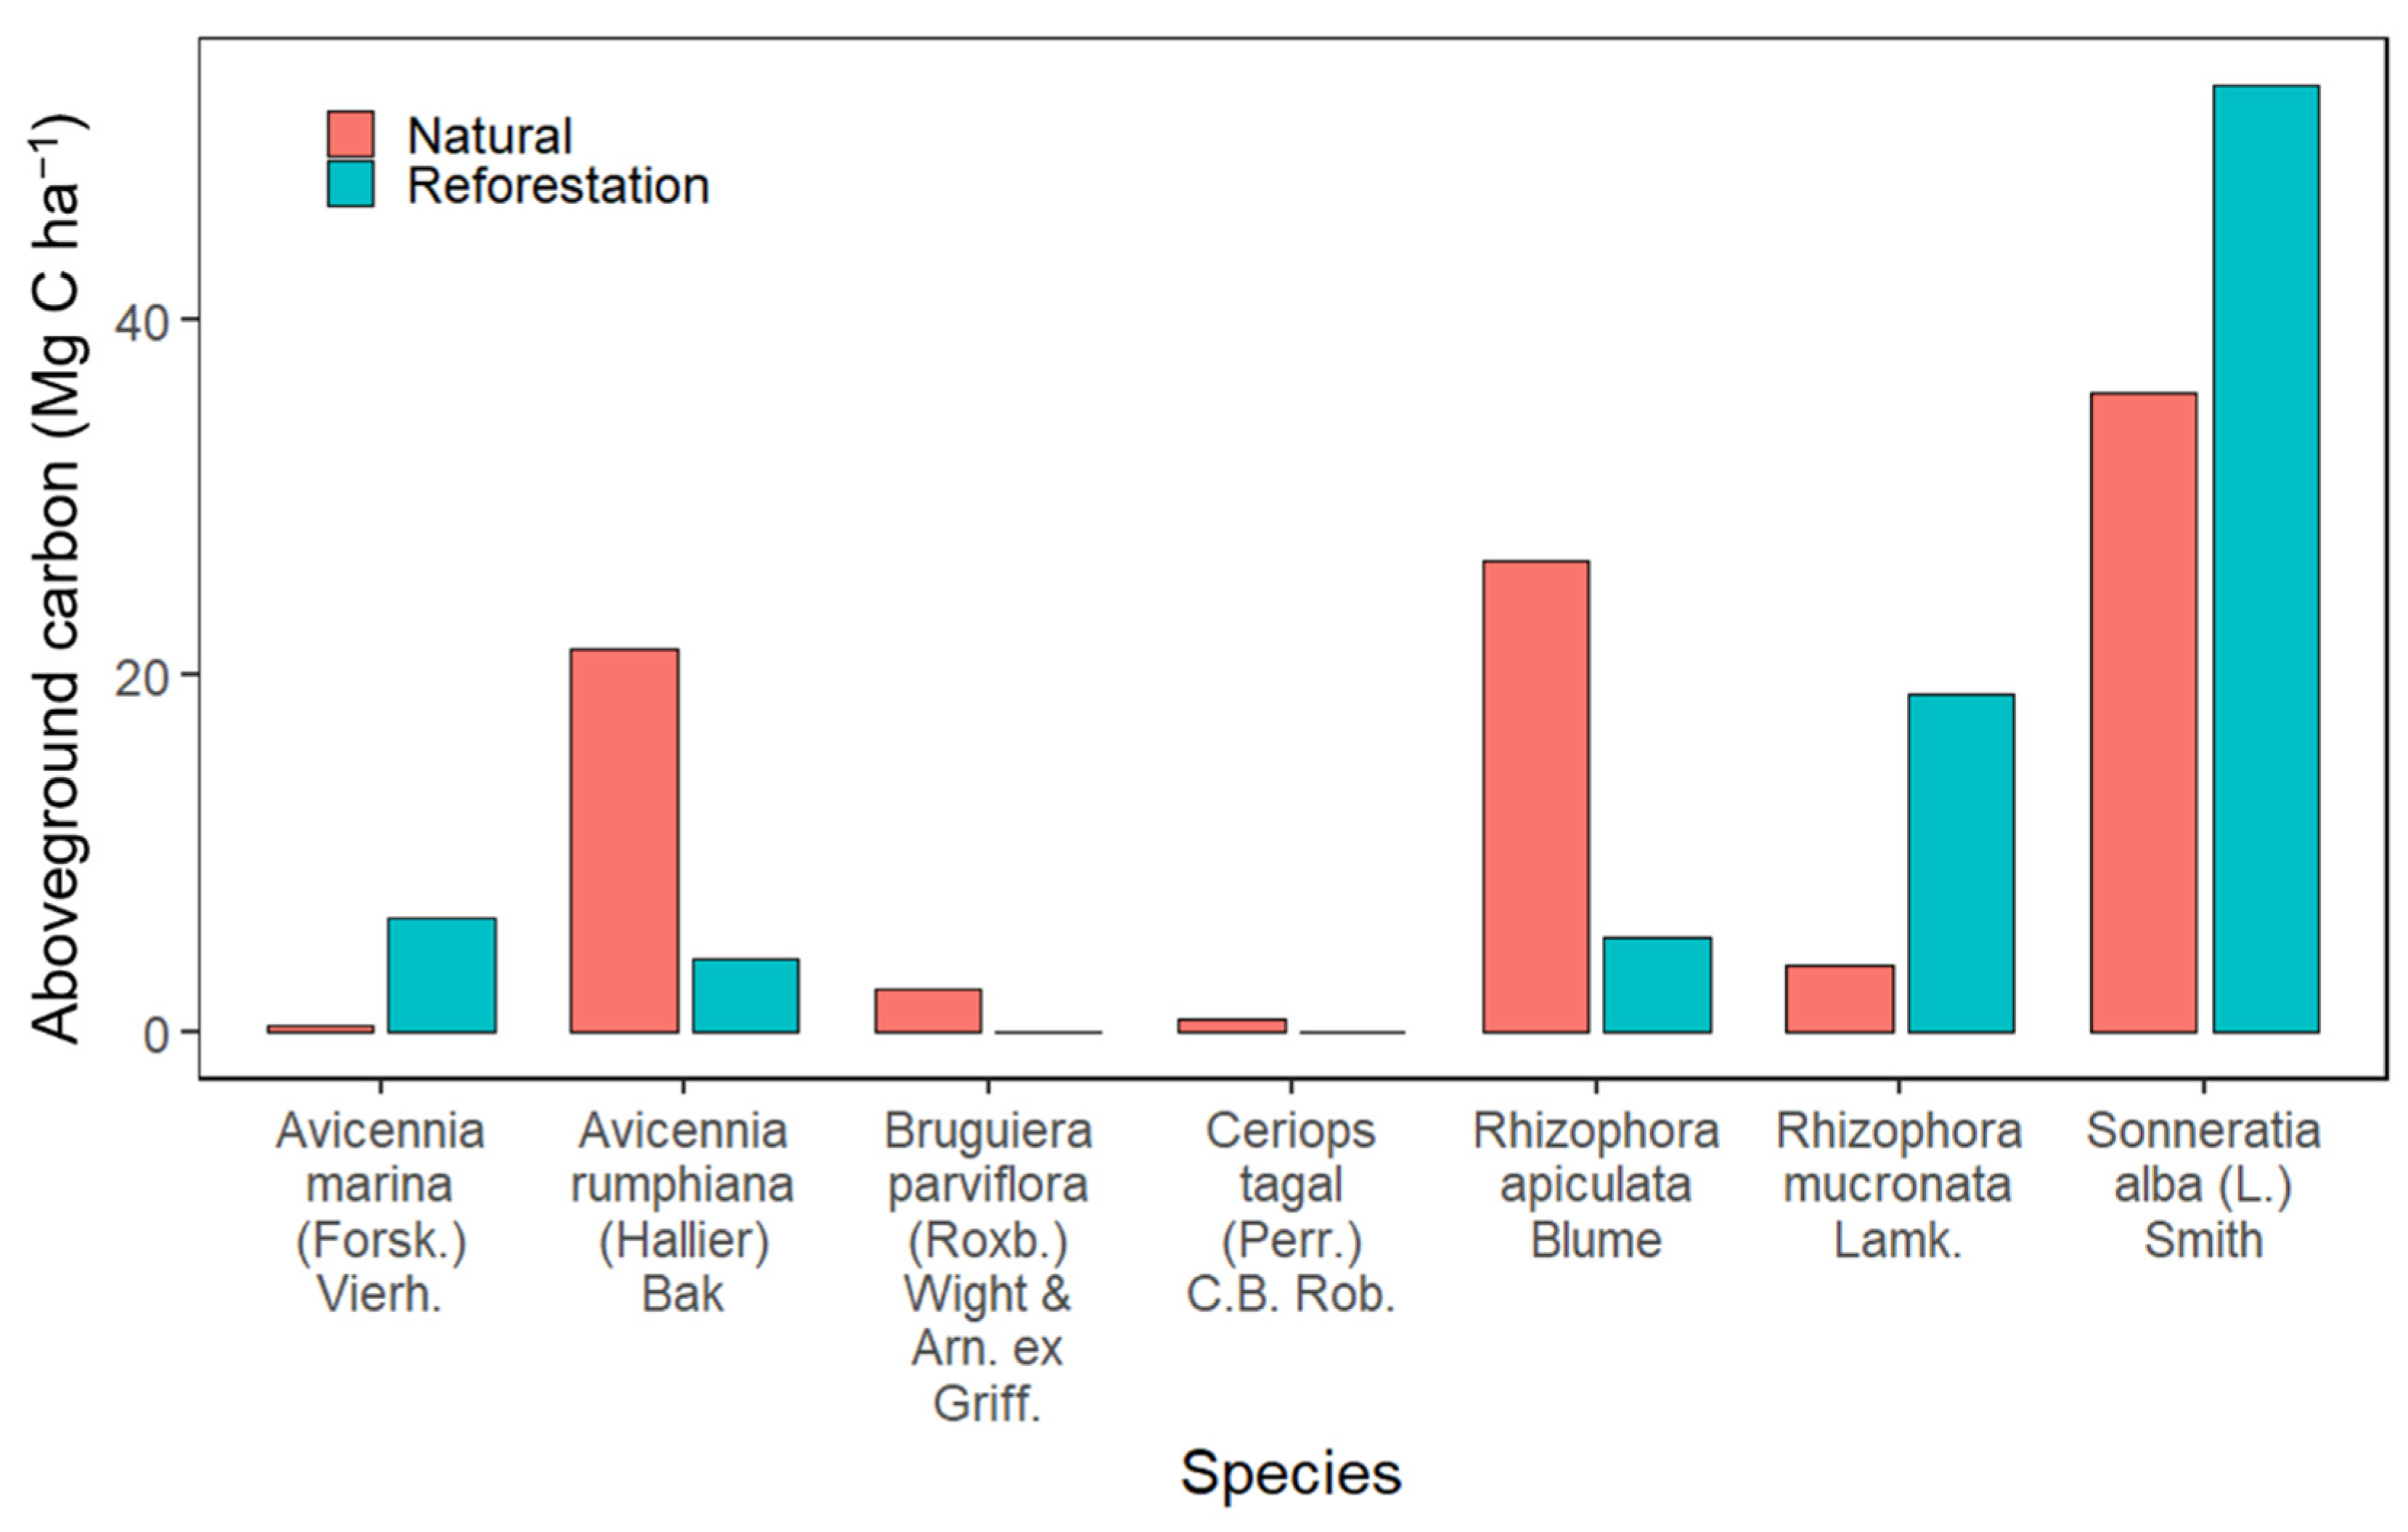
3.5. The Aboveground Carbon Estimates

The total aboveground C in natural mangrove forests was 90.52 ± 1.42 Mg C ha−1, a value surprisingly close to the aboveground carbon estimates at the reforestation site (87.84 ± 1.09 Mg C ha−1) (p > 0.05). The species that drove the aboveground C in the natural and reforestation site was S. alba (Figure 7). This species is characterized by its huge trunk and branches (Figure 8a,d). Avicennia rumphiana (Hallier) Bak (common name Bungarol) and R. apiculata (Figure 8b,c) came next to S. alba, especially at the reforested abandoned fishpond sites. In both studied mangrove sites, we found no significant differences in aboveground C from landward to seaward zones (p > 0.05).

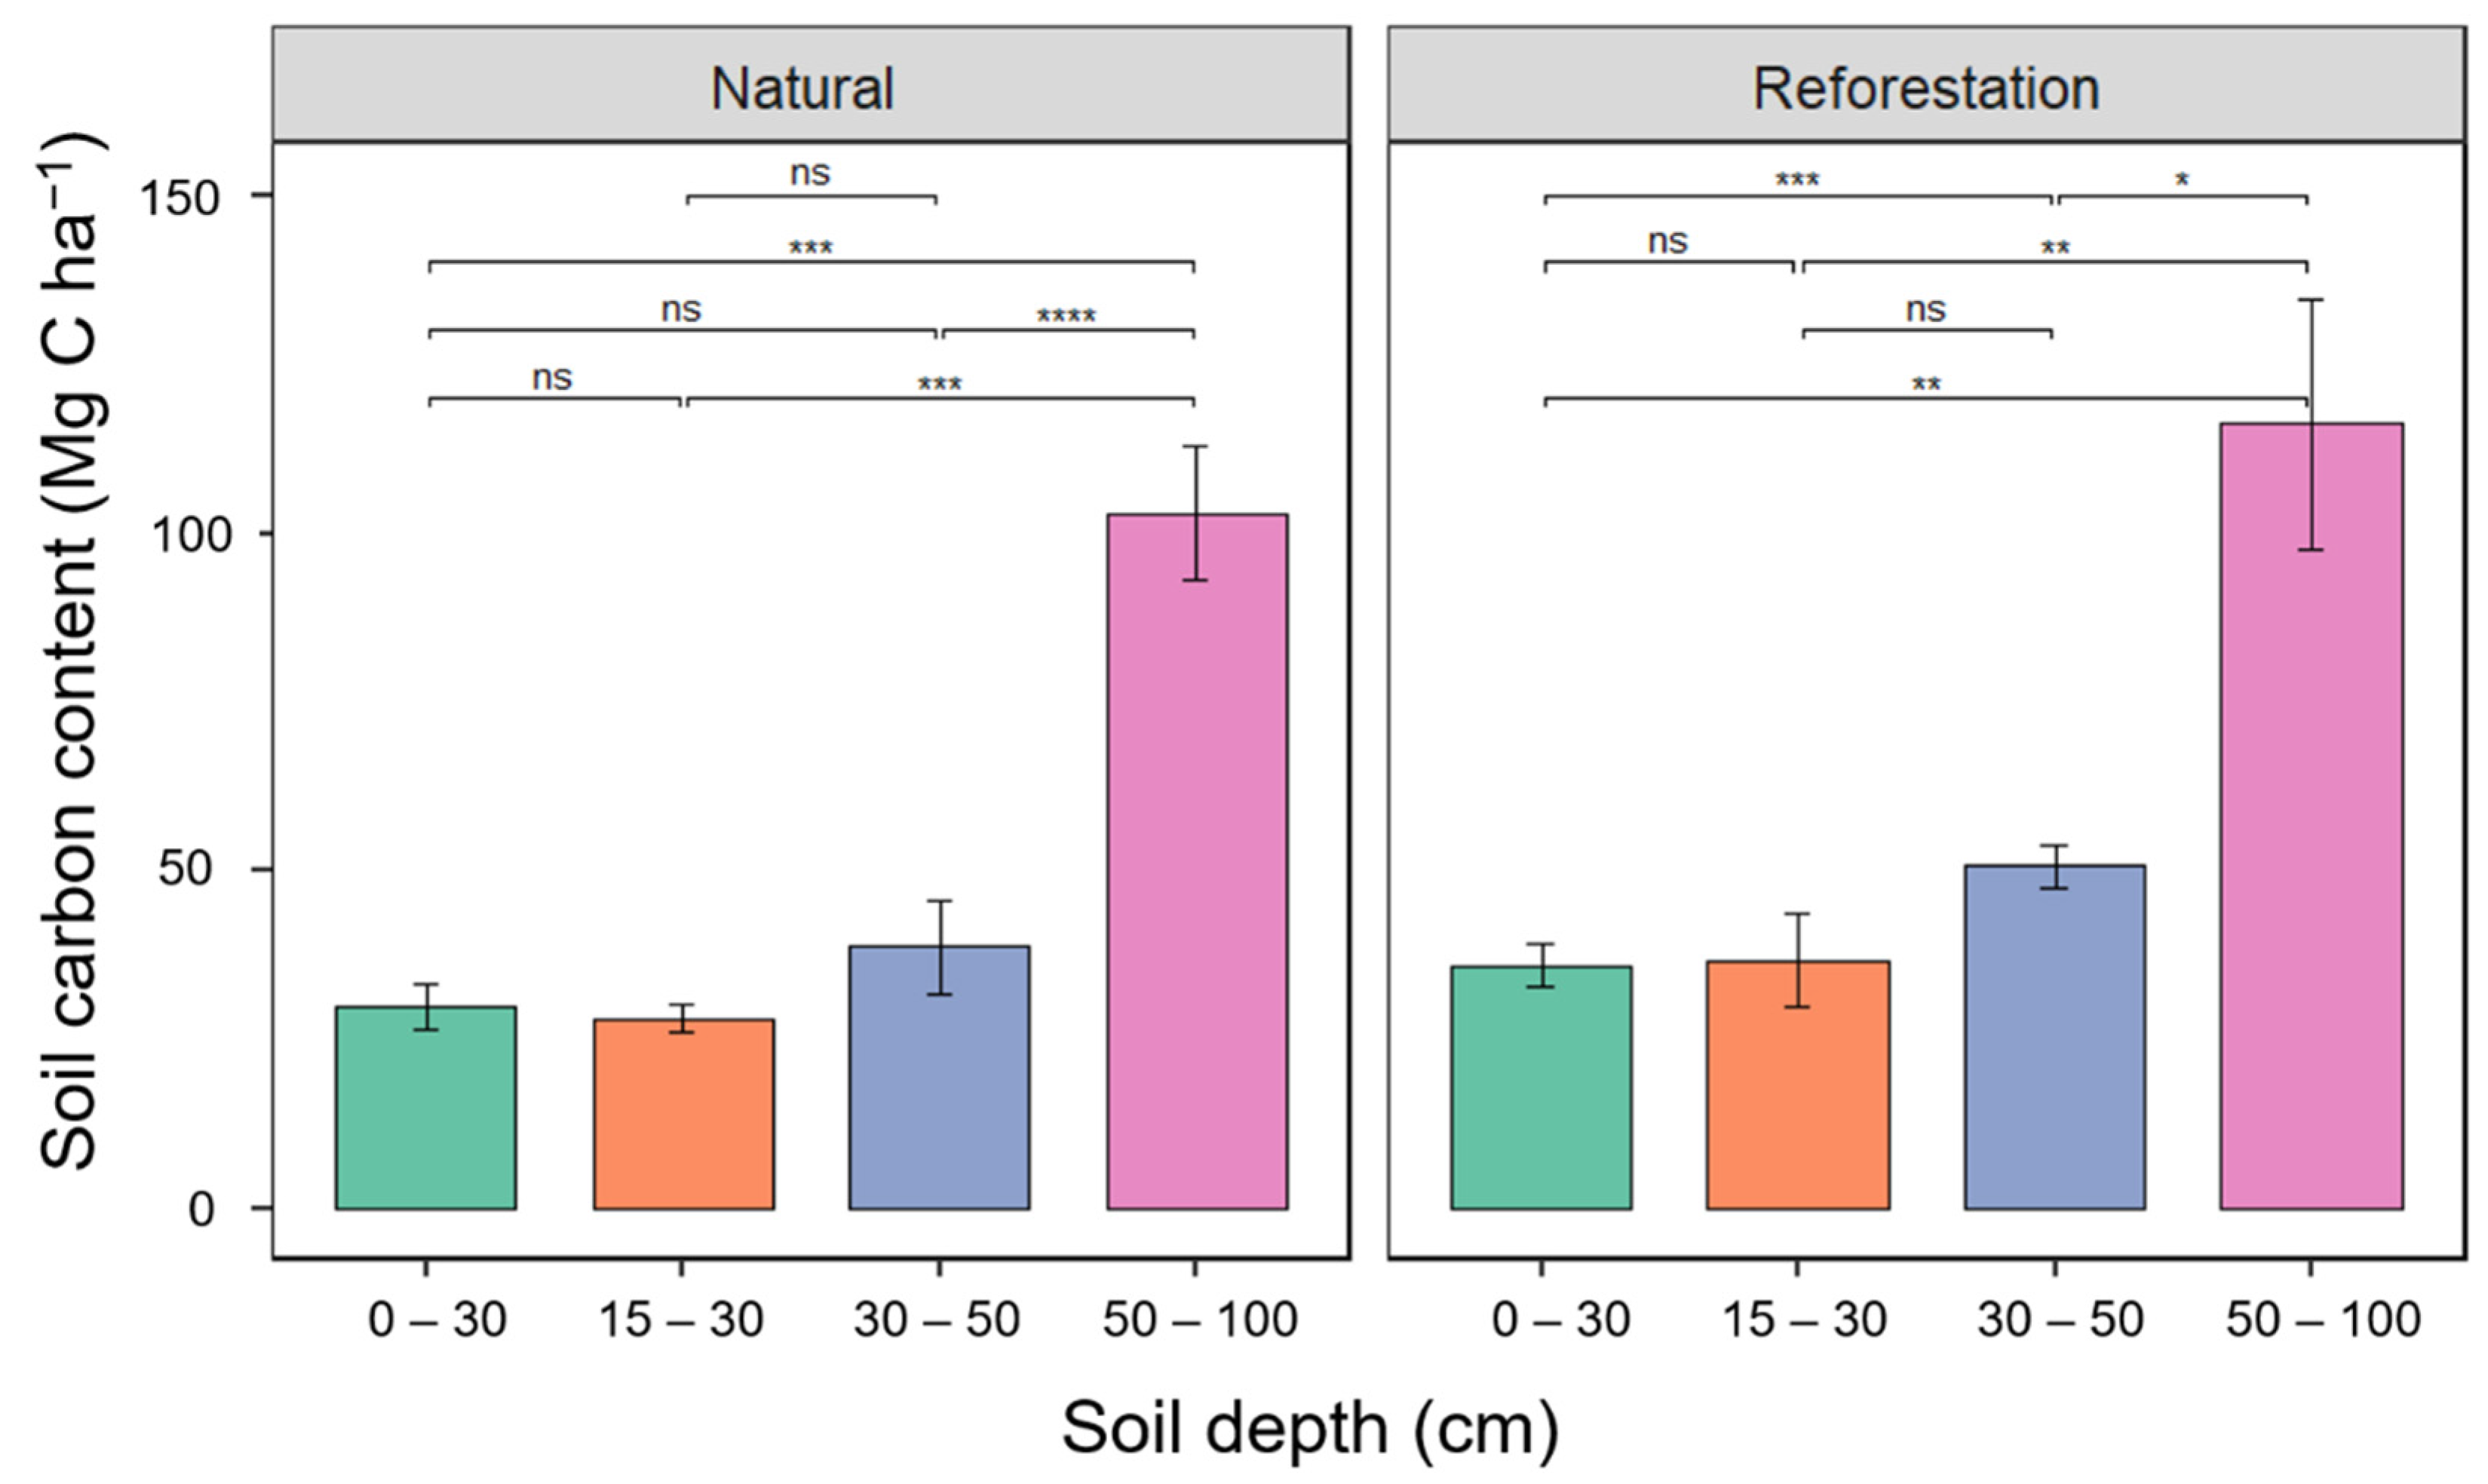
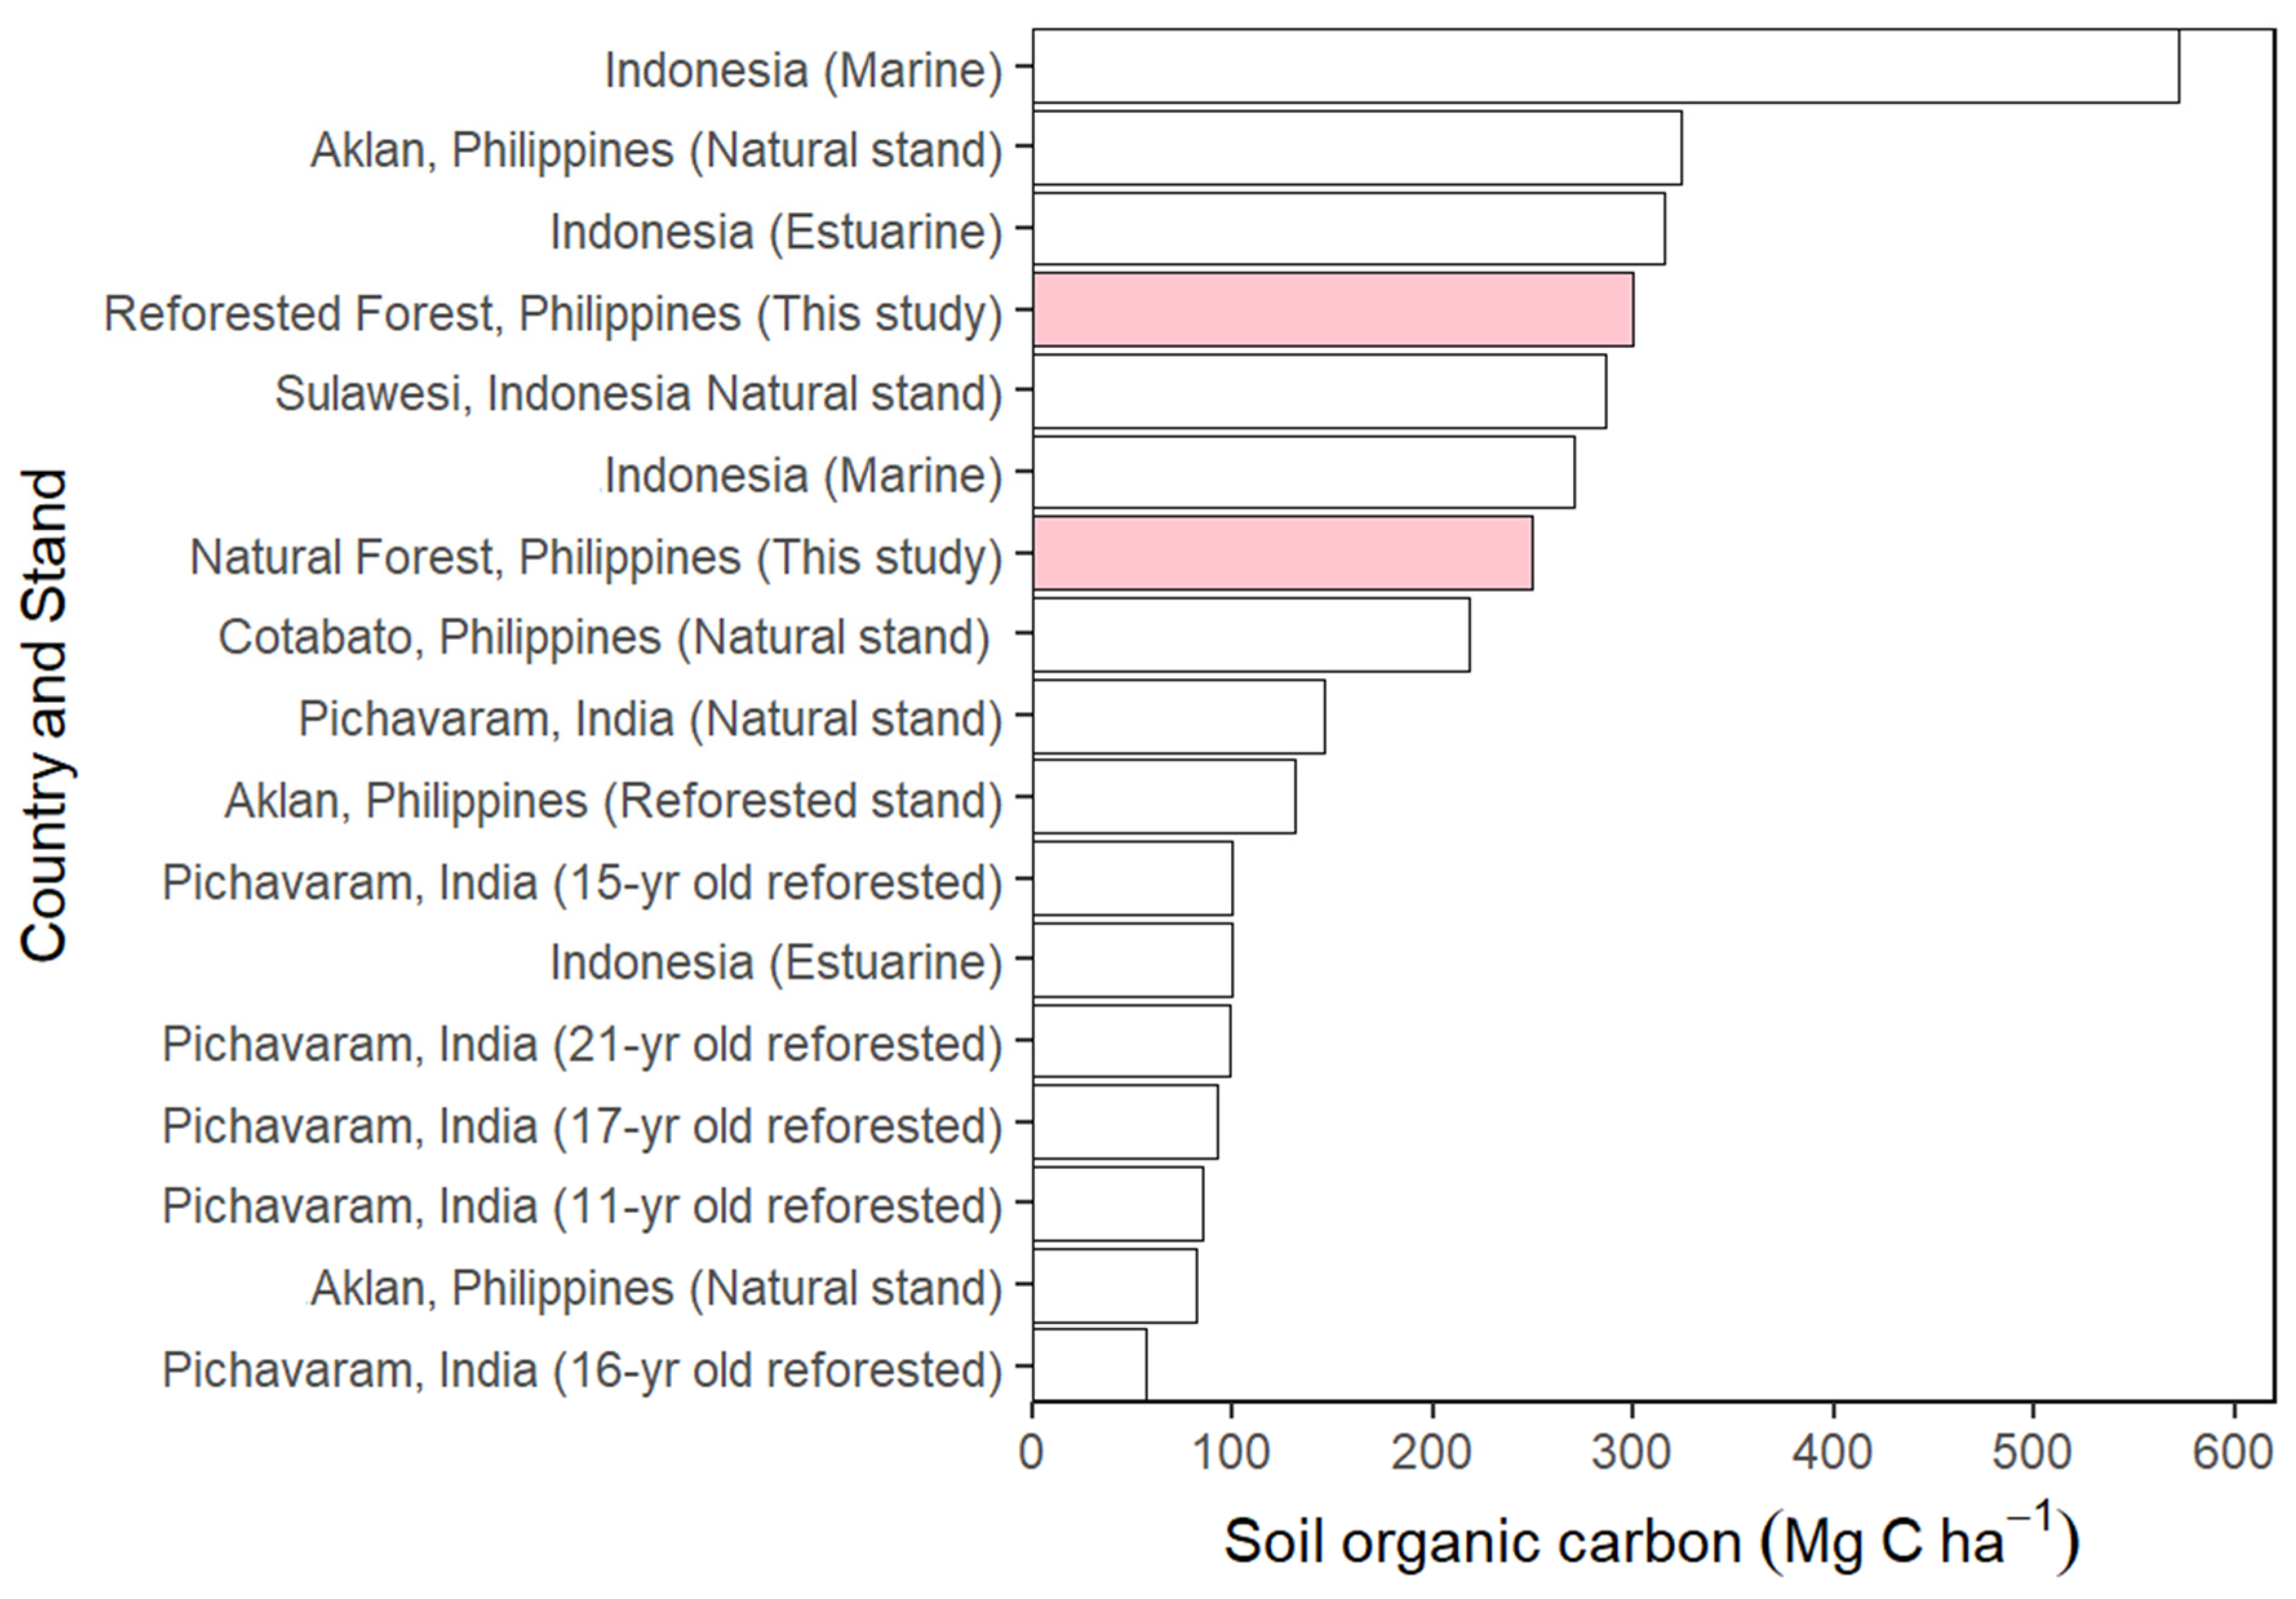
3.6. The Soil Carbon Stock

The overall soil C content in the natural forest was 249.85 ± 4.20 Mg C ha−1. This is 49.99 Mg C ha−1 lower than at the reforestation site with 299.75 ± 7.56 Mg C ha−1, but they are not statistically different (p > 0.05; Figure 6). As the soil got deeper, there was an increasing soil C content (Figure 9). In the natural forest, the soil C content was 29.85, 28.20, 38.84, and 102.98 Mg C ha−1 from the soil depths that range from 0–15, 15–30, 30–50, and 50–100 cm, respectively (Figure 9). Higher soil C content tendencies were found at the reforested stand, which started from 36.04 Mg C ha−1 at the shallowest 0–15 cm soil depth and increased to 36.87 Mg C ha−1 at 15–30 cm, 50.81 at 30–50 cm, and up to 116.07 Mg C ha−1 at the deepest 50–100 cm depth. Significant differences can be found in the soil C content at deeper layers from 30–100 cm but not at the shallow 0–15 cm depth (Figure 9). No significant differences were found in the average soil C content across transects traversing from the landward to the seaward zones within each natural and reforested site nor between these two mangrove sites (p > 0.05).

4. Discussion

4.1. Species Composition

R. mucronata and R. apiculata were widespread in all identified zones of both natural and reforestation sites from seaward to landward. In the natural forest site, these Rhizopora species account for about 73% of the total number of individuals (Figure 3), while together, they constitute 49% in the reforested site. The distribution of R. mucronata and R. apiculata all over the sampling zones in both sites suggests their tendency to thrive well, survive, and dominate the mangrove area. Their widespread distribution indicates that they can survive high currents and tidal fluctuations. The high frequency of these Rhizophora species can be attributed to the viability of their fruits, which can last for months and may eventually grow as it reaches a suitable site. These species produce single-seeded fruits that germinate while still on the tree [17,39]. These findings are consistent with the study, which found that the Rhizoporaceae family was abundant in their study sites, with R. apiculata having the highest count per unit area [40].
In the reforestation site, R. mucronata is the most common species. When the abandoned fishponds were rehabilitated, R. mucronata was used because this species can grow anywhere in the mangrove area. R. mucronata species is widely distributed from the seaward to landward zones, although these species favor soft mud with tidal water. The high survival of the R. mucronata species that can survive high currents and tides makes these species abundant in all mangrove areas in the Philippines and even in other countries [41]. Moreover, the recruitment of propagules of the genus Rhizopora is very fast. Hence, this species is highly preferred in any mangrove reforestation effort. The abundance of R. mucronata in our study site was consistent with other studies in Imelda, Dinagat Island [40], and in Tacloban City [42], both in the Philippines. Our study with 7 mangrove species at the natural stand and 5 at the reforestation site was relatively low in diversity compared to 10 mangrove species reported in a survey conducted in Imelda, Dinagat Island, Philippines [40].

4.2. Diameter and Height Distribution

Surprisingly, 30 years after the abandoned fishpond rehabilitation, the dbh within 5–15 cm dbh classes and 5–15 m height class distribution within the reforestation site exceed that of the natural forest. Taller trees in the 5–15 m classes in the reforested abandoned fishponds are likely due to the denser condition of the stands, which enhances tree growth. Trees tend to compete intensely for sunlight with closer canopies such that the development is more concentrated vertically than in diameter growth.
The lower dbh and height growth at the natural site may imply the age effect on the structural growth of trees in the natural forest. As the trees reach the climax stage, which is the final stage of biotic succession attainable by this mangrove vegetation, the structural growth of trees may already slow down, only maintaining the mechanical support of trees until it will reach the senescence stage. We did not examine the seral stages of succession here, but we assume that this lower height and diameter growth in the natural stand follow the ecological succession pattern in the mangrove ecosystem. However, we do not disregard the varying effect of topography, climate (e.g., wind speed, rainfall light, temperature, precipitation) [43,44,45], frequency and severity of disturbances (e.g., drought, flooding, storm surge) [46,47,48,49], tidal actions, and other biological and environmental factors that may affect the structural growth of a sea-facing natural stand over that of the rather inland sheltered bay location of the reforestation site. Further studies are needed to verify these accounts.

4.3. Tree Density from Landward to Seaward Zones

No significant differences in tree density across the landward to seaward zones in the natural and reforested site indicate that topographic position, regardless of forest type, will not affect tree density and species distribution. Accordingly, the mangrove density is greatly affected by the age or maturity of the stands rather than the topography [50]. Reports showed that mangrove stands might attain forest maturity 11 years after planting [10]. Both sites have already reached the maturity stage, so the absence of significant variations in tree density may occur. Young mangrove plantations may be vulnerable to tree mortality, but after moving past the sapling stage to maturity, mortality slowed down until the senescence stage. This also justifies that even though the natural site was facing the seafront and the reforestation site was relatively inland, this spatial variation between the two sites did not affect the tree density and species distribution from landward to seaward zones.
Some studies stated that when mangroves are cleared for fishpond establishment, the whole tree removal within the pond leads to the scouring, drying the pond bottom to “cracking” during regular pond preparation and lowering the substrate [9]. All these disturbances cause the soil to lose its porosity and undergo irreversible compaction and subsidence, resulting in low survival rates [18]. However, this lowering of the survival rate did not seem to occur in our study because there was a higher tree stocking density in the reforestation site, owing, most likely, to the good silvicultural treatment after planting and favorable site conditions. Since there was no chance for us to examine the survival rate and tree stocking during the plantation development, we were uncertain whether the higher tree density in the reforested sites resulted from better survival or due to constant recolonization in the last three decades.
We recognized that the transects we established only stretched up to 150 m long, which may not be long enough to capture each site’s true tree density variability. Therefore, we recommend using longer transect lengths in a wider area coverage to see if this constraint strongly affects tree density and species distribution.

4.4. The Aboveground Biomass

Our hypothesis that the reforestation site will have lower aboveground biomass than the natural stand did not occur. No significant difference in the aboveground biomass between the natural stand and the reforested site was unexpected. This indicates that 30 years (or maybe earlier) after planting, the altered mangrove ecosystem recovered from such soil physical and chemical alterations as long as there were no more additional anthropogenic or catastrophic natural disturbances that occurred.
The aboveground biomass differs significantly among the mangrove species, plant density, and ecology depending on the geographical locations [51]. Although they are located in the same locality, a report emphasized that there can be multiple trajectories in carbon dynamics [52,53]. Although there was no significant difference in aboveground biomass despite geographical location and tree density, structural dynamics of the species existing in the natural forest might contribute to higher aboveground biomass. Matured Rhizophoras and Avicennias occupy the higher spectrum of DBH and height classes in the natural forest (Figure 8a,b), thus contributing to the higher aboveground biomass in the natural stand.
There are many trees per hectare at the reforestation sites. However, the dbh and height classes were skewed at the lower dbh and height classes, especially the Rhizophora species (Figure 8c), resulting in lower aboveground biomass.
No significant difference in the total aboveground biomass at the natural and reforested site suggests that the site productivity may have been saturated [54]. Thus, the trees beyond this point will not yield high carbon stock because they are already approaching the climax stage. This may also suggest that tree mortality is likely to occur for stands beyond this level [55] as part of the seral stage in ecological succession.
Our aboveground carbon in the natural (202 Mg ha−1) and reforested site (195 Mg ha−1) are within the range observed from other studies locally and in other mangrove-rich countries in the world, ranging from 66 to 558 Mg ha−1 [8,56,57,58,59,60,61,62,63,64,65] (Figure 10).
Our structural parameters (stem density, DBH, biomass) were within the observed values in the matured mangrove stands of >20 years [2,41], indicating a good rehabilitation status. Although our aboveground biomass was not in the lowest values in the list (Figure 11), a comparatively low per-hectare vegetation biomass may reflect methodological limitations that may have underestimated the biomass measurement. There was the challenge of biomass calculation for multi-stemmed individuals, the area coverage is not large enough to represent the entire mangrove forest in question, and the common in situ measurement problem on the mobility in the muddy sediments full of highly specialized pneumatophores sometimes reaching 288 ha−1 with an average length of 36.52 cm [15,25], which oftentimes leave some difficult to reach trees unmeasured.

4.5. The Aboveground Carbon Stock

At the natural mangrove site, high heterogeneity of large-diameter and tall species helped attain the total aboveground carbon density (~91 Mg C ha−1) that is comparable with that of the reforestation site with higher tree density. The dominance of taller Avicennia marina and huge Rhizoporas at the natural stand may have contributed to higher vegetation carbon stock. In the reforested site, the multi-species recolonization and less disturbance effects may have made it possible for this site to attain its aboveground C level (~88 Mg C ha−1). Although, other sites reported higher aboveground C than our study sites (e.g., 103 Mg C ha−1 in Batangas, Philippines [8]; 159 Mg C ha−1 in Phuket, Thailand [66]; 135 Mg C ha−1 in Boca Chica, Mexico [66]; and 115 Mg C ha−1 in the Philippines [8]). Our lower aboveground C in the reforested site may indicate possible hydrological or fishpond effluent constraints to biomass production in revegetated abandoned fishponds [2,23]. We supposed further rehabilitation may be necessary to improve the mangrove ecosystem functioning in both the natural and reverted abandoned fishponds at these sites. Our results highlight the potential of seafront mangrove areas for enrichment planting aside from rehabilitating the remaining idle, abandoned aquaculture ponds to increase the capacity of these sites to store aboveground carbon.

4.6. The Soil Carbon Stock

Belowground carbon pools are oftentimes termed as soil carbon. They are largely dominated by the living and decomposing roots, rhizomes, and leaf litter. They are considered to be the largest pool in vegetated coastal ecosystems, and their measurement is critical for determining long-term changes in carbon stocks associated with disturbance, climate change, and land management changes. Belowground soil carbon pools usually constitute 50% to over 90% of the total ecosystem carbon stock of mangroves [7,67].
Figure 11. Comparison of studies on mangrove soil organic carbon in the Philippines and other mangrove-rich countries in Asia. These include an estuarine and marine stand in Indonesia [68,69], a reforestation and natural mangrove stands in the Philippines [20,70,71], and reforestation stands in India [72].
Forests 13 00847 g011
Our soil organic C of 249.85 ± 4.20 Mg C ha−1 in the natural stand and 299.75 ± 7.56 Mg C ha−1 in the reforested site are within the range observed in other parts of the Philippines and in Asia (82 Mg C ha−1 to 572 Mg C ha−1; Figure 11) [20,68,69,70,71,72,73]. A significantly lower soil C content in the natural stand than in the reforested site may be due to the proximity of the natural stand to immediate effects of tidal cycles, hydrologic regimes, erosion, water current, and other factors confronting the seafront-located mangrove sites in the intertidal zones. In contrast, the inland location of the reforested is relatively less disturbed. In addition, mangrove planting will alter soil properties [25]. The mangrove roots enhance soil porosity and water holding capacity and reduce soil compaction resulting from microbial activities and organic matter deposition in the soil.
We found an increasing trend in soil C as the soil layer gets deeper. The repeated interruption of humus accumulation by water dynamics, soil micro-relief, proximity to water bodies and tidal actions, decomposition dynamics, and history of organic and mineral deposits [33,74,75] may result in low soil C stocks in the shallow soil depths (0–50 cm) in contrast to the deeper soils (>60 cm). The mangroves sequester 49%–98% of total carbon in the soil at >30 cm depth in the Indo-Pacific region [7]. Higher soil C at these depths indicates burial and preservation of soil C due to anaerobic soil conditions slowing down the mineralization process [76]. It must be noted that our soil measurements were only up to 100 cm in depth. However, the total C stock may even be larger at deeper layers. Thus, examining soil C at deeper layers is recommended to evaluate the mangrove soil C dynamics effectively.

4.7. Implications of Abandoned Fishpond Rehabilitation

In the past several decades, vast mangrove areas have been converted for aquaculture in the Philippines, altering the nature of the habitat. Aquaculture pond construction leads to alterations to the physical and chemical properties of soil, hydrological conditions, and the flora and fauna composition of the pond area [77]. The Philippines has experienced substantial mangrove loss, with more or less 50% of the former 500,000 ha disappearing over the last century, mainly due to shallow brackish-water fishpond aquaculture development [9]. Yet aquaculture pond abandonment is also common in the country due to disease problems, low productivity, and typhoon devastation [2]. However, most of these are barely quantified.
Unproductive fishponds are rapidly being converted to other land uses, such as cementing mangrove loss (salt pans) [77,78,79] and land-use change for human settlement and other commercial use. However, decadal evidence suggests the significance of abandoned fishpond rehabilitation for conserving mangrove forests (e.g., [2,23,80]). Reverting abandoned fishponds to mangrove stands can benefit coastal community livelihoods through associated fisheries enhancement [81].
Due to a lack of science-based approach standards, countless planting efforts in mangrove areas have failed [18]. Almost all of the reforestation efforts conducted in the Philippines uses R. apiculata and R. mucronata as planting material for reforestation because of its availability and high survivability. That is the reason why the increase in mangrove cover in the Philippines is dominated by the Rhizophora species.
Our study highlights the importance of abandoned fishpond rehabilitation and the contribution it brought in reverting the aboveground and soil carbon storage potentials decades after the restoration. Such mangrove rehabilitation efforts may be relevant in other parts of South and Southeast Asia where idle aquaculture ponds are up for rehabilitation, especially in typhoon-prone countries such as Vietnam and Taiwan [77]. Other countries also include Malaysia (60%), Thailand (50–80%) [78], and Sri Lanka (60–90%) [79]. Thus, despite currently lower per hectare aboveground biomass production than other mangrove sites elsewhere, e.g., Indonesia [68] and Aklan, Philippines [20], carbon-rich sediments enhanced the overall carbon stock potential of rehabilitated abandoned fishponds. Our results have strong implications regarding reverted abandoned fishpond management to intensify massive carbon stocking in the mangrove ecosystem. As forests age, forest productivity and thus forest biomass and C stocks increase [82,83]. A clear example is the mangrove forests of known age in French Guiana [84]. Plantation data from Vietnamese [3,85] and Indonesian [86] mangroves similarly indicate increased C storage with increased stand age.
The high soil organic carbon in a rehabilitated abandoned fishpond may also be attributed to the accumulation of nutrients from fish feeds and fish feces during the operation of the fishpond way back in the 1960s to 1976. Aside from the high accumulation of organic matter from the operation of the fishpond, the high soil organic carbon in mangrove forests can also be attributed to the rapid decomposition rate and accretion of other organic matter due to the diurnal tidal variation of seawater. During the phase of litter decomposition, the C content of the mangrove forest floor increases [87]. The increase in soil organic carbon may decrease atmospheric carbon dioxide and increases soil quality, helps in mitigating climate change [88].
Mangrove carbon stock assessment has gone a step further using satellite imageries applying vegetation indices to estimate the biomass of mangroves. For instance, normalized difference vegetation index (NDVI) is being commonly used coupled with field inventory data in order to establish the relationship between NDVI from satellite imagery and aboveground biomass (AGB) from field observations [89,90]. Furthermore, for a finer resolution to estimate the aboveground biomass, unmanned aerial vehicles (UAVs) light detection and ranging (LiDAR) data are starting to be explored but so far, only a few studies have been reported [91,92,93]. Temporal and spatial analysis of satellite imageries will further enhance the mapping of mangrove areas and monitor mangrove ecosystem health to feed policy and decision-making processes [94], and sustainable mangrove forest management [95,96]. Our study will aid these approaches for ground-truthing and output validation. The collection of real data on actual location enables calibration of this above-mentioned remote-sensing, LiDAR, and other satellite-based indices and aids in interpreting and analyzing what is being remotely sensed. Without ground truth data, the value of the predictive algorithms would become highly questionable and could potentially affect the reliability of the results obtained from inferred satellite data.

5. Conclusions

About 30 years after abandoned fishpond rehabilitation, we found a higher tree density in the mangrove-converted fishponds, presumably due to the strategic inland location of these plantations and silvicultural management immediately after plantation establishment. There were no significant differences found in the vegetation carbon stock, indicating that the kind of species growing in the natural stand (e.g., Avicennia sp.) may have overshadowed the higher tree density at the Rhizophora-dominated reforestation site. A comparable soil C at the reforestation site with that of the natural stand warrants the continuous preservation and restoration of the remaining abandoned aquaculture ponds in the country, not only because they are ecologically and economically important but because of their potential to store huge amounts of carbon that will counterbalance anthropogenic CO2 emissions.
Thus, the active roles of local communities in rehabilitating vast areas of abandoned fishponds coupled with the local government support are quite imperative. Our study calls for a better understanding of the biological and environmental factors that influence the above-and-belowground carbon dynamics of this carbon-rich ecosystem for effective mangrove forest management in the country.

Author Contributions

Conceptualization, H.M., R.A.J., F.L.D. and B.S.; methodology, H.M., R.A.J., F.L.D. and B.S.; software, H.M. and R.A.J.; validation, H.M., R.A.J., F.L.D. and B.S.; formal analysis, H.M., R.A.J. and M.A.; investigation, H.M., R.A.J. and M.A.; resources, H.M. and R.A.J.; data curation, R.A.J. and M.A.; writing—original draft preparation, H.M., R.A.J. and M.A.; writing—review and editing, H.M., R.A.J. and M.A.; visualization, M.A.; supervision, R.A.J. and M.A.; project administration, H.M. and R.A.J.; funding acquisition, H.M. All authors have read and agreed to the published version of the manuscript.

Funding

Primary funding was provided by the Department of Science and Technology—Science Education Institute (Accelerated Science and Technology Human Resource Development Program), Philippines. SY 2017.

Institutional Review Board Statement

Not applicable.

Informed Consent Statement

Not applicable.

Acknowledgments

The authors would like to thank the Department of Biological Sciences of MSU-IIT for the kind support, LGUs of the study sites for their assistance and permit to conduct the study, Bayan Mariano for his assistance, and all colleagues who provided technical and moral support.

Conflicts of Interest

The authors declare no conflict of interest.

References

  1. Long, J.B.; Giri, C. Mapping the Philippines’ Mangrove Forests Using Landsat Imagery. Sensors 2011, 11, 2972–2981. [Google Scholar] [CrossRef] [PubMed] [Green Version]
  2. Lee, S.Y.; Primavera, J.H.; Dahdouh-Guebas, F.; Mckee, K.; Bosire, J.O.; Cannicci, S.; Diele, K.; Fromard, F.; Koedam, N.; Marchand, C.; et al. Ecological Role and Services of Tropical Mangrove Ecosystems: A Reassessment. Glob. Ecol. Biogeogr. 2014, 23, 726–743. [Google Scholar] [CrossRef]
  3. Alongi, D.M. Global Significance of Mangrove Blue Carbon in Climate Change Mitigation. Science 2020, 2, 67. [Google Scholar] [CrossRef]
  4. Kauffman, J.B.; Adame, M.F.; Arifanti, V.B.; Schile-Beers, L.M.; Bernardino, A.F.; Bhomia, R.K.; Donato, D.C.; Feller, I.C.; Ferreira, T.O.; del Jesus Garcia, M.C.; et al. Total Ecosystem Carbon Stocks of Mangroves across Broad Global Environmental and Physical Gradients. Ecol. Monogr. 2020, 90, e01405. [Google Scholar] [CrossRef] [Green Version]
  5. Ouyang, X.; Lee, S.Y. Improved Estimates on Global Carbon Stock and Carbon Pools in Tidal Wetlands. Nat. Commun. 2020, 11, 317. [Google Scholar] [CrossRef] [Green Version]
  6. Duarte, C.M.; Losada, I.J.; Hendriks, I.E.; Mazarrasa, I.; Marbà, N. The Role of Coastal Plant Communities for Climate Change Mitigation and Adaptation. Nat. Clim. Chang. 2013, 3, 961–968. [Google Scholar] [CrossRef] [Green Version]
  7. Donato, D.C.; Kauffman, J.B.; Murdiyarso, D.; Kurnianto, S.; Stidham, M.; Kanninen, M. Mangroves among the Most Carbon-Rich Forests in the Tropics. Nat. Geosci. 2011, 4, 293–297. [Google Scholar] [CrossRef]
  8. Gevana, D.T.; Pulhin, F.B.; Pampolina, N.M. Carbon Stock Assessment of a Mangrove Ecosystem in San Juan, Batangas. J. Environ. Sci. Manag. 2008, 11, 15–25. [Google Scholar]
  9. Primavera, J.H. Philippine Mangroves: Status, Threats and Sustainable Development. In Mangrove Management and Conservation: Present and Future; United Nations University Press: Tokyo, Japan, 2004; pp. 192–207. [Google Scholar]
  10. Salmo, S.G.; Lovelock, C.E.; Duke, N.C. Assessment of Vegetation and Soil Conditions in Restored Mangroves Interrupted by Severe Tropical Typhoon “Chan-Hom” in the Philippines. Hydrobiologia 2014, 733, 85–102. [Google Scholar] [CrossRef]
  11. Casey, W.P.; Ewel, K.C. Patterns of Succession in Forested Depressional Wetlands in North Florida, USA. Wetlands 2006, 26, 147–160. [Google Scholar] [CrossRef]
  12. Cameron, C.; Hutley, L.B.; Friess, D.A.; Brown, B. Community Structure Dynamics and Carbon Stock Change of Rehabilitated Mangrove Forests in Sulawesi, Indonesia. Ecol. Appl. 2019, 29, e01810. [Google Scholar] [CrossRef] [PubMed] [Green Version]
  13. Licuanan, W.Y.; Cabreira, R.W.; Aliño, P.M. The Philippines, 2nd ed.; Elsevier Ltd.: Amsterdam, The Netherlands, 2018; ISBN 9780081008539. [Google Scholar]
  14. Faridah-Hanum, I.; Latiff, A.; Hakeem, K.R.; Ozturk, M. Mangrove Ecosystems of Asia: Status, Challenges and Management Strategies. In Mangrove Ecosystems of Asia: Status, Challenges and Management Strategies; Springer Science & Business Media: Berlin/Heidelberg, Germany, 2014; pp. 1–471. [Google Scholar] [CrossRef]
  15. Kathiresan, K.; Bingham, B.L. Biology of Mangroves and Mangrove Ecosystems. Adv. Mar. Biol. 2001, 40, 81–251. [Google Scholar] [CrossRef]
  16. Primavera, J.H. Development and Conservation of Philippine Mangroves: Institutional Issues. Ecol. Econ. 2000, 35, 91–106. [Google Scholar] [CrossRef]
  17. Mariano, H.G.; Dagoc, F.L.S.; Espra, A.S.; Amparado, R.F. Mangrove Diversity, Taxonomic of Classification, and and Morphological Characteristics Natural Reforested Mangrove Forests in Selected Municipalities of Zamboanga Del Sur, Mindanao Island. J. Biodivers. Environ. Sci. 2019, 15, 86–99. [Google Scholar]
  18. Primavera, J.H.; Esteban, J.M.A. A Review of Mangrove Rehabilitation in the Philippines: Successes, Failures and Future Prospects. Wetl. Ecol. Manag. 2008, 16, 345–358. [Google Scholar] [CrossRef]
  19. Long, J.; Giri, C.; Primavera, J.; Trivedi, M. Damage and Recovery Assessment of the Philippines’ Mangroves Following Super Typhoon Haiyan. Mar. Pollut. Bull. 2016, 109, 734–743. [Google Scholar] [CrossRef]
  20. Duncan, C.; Primavera, J.H.; Pettorelli, N.; Thompson, J.R.; Loma, R.J.A.; Koldewey, H.J. Rehabilitating Mangrove Ecosystem Services: A Case Study on the Relative Benefits of Abandoned Pond Reversion from Panay Island, Philippines. Mar. Pollut. Bull. 2016, 109, 772–782. [Google Scholar] [CrossRef]
  21. Forest Management Bureau Philippine Forestry Statistics 2021; Forest Management Bureau, Department of Environment and Natural Resources: Quezon City, Philippines, 2020; p. 2018.
  22. Ellison, A.M. Mangrove Restoration: Do We Know Enough? Restor. Ecol. 2000, 8, 219–229. [Google Scholar] [CrossRef]
  23. Lewis, R.R. Ecological Engineering for Successful Management and Restoration of Mangrove Forests. Ecol. Eng. 2005, 24, 403–418. [Google Scholar] [CrossRef]
  24. Alongi, D. Carbon Cycling and Storage in Mangrove Forests. Annu. Rev. Mar. Sci. 2014, 6, 195–219. [Google Scholar] [CrossRef]
  25. Kandasamy, K.; Rajendran, N.; Balakrishnan, B.; Thiruganasambandam, R.; Narayanasamy, R. Carbon Sequestration and Storage in Planted Mangrove Stands of Avicennia Marina. Reg. Stud. Mar. Sci. 2021, 43, 101701. [Google Scholar] [CrossRef]
  26. Climatology and Agrometeorology Division (CAD). Climate Change in the Philippines; Department of Science and Technology—Philippine Atmospheric Geophysical and Astronomical Services Administration: Diliman City, Philippines, 2011. [Google Scholar]
  27. NAMRIA. Philippines Tide and Current Tables; NAMRIA: Manila, Philippines, 2017.
  28. Komiyama, A.; Poungparn, S.; Kato, S. Common Allometric Equations for Estimating the Tree Weight of Mangroves. J. Trop. Ecol. 2005, 21, 471–477. [Google Scholar] [CrossRef]
  29. Fourqurean, J.W.; Johnson, B.; Kauffman, J.B.; Kennedy, H.; Lovelock, C.E.; Megonigal, J.P.; Rahman, A.; Saintilan, N.; Simard, M. Coastal Blue Carbon: Methods for Assessing Carbon Stocks and Emissions Factors in Mangroves, Tidal Salt Marshes, and Seagrasses; Conservation International, International, Intergovernmental Oceanographic Commission of UNESCO, International Union for Conservation of Nature: Arlington, VA, USA, 2014. [Google Scholar]
  30. Lasco, R.D.; Macdicken, G.; Pulhin, F.; Guillermo, I.Q.; Sales, R.F.; Cruz, R.V.O. Carbon Stocks Assessment of a Selectively Logged Dipterocarp Forest and Wood Processing Mill in the Philippines; Forest Research Institute Malaysia: Kepong, Malaysia, 2006; Volume 18. [Google Scholar]
  31. Kauffman, J.B.; Sanford, R.L.; Cummings, D.L.; Salcedo, I.H.; Sampaio, E.V.S.B. Biomass and Nutrient Dynamics Associated with Slash Fires in Neotropical Dry Forests. Ecology 1993, 74, 140–151. [Google Scholar] [CrossRef]
  32. Orella, J.; Africa, D.R.; Bustillo, C.H.; Pascua, N.; Marquez, C.; Adornado, H.; Aguilos, M. Above-and-Belowground Carbon Stocks in Two Contrasting Peatlands in the Philippines. Forests 2022, 13, 303. [Google Scholar] [CrossRef]
  33. Aguilos, M.; Brown, C.; Minick, K.; Fischer, M.; Ile, O.J.; Hardesty, D.; Kerrigan, M.; Noormets, A.; King, J. Millennial-Scale Carbon Storage in Natural Pine Forests of the North Carolina Lower Coastal Plain: Effects of Artificial Drainage in a Time of Rapid Sea Level Rise. Land 2021, 10, 1294. [Google Scholar] [CrossRef]
  34. Wickham, H. Ggplot2: Elegant Graphics for Data Analysis; Springer: New York, NY, USA, 2016; ISBN 978-3-319-24277-4. [Google Scholar]
  35. Sievert, C. Interactive Web-Based Data Visualization with R, Plotly, and Shiny; Chapman and Hall/CRC: London, UK, 2020; ISBN 9781138331457. [Google Scholar]
  36. Wickham, H.; Averick, M.; Bryan, J.; Chang, W.; McGowan, L.; François, R.; Grolemund, G.; Hayes, A.; Henry, L.; Hester, J.; et al. Welcome to the Tidyverse. J. Open Source Softw. 2019, 4, 1686. [Google Scholar] [CrossRef]
  37. Wickham, H. Reshaping Data with the Reshape Package. J. Stat. Softw. 2007, 12, 1–20. [Google Scholar]
  38. R Core Team R: A Language and Environment for Statistical Computing. R Foundation for Statistical Computing, Vienna, Austria. 2021. Available online: https://www.R-project.org/. (accessed on 15 October 2021).
  39. Tamai, S.; Iampa, P. Establishment and Growth of Mangrove Seedling in Mangrove Forests of Southern Thailand. Ecol. Res. 1988, 3, 227–238. [Google Scholar] [CrossRef]
  40. Cañizares, L.P.; Seronay, R.A. Diversity and Species Composition of Mangroves in Barangay Imelda, Dinagat Island, Philippines. AACL Bioflux 2016, 9, 518–526. [Google Scholar]
  41. Alongi, D.M. Patterns of Mangrove Wood and Litter Production Within a Beach Ridge-Fringing Reef Embayment, Northern Great Barrier Reef Coast. Estuaries Coasts 2011, 34, 32–44. [Google Scholar] [CrossRef]
  42. Patindol, T.; Casas, E. Species Diversity and Composition of Mangroves in Tacloban City, Philippines. Ann. Trop. Res. 2019, 41, 67–75. [Google Scholar] [CrossRef] [Green Version]
  43. Aguilos, R.; Marquez, C.; Adornado, H.; Aguilos, M. Domesticating Commercially Important Native Tree Species in the Philippines: Early Growth Performance Level. Forests 2020, 11, 885. [Google Scholar] [CrossRef]
  44. Marquez, C.; Aguilos, R.; Bacsal, R.; Adornado, H.; Aguilos, M. Early Growth of 11 Native and Three Alien Tree Species in Northeastern Mindanao, Philippines. Forests 2021, 12, 909. [Google Scholar] [CrossRef]
  45. Aguilos, M.; Sun, G.; Noormets, A.; Domec, J.C.; McNulty, S.; Gavazzi, M.; Prajapati, P.; Minick, K.J.; Mitra, B.; King, J. Ecosystem Productivity and Evapotranspiration Are Tightly Coupled in Loblolly pine (Pinus taeda L.) Plantations along the Coastal Plain of the Southeastern U.S. Forests 2021, 12, 1123. [Google Scholar] [CrossRef]
  46. Aguilos, M.; Stahl, C.; Burban, B.; Hérault, B.; Courtois, E.; Coste, S.; Wagner, F.; Ziegler, C.; Takagi, K.; Bonal, D. Interannual and Seasonal Variations in Ecosystem Transpiration and Water Use Efficiency in a Tropical Rainforest. Forests 2018, 10, 14. [Google Scholar] [CrossRef] [Green Version]
  47. von Buttlar, J.; Zscheischler, J.; Rammig, A.; Sippel, S.; Reichstein, M.; Knohl, A.; Mahecha, M.D. Impacts of Droughts and Extreme Temperature Events on Gross Primary Production and Ecosystem Respiration: A Systematic Assessment across Ecosystems and Climate Zones. Biogeosciences 2017, 15, 1293–1318. [Google Scholar] [CrossRef] [Green Version]
  48. Anderegg, W.R.L.; Konings, A.G.; Trugman, A.T.; Yu, K.; Bowling, D.R.; Gabbitas, R.; Karp, D.S.; Pacala, S.; Sperry, J.S.; Sulman, B.N.; et al. Hydraulic Diversity of Forests Regulates Ecosystem Resilience during Drought. Nature 2018, 561, 538–541. [Google Scholar] [CrossRef] [Green Version]
  49. Desantis, L.R.G.; Bhotika, S.; Williams, K.; Putz, F.E. Sea-Level Rise and Drought Interactions Accelerate Forest Decline on the Gulf Coast of Florida, USA. Glob. Chang. Biol. 2007, 13, 2349–2360. [Google Scholar] [CrossRef]
  50. Tobias, A.; Umali, A.G.A.; Malabrigo, P.; Galang, M.A. Mangrove Forest Inventory and Estimation of Carbon Storage and Sedimentation in Pagbilao. Wealth Account. Valuat. Ecosyst. Serv. 2017, 1–95. [Google Scholar] [CrossRef]
  51. Sahu, S.C.; Kumar, M.; Ravindranath, N.H. Carbon Stocks in Natural and Planted Mangrove Forests of Mahanadi Mangrove Wetland, East Coast of India. Curr. Sci. 2016, 110, 2253–2260. [Google Scholar] [CrossRef]
  52. Aguilos, M.; Sun, G.; Noormets, A.; Domec, J.C.; McNulty, S.; Gavazzi, M.; Minick, K.; Mitra, B.; Prajapati, P.; Yang, Y.; et al. Effects of Land-Use Change and Drought on Decadal Evapotranspiration and Water Balance of Natural and Managed Forested Wetlands along the Southeastern US Lower Coastal Plain. Agric. For. Meteorol. 2021, 303, 108381. [Google Scholar] [CrossRef]
  53. Aguilos, M.; Mitra, B.; Noormets, A.; Minick, K.; Prajapati, P.; Gavazzi, M.; Sun, G.; McNulty, S.; Li, X.; Domec, J.C.; et al. Long-Term Carbon Flux and Balance in Managed and Natural Coastal Forested Wetlands of the Southeastern USA. Agric. For. Meteorol. 2020, 288, 108022. [Google Scholar] [CrossRef]
  54. Ile, O.J.; Aguilos, M.; Morkoc, S.; Heitman, J.; King, J.S. Root Biomass Distribution and Soil Physical Properties of Short-Rotation Coppice American Sycamore (Platanus occidentalis L.) Grown at Different Planting Densities. Forests 2021, 12, 1806. [Google Scholar] [CrossRef]
  55. Gevaña, D.T.; Camacho, L.D.; Camacho, S.C. Stand Density Management and Blue Carbon Stock of Monospecific Mangrove Plantation in Bohol, Philippines. For. Stud. 2017, 66, 75–83. [Google Scholar] [CrossRef] [Green Version]
  56. Fujimoto, K.; Imaya, A.; Tabuchi, R.; Kuramoto, S.; Utsugi, H.; Murofushi, T. Belowground Carbon Storage of Micronesian Mangrove Forests. Ecol. Res. 1999, 14, 409–413. [Google Scholar] [CrossRef]
  57. Lasco, R.D.; Pulhin, F.B. Forest Land Use Change in the Philippines and Climate Change Mitigation. Mitig. Adapt. Strateg. Glob. Chang. 2000, 5, 81–97. [Google Scholar] [CrossRef]
  58. Silver, W.L.; Lugo, A.E.; Keller, M. Soil Oxygen Availability and Biogeochemistry along Rainfall and Topographic Gradients in Upland Wet Tropical Forest Soils. Biogeochemistry 1999, 44, 301–328. [Google Scholar] [CrossRef]
  59. Samosorn, S.; Sangtiean, T.; Rodtassana, C.; Poungparn, S. Roles of Aboveground Roots Facilitating Sedimentation and Elevation Change in a Mangrove Forest behind Bamboo Seawalls. Songklanakarin J. Sci. Technol. 2018, 40, 1315–1323. [Google Scholar] [CrossRef]
  60. Poungparn, S.; Komiyama, A.; Intana, V.; Piriyaota, S.; Sangtiean, T.; Tanapermpool, P.; Patanaponpaiboon, P.; Kato, S. A Quantitative Analysis on the Root System of a Mangrove, Xylocarpus Granatum Koenig. Tropics 2002, 12, 35–42. [Google Scholar] [CrossRef]
  61. Nakasuga, T. Analysis of the Mangrove Stand. Science Bulletin of the College of Agrculture; University of the Ryukus: Okinawa, Japan, 1979; pp. 413–519. [Google Scholar]
  62. Mall, L.; Singh, V.P.; Garge, A. Study of Biomass, Litter Fall, Litter Decomposition and Soil Respiration Monogeneric and Mixed Mangrove Forests of Andaman Island. Trop. Ecol. 1991, 32, 235–249. [Google Scholar]
  63. Komiyama, A.; Havanond, S.; Srisawatt, W.; Mochida, Y.; Fujimoto, K.; Ohnishi, T.; Ishihara, S.; Miyagi, T. Top/Root Biomass Ratio of a Secondary Mangrove (Ceriops Tagal (Perr.) C.B. Rob.) Forest. For. Ecol. Manag. 2000, 139, 127–134. [Google Scholar] [CrossRef]
  64. Camacho, L.D.; Gevaña, D.T.; Carandang, A.P.; Camacho, S.C.; Combalicer, E.A.; Rebugio, L.L.; Youn, Y.C. Tree Biomass and Carbon Stock of a Community-Managed Mangrove Forest in Bohol, Philippines. For. Sci. Technol. 2011, 7, 161–167. [Google Scholar] [CrossRef]
  65. Suzuki, E.; Tagawa, H. Biomass of a Mangrove Forest and a Sedge Marsh on Ishigaki Island, South Japan. Jpn. J. Ecol. 1983, 33, 231–234. [Google Scholar] [CrossRef]
  66. Brown, S.; Lugo, A. Tropical Secondary Forests. J. Trop. Ecol. 1990, 6, 1–32. [Google Scholar] [CrossRef]
  67. Chou, M.-Q.; Lin, W.-J.; Lin, C.-W.; Wu, H.-H.; Lin, H.-J. Allometric Equations May Underestimate the Contribution of Fine Roots to Mangrove Carbon Sequestration. Sci. Total Environ. 2022, 833, 155032. [Google Scholar] [CrossRef] [PubMed]
  68. Weiss, C.; Weiss, J.; Boy, J.; Iskandar, I.; Mikutta, R.; Guggenberger, G. Soil Organic Carbon Stocks in Estuarine and Marine Mangrove Ecosystems Are Driven by Nutrient Colimitation of P and N. Ecol. Evol. 2016, 6, 5043–5056. [Google Scholar] [CrossRef] [Green Version]
  69. Rumengan, A.P.; Mantiri, D.M.H.; Rompas, R.; Hutahaean, A.; Kepel, T.L.; Paruntu, C.P.; Kepel, R.C.; Gerung, G.S. Carbon Stock Assessment of Mangrove Ecosystem in Totok Bay, Southeast Minahasa Regency, North Sulawesi, Indonesia. AACL Bioflux 2018, 11, 1280–1288. [Google Scholar]
  70. Dimalen, F.K.; Rojo, M.J.A. Carbon Stock Assessment of a Mangrove Forest in Cotabato City, Philippines. J. Biodivers. Environ. Sci. 2019, 14, 1–8. [Google Scholar]
  71. Barrientos, K. Species Diversity and Soil Carbon Sequestration Potential of Mangrove Species at Katunggan It Ibajay (KII) Eco-Park in Aklan, Philippines. Prism 2017, 22, 4. [Google Scholar]
  72. Gnanamoorthy, P.; Selvam, V.; Ramasubramanian, R.; Chakraborty, S.; Pramit, D.; Karipot, A. Soil Organic Carbon Stock in Natural and Restored Mangrove Forests in Pichavaram South-East Coast of India. Indian J. Geo-Mar. Sci. 2019, 48, 801–808. [Google Scholar]
  73. Suello, R.H.; Hernandez, S.L.; Bouillon, S.; Belliard, J.-P.; Dominguez-Granda, L.; van de Broek, M.; Rosado Moncayo, A.M.; Ramos Veliz, J.; Ramirez, K.P.; Govers, G.; et al. Mangrove Sediment Organic Carbon Storage and Sources in Relation to Forest Age and Position along a Deltaic Salinity Gradient. Biogeosci. Discuss. 2021, 19, 1571–1585. [Google Scholar] [CrossRef]
  74. Cierjacks, A.; Kleinschmit, B.; Babinsky, M.; Kleinschroth, F.; Markert, A.; Menzel, M.; Ziechmann, U.; Schiller, T.; Graf, M.; Lang, F. Carbon Stocks of Soil and Vegetation on Danubian Floodplains. J. Plant Nutr. Soil Sci. 2010, 173, 644–653. [Google Scholar] [CrossRef]
  75. Elsey-Quirk, T.; Seliskar, D.M.; Sommerfield, C.K.; Gallagher, J.L. Salt Marsh Carbon Pool Distribution in a Mid-Atlantic Lagoon, USA: Sea Level Rise Implications. Wetlands 2011, 31, 87–99. [Google Scholar] [CrossRef]
  76. Ricker, M.C.; Lockaby, B.G. Soil Organic Carbon Stocks in a Large Eutrophic Floodplain Forest of the Southeastern Atlantic Coastal Plain, USA. Wetlands 2015, 35, 291–301. [Google Scholar] [CrossRef]
  77. Stevenson, N.J. Disused Shrimp Ponds: Options for Redevelopment of Mangrove the Scale of the Problem Environmental Problems Associated with Pond Development; Centre for Tropical Coastal Management Dept. Marine Sciences and Coastal Management, University of Newcastle: Newcastle, UK, 1996; pp. 1–10. [Google Scholar]
  78. Selvam, V.; Ramasubramanian, R.; Ravichandran, K.K. Genesis and Present Status of Restoration Practices in Saline Blanks in India. In Sharing Lessons on Mangrove Restoration; IUCN: Gland, Switzerland, 2012; ISBN 9782831715582. [Google Scholar]
  79. Hossain, M.Z.; Lin, K. Diversified Uses of Abandoned Shrimp Ponds—A Case Study in the Upper Gulf of Thailand; Bangkok (Thailand) AIT-ITCZM: Klong Luang, Thailand, 2001; p. 23. [Google Scholar]
  80. Matsui, N.; Suekuni, J.; Nogami, M.; Havanond, S.; Salikul, P. Mangrove Rehabilitation Dynamics and Soil Organic Carbon Changes as a Result of Full Hydraulic Restoration and Re-Grading of a Previously Intensively Managed Shrimp Pond. Wetl. Ecol. Manag. 2010, 18, 233–242. [Google Scholar] [CrossRef]
  81. Walton, M.E.M.; Samonte-Tan, G.P.B.; Primavera, J.H.; Edwards-Jones, G.; le Vay, L. Are Mangroves Worth Replanting? The Direct Economic Benefits of a Community-Based Reforestation Project. Environ. Conserv. 2006, 33, 335–343. [Google Scholar] [CrossRef]
  82. Ile, O.J.; Aguilos, M.; Morkoc, S.; Minick, K.; Domec, J.C.; King, J.S. Productivity of Low-Input Short-Rotation Coppice American Sycamore (Platanus occidentalis L.) Grown at Different Planting Densities as a Bioenergy Feedstock over Two Rotation Cycles. Biomass Bioenergy 2021, 146, 105983. [Google Scholar] [CrossRef]
  83. Aguilos, M.; Takagi, K.; Liang, N.; Ueyama, M.; Fukuzawa, K.; Nomura, M.; Kishida, O.; Fukazawa, T.; Takahashi, H.; Kotsuka, C.; et al. Dynamics of Ecosystem Carbon Balance Recovering from a Clear-Cutting in a Cool-Temperate Forest. Agric. For. Meteorol. 2014, 197, 26–39. [Google Scholar] [CrossRef] [Green Version]
  84. Walcker, R.; Gandois, L.; Proisy, C.; Corenblit, D.; Mougin, É.; Laplanche, C.; Ray, R.; Fromard, F. Control of “Blue Carbon” Storage by Mangrove Ageing: Evidence from a 66-Year Chronosequence in French Guiana. Glob. Chang. Biol. 2018, 24, 2325–2338. [Google Scholar] [CrossRef]
  85. Pham, V.H.; Luu, V.D.; Nguyen, T.T.; Koji, O. Will Restored Mangrove Forests Enhance Sediment Organic Carbon and Ecosystem Carbon Storage? Reg. Stud. Mar. Sci. 2017, 14, 43–52. [Google Scholar] [CrossRef]
  86. Asadi, M.A.; Guntur, G.; Ricky, A.B.; Novianti, P.; Andik, I. Mangrove Ecosystem C-Stocks of Lamongan, Indonesia and Its Correlation with Forest Age. Res. J. Chem. Environ. 2017, 21, 1–9. [Google Scholar]
  87. Kamruzzaman, M.; Basak, K.; Paul, S.K.; Ahmed, S.; Osawa, A. Litterfall Production, Decomposition and Nutrient Accumulation in Sundarbans Mangrove Forests, Bangladesh. For. Sci. Technol. 2019, 15, 24–32. [Google Scholar] [CrossRef]
  88. Navarro-Pedreño, J.; Almendro-Candel, M.B.; Zorpas, A.A. The Increase of Soil Organic Matter Reduces Global Warming, Myth or Reality? Science 2021, 3, 18. [Google Scholar] [CrossRef]
  89. Bindu, G.; Rajan, P.; Jishnu, E.S.; Ajith Joseph, K. Carbon Stock Assessment of Mangroves Using Remote Sensing and Geographic Information System. Egypt. J. Remote Sens. Space Sci. 2020, 23, 1–9. [Google Scholar] [CrossRef]
  90. Hastuti, A.W.; Suniada, K.I.; Islamy, F. Carbon Stock Estimation of Mangrove Vegetation Using Remote Sensing in Perancak Estuary, Jembrana District, Bali. Int. J. Remote Sens. Earth Sci. 2018, 14, 137. [Google Scholar] [CrossRef] [Green Version]
  91. Qiu, P.; Wang, D.; Zou, X.; Yang, X.; Xie, G.; Xu, S.; Zhong, Z. Finer Resolution Estimation and Mapping of Mangrove Biomass Using UAV LiDAR and Worldview-2 Data. Forests 2019, 10, 871. [Google Scholar] [CrossRef] [Green Version]
  92. Tian, J.; Wang, L.; Li, X.; Yin, D.; Gong, H.; Nie, S.; Shi, C.; Zhong, R.; Liu, X.; Xu, R. Canopy Height Layering Biomass Estimation Model (CHL-BEM) with Full-Waveform LiDAR. Remote Sens. 2019, 11, 1446. [Google Scholar] [CrossRef] [Green Version]
  93. Wang, D.; Wan, B.; Qiu, P.; Zuo, Z.; Wang, R.; Wu, X. Mapping Height and Aboveground Biomass of Mangrove Forests on Hainan Island Using UAV-LiDAR Sampling. Remote Sens. 2019, 11, 2156. [Google Scholar] [CrossRef] [Green Version]
  94. Kuenzer, C.; Bluemel, A.; Gebhardt, S.; Quoc, T.V.; Dech, S. Remote Sensing of Mangrove Ecosystems: A Review. Remote Sens. 2011, 3, 878–928. [Google Scholar] [CrossRef] [Green Version]
  95. Rhyma Purnamasayangsukasih, P.; Norizah, K.; Ismail, A.A.M.; Shamsudin, I. A Review of Uses of Satellite Imagery in Monitoring Mangrove Forests. IOP Conf. Ser. Earth Environ. Sci. 2016, 37, 012034. [Google Scholar] [CrossRef]
  96. Halder, S.; Samanta, K.; Das, S.; Pathak, D. Monitoring the Inter-Decade Spatial–Temporal Dynamics of the Sundarban Mangrove Forest of India from 1990 to 2019. Reg. Stud. Mar. Sci. 2021, 44, 101718. [Google Scholar] [CrossRef]
Figure 1. Location map of natural and reforestation stands in Zamboanga del Sur, Philippines.
Forests 13 00847 g001
Figure 2. Strip-split plot sampling design that was used in the study.
Forests 13 00847 g002
Figure 3. Percentage distribution of species existing in the natural and reforestation sites based on the number of trees recorded during the measurement.
Forests 13 00847 g003
Figure 4. Kernel Density histogram of diameter at breast height (DBH, left panel) and height (right panel) of tree species in the natural and reforestation sites.
Forests 13 00847 g004
Figure 5. Tree density distribution from landward to seaward in the natural mangrove stand (left panel) and reforestation site (right panel). Both panels were displayed in colored bar plots based on the number of trees per hectare.
Forests 13 00847 g005
Figure 6. The total aboveground biomass (panel a) and soil carbon content (panel b) in the natural mangrove stand and reforestation mangrove site in Zamboanga del Sur, Philippines.
Forests 13 00847 g006
Figure 7. The total aboveground biomass per species in the natural mangrove forest and the reforestation site.
Forests 13 00847 g007
Figure 8. General features of (a) matured Sonneratia alba (L.) Smith and (b) matured Avicennia marina (Forsk.) Vierh. var. rumphiana (Hallier) Bak in the natural stand; (c) Rhizopora sp. and (d) matured Sonneratia alba (L.) Smith in the reforestation site.
Forests 13 00847 g008
Figure 9. Average soil carbon content at varying soil depths from 0 to 100 cm at the natural and reforestation sites. Significant differences were denoted by * which indicates significance level at p < 0.01–0.05, ** at p < 0.01–0.001, *** at p < 0.001–0.0001, and **** at p < 0.0001while ns means no significant difference.
Forests 13 00847 g009
Figure 10. Comparison of studies on mangrove aboveground biomass in the Philippines and other mangrove-rich countries in Asia. These forests include mixed mangrove forests [30,56,57,58,59,60], reforested mangrove forests [8,56,61,62,63], and natural mangrove forests [8,64,65].
Forests 13 00847 g010
Publisher’s Note: MDPI stays neutral with regard to jurisdictional claims in published maps and institutional affiliations.

