Article

An Electric Signal Conduction Characterization Model (ESCCM) for Establishing an Effective Poplar Regenerative System

1
Grassland Agri-Husbandry Research Center, College of Grassland Science, Qingdao Agricultural University, Qingdao 266109, China
2
Salver Academy of Botany, Rizhao 262300, China
3
State Key Laboratory of Tree Genetics and Breeding, Research Institute of Tropical Forestry, Chinese Academy of Forestry, Guangzhou 510520, China
4
State Key Laboratory of Subtropical Silviculture, College of Forestry and Biotechnology, Zhejiang A&F University, Hangzhou 311300, China
5
Institute of Biological Resources, Jiangxi Academy of Sciences, Nanchang 330096, China
*
Authors to whom correspondence should be addressed.
Forests 2022, 13(6), 835; https://doi.org/10.3390/f13060835
Submission received: 24 February 2022 / Revised: 11 May 2022 / Accepted: 12 May 2022 / Published: 27 May 2022
(This article belongs to the Section Forest Ecology and Management)

Abstract

:
The poplar is a model system for research on wood plant biology. An establishment of an efficient poplar regeneration system (PRS) plays a key role in the molecular breeding of wood plants. At present, most established PRSs are based on orthogonal experiments of previous research data. However, such an experiment is complex, time-consuming, and inefficient for various poplar subspecies. Therefore, an efficient solution to the establishment of PRSs is urgent. In this study, the triploid white poplar (Populus tomentosa ‘YiXianCiZhu B385′) was used as an experimental material to establish a leaf-based regeneration system. Firstly, different concentrations of hormones were added into the medium for the differentiation, stretching, and rooting of leaves, and the electrical conductivity of the medium was measured by a conductivity meter. Secondly, the optimal hormone concentrations for differentiation, stretching, and rooting were obtained by wavelet analysis. Finally, the Electrical Signal Conduction Characterization Model (ESCCM) of different hormone concentrations in the differentiation, stretching, and rooting of poplars was established. The result showed that the ESCCM improves the efficiency of PRSs, and this provides new insight and theory in molecular breeding. The ESCCM also provides the possibility of an automated establishment of a PRS.

1. Introduction

The poplar is among the most important tree species with economic and ecological significance. For example, poplars play a key role in energy, the conservation of water and soil, and the maintenance of ecological environment. Genetically modified poplars, known for their long lifespan, strong adaptability, and wide dispersion, have a superior advantage in controlling the salinization and desertification of land, improving the ecological environment, and enhancing forestry income [1,2]. The construction of a PRS is vital in the genetic transformation of poplars. However, due to the stability and reliability of PRS, the progress of the transgenic research of poplars lags behind that of herbaceous plants. In the past, researchers have explored the combination and concentration of hormones among different stages of growth and development, including differentiation, stretching, and rooting, with an MS medium as a basal medium at the differentiation and stretching stages and a half-strength MS medium as a basal medium at the rooting stage [3,4,5]. However, the solution is highly tedious, laborious, and time-consuming. Therefore, a highly efficient PRS is essential for transgenic research.
Electrical conductivity (Ec) is defined as the capacity of electronic transmission in physics [6,7,8,9]. In essence, Ec is a macro characterization electric signal [6,7,8,9] and is widely used in the assessment of stress resistance, which is an indicator of total ion concentration in the medium [10,11,12]. Ec will induce different response signals that affect rice growth and chlorophyll synthesis in response to salt stress, drought stress, and different levels of submergence and post-submergence stress [13]. The plant cell membrane plays an essential role in maintaining the micro-environment and the cellular metabolism. Under normal conditions, the plant selectively absorbs and discharges ions and organic molecules through the cell membrane. Under stress conditions, the plant cell membrane is damaged, and its permeability is significantly increased, which results in electrolyte leakage, and the Ec of plant extracts is enhanced. The enhancement degree of cell membrane permeability is related to the intensity of the adversity or stress. Therefore, Ec has become an accurate solution for evaluating plant stress resistance [10,11,12,14]. In addition, Ec is an important index in evaluating plant growth media. The soil Ec of seed germination is required to be within a reasonable range [15,16]. A nutrient solution of hydroponic lettuce and soil of button mushrooms, Brussels sprouts, and cauliflower should have a proper Ec [17,18,19]. In addition, the dynamics and quality of tomato growth can be assessed by Ec to a certain extent [20]. The growth rate of cells can be obtained conveniently and accurately by measuring the Ec of a plant culture medium. The Electrical Signal Conduction Characterization Model (ESCCM) can establish a real-time monitoring system to evaluate plant cell growth. However, there are only a few studies about measuring plant growth rate combined with the Ec method. The PRS is the ground substance of plant cell growth. In one study, we found that the Ec of a differentiation, stretching, and rooting medium showed a certain regularity, which guided the PRS. Therefore, this study explored the relationship between Ec change and the growth rate among the differentiation, stretching, and rooting stages in poplars.
Wavelet analysis originated from geophysics in the early 1980s in an analysis of the seismic signal, which is a time-frequency signal [21,22].
The extraction of characteristic signals may acquire normal signal and transient signals, which represent the disadvantageous and advantageous growth environments of plants. Compared with the diploid white poplar, the triploid white poplar (Populus tomentosa ‘YiXianCiZhu B385′) shows a fast growth, a high quality, and a high efficiency. It has 57 chromosomes (19 × 3). The triploid white poplar plays a key role in pulp, timber production, and tree breeding research. The triploid white poplar has already been grown on a large scale, and their use has spread up to the northern part of China. Therefore, in the present study, taking triploid white poplar as an experimental material, we obtained special signals with different hormone combinations and concentrations through wavelet analysis [23]. We also designed a PRS automation system according to special and normal signals in wavelet analysis.

2. Materials and Methods

2.1. Plant Material and Growth Conditions

The plant material used in this study was triploid white poplar (Populus tomentosa ‘YiXianCiZhu B385′) [24]. For the experiment, in April 2020, the unrooted stem cuttings (about 15 cm in height and 1 cm in diameter) of poplars were planted in the nursery of Salver Academy of Botany, Rizhao, Shandong, China, after being imbibed in water for 48 h. The plants were irrigated regularly to provide vigorous growing conditions. The triploid white poplars of the hydroponics were grown in a barrel-shaped vessel at 22 °C under a 16/8 light/dark cycle (150 μmol m−2 s−1 and 70% relative humidity). The water was changed every five days to ensure vigorous growing conditions.

2.2. Explant Disinfection and Tissue Cultrue

We chose healthy poplar branches with buds and removed all leaves for the hydroponics (Figure 1A,B). The leaf explants of the well-developed 15- to 20-day-old hydroponic plants were collected (Figure 1C–E). First, leaf explants were washed more than three times with sterile distilled water, then sterilized with 70% ethanol for 30 s and 1% NaClO for 10 min, and then washed three times with sterile distilled water in a clean bench (Figure 1F,G). Every leaf was then sectioned longitudinally into three equal parts and placed in a corresponding differentiation medium followed by Ec measurement using a conductivity meter with an automatic counting software (DDS-307, Leici, Shanghai Precision & Scientific Instrument Co., Ltd., Shanghai, China) daily for 5 days (Figure 1H). The plate was changed every five days regularly to provide vigorous growing conditions. After 20 days, three similar calli were placed in each culture bottle with a corresponding differentiation medium followed by Ec measurement using a conductivity meter daily for 5 days (Figure 1I). As the leaves differentiated into buds, three similar buds were placed in each culture bottle with a corresponding stretching medium followed by Ec measurement using a conductivity meter daily for 5 days (Figure 1J,K). When the shoots were 3–4 cm, they were cut and transferred to a rooting culture medium with three shoots each, and Ec was measured daily for five days (Figure 1L). In order to eliminate the influence of light on the Ec and obtain a more real electric signal, Ec was measured at 6:00 p.m. and then cultured in the dark for 12 h. To ensure the p < 0.05 of the Ec measurement data, each sample had six parallel measurement points; we selected six points to measure the Ec in each sample.

2.3. Generation Conditions of Different Hormone Combinations and Concentration Characteristic Signal

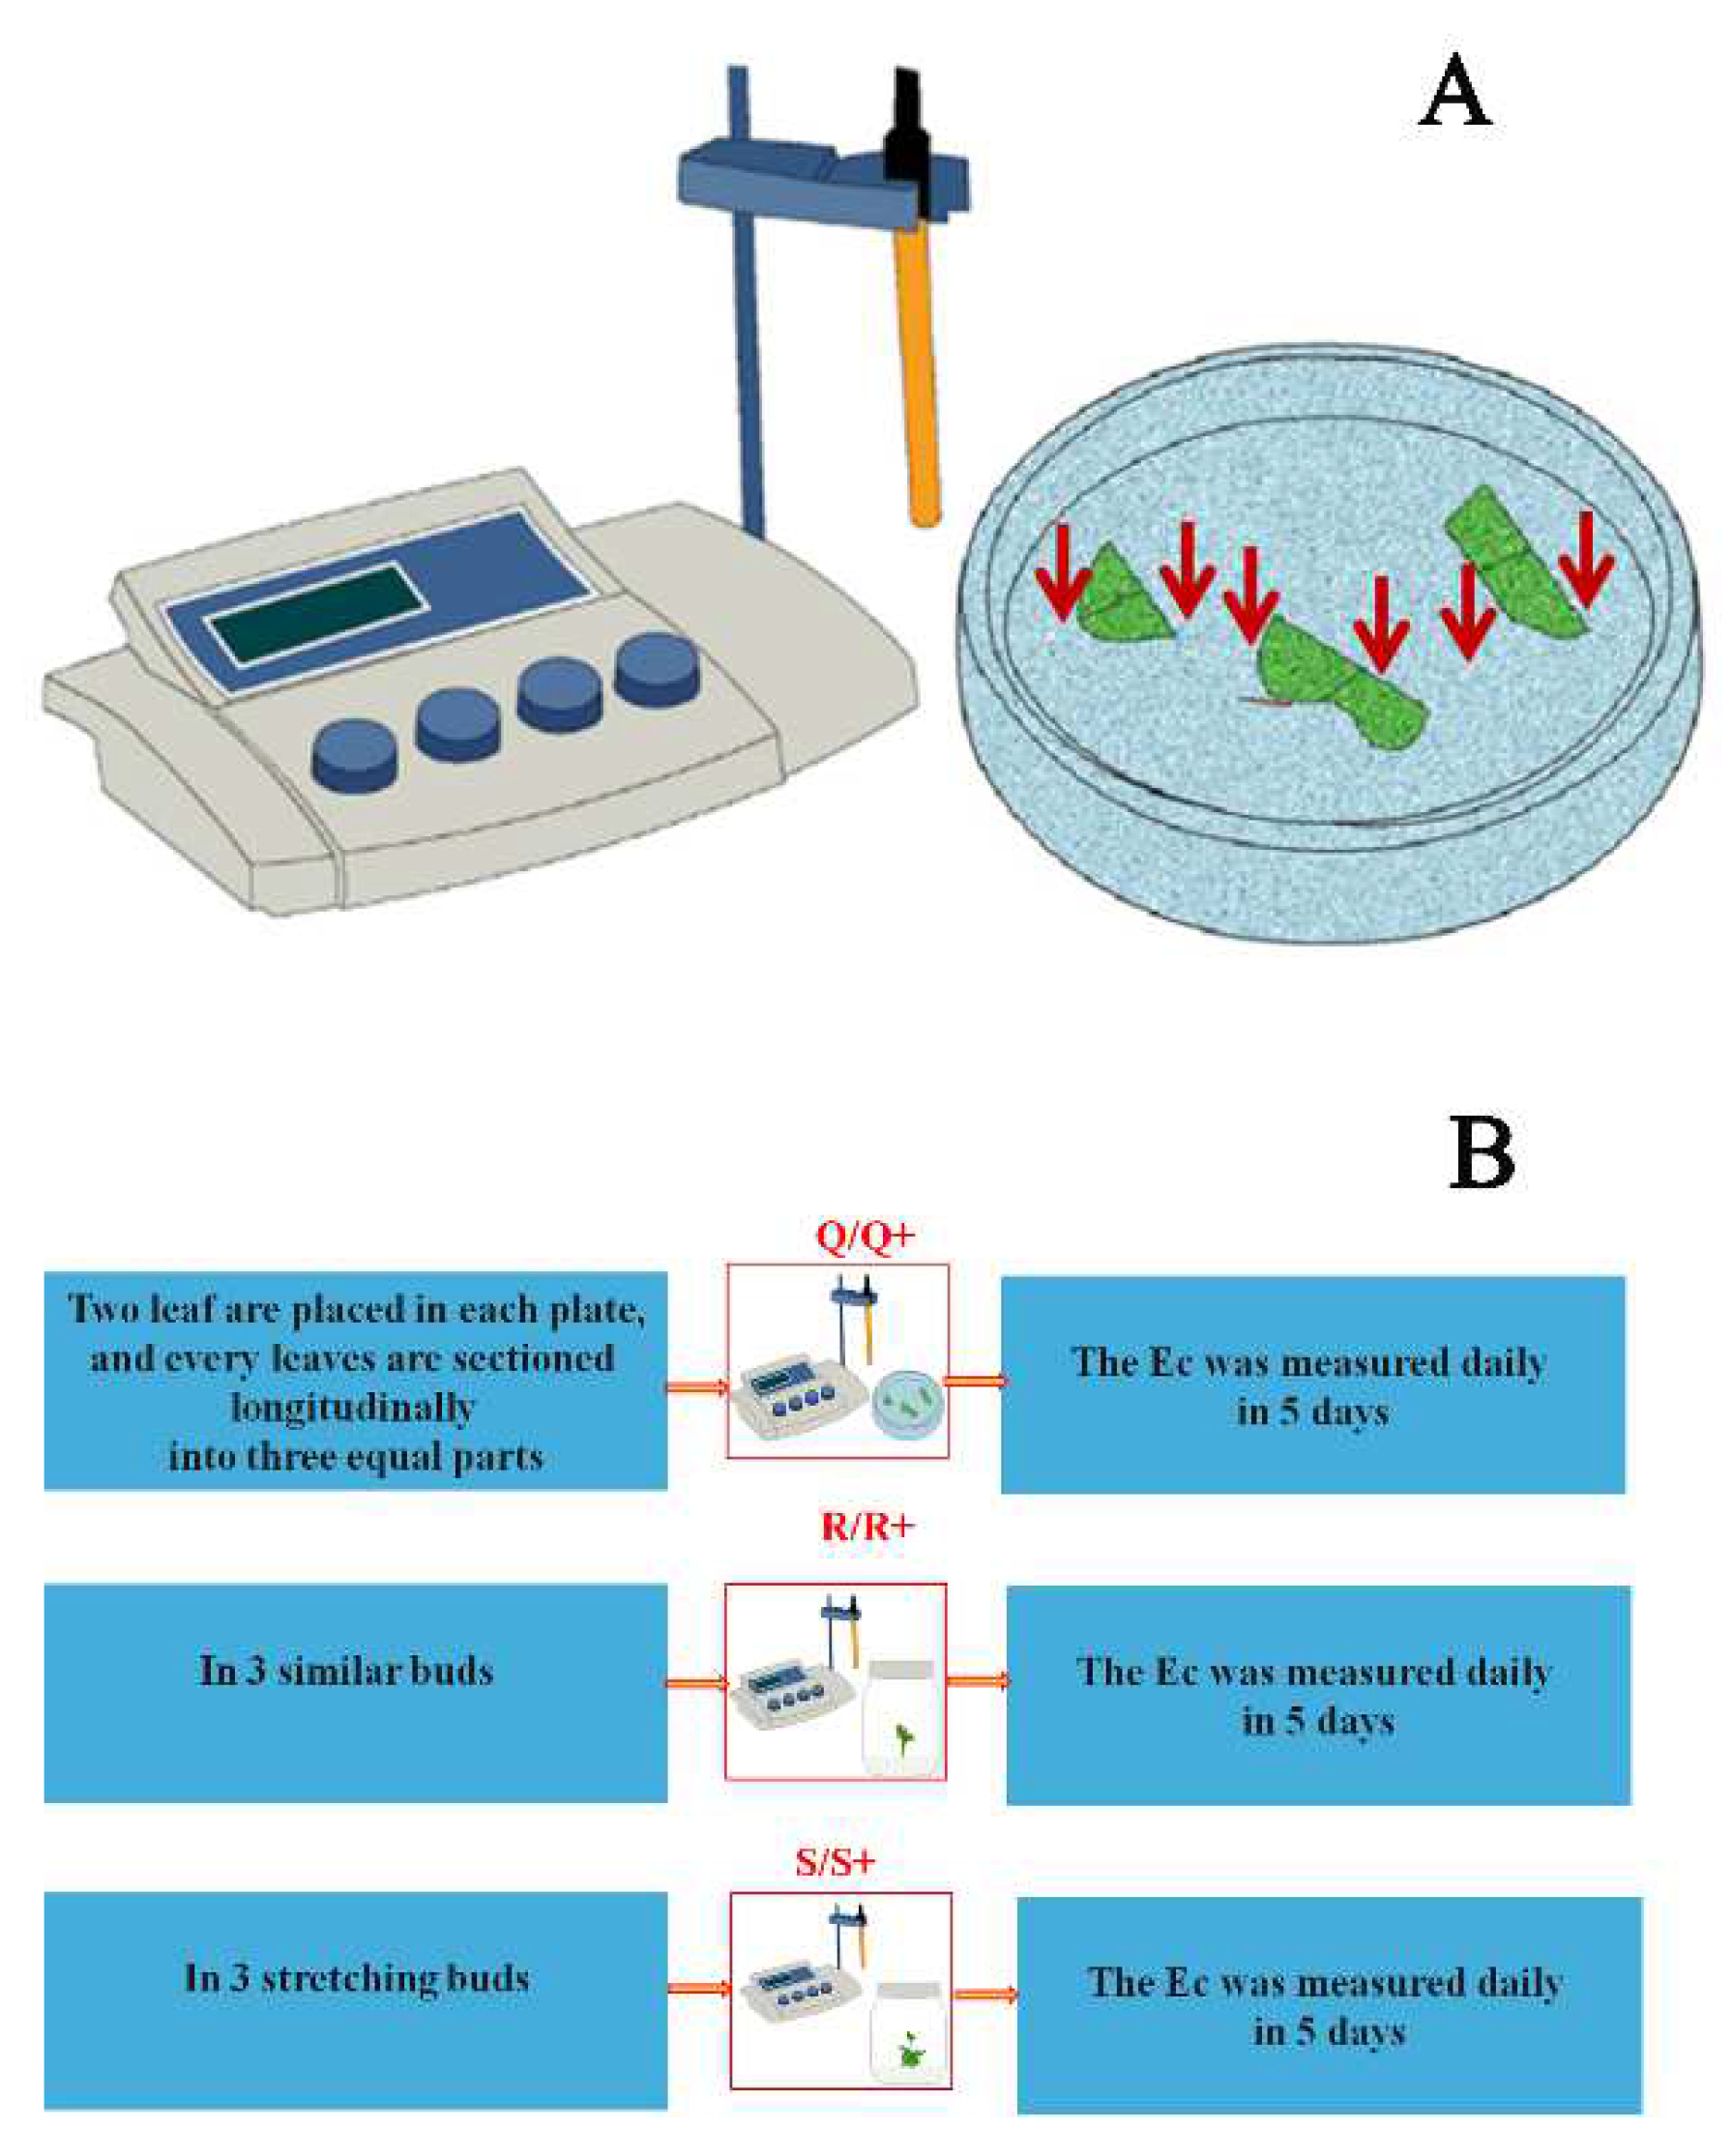
To obtain a suitable hormone combination and concentration characteristic signal, we used hormones NAA and 6-BA in this study. Based on previous research, we set up various combinations and concentrations of hormones in different culture media (Table 1; Figure 2) [25].

2.4. Data Analysis

Based on the protocol or manual, Matlab (Version 2014a8.5) software (MathWorks, Inc., Santa Clara, CA, USA) was employed for data analysis. We used the wavelet toolbox of Matlab for Ec signal analysis.

3. Results

3.1. The Electric Signal Conduction Characterization Model (ESCCM)

In this study, the Ec of the medium is defined as the capacity of different tissues of poplars to utilize ions in different growth stages. Change in the Ec in the culture medium is an indicator of the growth rate. Based on the electrical signal transduction theory, an electric signal conduction characterization equation (ESCCE) is established as follows:
GR   ( growth   rate ) = i = 1 n f ( ξ ) Δ t = 0 t f ( x ) d t
ESCCEs in different growth stages are as follows:
DR   ( differentiation   rate ) = i = 1 n f ( ξ ) Δ t = 0 t f ( x ) d t
SR   ( stretching   rate ) = i = 1 n f ( ξ ) Δ t = 0 t f ( x ) d t
RR   ( rooting   rate ) = i = 1 n f ( ξ ) Δ t = 0 t f ( x ) d t
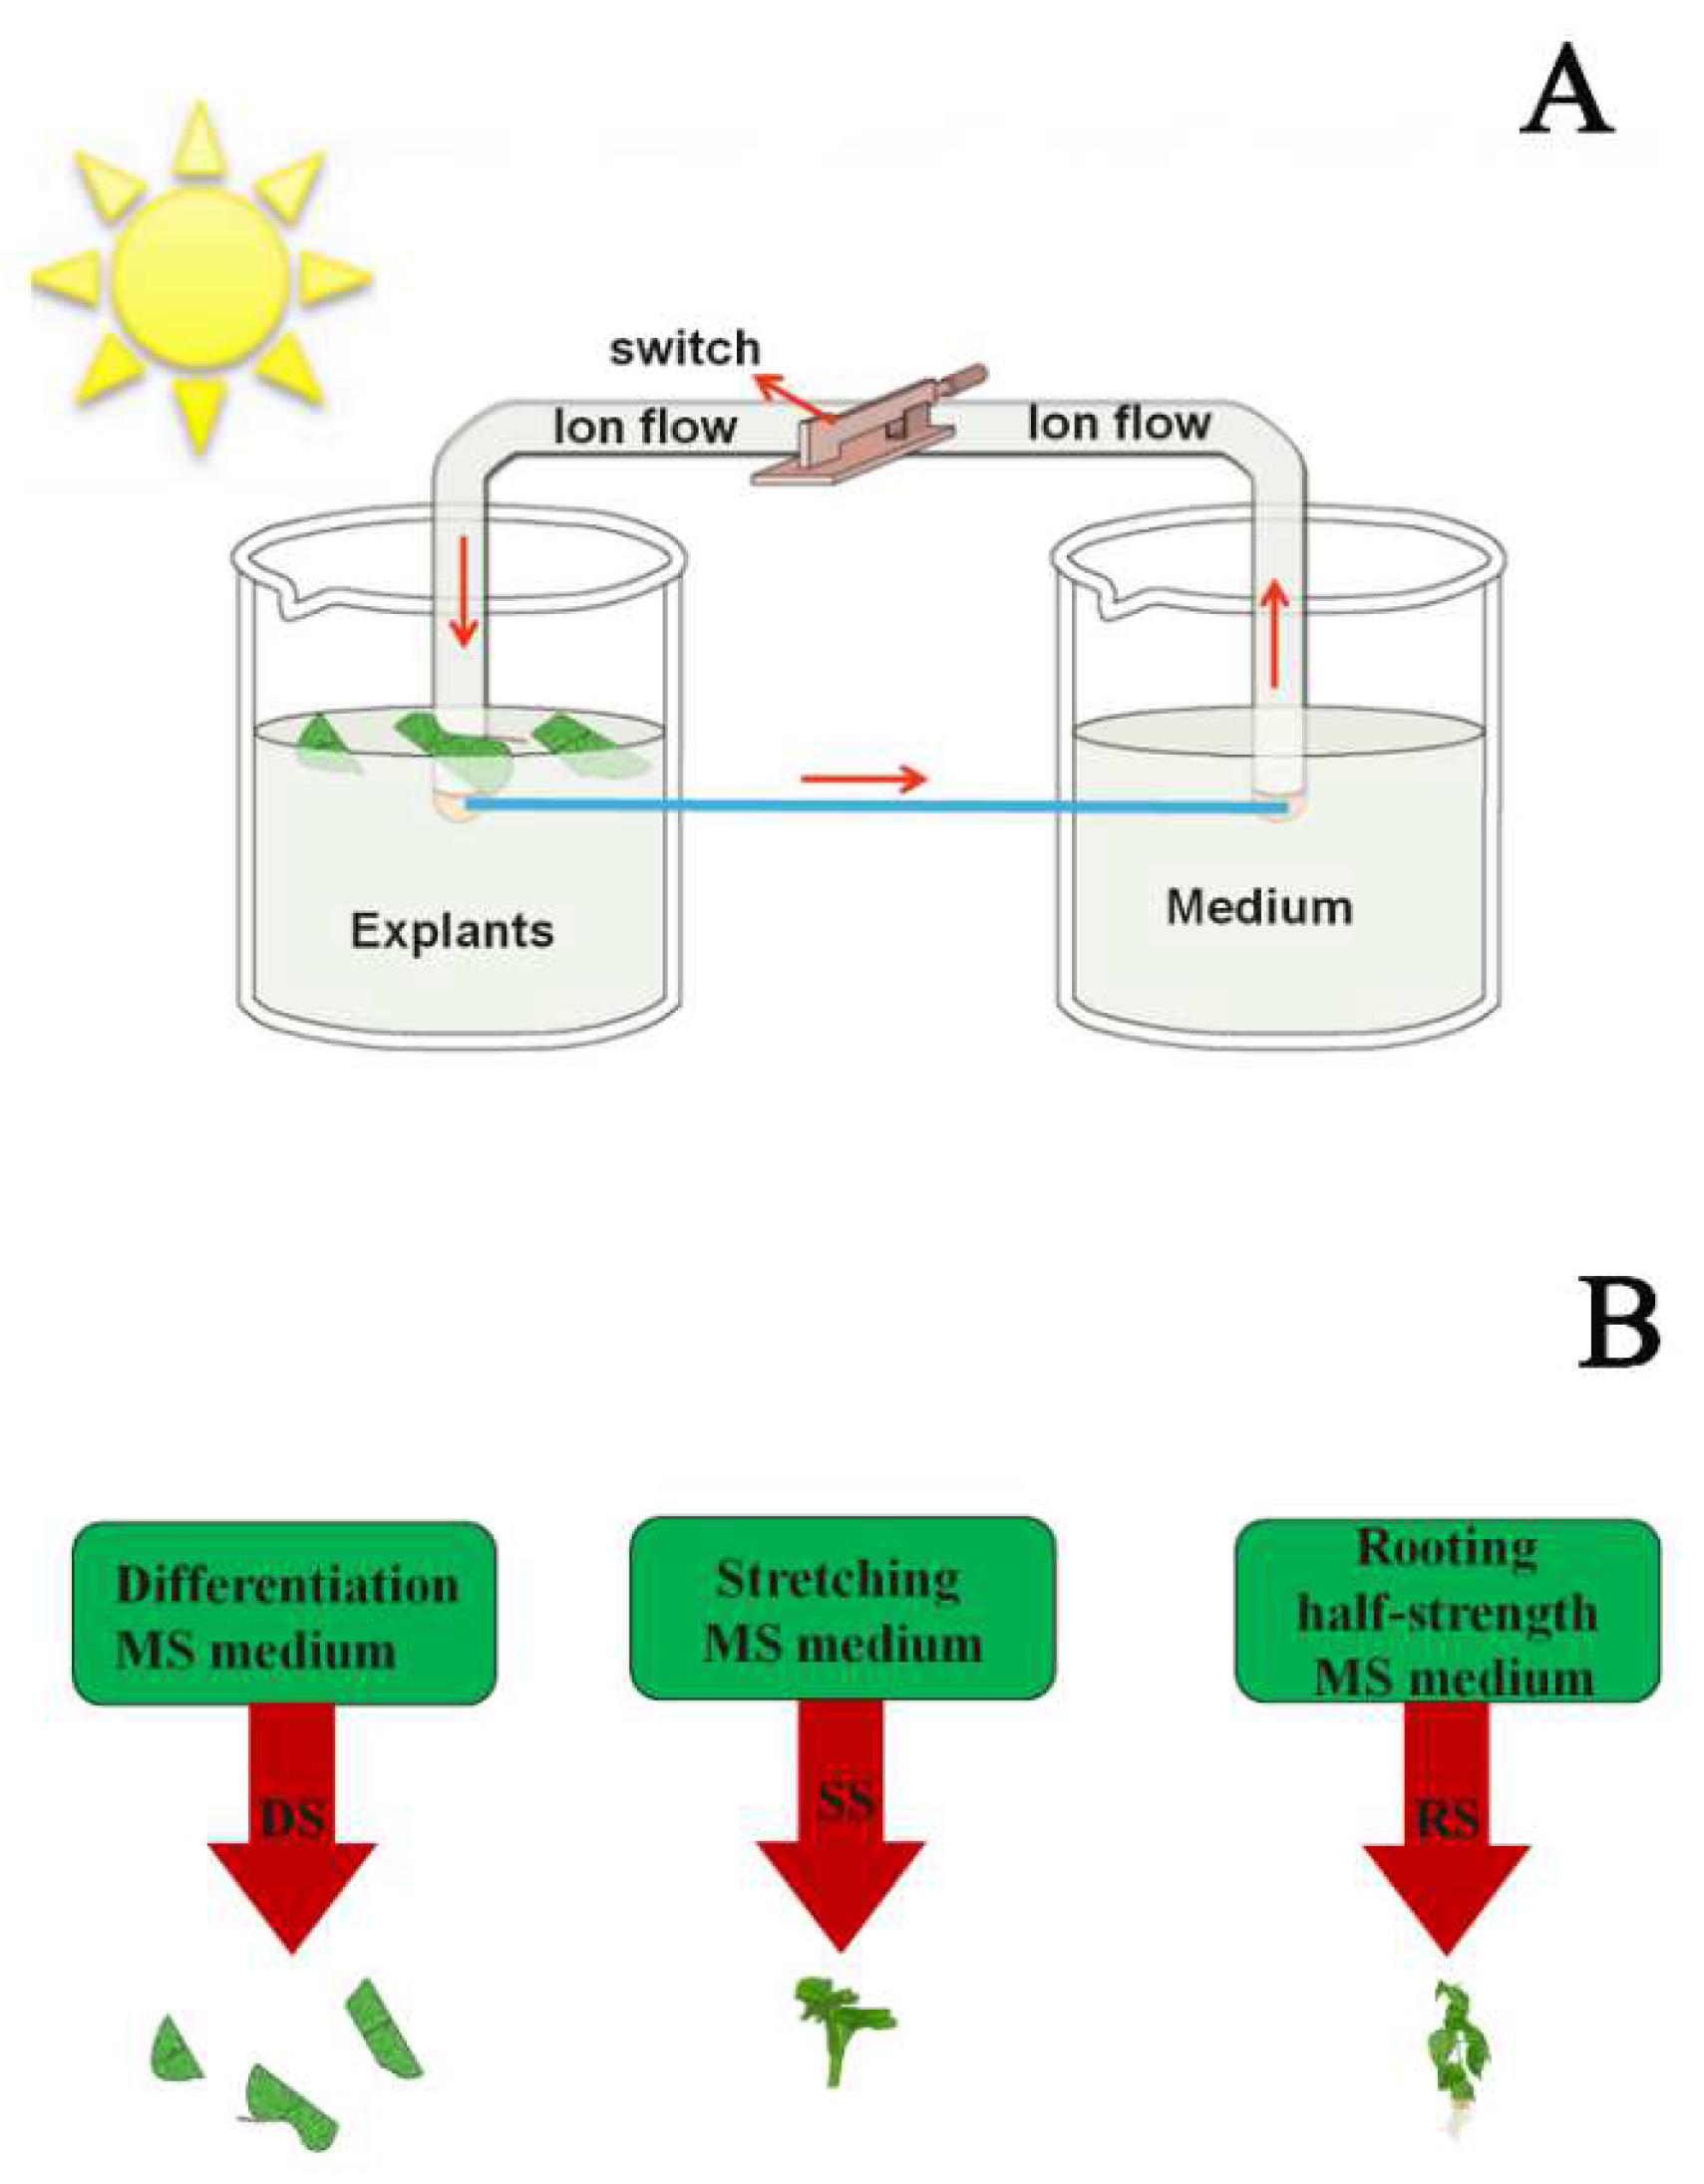
f ( x ) is an Ec function. A definite integral of f ( x ) within a fixed time represents the accumulation consumption rate of Ec during the DR, SR, and RR period, i.e., the growth rate of different tissues, which was applied in wavelet analysis in the study. Light, explants, and media can form a closed microcurrent circuit, while the hormone is a controlling switch of the closed circuit (Figure 3A). With a proper hormone combination and concentration, the circuit can be smooth to allow for the differentiation, stretching, and rooting of the explants. Otherwise, the circuit will be closed and reject the differentiation, stretching, and rooting of explants. Explants conducting specific signals during the differentiation, stretching, and rooting processes can only undergo the processes when the electrical signals of the medium correspond to those of the explants (Figure 3B).

3.2. Hormone Combination Characteristic Signals

During the first five days, the Ec of medium was measured. Based on the wavelet toolbox of Matlab, wavelet analysis was used for Ec signal decomposition. We found that the first layer was dominant, which contained all Ec signals (Figure 4). By analyzing the signal of the first layer, we obtained a signal analysis chart [21,22,26].
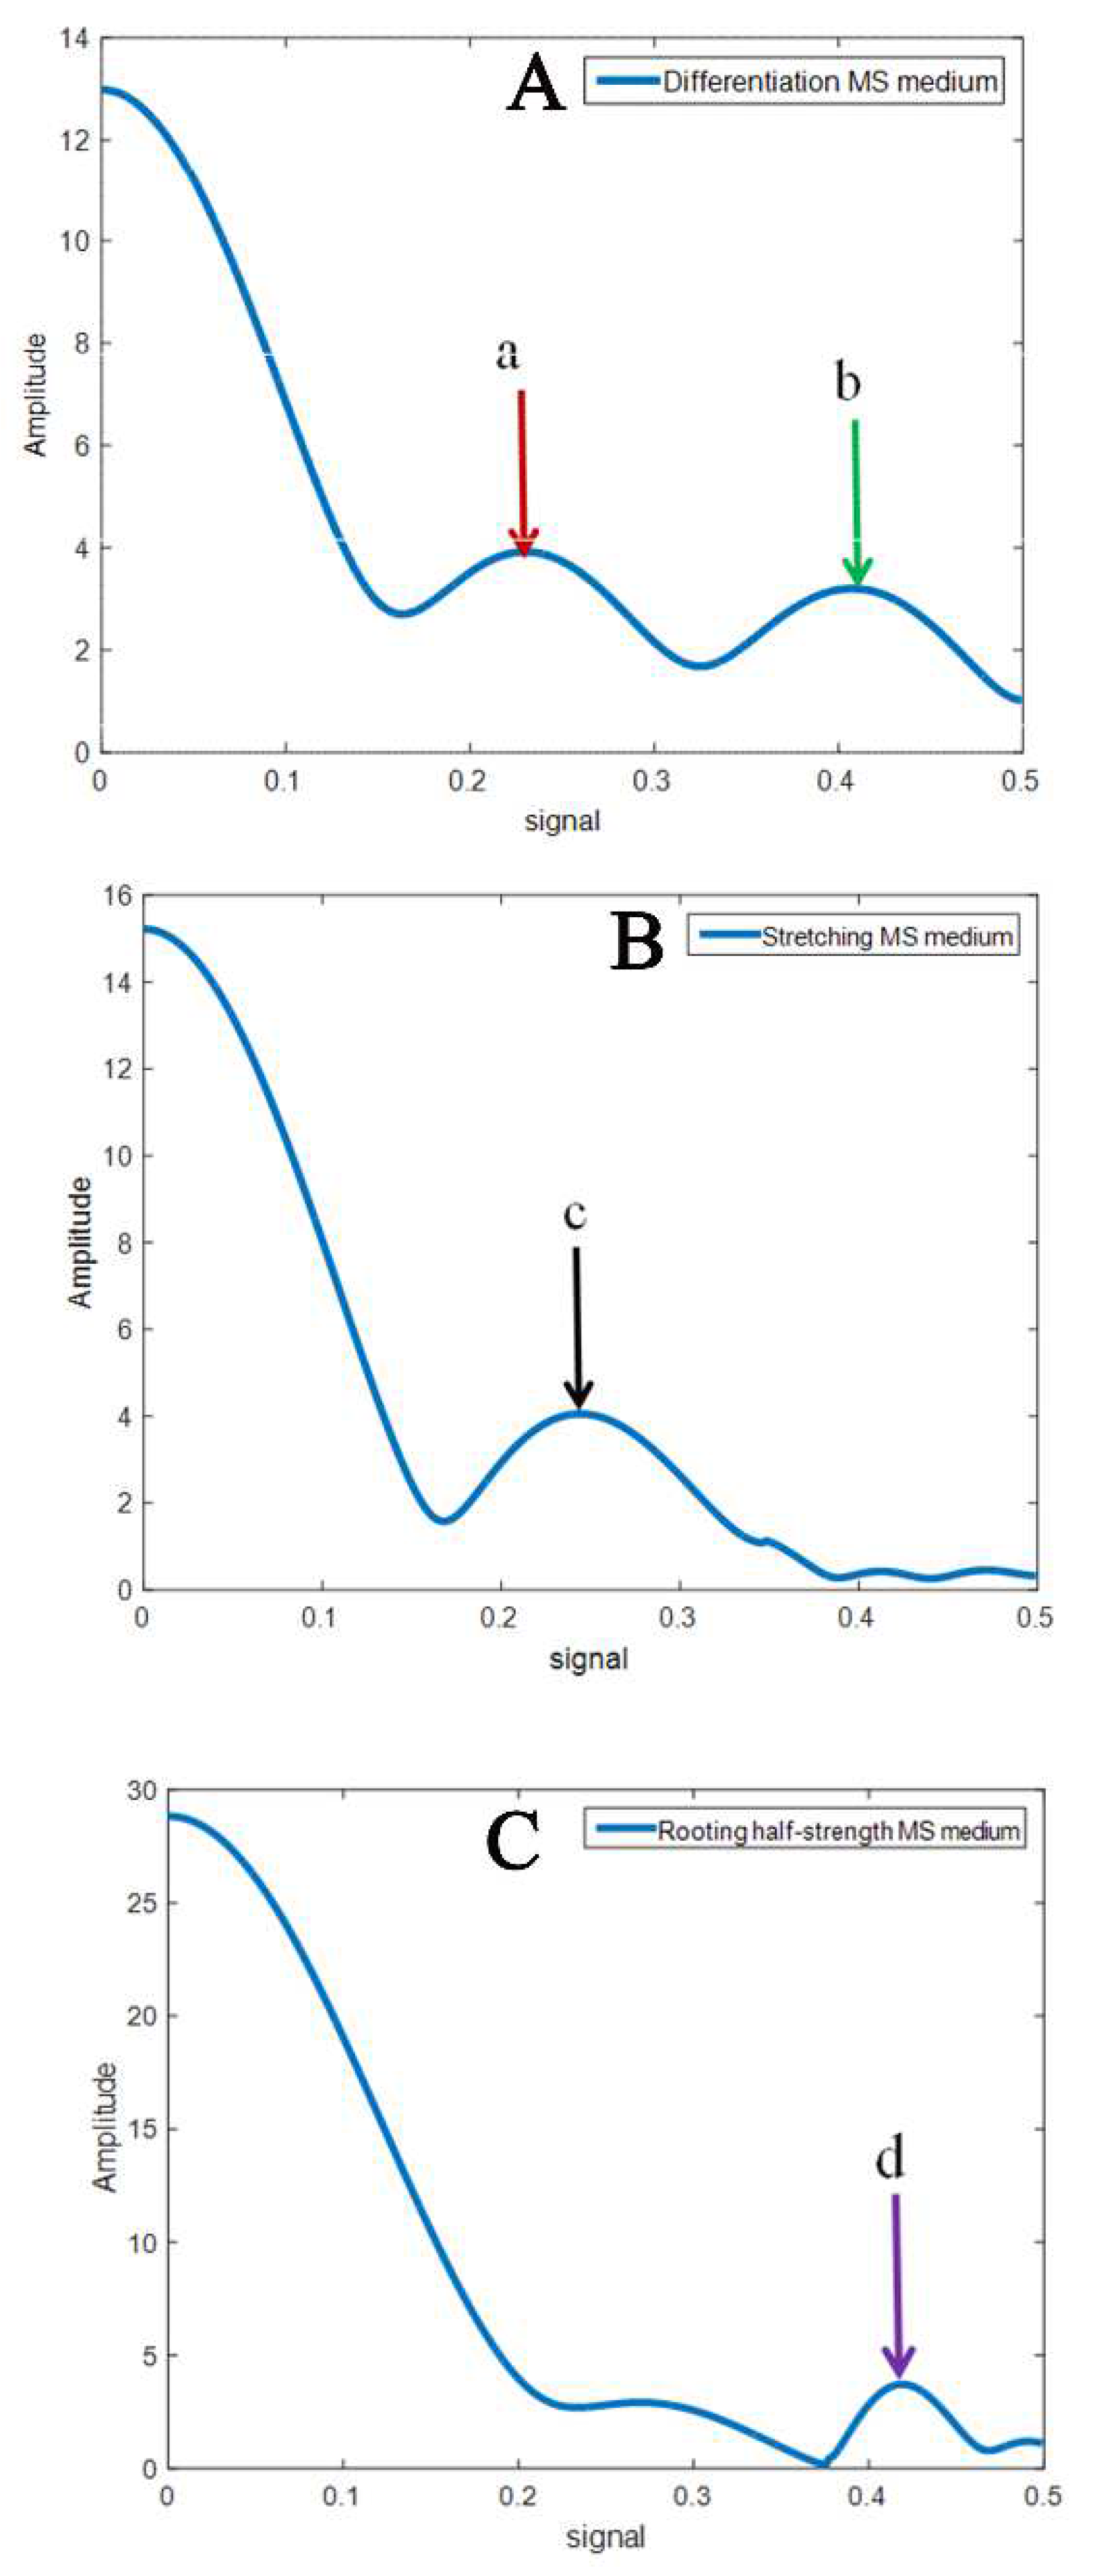
As the signal of the corresponding medium strengthened, the energy of the signal became weaker, moving towards zero. There were two bounce characteristic peaks a and b in the signal of the differentiation MS medium. When the signal was about 0.2 and 0.4, the a and b characteristic peak amplitude value was about 4 (Figure 5A). Similarly, there was only one bounce characteristic peak c and d in the stretching MS medium and the rooting half-strength MS medium, respectively. When the signal was about 0.2 and 0.4, the c and d characteristic peak amplitude value was about 4 (Figure 5B,C).

3.3. Characteristic Signal of the Medium under Different Hormone Concentrations

Along with the signal strength of the corresponding medium, with low, best, and high hormone combinations and concentrations, the energy of the signal became weaker, moving towards zero. We found many bounce characteristic peaks in the corresponding medium with low and high hormone combinations and concentrations. However, there were no bounce characteristic peaks in the corresponding medium with the best hormone combination in the three different growth stages (Figure 6A–C). The medium under different hormones and concentrations produced different initial amplitude values. These mutative amplitude values amounted to more than 20.
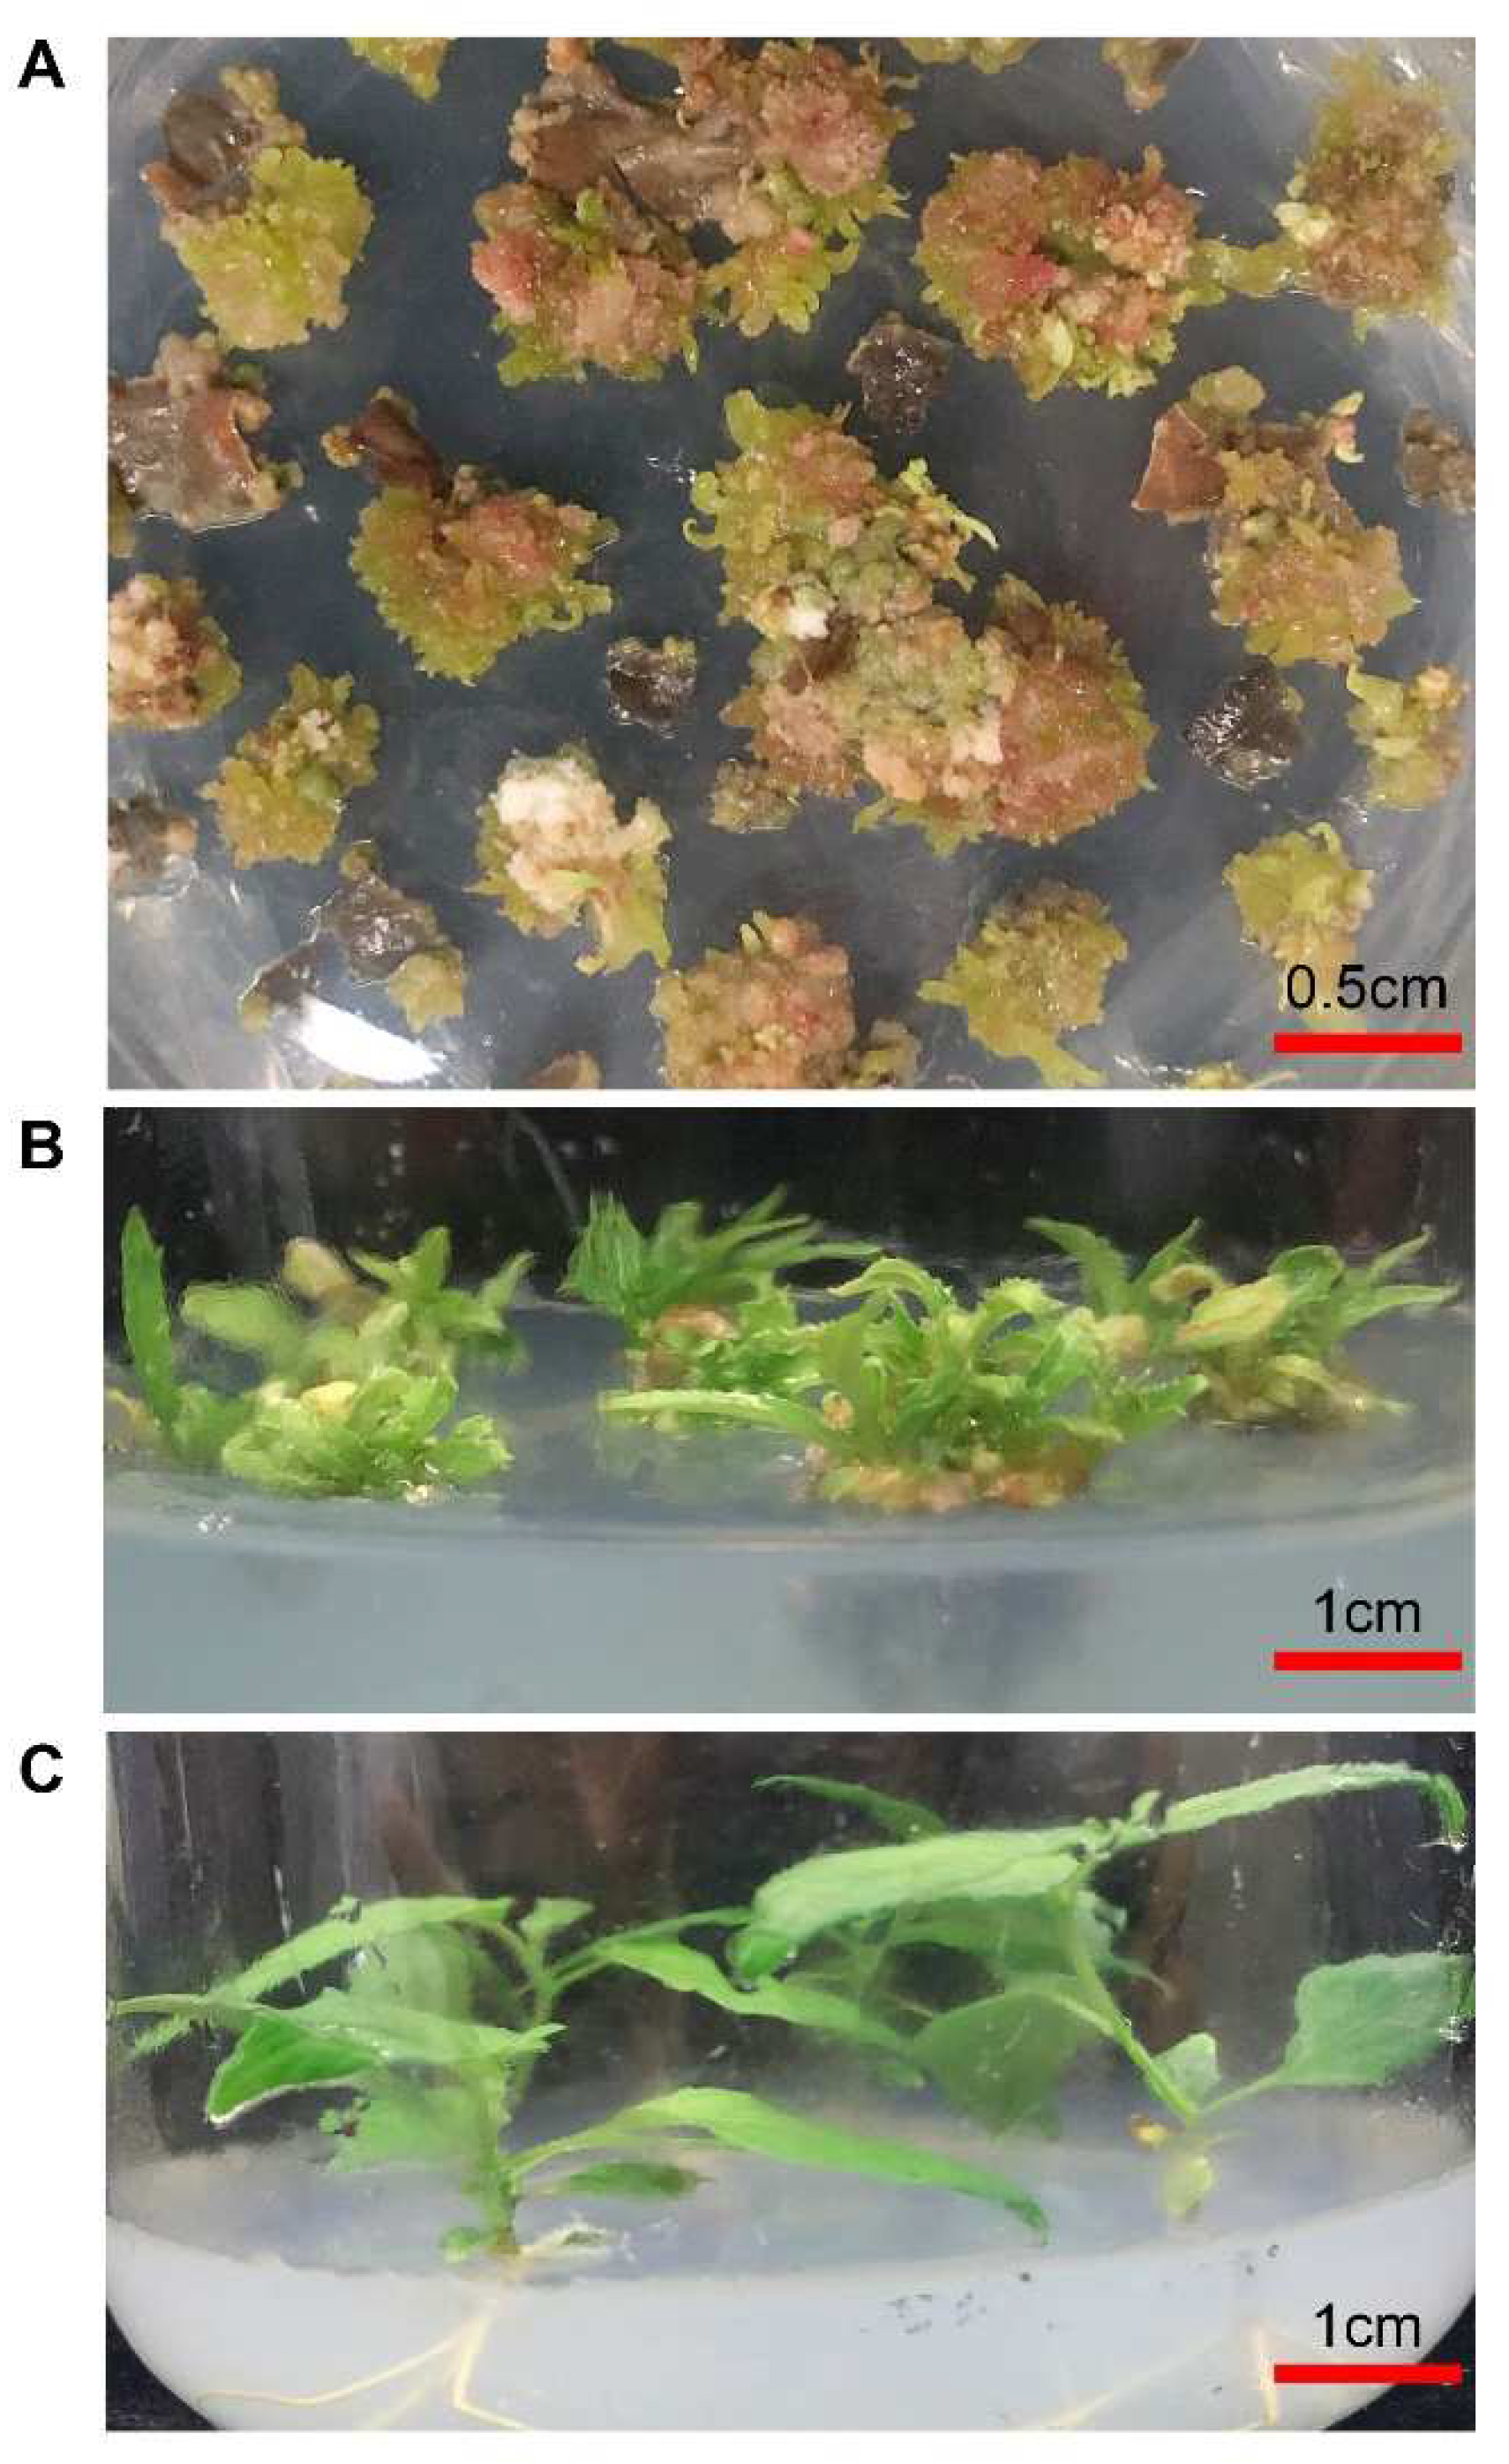
Under the LDHC and HDHC treatments, which were characterized by many sudden signals, leaves were not able to differentiate. However, under BDHC, which was characterized by normal signals, they could (Figure 6A and Figure 7). Equally, under the conditions of LSHC and HSHC, also characterized by many sudden signals, buds cannot undergo stretching. However, under BSHC, also characterized by normal signals, they could (Figure 6B and Figure 7). Similarly, we can obtain the same conclusion under the HRHC and LRHC conditions, which produce many sudden signals, that stretching buds are able to root. However, under BRHC, also characterized by normal signals, they could (Figure 6C and Figure 7).

4. Discussion

4.1. Characteristic Signals under Hormone Combinations

The conductivity method is a simple, rapid, and efficient scientific method for measuring various liquid media. Due to the different compositions and concentrations of various liquids, their electrical conductivity is different, so the composition and concentration of the solute in the tested liquid can be determined by measuring the conductivity of the liquid [27]. At the same time, studies have shown that plant growth regulation also has a certain influence on the electrical conductivity of plants, so the response of plants to hormones can be evaluated by analyzing the signal intensity of different plant media [28]. In this study, bounce signals a and b appeared in the differentiation MS medium, indicating the absence of two essential hormones. Due to the lack of hormones, leaves could not undergo differentiation (Figure 5A). Similarly, one bounce signal c appeared in the stretching MS medium, indicating a lack of one necessary hormone. Due to this lack, the bud could not undergo stretching. An insignificant feature of the bounce characteristic peak c due to buds began to carry out photosynthesis slightly, thus affecting the stretching signal amplitude. However, a characteristic signal c could still be extracted from the signal curve from the elongation culture medium (Figure 5B). There was a similar result in the rooting half-strength MS medium. It had one bounce signal d, indicating a lack of one necessary hormone, which resulted in no roots for the shoots. A less significant feature of the bounce characteristic peak d was due to the shoots that had begun to carry out photosynthesis, which affected the rooting signal amplitude. However, a characteristic signal d could still be extracted from the signal curve from the rooting culture medium (Figure 5C). Bounce signals are used to detect seismic sources in seismology [23,29,30]. The bounce signal a and b amplitude values were approximately 4, corresponding with approximately 0.2 and 0.4. Similarly, the bounce signal c and d amplitude values were approximately 4, corresponding with approximately 0.2 and 0.4. Therefore, the bounce signal a and c may serve as the same characteristic signal, and the bounce signal b and d may serve as the same characteristic signal. That is to say, in this study, a and c indicate a lack of the same necessary hormones BA, and b and d indicate a lack of the same necessary hormones NAA.

4.2. Characteristic Signals under Different Hormone Combinations and Concentrations

Plant hormones play an important role in plant growth and development. A hormone concentration that is too high or too low will affect plant growth, so a proper hormone concentration is needed for normal plant development [31]. Therefore, it is important to quickly screen out the optimal hormone concentration in the plant regeneration system. Based on the ESCCE of wavelet analysis, when explants culture in a medium of a proper hormone combination and concentration, the Ec accumulation consumption rate is regular. Therefore, there are no bounce characteristic peaks in the signal through wavelet analysis. Therefore, under BDHC, characterized by normal signals, leaves could differentiate (Figure 6A and Figure 7). Equally, under BSHC and BRHC, characterized by normal signals, buds could stretch, and stretching buds could root (Figure 6B,C and Figure 7). However, when explants culture in a medium that lacks the necessary hormones or has an unsuitable hormone combination and concentration, the Ec accumulation consumption rate is not regular. Therefore, there are bounce characteristic peaks in the signal through wavelet analysis. Thus, explants will not successfully undergo the differentiation, stretching, and rooting process.
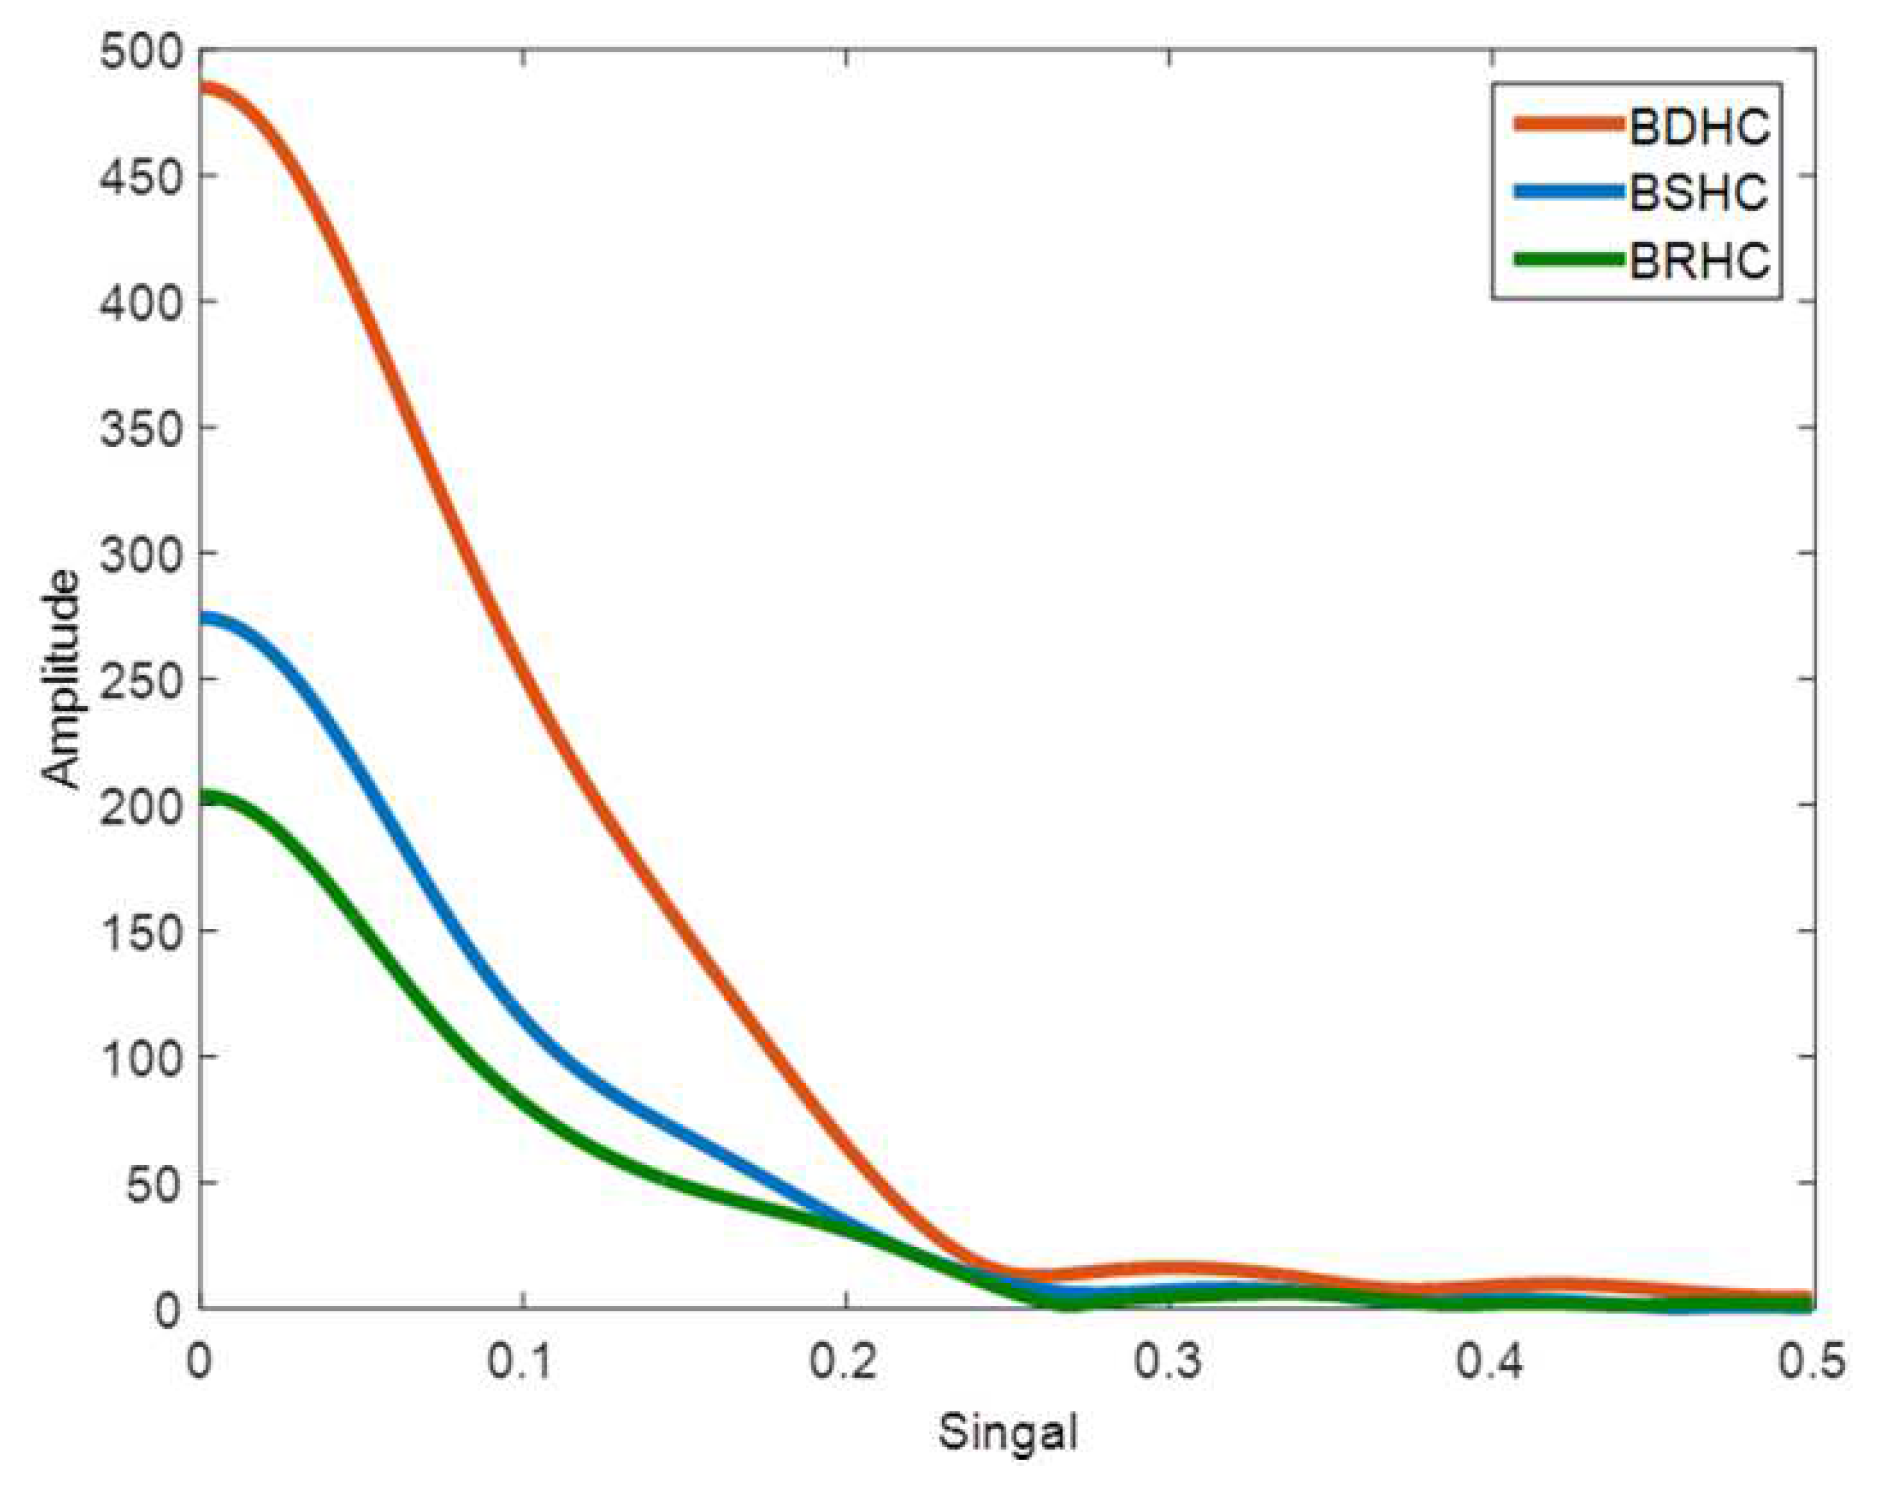
The energy required for leaf differentiation from the medium is much higher than the energy required for buds, shoots, and rooting, which may be related to the increased photosynthetic capacity of buds and shoots during continuous development. Genes could be transformed efficiently when energy consumption expenditure is highest [32,33]. This could also benefit the gene transformation work with some theoretical support. Since leaves began to carry out photosynthesis and obtain minerals and energy for shoot growth, the least amount of energy was required for rooting process (Figure 8).
Although, to some extent, this is a verification experiment, it will provide some theoretical support for the construction of regenerative systems, and the design of a PRSE automation production line (Figure 9) will benefit works on gene transformation. A PRSE automatic production line can be achieved to a certain extent based on theory.

5. Conclusions

Poplars are among the most adaptable trees and are grown worldwide. They grow rapidly, and their wood is used for diverse purposes. Thus, poplars provide substantial economic, ecological, and social benefits. Plant hormones play a key role in plant growth and development. In this study, the triploid white poplar was used as an experimental material, and its regeneration system (including differentiation, stretching, and rooting) was successfully established by the ESCCM combined with wavelet analysis. It provides an effective theoretical basis and method system for the rapid and accurate establishment of a plant regeneration system and accelerates the process of breeding.
We have reason to believe that we have attached too much importance to precision instruments, while ignoring simpler ones. In this case, instruments can solve the complex problems quickly that precise instruments are unable to. This work also reflects the importance of interdisciplinary research.

Author Contributions

Conceptualization, Y.Z. (Yue Zhang), X.H., X.W. and Y.Z. (Yangyan Zhou); Formal analysis, Y.Z. (Yue Zhang), Q.L. and M.S.; Funding acquisition, Y.Z. (Yangyan Zhou); Investigation, Y.Z. (Yue Zhang), X.H., X.W. and Y.Z. (Yangyan Zhou); Methodology, Y.Z. (Yue Zhang), Q.L. and X.W.; Supervision, M.S. and X.H.; Writing—original draft, Y.Z. (Yue Zhang); Writing—review & editing, Y.Z. (Yangyan Zhou). All authors have read and agreed to the published version of the manuscript.

Funding

This research was supported by grants from the Key Research Project of Shandong Province, China [2021LZGC021], and the Key Research Project of RiZhao Shandong Province, China [2021ZDYF010121].

Institutional Review Board Statement

Not applicable.

Informed Consent Statement

Not applicable.

Data Availability Statement

The dataset used in this study can be made available from the authors upon reasonable request.

Conflicts of Interest

The authors declare that there are no competing financial interests.

Abbreviations

MSMurashige and Skoog
NAA1-naphthaleneacetic acid
BA6-Benzylaminopurine
EcElectrical conductivity
DSDifferentiation signal
SSStretching signal
RSRooting signal
BDHCBest differentiation hormone concentration
LDHCLow differentiation hormone concentration
HDHCHigh differentiation hormone concentration
BSHCBest stretching hormone concentration
LSHCLow stretching hormone concentration
HSHCHigh stretching hormone concentration
BRHCBest rooting hormone concentration
LRHCLow rooting hormone concentration
HRHCHigh rooting hormone concentration
PRSPoplar regeneration systems
ESCCMElectrical Signal Conduction Characterization Model
GRGrowth rate
DRDifferentiation rate
RRRooting rate
SRStretching rate

References

  1. Hu, L.; Lu, H.; Liu, Q.; Chen, X.; Jiang, X. Overexpression of mtld gene in transgenic populus tomentosa improves salt tolerance through accumulation of mannitol. Tree Physiol. 2005, 25, 1273–1281. [Google Scholar] [CrossRef] [PubMed] [Green Version]
  2. Delledonne, M.; Allegro, G.; Belenghi, B.; Balestrazzi, A.; Franco Picco, F.; Alex Levine, A.; Samantha Zelasco, S.; Paolo Calligari, P.; Massimo Confalonieri, M. Transformation of white poplar (Populus alba L.) with a novel Arabidopsis thaliana cysteine proteinase inhibitor and analysis of insect pest resistance. Mol. Breed. 2001, 7, 35–42. [Google Scholar] [CrossRef]
  3. Murashige, T.; Skoog, F. A Revised Medium for Rapid Growth and Bio Assays with Tobacco Tissue Cultures. Physiol. Plant. 1962, 15, 473–497. [Google Scholar] [CrossRef]
  4. Murashige, T. Plant propagation through tissue cultures. Annu. Rev. Plant Physiol. 1974, 25, 135–166. [Google Scholar] [CrossRef]
  5. Murashige, T.; Skoog, F. Manipulation of organ initiation in plant tissue cultures. Bot. Bull. Acad. Sin. 1977, 18, 1–24. [Google Scholar]
  6. Edwards, S.F. A new method for the evaluation of electric conductivity in metals. Philos. Mag. 1958, 3, 1020–1031. [Google Scholar] [CrossRef]
  7. Kadomtsev, B.B.; Pogutse, O.P. Electric Conductivity of a Plasma in a Strong Magnetic Field. J. Exp. Theor. Phys. 1968, 26, 1146. [Google Scholar]
  8. Mateeva, N.; Niculescu, H.; Schlenoff, J.; Testardi, L.R. Correlation of seebeck coefficient and electric conductivity in polyaniline and polypyrrole. J. Appl. Phys. 1998, 83, 3111–3117. [Google Scholar] [CrossRef] [Green Version]
  9. Dhar, S.; Dash, T.; Palei, B.B.; Rout, T.K.; Biswal, S.K.; Mitra, A.; Sahu, A.K.; Biswal, S.K. Silicon-graphene composite synthesis: Microstructural, spectroscopic and electrical conductivity characterizations. Mater. Today Proc. 2020, 33, 5136–5142. [Google Scholar] [CrossRef]
  10. Ranjbarfordoei, A. Chlorophyll fluorescence performance of sweet almond [Prunus dulcis (Miller) D. Webb] in response to salinity stress induced by NaCl. Photosynthetica 2006, 44, 513–522. [Google Scholar] [CrossRef]
  11. Ghanem, M.E.; Van Elteren, J.; Albacete, A.; Quinet, M.; Martínez-Andújar, C.; Kinet, J.M.; Pérez-Alfocea, F.; Lutts, S. Impact of salinity on early reproductive physiology of tomato (Solanum lycopersicum) in relation to a heterogeneous distribution of toxic ions in flower organs. Funct. Plant Biol. 2009, 36, 125–136. [Google Scholar] [CrossRef] [PubMed]
  12. Colla, G.; Rouphael, Y.; Rea, E.; Cardarelli, M. Grafting cucumber plants enhance tolerance to sodium chloride and sulfate salinization. Sci. Hortic. 2012, 135, 177–185. [Google Scholar] [CrossRef]
  13. Upadhyay, R.K.; Panda, S.K.; Dutta, B.K. Growth, Chlorophyll and Electric Conductivity responses of rice cultivars to different levels of Submergence and Post-submergence Stress. J. Phytol. 2009, 1, 425–432. [Google Scholar]
  14. Katsuyuki, Y.; Kiyoshi, M. A simple method of evaluating the freezing resistance of tea plants (camellia sinensis (l.) kuntze) by measuring electrolyte leakage from low-temperature-treated overwintering buds and leaves. Chagyo Kenkyu Hokoku (Tea Res. J.) 2012, 113, 63–69. [Google Scholar] [CrossRef] [Green Version]
  15. Borchert, R. Induction of rehydration and bud break by irrigation or rain in decidous trees of a tropical dry forest in Costa Rica. Trees 1994, 8, 198–204. [Google Scholar] [CrossRef]
  16. Hsu, F.H.; Lin, J.B.; Chang, S.R. Effects of waterlogging on seed germination, electric conductivity of seed leakage and developments of hypocotyl and radicle in sudangrass. Bot. Bull. Acad. Sin. 2000, 41, 267–273. [Google Scholar]
  17. Abou-Hadid, A.F.; Abd-Elmoniem, E.M.; El-Shinawy, M.Z.; Abou-Elsoud, M. Electrical conductivity effect on growth and mineral composition of lettuce plants in hydroponic system. Acta Hortic. 1996, 434, 59–66. [Google Scholar] [CrossRef]
  18. Jambrak, A.R.; Mason, T.J.; Paniwnyk, L.; Lelas, V. Ultrasonic Effect on pH, Electric Conductivity, and Tissue Surface of Button Mushrooms, Brussels Sprouts and Cauliflower. Czech J. Food Sci. 2007, 25, 90–100. [Google Scholar] [CrossRef]
  19. Rodríguez-Pérez, J.R.; Plant, R.E.; Lambert, J.J.; Smart, D.R. Using apparent soil electrical conductivity (eca) to characterize vineyard soils of high clay content. Precis. Agric. 2011, 12, 775–794. [Google Scholar] [CrossRef] [Green Version]
  20. Dorai, M.; Papadopoulos, A.P.; Gosselin, A. Influence of electric conductivity management on greenhouse tomato yield and fruit quality. Agronomie 2001, 21, 367–383. [Google Scholar] [CrossRef] [Green Version]
  21. Benedetto, J.J.; Frazier, M.W.; Torrésani, B. Wavelets: Mathematics and applications. Phys. Today 1994, 47, 90. [Google Scholar] [CrossRef] [Green Version]
  22. Dremin, I.M. Wavelets: Mathematics and applications. Phys. At. Nucl. 2005, 68, 508–520. [Google Scholar] [CrossRef] [Green Version]
  23. Daubechies, I.; Sweldens, W. Factoring wavelet transforms into lifting steps. J. Fourier Anal. Appl. 1998, 4, 247–269. [Google Scholar] [CrossRef]
  24. Zhu, Z.T.; Kang, X.Y.; Zhang, Z.Y. Studies on selection of natural triploids of Populus tomentosa. Sci. Silvae Sin. 1998, 34, 22–31. [Google Scholar]
  25. Li, D.; Song, S.; Xia, X.; Yin, W. Two CBLgenes from Populus euphratica confer multiple stress tolerance in transgenic triploid white poplar. Plant Cell Tissue Organ Cult. 2012, 109, 477–489. [Google Scholar] [CrossRef]
  26. Torrence, C.; Compo, G.P. A Practical Guide to Wavelet Analysis. Bull. Am. Meteorol. Soc. 1998, 79, 61–78. [Google Scholar] [CrossRef] [Green Version]
  27. Cui, Z.Y.; Li, X.P.; Hu, J.X.; Xi, R.C. Application of Conductivity Method in Botanical Research. J. Anhui Agri. Sci. 2014, 42, 5358–5359, 5366. [Google Scholar]
  28. Xiang, Y.; He, Q.; Liu, K.Q.; Gao, T.; Wen, L. Effects of Plant Growth Regulator on SOD Activity and Electrical conductivity(Ⅱ). J. Chang. Univ. Electr. Power (Nat. Sci.) 1996, 11, 408–411. [Google Scholar]
  29. Meyer, Y. Wavelets—Algorithms and Applications; Society for Industrial & Applied Mathematics: Philadelphia, PA, USA, 1993. [Google Scholar]
  30. Pintér, B.; Jain, R.; Tripathi, D.; Isobe, H. Prominence Seismology: Wavelet Analysis of Filament Oscillations. Astrophys. J. 2008, 680, 1560–1568. [Google Scholar] [CrossRef] [Green Version]
  31. Anfang, M.; Shani, E. Transport mechanisms of plant hormones. Curr. Opin. Plant Biol. 2021, 63, 102055. [Google Scholar] [CrossRef]
  32. Feuillet, C.; Lauvergeat, V.; Deswarte, C.; Pilate, G.; Grima-Pettenati, J. Tissue- and cell-specific expression of a cinnamyl alcohol dehydrogenase promoter in transgenic poplar plants. Plant Mol. Biol. 1995, 27, 651–667. [Google Scholar] [CrossRef] [PubMed]
  33. Bondt, A.D.; Eggermont, K.; Druart, P.; Vil, M.D.; Broekaert, W.F. Agrobacterium-mediated transformation of apple (malus x domestica borkh.): An assessment of factors affecting gene transfer efficiency during early transformation steps. Plant Cell Rep. 1994, 13, 587–593. [Google Scholar] [CrossRef] [PubMed]
Figure 1. Methods for tissue culture and electrical conductivity determination. (AG) Culture and disinfection of explants; (H) leaf tissue culture and electrical conductivity measurement; (I) callus culture and electrical conductivity measurement; (J,K) bud tissue culture and electrical conductivity measurement; (L) root tissue culture and electrical conductivity determination.
Forests 13 00835 g001
Figure 2. (A) The measuring point was selected around the leaf explants, thus ensuring medium Ec consumption. Similarly, the measuring point was selected in stretching and rooting media. Forests 13 00835 i001: The Ec was measured using a DDS-307 conductivity meter daily for five days. (B) Q, R, and S are the generation conditions of the hormone combination characteristic signal; Q+, R+, and S+ are the generation conditions of the hormone concentration characteristic signal; Q: The wounded leaf was placed on a differentiation MS medium with 3% sucrose and 0.6% agar; R: Buds were placed on a stretching MS medium with 3% sucrose and 0.6% agar; S: Stretching buds were placed on a half-strength MS medium with 3% sucrose and 0.6% agar; Q+: Containing various combinations and concentrations of hormone based on Q; R+: Containing various combinations and concentrations of hormone based on R; S+: Containing various combinations and concentrations of hormone based on S; Forests 13 00835 i001: The Ec was measured using a DDS-307 conductivity meter daily for five days.
Forests 13 00835 g002
Figure 3. (A) Micro-current circuit. (B) Signal conduction model.
Forests 13 00835 g003
Figure 4. Signal with wavelet analysis.
Forests 13 00835 g004
Figure 5. (A) Signal of the differentiation MS medium. (B) Signal of the stretching MS medium. (C) Signal of the rooting half-strength MS medium.
Forests 13 00835 g005
Figure 6. (A) Different hormone concentrations of the differentiation MS medium’s DS. (B) Different hormone concentrations of the stretching MS medium’s SS. (C) Different hormone concentrations of the rooting half-strength MS medium’s RS.
Forests 13 00835 g006
Figure 7. (A) Leaf callus, (B) buds, and (C) rooting plants were cultured in a BDHC MS differentiation medium, a BSHC MS stretching medium, and a BRHC half-strength MS rooting medium for 15 days.
Forests 13 00835 g007
Figure 8. Best hormone concentration medium signal.
Forests 13 00835 g008
Figure 9. Design of automation line. Ec of medium with tissue through Ec sensor output, then through signal processor, signal amplifiers and signal converter sequentially. Finally, the signal input to a computer and match preset signal that we get in this study, thus we filter suitable signal.
Forests 13 00835 g009
Table 1. Different hormone combinations and concentrations for leaf differentiation, bud stretching, and stretching bud rooting.
TreatmentNAA (mg·L−1)BA (mg·L−1)Basal Medium
LDHC0.010.01MS
BDHC0.10.02MS
HDHC1.00.2MS
LSHC-0.05MS
BSHC-0.5MS
HSHC-5.0MS
LRHC0.005-1/2 MS
BRHC0.05-1/2 MS
HRHC0.5-1/2 MS
Publisher’s Note: MDPI stays neutral with regard to jurisdictional claims in published maps and institutional affiliations.