1. Introduction
Modern climate changes [
1] are largely associated with the human-induced problem of carbon balance. This problem resulted from emissions associated with energy use, urbanization, and land use changes. Today there has been progress in monitoring and accounting for carbon sources and carbon sinks [
2,
3,
4] that shows a key role of forests in the global carbon cycle. Unfortunately, massive deforestation caused by long-standing wildfires and cuttings reduces the volume of carbon sinks. In recent years, this is especially true for the Siberian boreal forest [
5,
6,
7]. One of the scenarios of significant carbon sinks increasing is massive reforestation on the areas affected by strong wildfires, as the young growth can fix large amounts of carbon in their woody biomass. Accordingly, a large-scale inventory of the current state of the forest is needed with retrospective estimates of the spatial distribution of the species composition and biomass of the forest before wildfires.
The fastest and most effective method for such assessments is remote sensing using optical sensors [
5,
6,
7,
8] and polarimetric radars [
3,
9], as well as comprehensive remote optical and microwave measurements of biophysical forest parameters [
10]. At the same time, regularly increasing volumes of satellite data can be processed using standard calculation algorithms on remote servers, such as Google Earth Engine (GEE) [
11,
12,
13], and presented as standard geoinformation raster layers. The GEE is a remote computing cluster with a multi-petabyte archive of public aerospace imagery covering the entire world that enables high-performance computations via interactive interface. It allows users to employ well-known geospatial data processing methods as well as to creating their own algorithms and software solutions. Users can request and analyze data from a shared catalog or upload their own data. A technical overview of the platform is presented by Gorelick et al. [
11]. However, at present, there are no such platforms for processing and analyzing radar interferometric and polarimetric data. Therefore, specialized software should be used.
This study proposes a methodology for assessing reforestation processes based on the integrated use of polarimetric decomposition of L-band radar data and cloud computing of normalized difference vegetation index (NDVI) values using Google Earth Engine.
2. Satellite Data and the Test Site
For our study, we used quad-polarimetric data of L-band ALOS-2 PALSAR-2 from 5 April 2017 (Scene ID: ALOS2154891030-170405) and 30 August 2019 (Scene ID: ALOS2284561036-190830) as well as 32-Day NDVI composites based on Landsat-5 (1 January 1995–16 October 2011) and Landsat-8 (7 April 2013–6 March 2021) data that are available in the GEE data catalog.
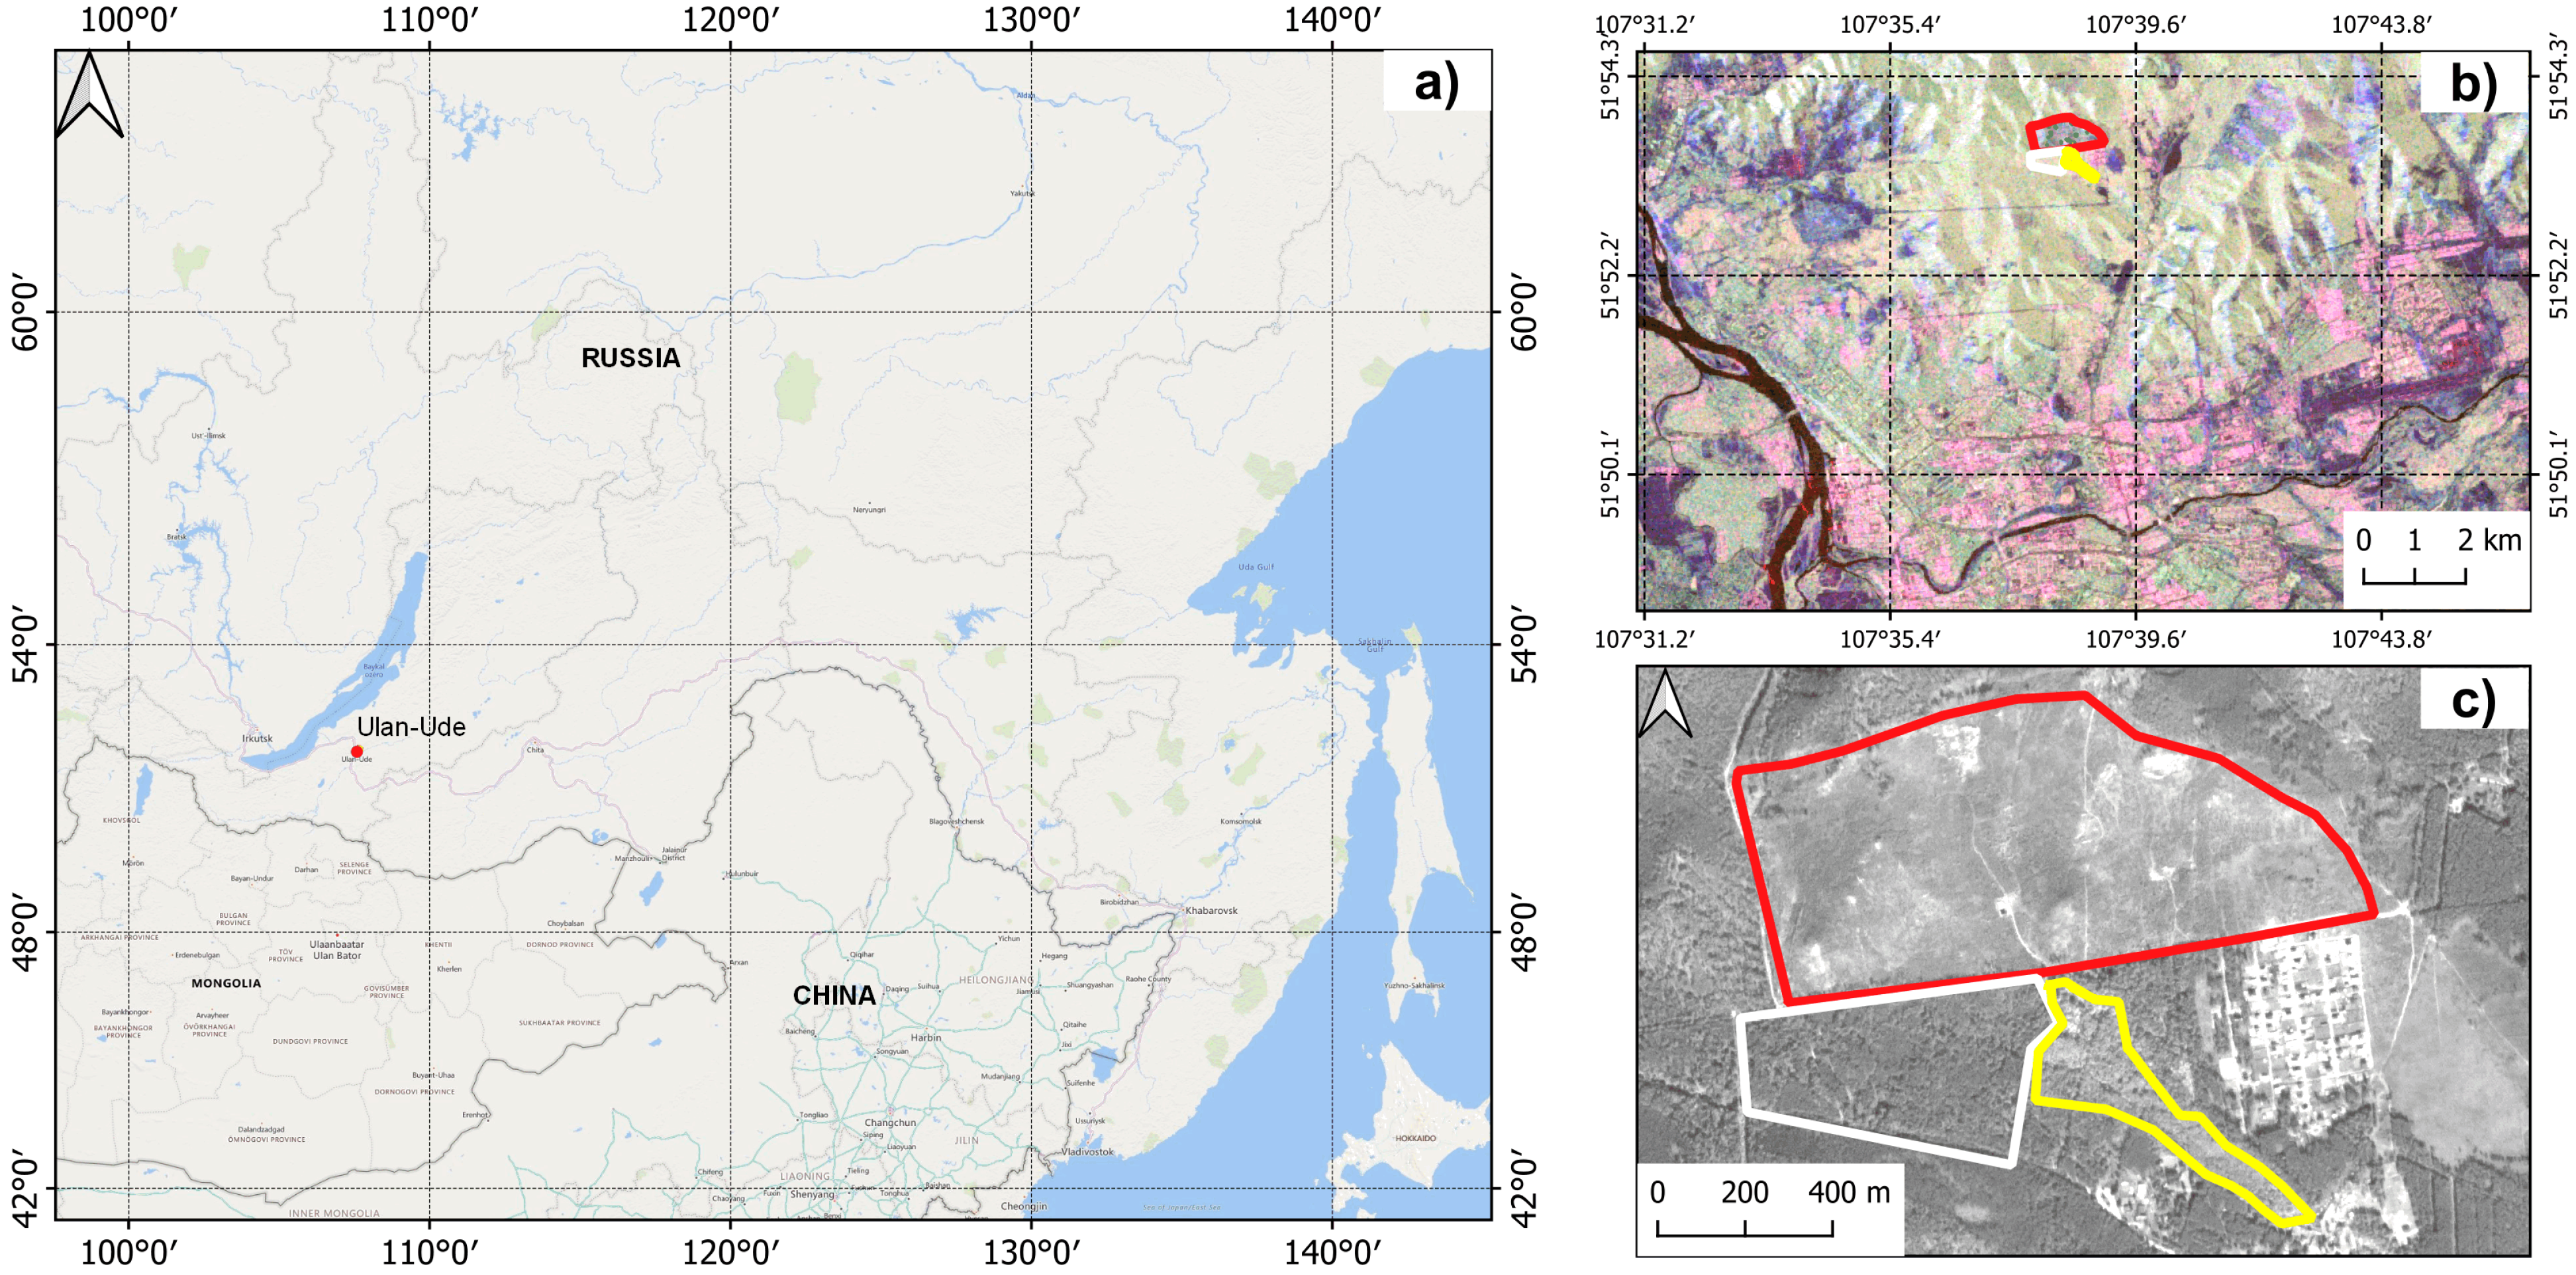
The test site (107.64° N, 51.90° E;
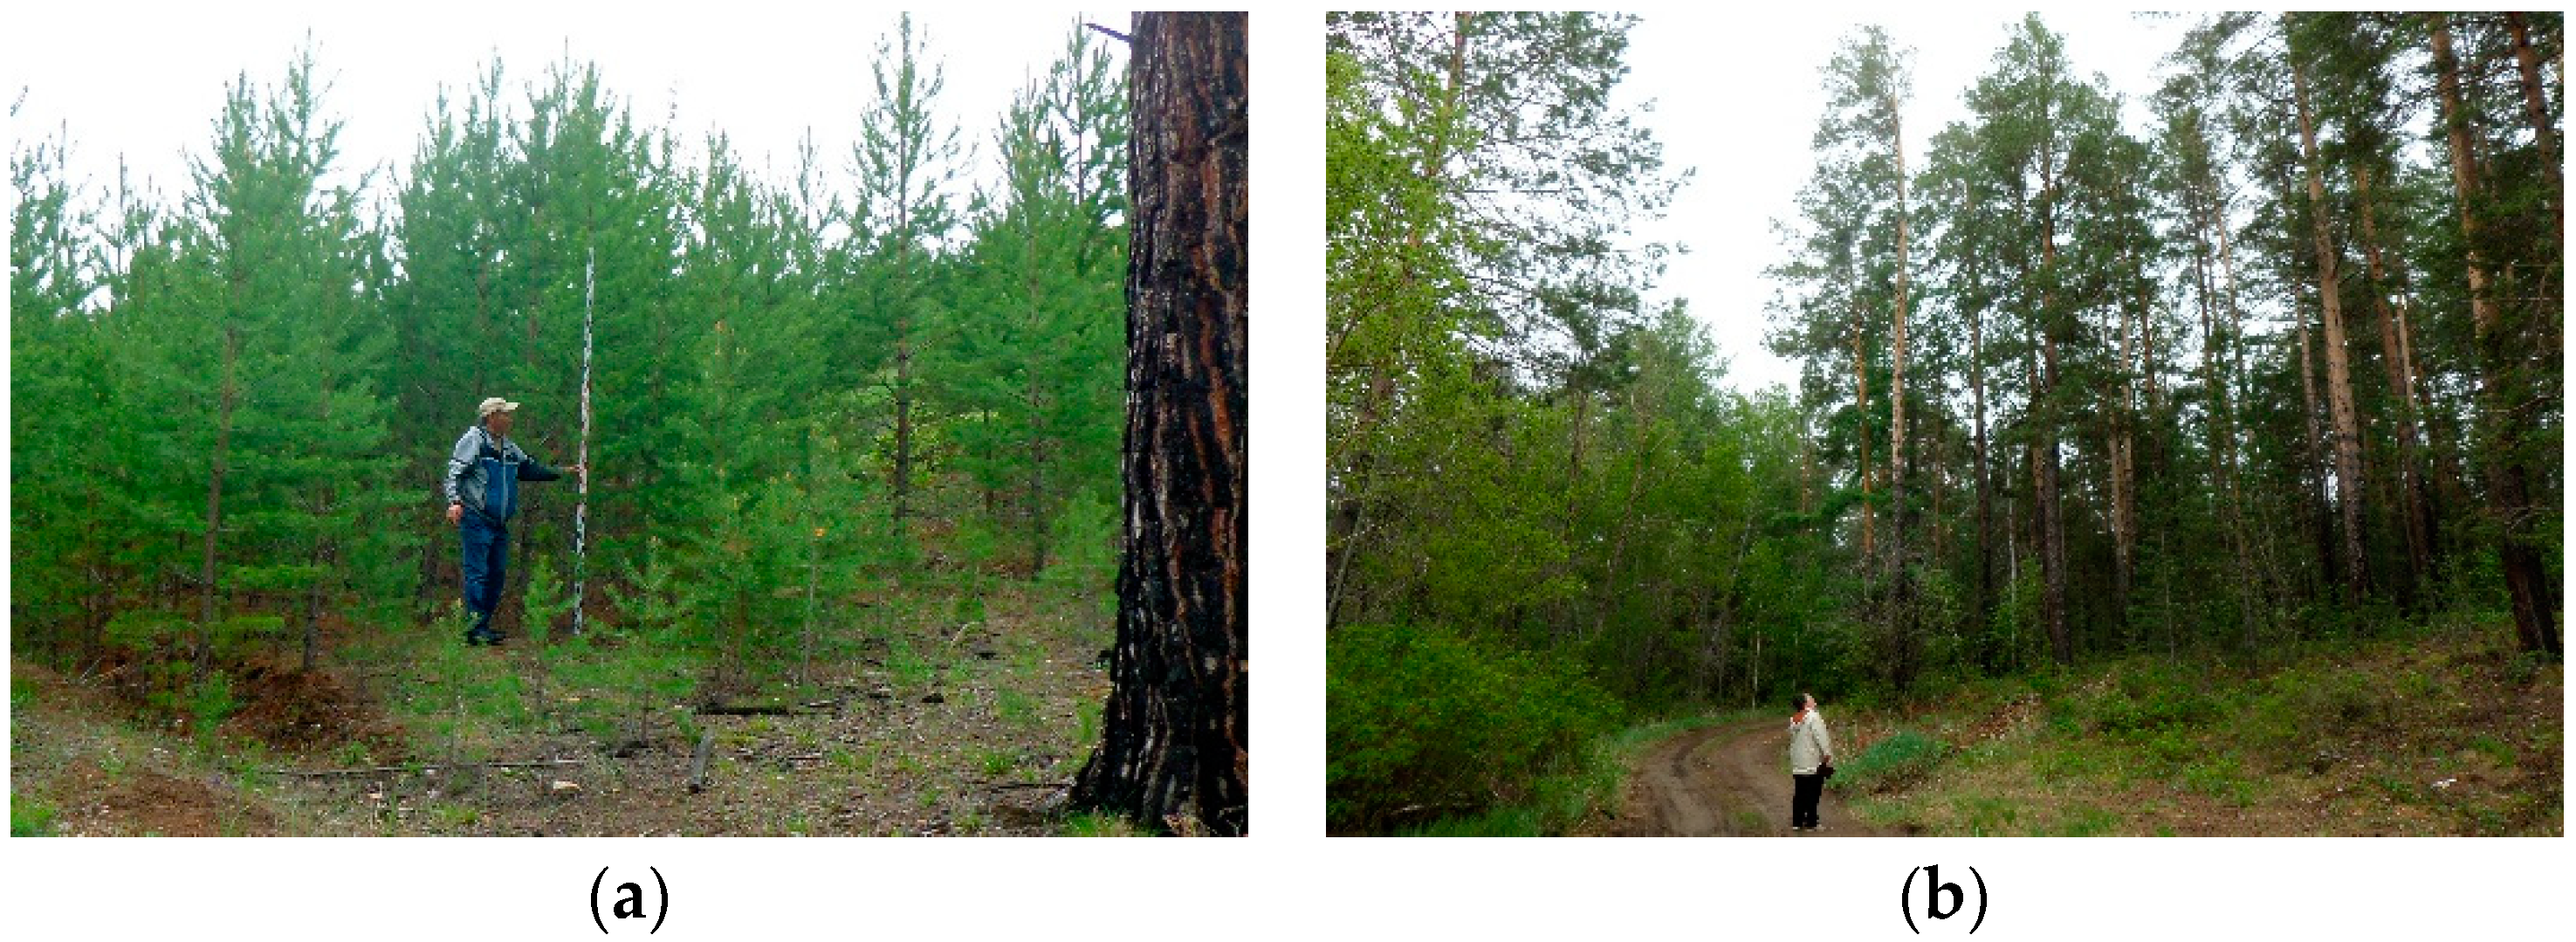
Figure 1) is a typical area of Siberian boreal forest that is located in the region of the Baikal Lake, near the city of Ulan-Ude. The area is mountainous with 680–800 m elevations and slopes up to 30°. After the forest fire that occurred in the spring of 2003, reforestation work was carried out, and pine seedlings (Pínus sylvéstris) were planted. There is an intensive reforestation at present (see
Figure 2a).
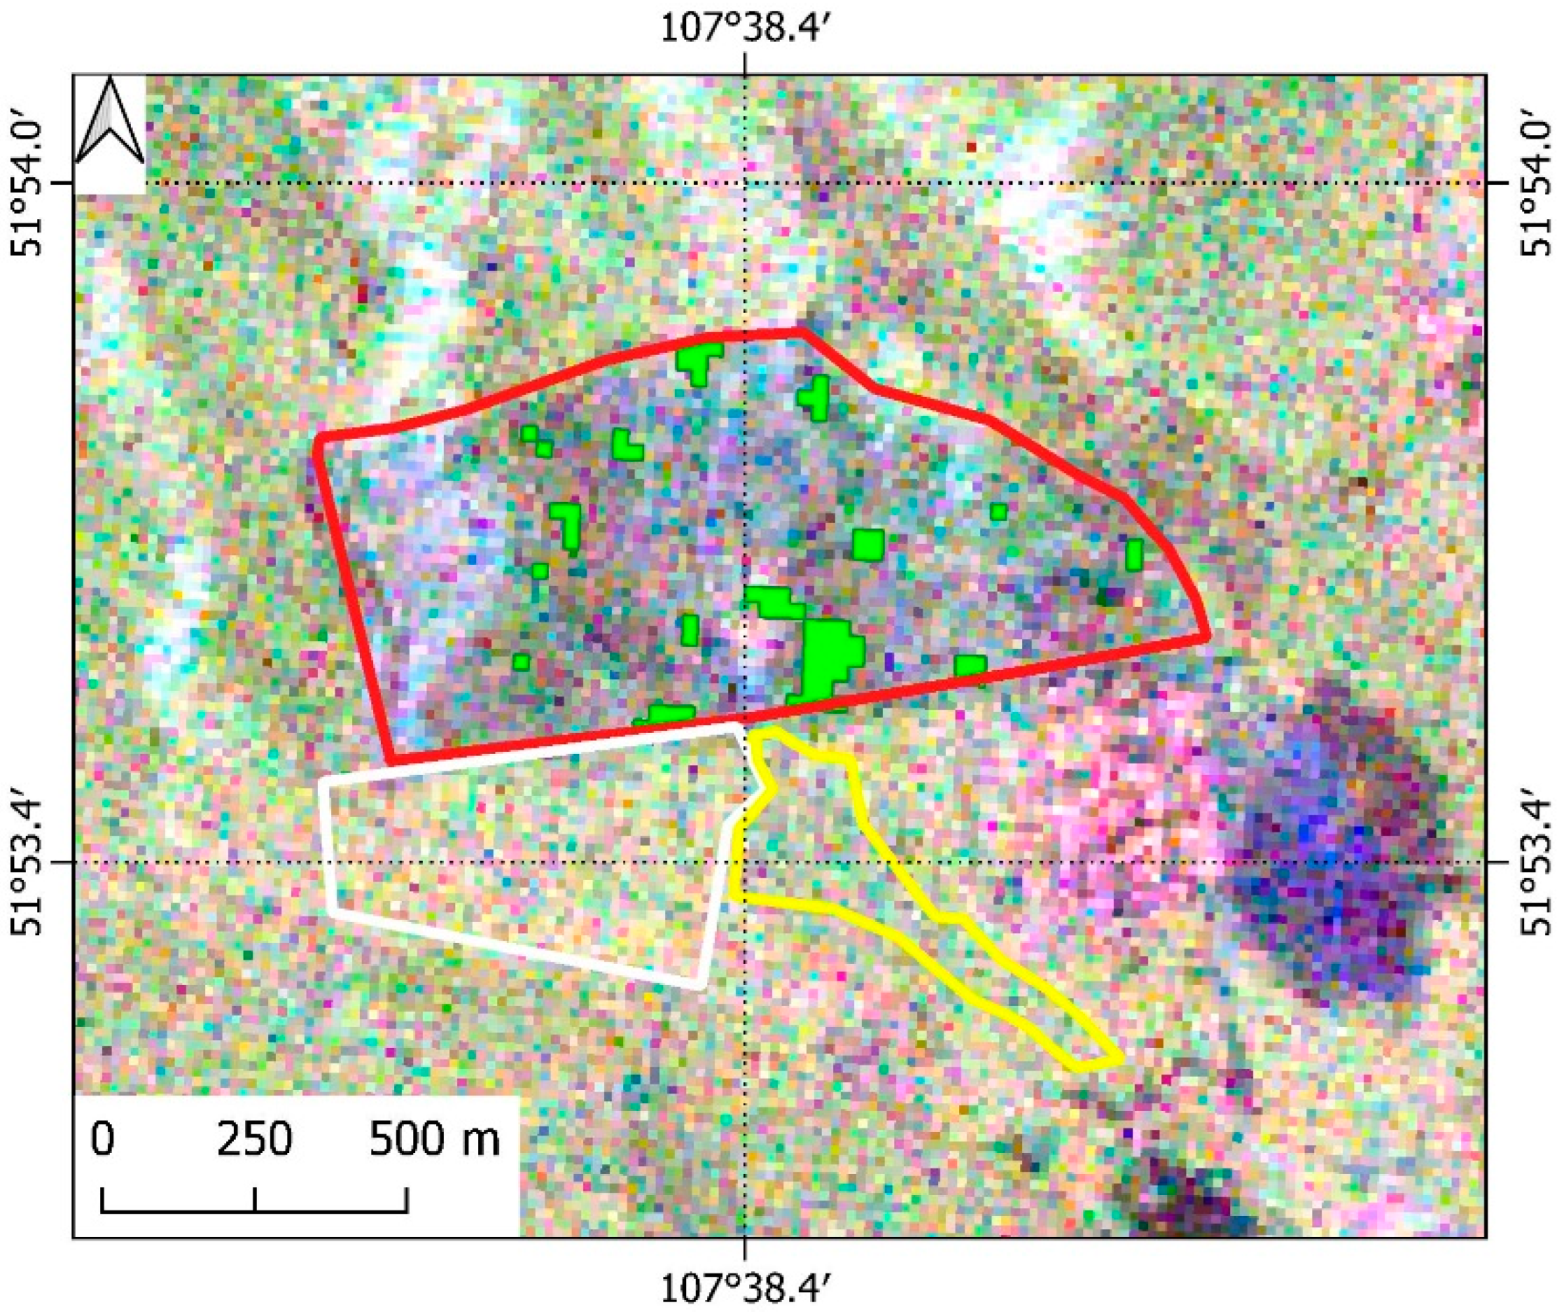
Red polygon in the false color composite of SAR polarimetric data (see
Figure 1b) and in the panchromatic optical image of Resurs-P satellite (2 m spatial resolution) (see
Figure 1c) of 18 September 2020 shows the position of the reforestation test site with an area of 68.8 ha. The false color composite in
Figure 1b gives a qualitative characteristic of a predominant radar backscattering mechanism. Such a representation is generally accepted in the literature on satellite radar polarimetry [
14,
15,
16,
17,
18], as it has a fairly simple interpretation: shades of red are buildings and various natural objects that form a kind of dihedral scatterer with the surface; shades of green are volume discrete inhomogeneities, forest as usual; dark blue and blue are forestless rough surfaces; black is water and smooth surfaces.
For comparison, sections of mature unburned forest adjacent to the reforestation test site were selected. The control section of the pine forest outlined by a white polygon in
Figure 1b,c is similar to the test site before the wildfire. Preliminary studies have shown that correlation between NDVI time series for control and reforestation sites is equal to 0.97 in 1995–2002 (Landsat-5 data). The second control section of mixed forest with a predominance of aspen and birch (yellow polygon in
Figure 1b,c) was chosen considering the possibility of replacing a coniferous forest with a deciduous one after a fire. A photograph of the forest within the white polygon is shown in
Figure 2b.
3. Polarimetric Data Decomposition and Classification
The most general relationship between the incident and received fields may be expressed in the form of a matrix equation:
or
where
and
are the vectors of received and incident field, respectively, [
S] is referred to as the scattering matrix or Sinclair matrix of the scatterer,
R is a wave propagation path, and
k is a phase constant. It should be pointed out that subscripts
H and
V of matrix elements mean horizontal (
H) and vertical (
V) polarizations. The first subscript on each of the elements refers to the polarization of the scattered wave, whereas the second subscript refers to the polarization of the incident wave.
Direct interpretation of scattering matrix is problematic; thus, decomposition methods were developed to represent it as a sum of known radar backscattering mechanisms with more clear interpretation [
15,
16,
17,
18].
One of the most common methods is the Cloude–Pottier decomposition [
16], also named H-α-classification. The Cloude–Pottier decomposition is based on an analysis of coherence matrix eigenvalues. This matrix is defined by the outer product of a three-dimensional scattering vector written in the Pauli basis:
Here, the
SHV =
SVH condition is supposed to be fulfilled. The coherence matrix [
T] off-diagonal elements demonstrate the degree of
kp vector elements correlation:
As the matrix [
T] is by definition Hermitian positive semi-definite, it can always be transformed to a diagonal form:
where λ
1 ≥ λ
2 ≥ λ
3 are the eigenvalues of the coherence matrix that are real non-negative numbers, and the
unitary matrix consists of its eigenvectors. As the dominant scattering mechanism in the model, the mechanism corresponding to the eigenvector with the maximum eigenvalue λ
1 is taken; the remaining two vectors describe the second and third most frequent scattering mechanisms.
The degree of scattering randomness is described by the entropy
where
Pj is the probability of each of the three mechanisms:
If only one of the eigenvalues of the coherence matrix is non-zero, a single scattering mechanism is observed with probability one (deterministic case), and H = 0. If there is no allocated scattering mechanism, and λ1 = λ2 = λ3, then H = 1. However, both these extreme cases never occur in reality, and in-between situations are commonly observed.
We can consider , as some approximation to H = 0. A typical example is the Bragg scattering from a rough surface. An approximation to H = 1 is the scattering on a cloud of chaotically oriented dipoles that is a model for dense forest crowns. High entropy values indicate the presence of vegetation.
The α parameter in the Cloude–Pottier decomposition is calculated as a weighted mean
where
is one of the angles that parametrize the
eigenvector:
The angle takes on values from 0° (corresponds to the surface scattering mechanism) to 90° (corresponds to the double reflection from ideal conductive surface of a dihedral scatterer). An intermediate value of 45° corresponds to dipole scattering.
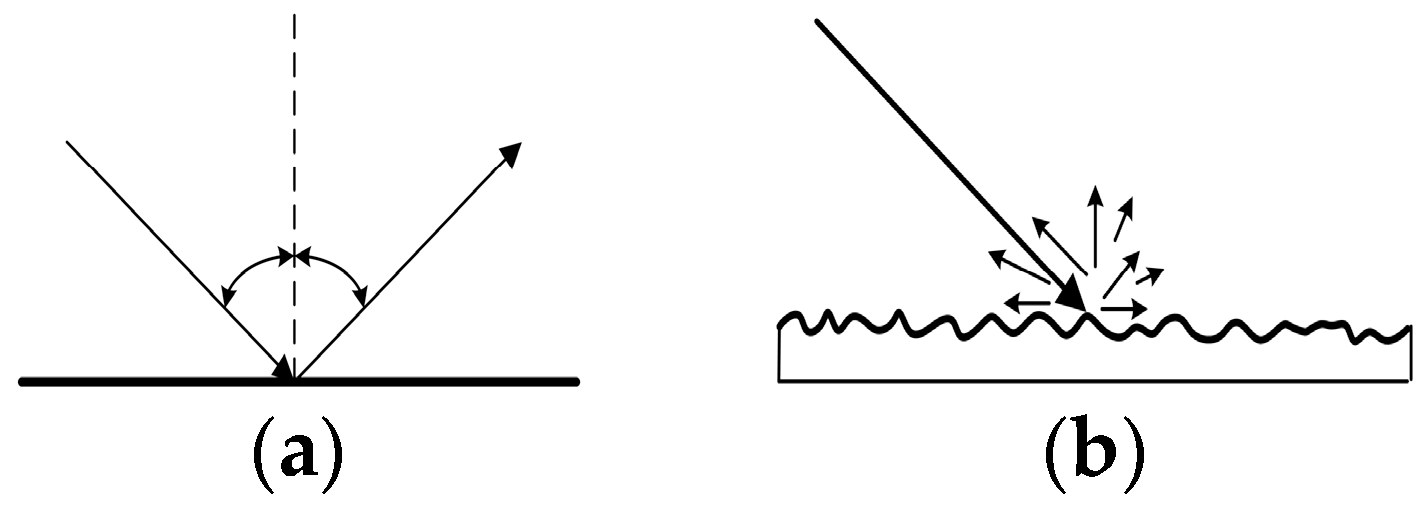
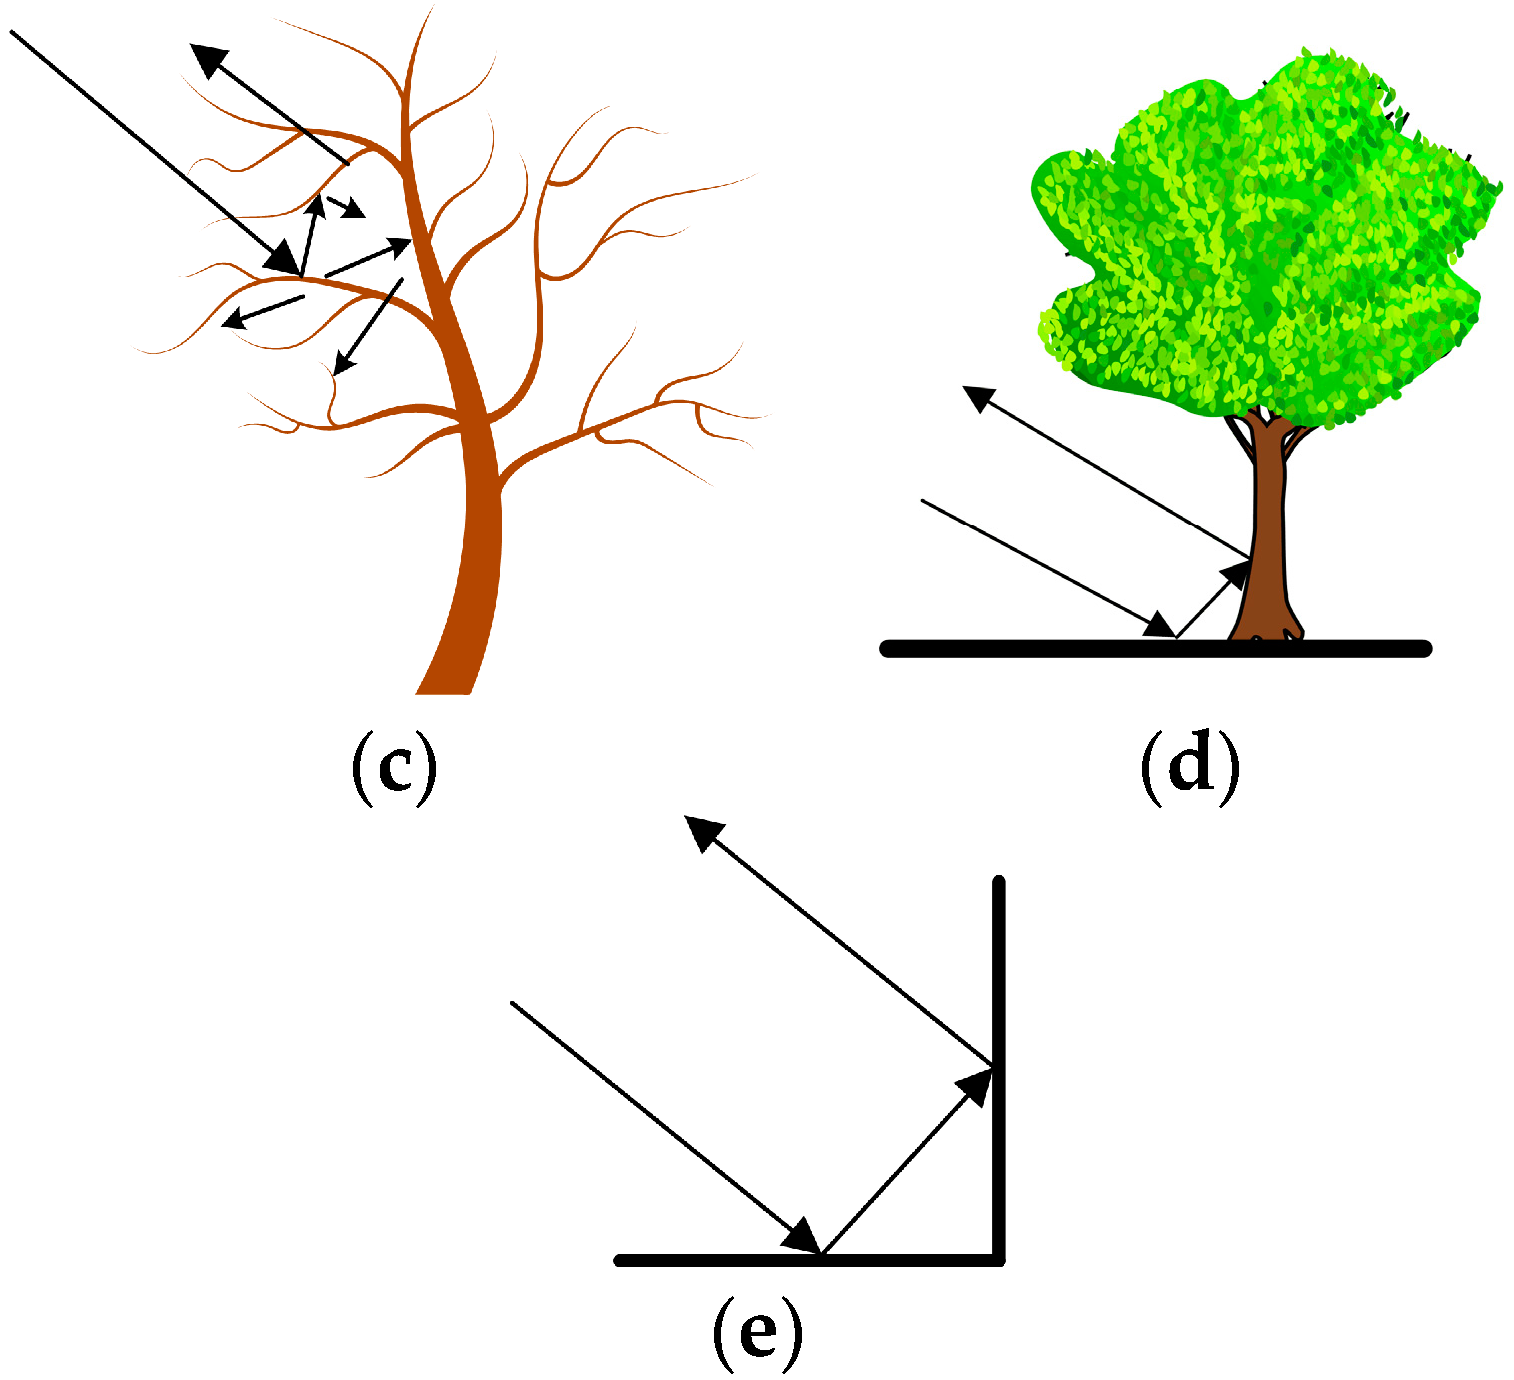
Using this method, sixteen different classes can be distinguished that are components of the three main physical mechanisms of the radar backscattering (see
Figure 3):
Single bounce (surface) scattering (no tree trunks and branches comparable with L-band wavelength, thus there is scattering from the surface only);
Double bounce (dihedral) scattering (e.g., from the surface and further from the tree trunk or in reverse order;
Volume scattering by a set of randomly located branches, tree trunks, having the dimensions comparable or greater than the L-band wavelength.
4. Results of Polarimetric Data Analysis
Let us consider the possibility of using this decomposition to assess forest recovery after a fire using the analysis of multi-temporal L-band polarimetric data. In this case, for the sake of simplicity, we evaluate changes in the three main physical scattering mechanisms, as was shown by Bondur et al. [
17]. It should also be noted that the change in scattering mechanisms would be associated with the dynamics of the size of heterogeneities in forest regrowth. For example, individual trunks and branches, as well as a combination of trunks and branches, become comparable with a wavelength of 24 cm.
A classification using the Cloude–Pottier method was carried out according to radar polarimetry data for the years of 2017 and 2019. The comparison results are given in
Figure 4. The colors of test site polygons are similar to polygons from
Figure 1. Areas of green are reforestation areas, where the predominant mechanism changed from surface to volume scattering (see
Figure 3).
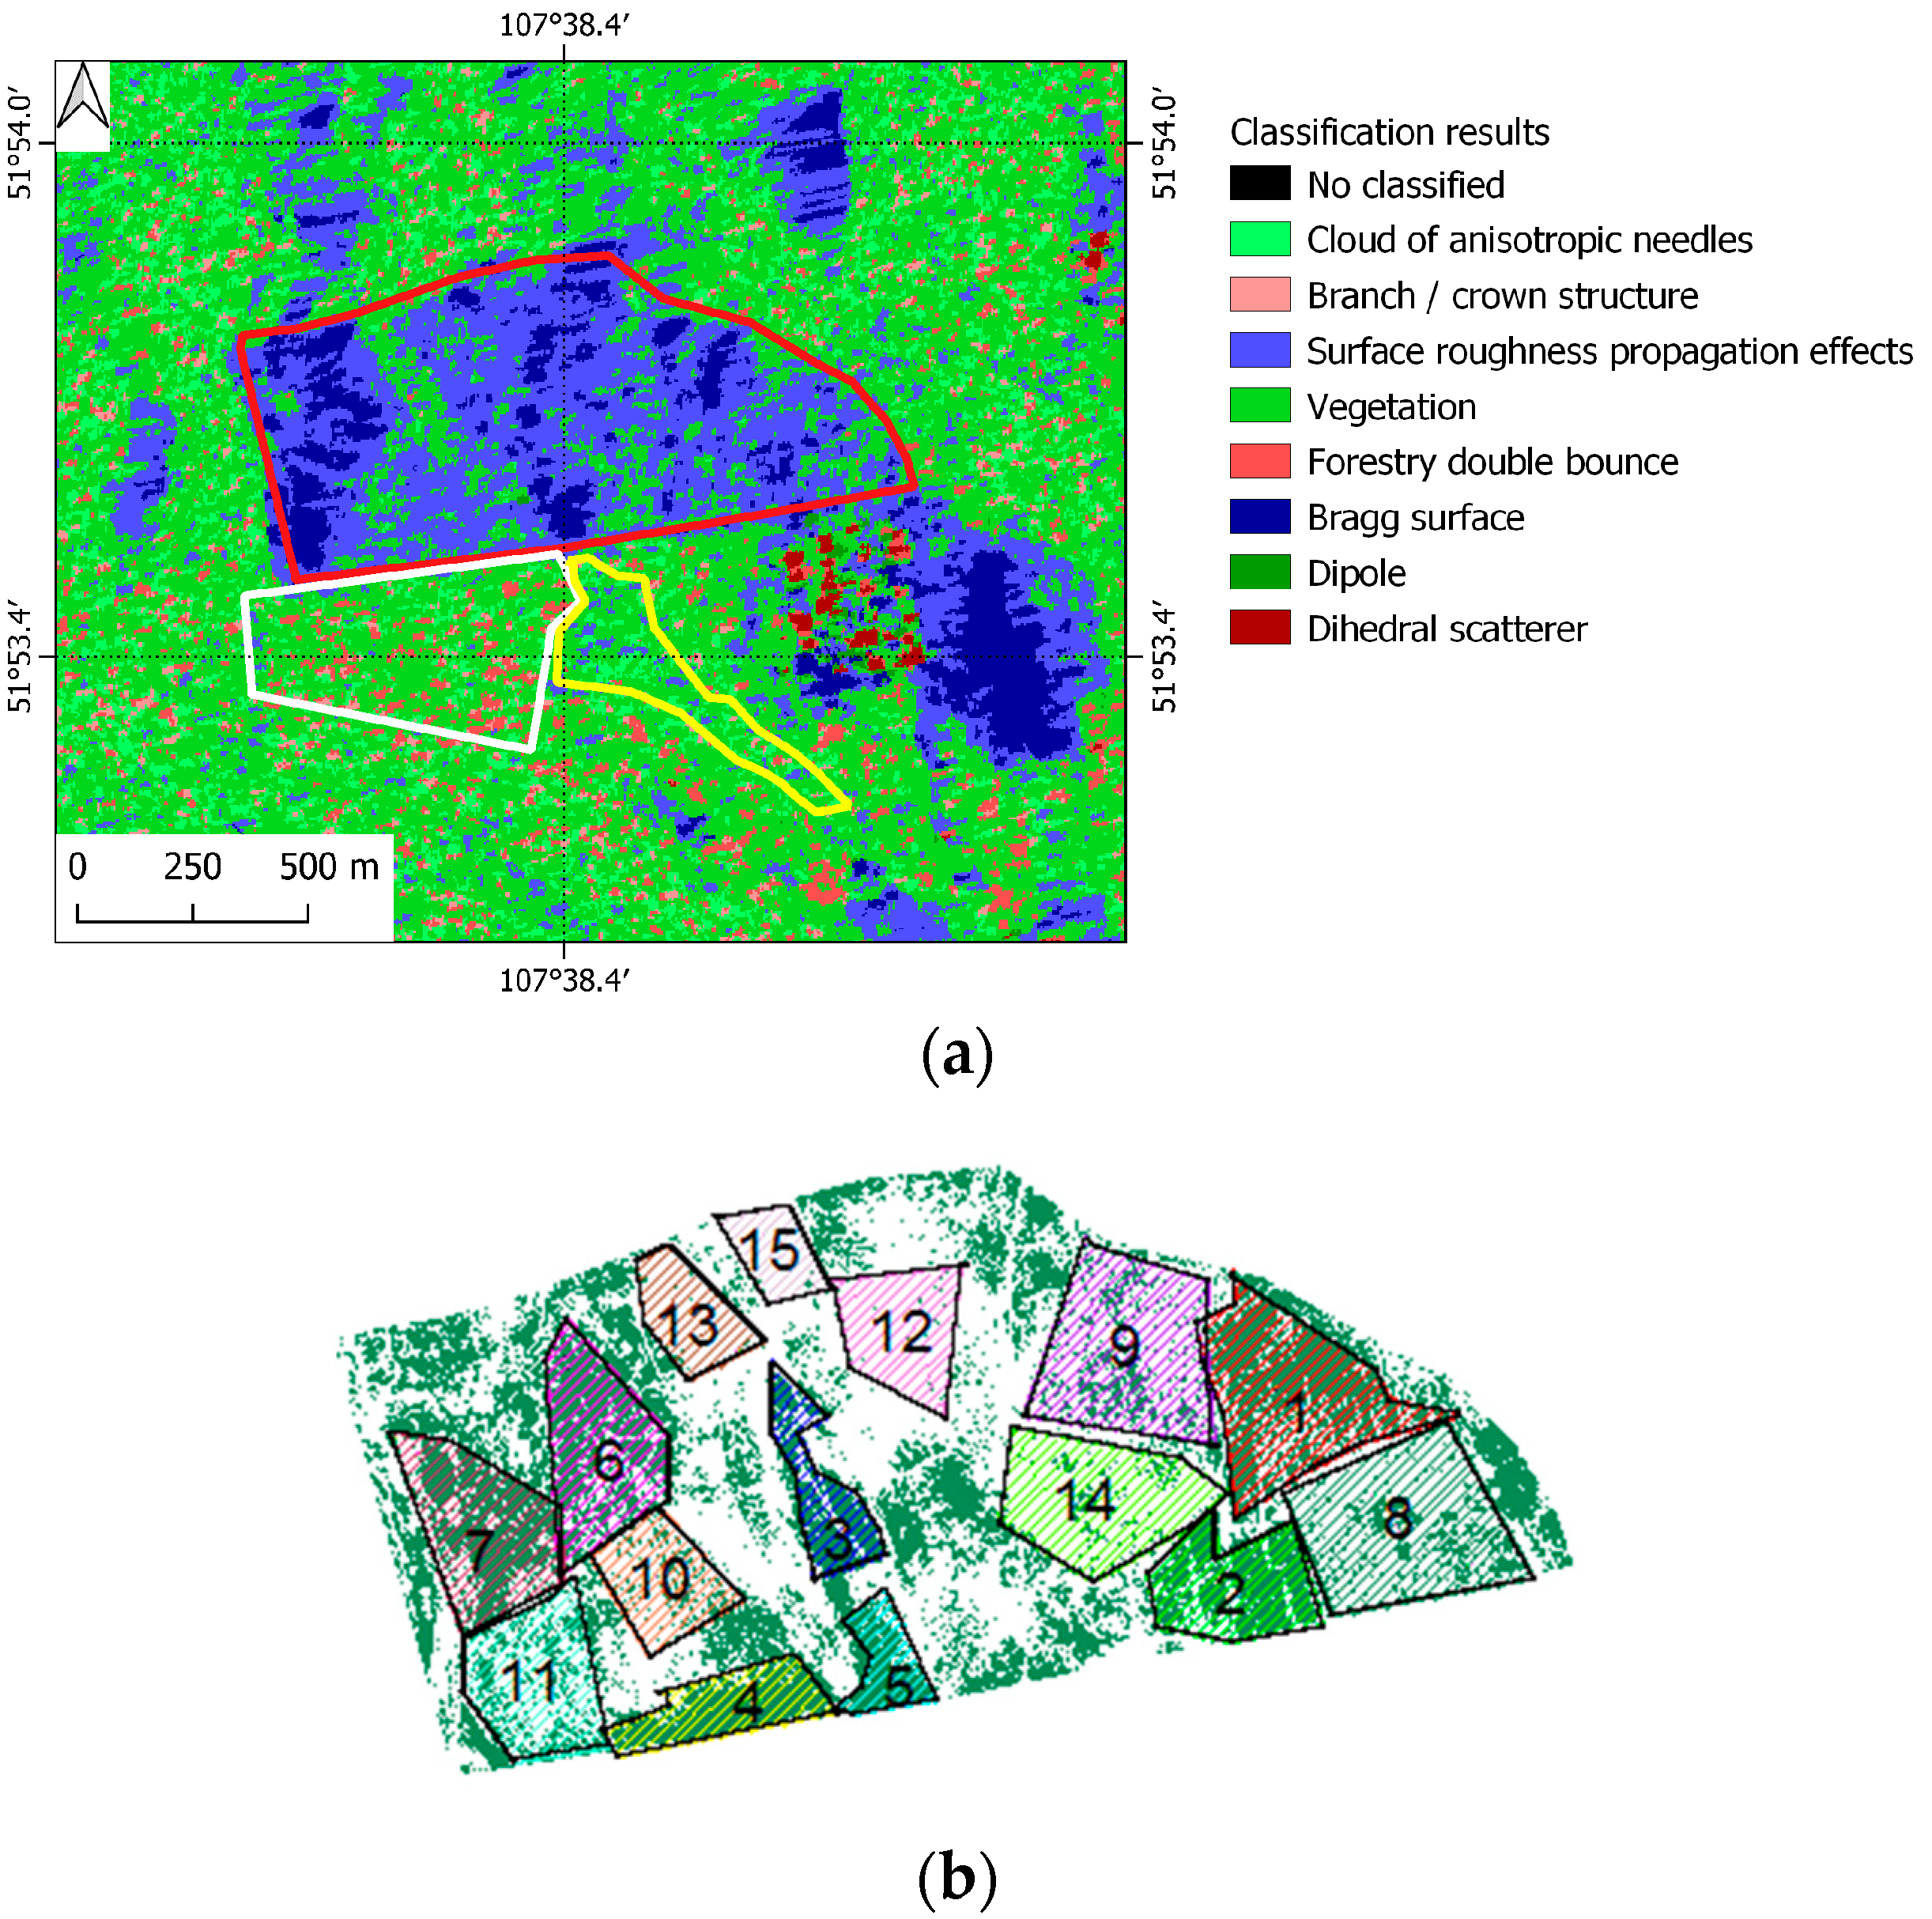
Figure 5a shows a fragment of H-α classification result according to 2019 data, where classes with dominance of surface scattering are colored in shades of blue, classes with dominance of volume scattering are in green, and classes with dominance of double scattering are in red.
For further analysis, the test reforestation area will be represented as 15 separate sites (
Figure 5b) with different regrowth density. Sites 1–7 have high density, 8–11 have medium density, and 12–15 have low density. A binary vegetation mask obtained from a high-resolution optical Resurs-P winter image of 4 March 2018 was used for site selection. The territory covered by young pine stock is green (NDVI ≥ 0.2, mask value is 1), without vegetation is white (NDVI < 0.2, mask value is 0).
Let us consider the statistics of the results of polarimetric decompositions of the ALOS-2 PALSAR-2 radar data for 2017 and 2019, grouped according to the type of dominant scattering mechanism (see
Table 1). Test and reference sites in this table are ranked according to the density of the forest canopy. The density was calculated as an average value over the territory of each test area on the binary image of the mask and represented the proportion of the territory occupied by forest vegetation. This density varied from 0—in the absence of vegetation to 1—for continuous dense forest. Data for 2017 and 2019 are given in the table. Changes in the values in the table show the dynamics over the 2.5-year period between surveys.
In general, throughout the study area of reforestation (red polygon), there is a decrease in the surface scattering component from 84.43% to 79.51%, and the dominance of the volume type of scattering increases from 12.44% to 20.38%. The dominant double scattering area is not large and almost does not change (from 0.13% to 0.11%), which is probably due to the insufficient thickness and weight of trunks of 10–15-year-old pine regrowth in the L-band.
As we can see from
Table 1, the dynamics is the same for most reforestation sites. At the same time, it should be noted that there is a significant difference between the values corresponding to the volume scattering of the reference pine and mixed forest (70–87%) and those for the considered reforestation site (34% max). This indicates the potential for further tree growth.
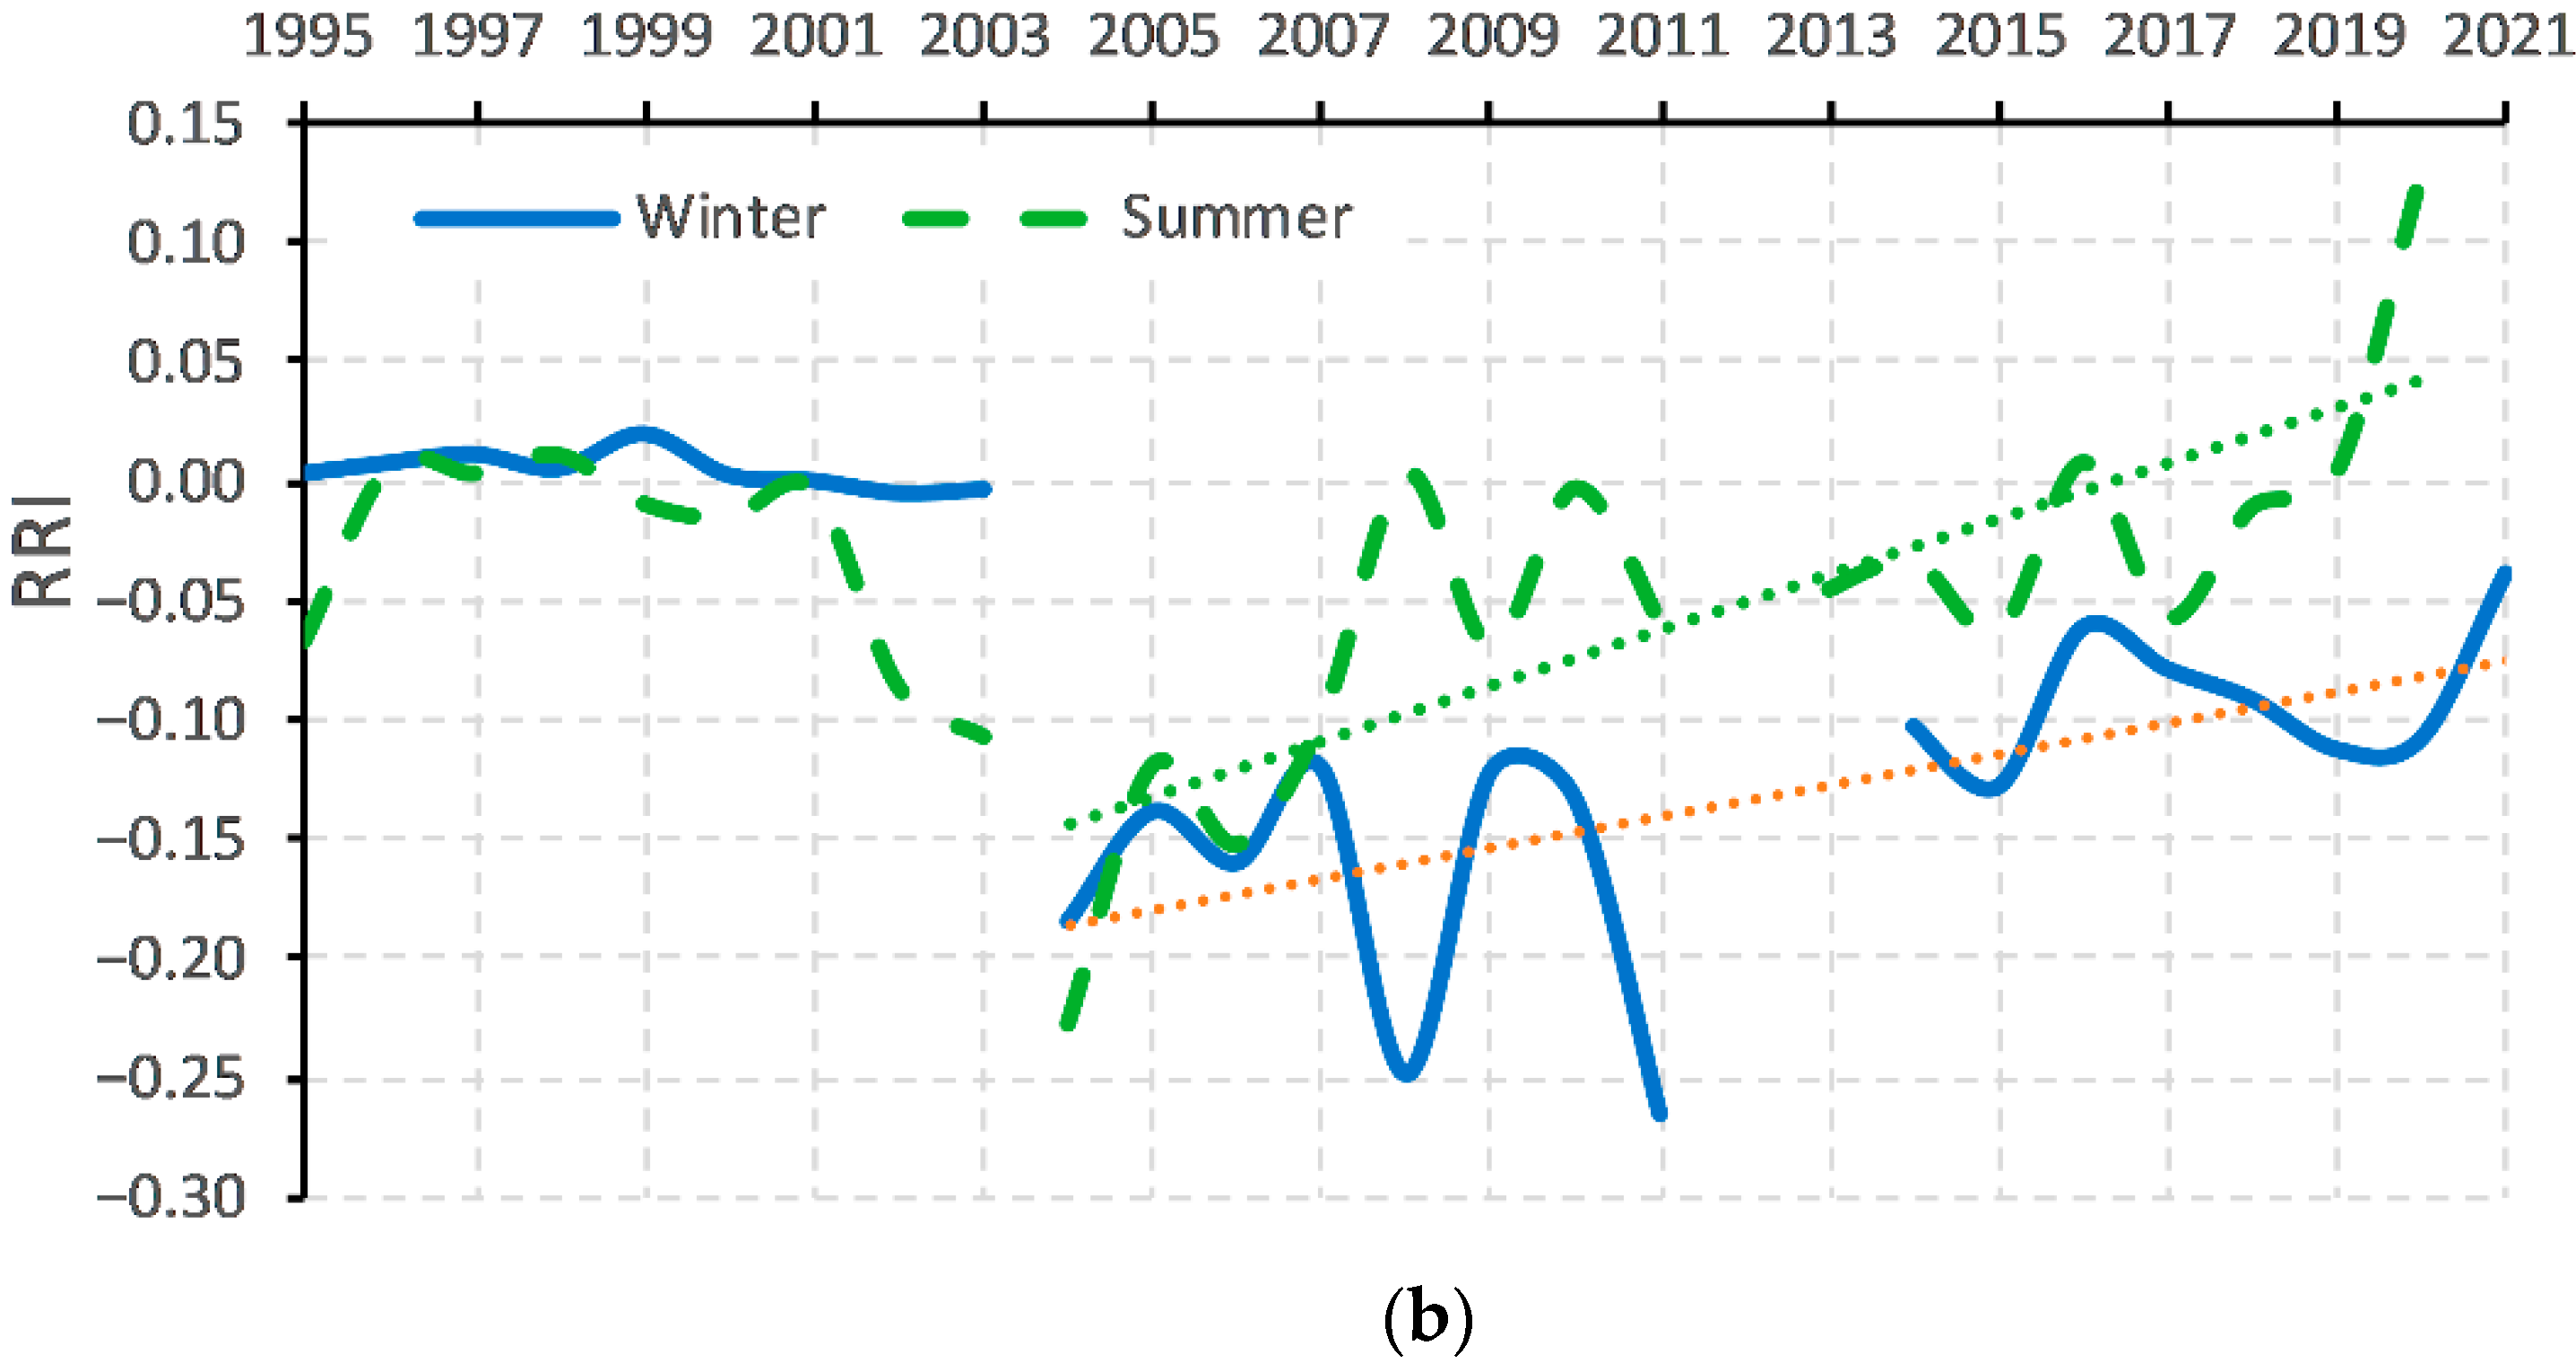
5. Reforestation Assessment Based on the Results of Cloud Computations
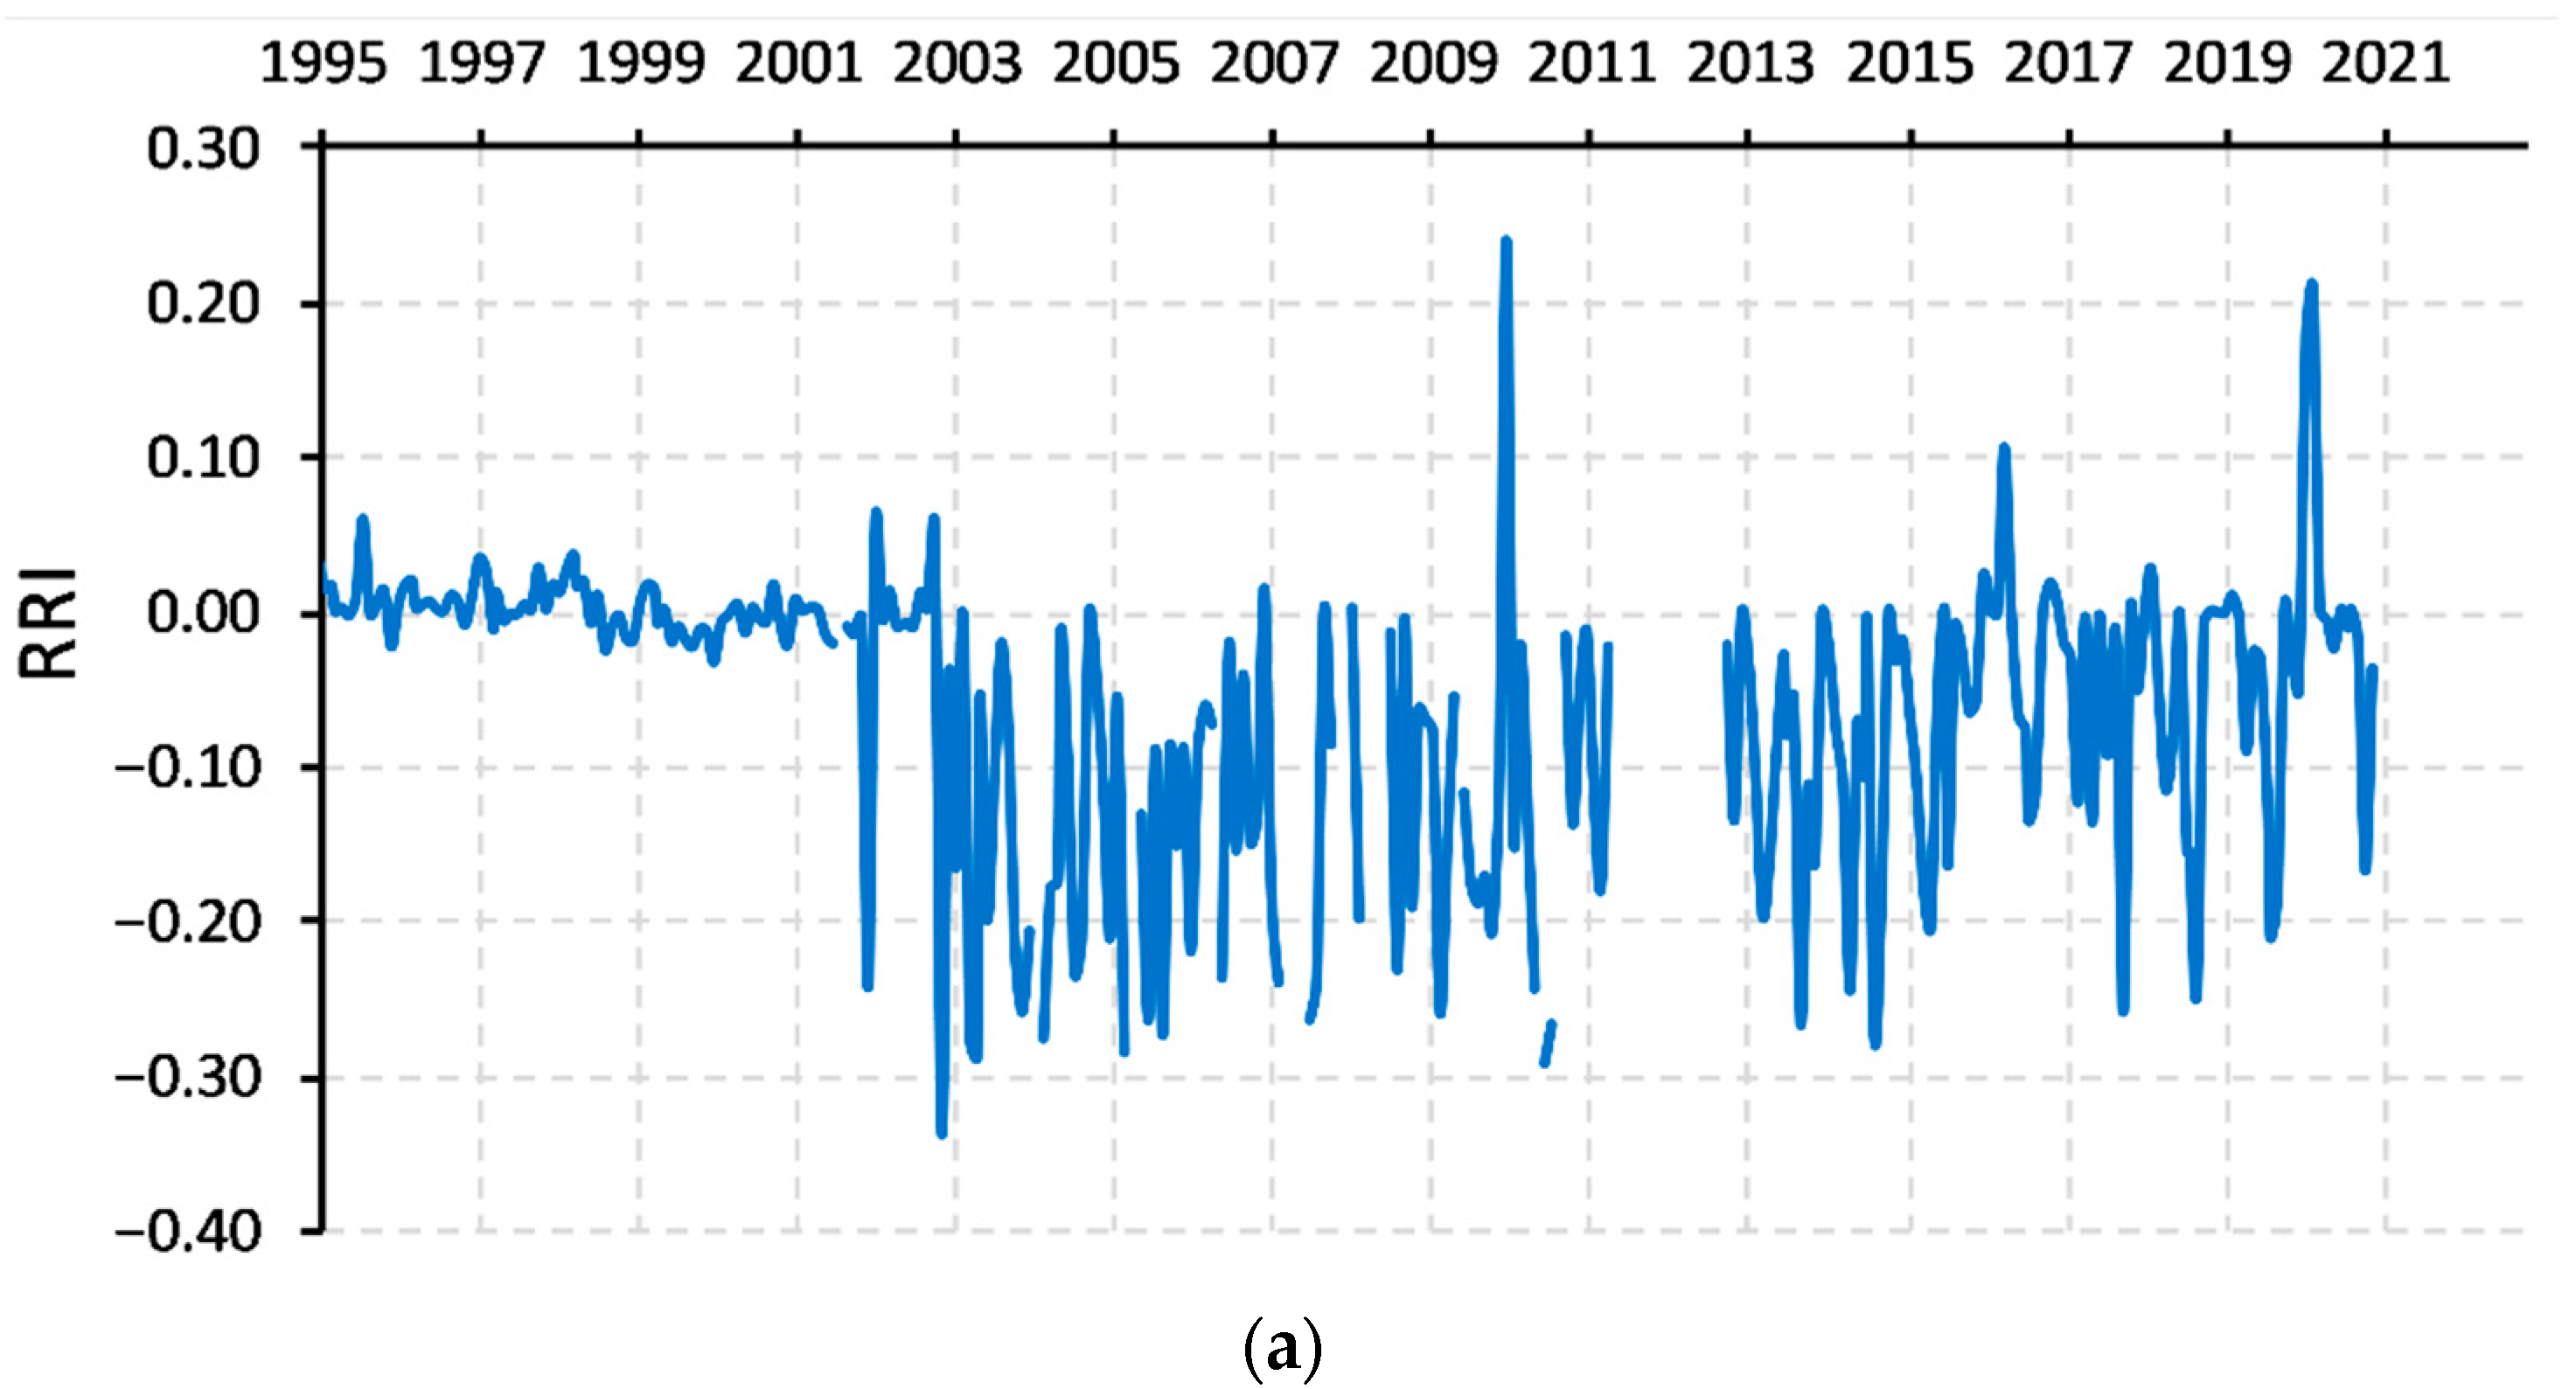
To assess the reforestation process, the results of cloud computations (using GEE) of NDVI time series were used, based on the data of the Landsat-5 and Landsat-8 satellite sensors averaged over 32 days [
19]. The relative regrowth index (RRI) was calculated using these values, according to the following equation [
20]:
where NDVI
test is the index averaged over the territory of the test site with forest regrowth, and NDVI
pine is the index of the reference pine forest site.
The result is given in
Figure 6a. NDVI values of these two sites before the fire differ slightly; the RRI is close to zero. The correlation coefficient for two NDVI series for 1995–2002 is equal to 0.97.
After the fire in 2003, seasonal RRI fluctuations increased. This was related to intensive growth of grass within the test site (continuous projective green plant cover) in spring and summer and snow cover in winter (discrete pine regrowth cover). Thus, to distinguish conifer undergrowth and grass cover, let us consider RRI averaged over winter and summer seasons.
The averaged curves in
Figure 6b demonstrate different rates of recovery to the level of the reference forest, i.e., level close to zero. The linear trends demonstrate that a coniferous forest reaches an equal, with a combination of dense grass, shrub vegetation, and deciduous trees, projective plant cover after 10 years or more.
Overall, the considered approach to the use of cloud computing for long-term series of the vegetation index will make it possible to predict the restoration of the forest with the replacement by more valuable coniferous tree species.
6. Conclusions
The technique of integrated remote sensing of reforestation processes after strong wildfires is proposed. The methodology is based on joint use of the following:
Fully polarimetric L-band ALOS-2 PALSAR-2 satellite radar data to assess the temporal dynamics of the physical mechanisms of radar backscatter in the areas of forest regrowth. A decrease in the surface scattering component of the radar backscattering and an increase in the scattering component by the volume inhomogeneity of the forest regrowth means an increase in the size and number of inhomogeneities (trunk and branches) of the forest regrowth, comparable with the radar wavelength.
The results of cloud computations of the vegetation index long-time series according to Landsat-5, 8 multispectral imagery and subsequent assessment of the relative regrowth index (projective plant cover increase) by coniferous regrowth on the basis of the comparison of winter and summer indices of the test and reference sites.
The proposed combination made it possible to quantitatively and qualitatively analyze the process of reforestation with a comparative assessment of the retrospective state of the forest before the fire, as well as from the point of view of seasonal changes in the projective cover and the geometric dimensions of forest regrowth. Long-time NDVI series have allowed us to reveal the forest recovery trend and to forecast further reforestation. Despite the lack of radar polarimetric data time series, the capability of assessing the processes of reforestation in terms of growth in the size of trunks, branches, i.e., aboveground tree biomass, has been demonstrated. In the case under consideration, it is shown that the growth potential of aboveground biomass in different areas ranges from 35% to 70%.
The described approach is novel and will further make it possible to more accurately account for the role of boreal forests, including forest regrowth, as one of the largest carbon stocks.
Author Contributions
Conceptualization, funding acquisition, and editing of the manuscript, V.B.; T.C. contributed in terms of methodology, writing the original draft, editing of the manuscript; I.K. contributed in terms of methodology and analysis of satellite data and field measurements; processing of satellite data, visualization, editing of the manuscript, A.D. All authors have read and agreed to the published version of the manuscript.
Funding
This research was carried out with the financial support of the Ministry of Science and Higher Education of the Russian Federation in the framework of the Agreement No. 075-15-2020-776.
Acknowledgments
The authors thank the Japan Aerospace Exploration Agency—JAXA for ALOS-1/2 PALSAR-1/2 data provided in the framework of the ALOS-2 RA6 (PI-3402) project and Research Center for Earth Operative Monitoring (Russian Space Systems) for Resurs-P data.
Conflicts of Interest
The authors declare no conflict of interest.
References
- Jackson, S.T. Transformational Ecology and Climate Change. Science 2021, 373, 1085–1086. [Google Scholar] [CrossRef] [PubMed]
- Welsby, D.; Price, J.; Pye, S.; Ekins, P. Unextractable Fossil Fuels in a 1.5 °C World. Nature 2021, 597, 230–234. [Google Scholar] [CrossRef] [PubMed]
- Vatandaşlar, C.; Abdikan, S. Carbon Stock Estimation by Dual-Polarized Synthetic Aperture Radar (SAR) and Forest Inventory Data in a Mediterranean Forest Landscape. J. For. Res. 2021, 33, 827–838. [Google Scholar] [CrossRef]
- Juhos, K.; Madarász, B.; Kotroczó, Z.; Béni, Á.; Makádi, M.; Fekete, I. Carbon Sequestration of Forest Soils Is Reflected by Changes in Physicochemical Soil Indicators—A Comprehensive Discussion of a Long-Term Experiment on a Detritus Manipulation. Geoderma 2021, 385, 114918. [Google Scholar] [CrossRef]
- Bondur, V.G.; Gordo, K.A. Satellite Monitoring of Burnt-out Areas and Emissions of Harmful Contaminants Due to Forest and Other Wildfires in Russia. Izv. Atmos. Ocean. Phys. 2018, 54, 955–965. [Google Scholar] [CrossRef]
- Bondur, V.G.; Gordo, K.A.; Kladov, V.L. Spacetime Distributions of Wildfire Areas and Emissions of Carbon-Containing Gases and Aerosols in Northern Eurasia According to Satellite-Monitoring Data. Izv. Atmos. Ocean. Phys. 2017, 53, 859–874. [Google Scholar] [CrossRef]
- Bondur, V.G.; Mokhov, I.I.; Voronova, O.S.; Sitnov, S.A. Satellite Monitoring of Siberian Wildfires and Their Effects: Features of 2019 Anomalies and Trends of 20-Year Changes. Dokl. Earth Sci. 2020, 492, 370–375. [Google Scholar] [CrossRef]
- Bondur, V.G.; Tsidilina, M.N.; Cherepanova, E.V. Satellite Monitoring of Wildfire Impacts on the Conditions of Various Types of Vegetation Cover in the Federal Districts of the Russian Federation. Izv. Atmos. Ocean. Phys. 2019, 55, 1238–1253. [Google Scholar] [CrossRef]
- Bondur, V.G.; Chimitdorzhiev, T.N.; Dmitriev, A.V.; Dagurov, P.N. Spatial Anisotropy Assessment of the Forest Vegetation Heterogeneity at Different Azimuth Angles of Radar Polarimetric Sensing. Izv. Atmos. Ocean. Phys. 2019, 55, 926–934. [Google Scholar] [CrossRef]
- Chimitdorzhiev, T.N.; Dmitriev, A.V.; Kirbizhekova, I.I.; Sherhoeva, A.A.; Baltukhaev, A.K.; Dagurov, P.N. Remote optical-microwave measurements of forest parameters: Modern state of research and experimental assessment of potentials. Sovrem. Probl. Distantsionnogo Zondirovaniya Zemli Iz Kosm. 2018, 15, 9–24. [Google Scholar] [CrossRef]
- Gorelick, N.; Hancher, M.; Dixon, M.; Ilyushchenko, S.; Thau, D.; Moore, R. Google Earth Engine: Planetary-Scale Geospatial Analysis for Everyone. Remote Sens. Environ. 2017, 202, 18–27. [Google Scholar] [CrossRef]
- Amani, M.; Ghorbanian, A.; Ahmadi, S.A.; Kakooei, M.; Moghimi, A.; Mirmazloumi, S.M.; Alizadeh Moghaddam, S.H.; Mahdavi, S.; Ghahremanloo, M.; Parsian, S.; et al. Google Earth Engine Cloud Computing Platform for Remote Sensing Big Data Applications: A Comprehensive Review. IEEE J. Sel. Top. Appl. Earth Obs. Remote Sens. 2020, 13, 5326–5350. [Google Scholar] [CrossRef]
- Seydi, S.T.; Akhoondzadeh, M.; Amani, M.; Mahdavi, S. Wildfire Damage Assessment over Australia Using Sentinel-2 Imagery and MODIS Land Cover Product within the Google Earth Engine Cloud Platform. Remote Sens. 2021, 13, 220. [Google Scholar] [CrossRef]
- Bondur, V.G.; Vorobev, V.E. Satellite Monitoring of Impact Arctic Regions. Izv. Atmos. Ocean. Phys. 2015, 51, 949–968. [Google Scholar] [CrossRef]
- Lee, J.-S.; Pottier, E. Polarimetric Radar Imaging: From Basics to Applications; Optical Science and Engineering; CRC Press: Boca Raton, FL, USA, 2009; ISBN 978-1-4200-5497-2. [Google Scholar]
- Cloude, S.R.; Pottier, E. A Review of Target Decomposition Theorems in Radar Polarimetry. IEEE Trans. Geosci. Remote Sens. 1996, 34, 498–518. [Google Scholar] [CrossRef]
- Bondur, V.G.; Chimitdorzhiev, T.N.; Dmitriev, A.V.; Dagurov, P.N.; Zakharov, A.I.; Zakharova, L.N. Application of Radar Polarimetry to Monitor Changes in Backscattering Mechanisms in Landslide Zones Using the Example of the Collapse of the Bureya River Bank. Izv. Atmos. Ocean. Phys. 2020, 56, 916–926. [Google Scholar] [CrossRef]
- 1st Advanced Training Course on Land Remote Sensing 2007—Earth Online. Available online: https://earth.esa.int/eogateway/events/advanced-training-course-on-land-remote-sensing (accessed on 23 March 2022).
- Landsat 8 Collection 1 Tier 1 32-Day NDVI Composite. Available online: https://developers.google.com/earth-engine/datasets/catalog/LANDSAT_LC08_C01_T1_32DAY_NDVI (accessed on 23 March 2022).
- Yi, K.; Tani, H.; Zhang, J.; Guo, M.; Wang, X.; Zhong, G. Long-Term Satellite Detection of Post-Fire Vegetation Trends in Boreal Forests of China. Remote Sens. 2013, 5, 6938–6957. [Google Scholar] [CrossRef] [Green Version]
| Publisher’s Note: MDPI stays neutral with regard to jurisdictional claims in published maps and institutional affiliations. |
© 2022 by the authors. Licensee MDPI, Basel, Switzerland. This article is an open access article distributed under the terms and conditions of the Creative Commons Attribution (CC BY) license (https://creativecommons.org/licenses/by/4.0/).


