
How to Improve Forest Carbon Sequestration Output Performance: An Evidence from State-Owned Forest Farms in China


Abstract
:1. Introduction
2. Materials and Methods
2.1. Methodology
2.1.1. Carbon Storage Measurement Model
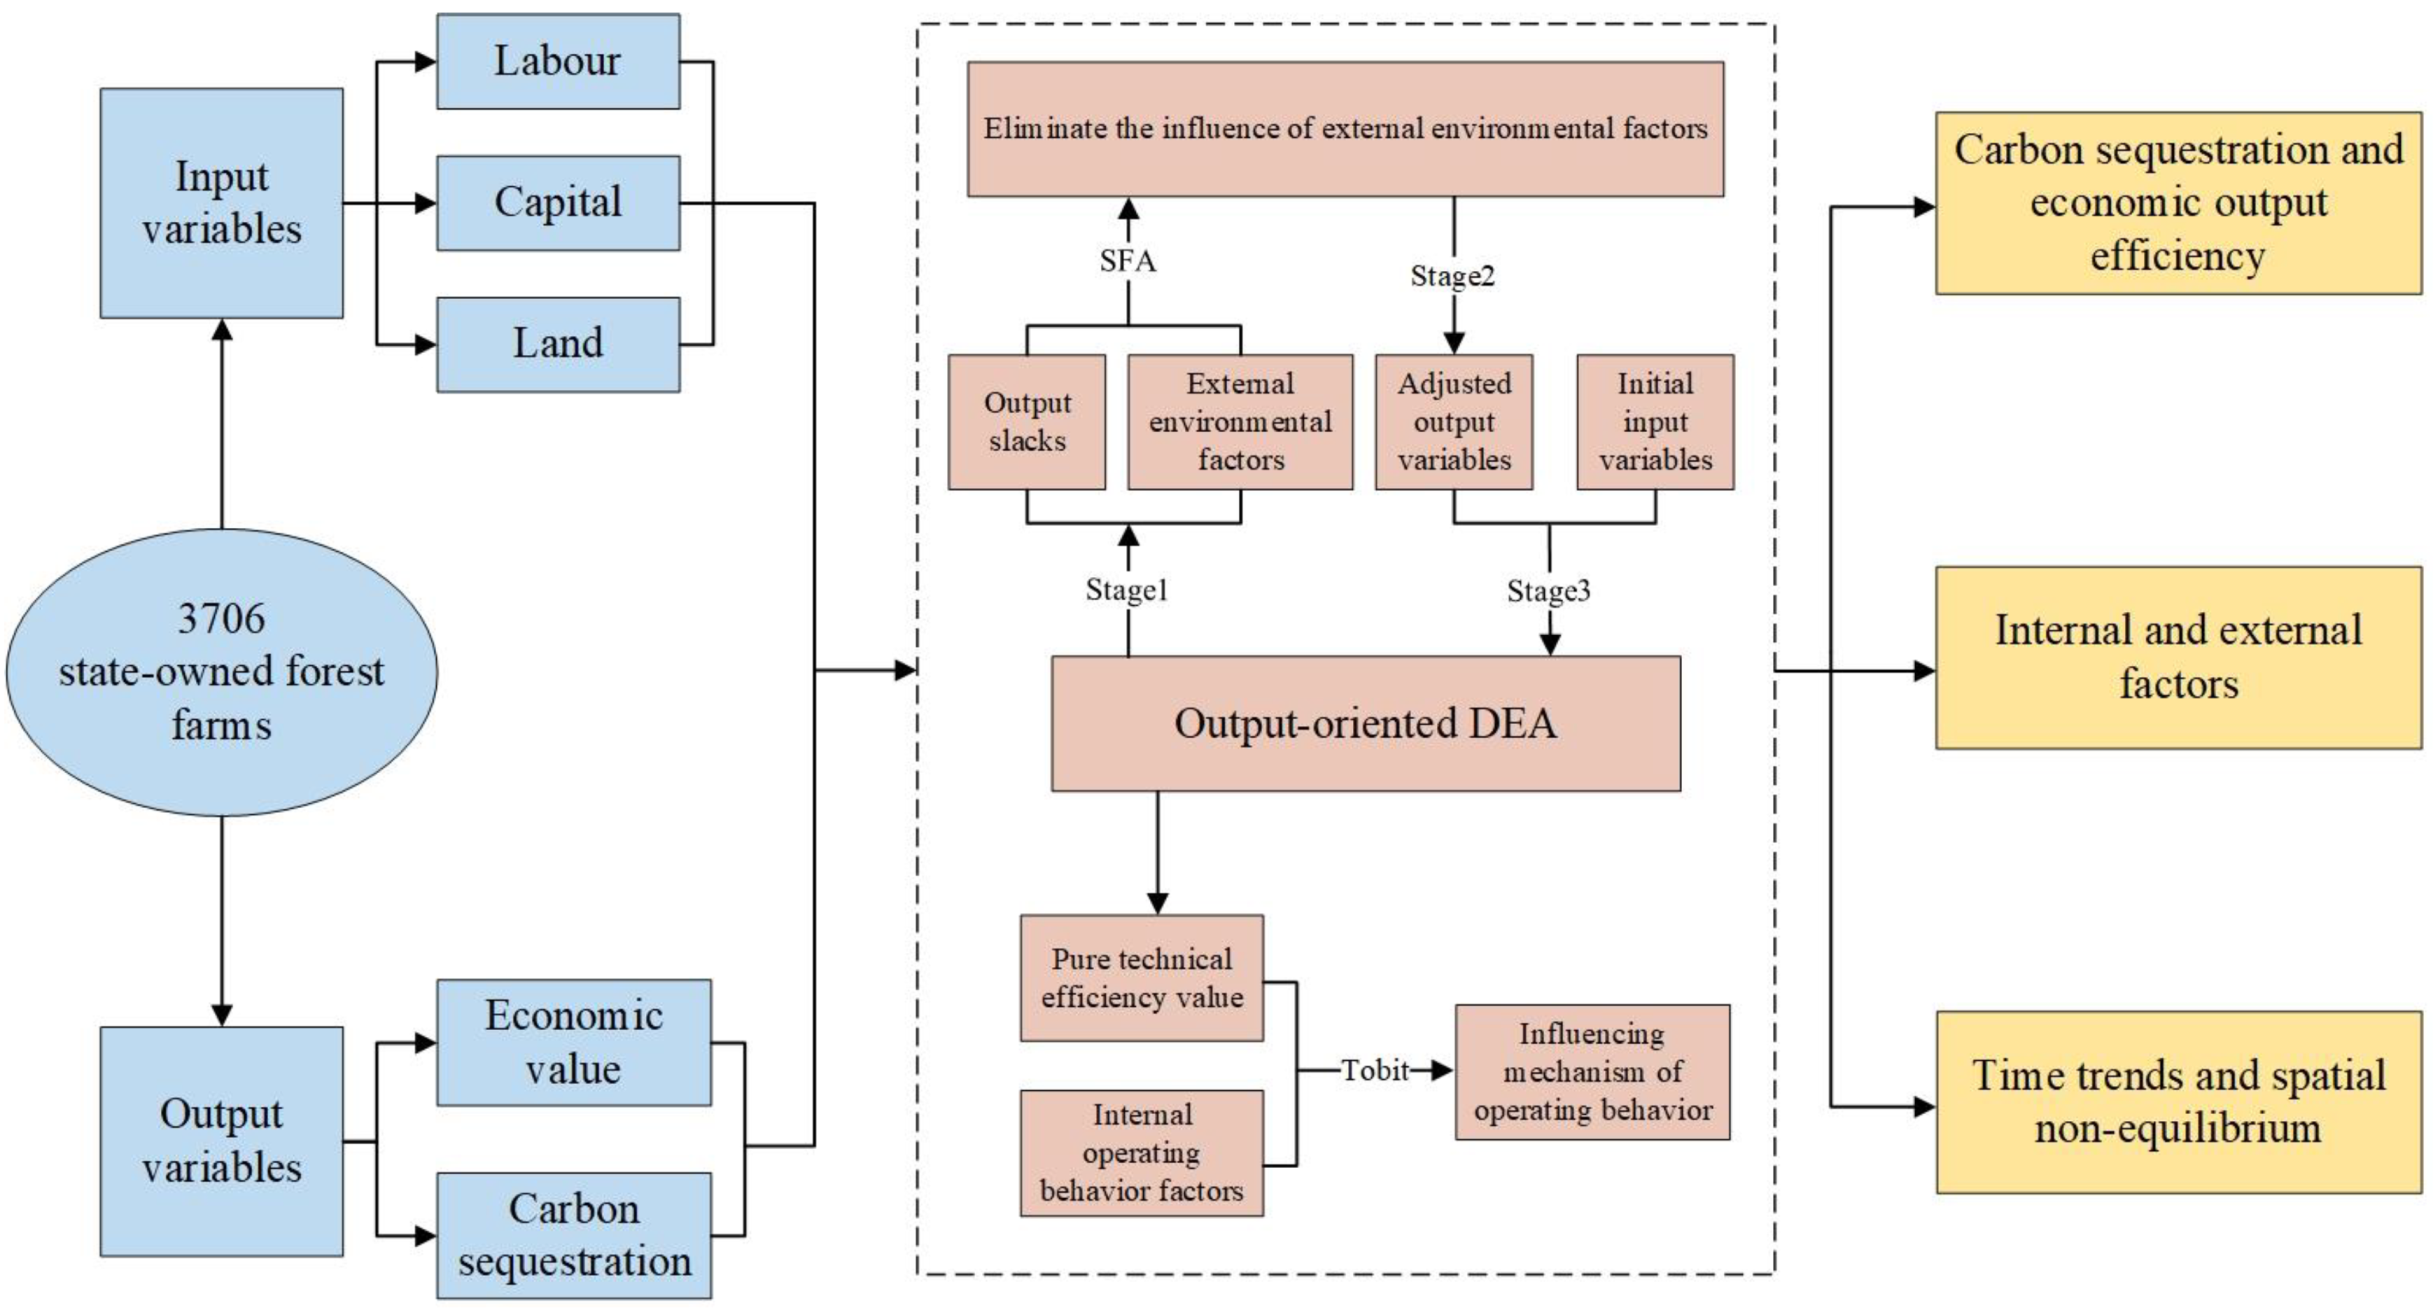
2.1.2. Three-Stage DEA Model
2.1.3. Panel Data Tobit Model
2.2. Variables and Data
2.2.1. Data Sources
2.2.2. Input and Output Variables
2.2.3. Environmental Variables
2.2.4. Operating Behaviors
3. Results
3.1. Carbon Storage
3.2. Output Efficiency of Carbon Sequestration and Economics
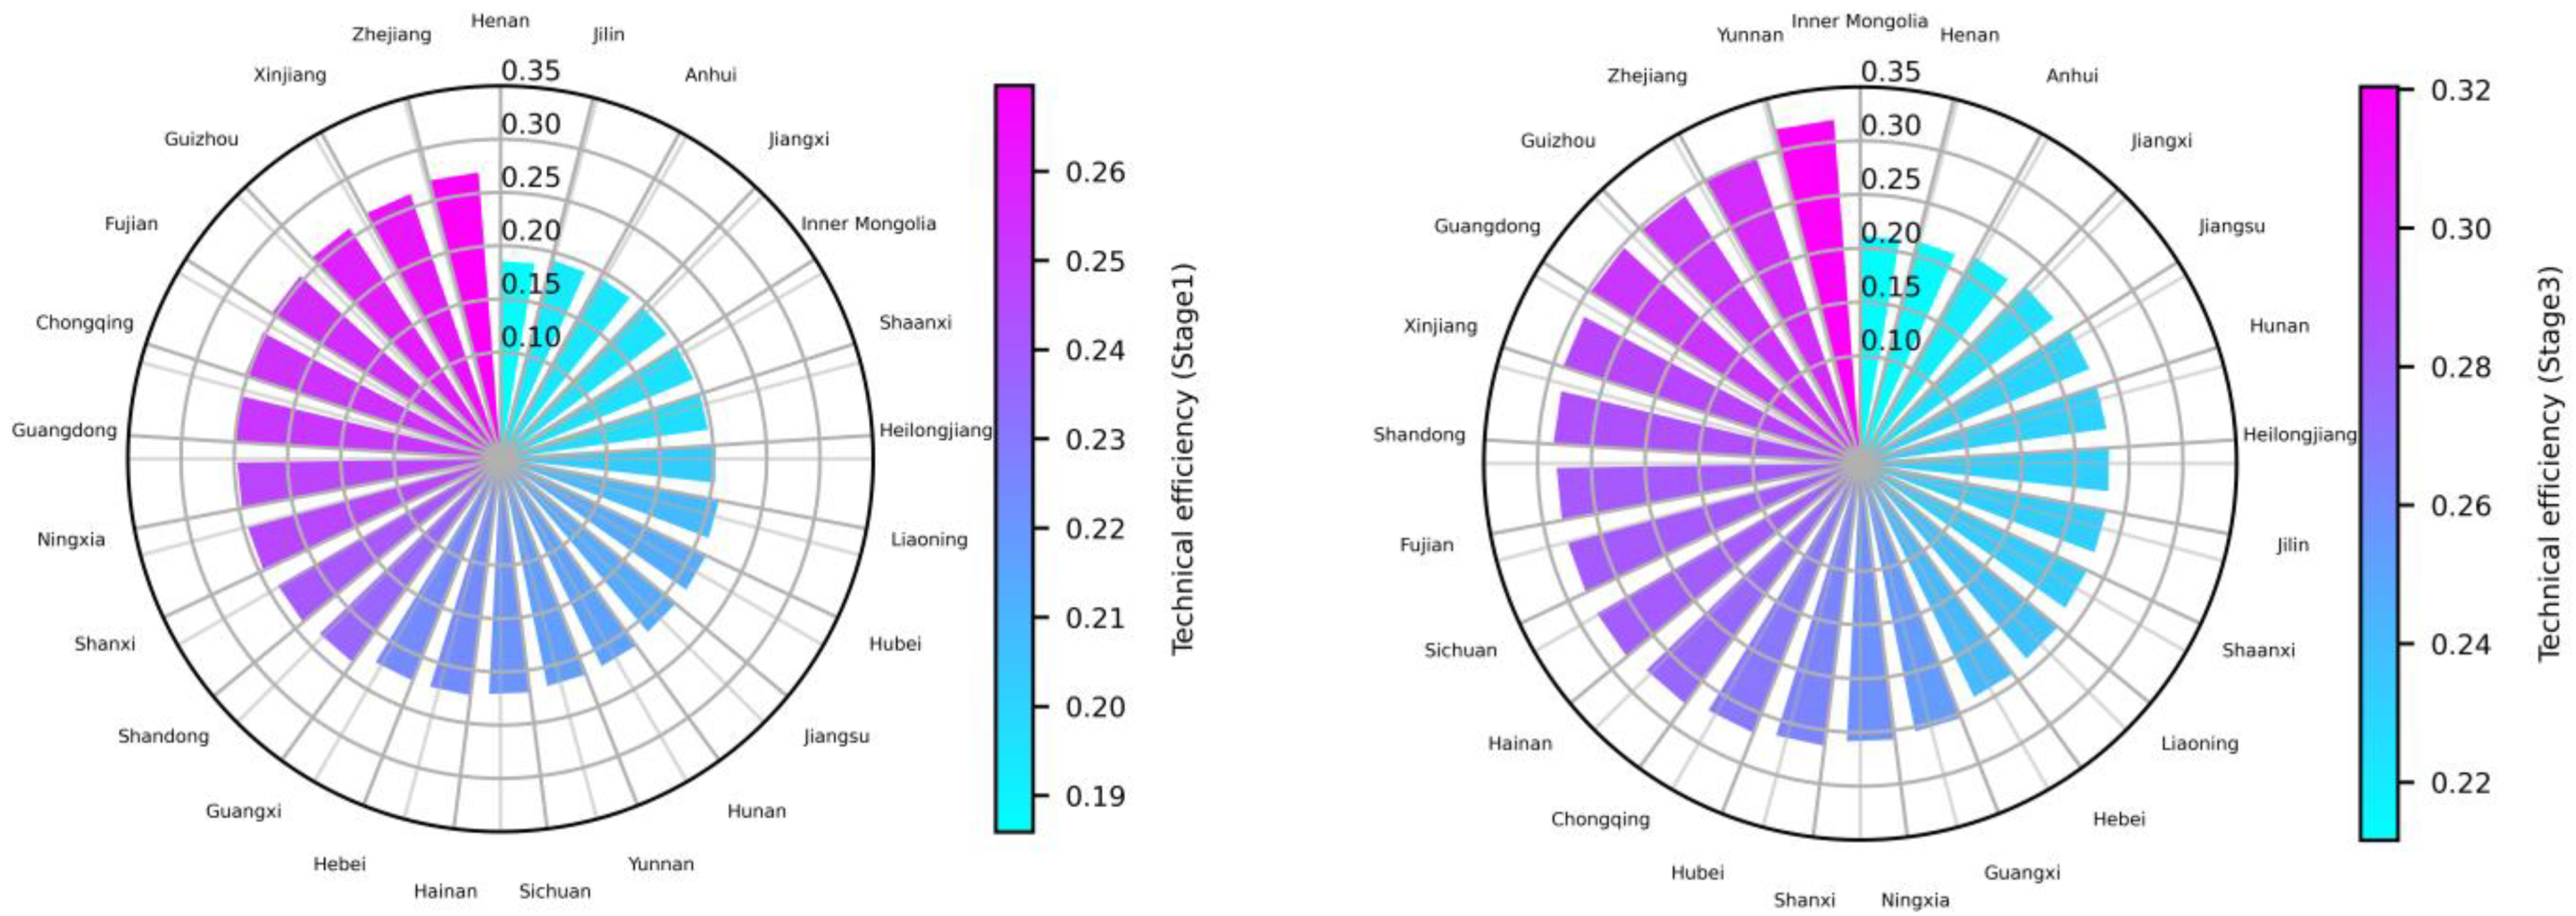
3.2.1. DEA in the First Stage
3.2.2. SFA in the Second Stage
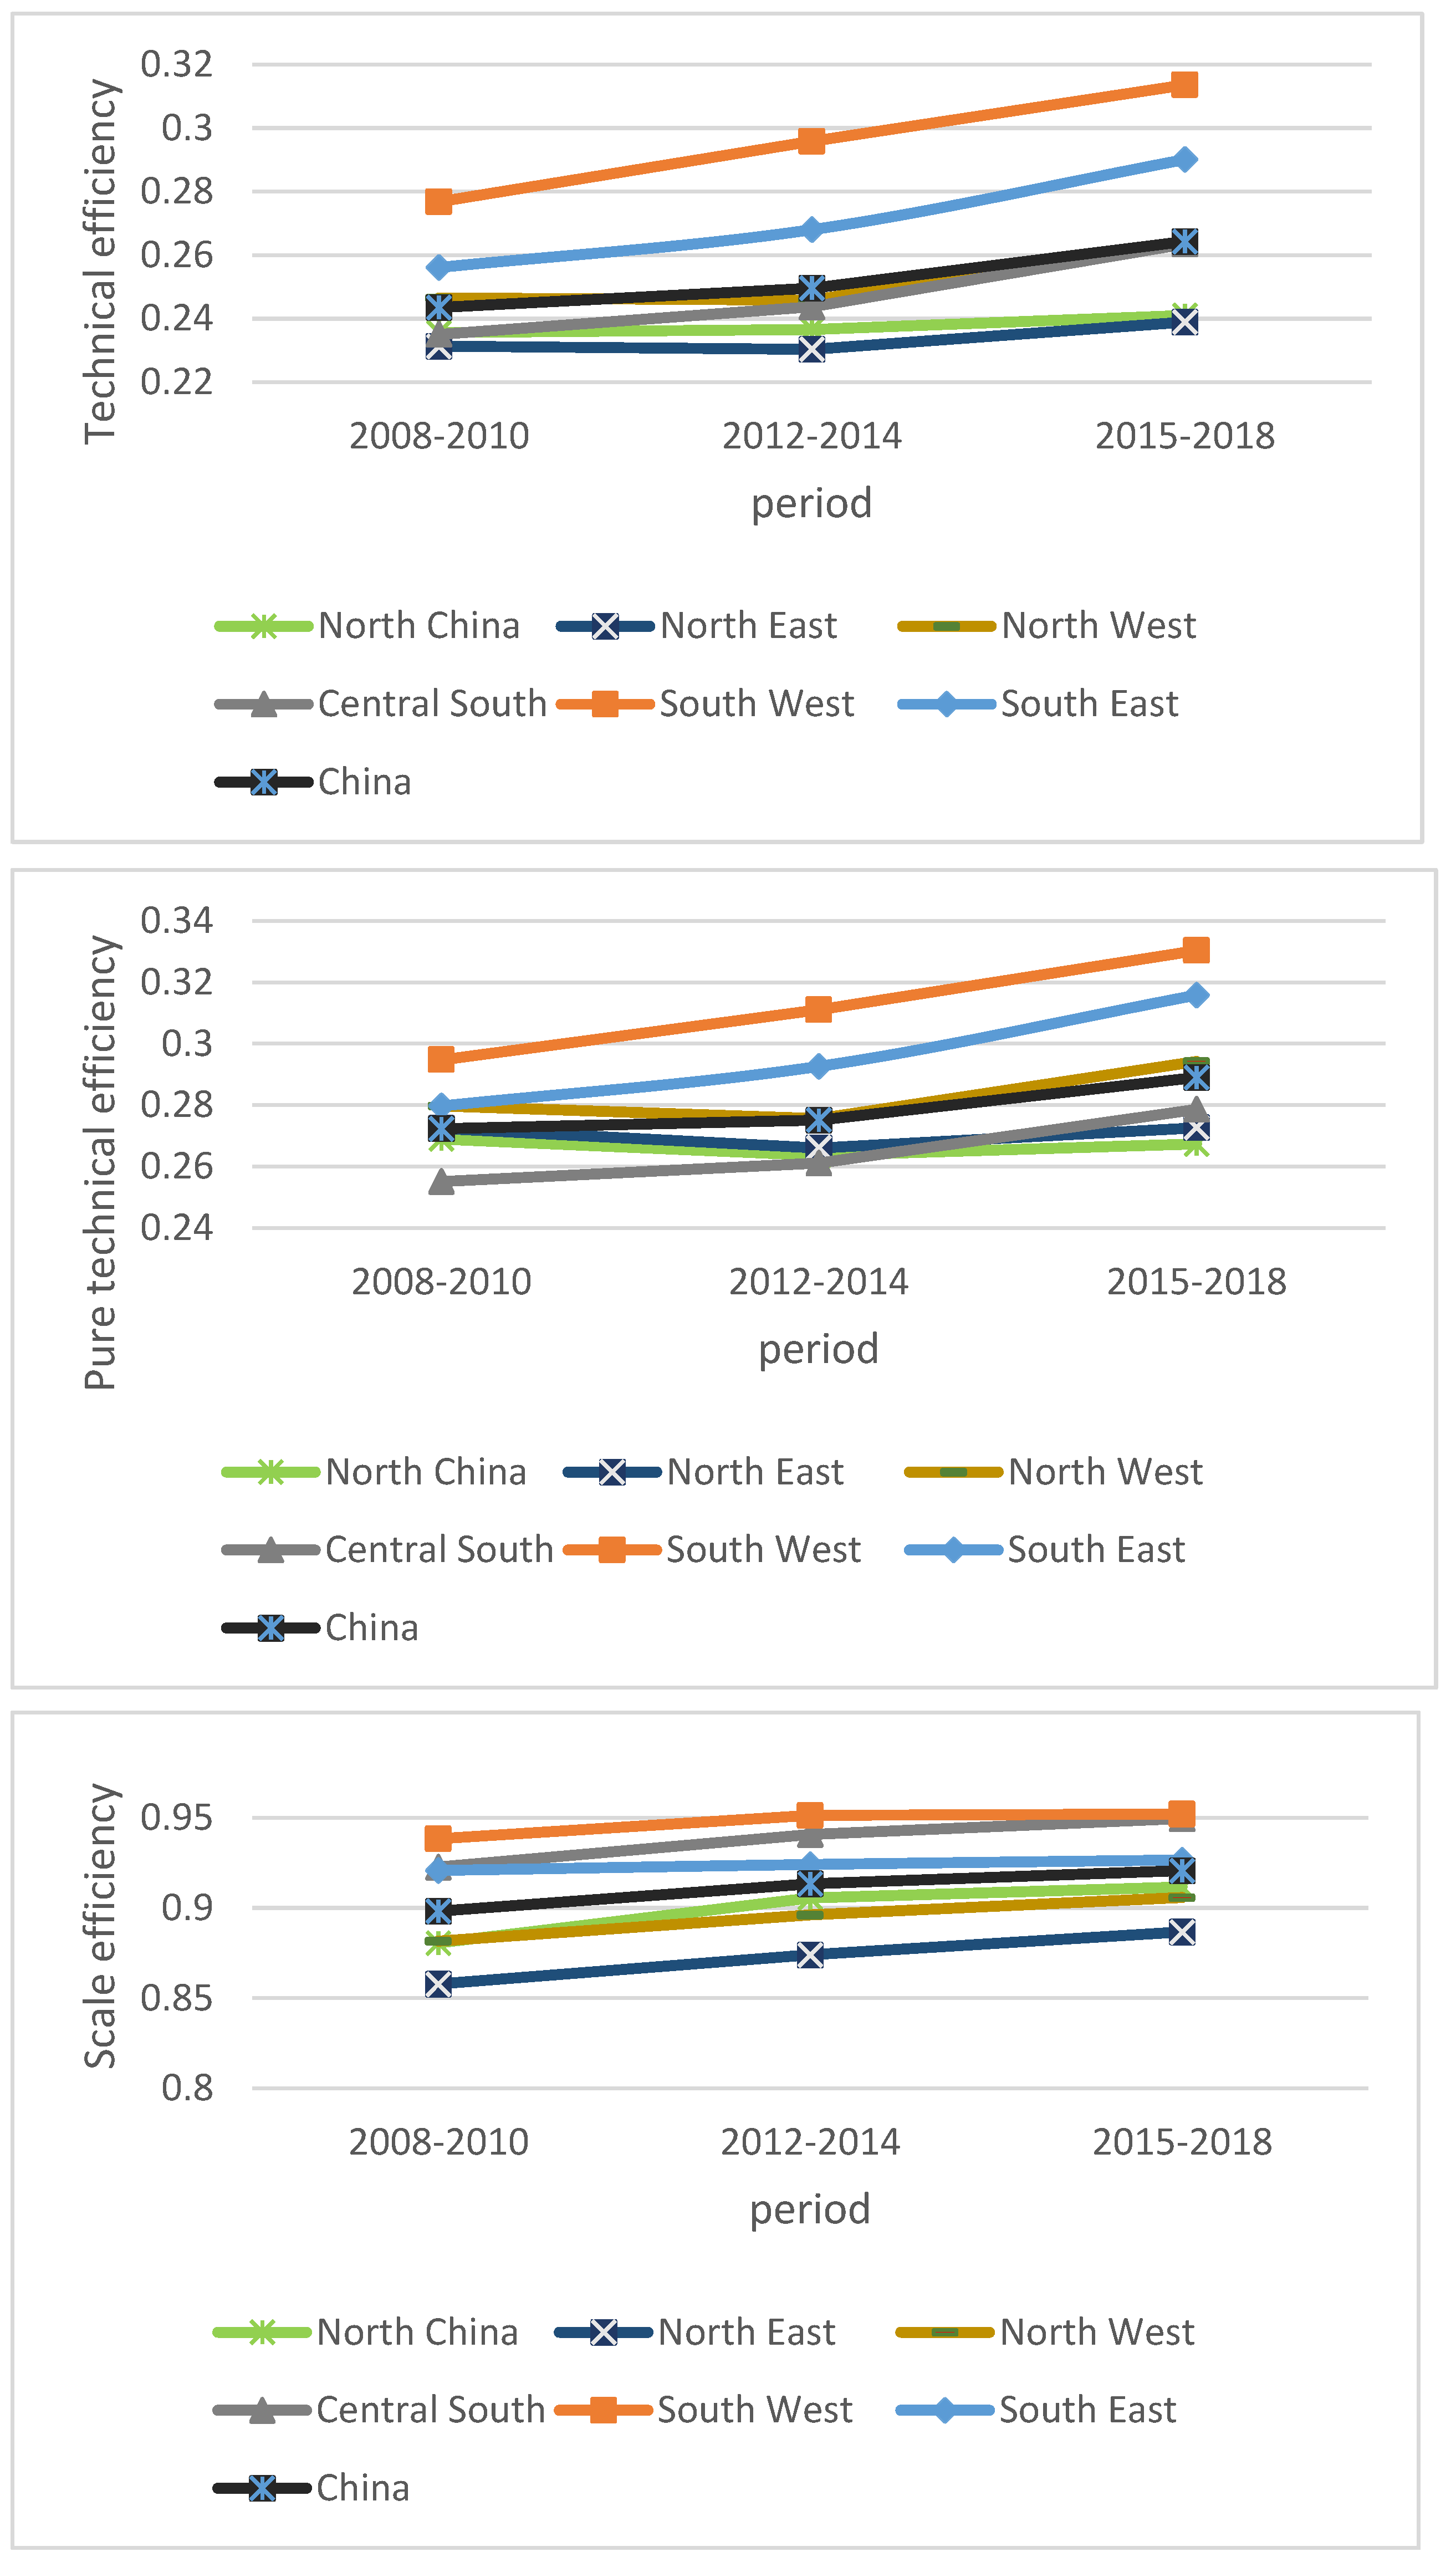
3.2.3. DEA in the Third Stage
3.3. Analysis of the Influencing Factors
4. Discussion
4.1. Temporal Trends and Spatial Nonequilibrium
4.2. External Environmental Impacts
- (1)
- Forest farm attributes. The affiliation coefficient has a 1% significant positive effect on the slack of carbon sequestration and income, and it can be seen that in comparison to the other state-owned forest farms, those under provincial management systems are more able to increase carbon sequestration and income output. At present, the management systems of state-owned forest farms in China are different. It leads to differences in funding sources, personnel allocation, and policy implementation for each forest farm. Yan et al. [52] pointed out that most state-owned forest farms are located in remote areas. If they are not under provincial management, then they are mostly subordinate to economically underdeveloped cities or counties. As a result, financial allocation, policy implementation, and infrastructure construction cannot be effectively guaranteed. Poverty has a significant negative impact of 1% on income slack. The fact that state-owned forest farms are located in poverty-stricken areas hinders these forest farms from expanding their economic benefits, especially after logging is stopped in forest areas, and forest farms in underdeveloped areas face issues related to traffic and industrial transformation. Slow management, a lack of motivation for development, and a sharp decline in forest farm incomes have also made a serious impact on forest farm workers in underdeveloped areas.
- (2)
- Labor factor. The aging of workers has a 1% significant negative impact on carbon sequestration slack and a 1% significant positive impact on income slack. The aging of forest farm workers results in forest farm labor shortages and increases the economic burden of social security. However, this factor has not been reflected in this study. Because the special fund for Natural Forest Protection Project and the financial fund for forest ecological benefits are also included in the definition of the total income of forest farms, and the issue of retired employees has been properly addressed [53]. Therefore, only the negative effect of aging workers on carbon sequestration output is considered in this study. The education level of on-the-job employees has a significant positive impact of 1% on carbon sequestration slack. Forestry professional has a strong ability to accept the new forestry industrial practices and implement policies [54], which is an important factor in promoting the transformation of the forestry industry [44]. The per capita annual income of on-the-job employees has a 5% significant negative impact on carbon sequestration slack and a 1% significant positive impact on income. Due to low forestry incomes, an appropriate income performance mechanism will promote the economic benefits of forest farms [55]. However, to a certain extent, it will also cause the ecological benefits of forest farms to be neglected.
- (3)
- Material resources. Infrastructure has a 10% significant positive effect on carbon sequestration slack and a 1% significant positive effect on income slack. The per capita factory floor area has a significant negative impact of 1% on carbon sequestration and income. After the implementation of the Natural Forest Protection Project, idle fixed assets and inadequate utilization of factory buildings appeared in state-owned forest farms mainly based on timber production and processing [56]. Therefore, the factory resources of many state-owned forest farms are in a redundant state.
4.3. Operating Behavior Impacts
5. Conclusions
Author Contributions
Funding
Institutional Review Board Statement
Informed Consent Statement
Data Availability Statement
Conflicts of Interest
References
- Dixon, R.K.; Solomon, A.; Brown, S.; Houghton, R.; Trexier, M.; Wisniewski, J. Carbon Pools and Flux of Global Forest Ecosystems. Science 1994, 263, 185. [Google Scholar] [CrossRef]
- Pingoud, K.; Ekholm, T.; Soimakallio, S.; Helin, T. Carbon balance indicator for forest bioenergy scenarios. Gcb Bioenergy 2016, 8, 171. [Google Scholar] [CrossRef] [Green Version]
- Makkonen, M.; Huttunen, S.; Primmer, E.; Repo, A.; Hildén, M. Policy coherence in climate change mitigation: An ecosystem service approach to forests as carbon sinks and bioenergy sources. For. Policy Econ. 2015, 50, 153. [Google Scholar] [CrossRef]
- Fang, J.; Wang, G.; Liu, G.; Xu, S. Forest biomass of China: An estimate based on the biomass–volume relationship. Ecol. Appl. 1998, 8, 1084. [Google Scholar] [CrossRef]
- Pan, Y.; Birdsey, R.A.; Fang, J.; Houghton, R.; Kauppi, P.E.; Kurz, W.A.; Phillips, O.L.; Shvidenko, A.; Lewis, S.L.; Canadell, J.G. A large and persistent carbon sink in the world’s forests. Science 2011, 333, 988. [Google Scholar] [CrossRef] [Green Version]
- State Forestry and Grassland Administration SFGA. China Forest Resources Report (2014–2018); China Forestry Publishing: Beijing, China, 2019; pp. 3–5. [Google Scholar]
- Zhao, X.; Ma, X.; Chen, B.; Shang, Y.; Song, M. Challenges toward carbon neutrality in China: Strategies and countermeasures. Resour. Conserv. Recycl. 2022, 176, 105959. [Google Scholar] [CrossRef]
- Lazaridou, D.C.; Michailidis, A.; Trigkas, M. Exploring environmental and economic costs and benefits of a forest-based circular economy: A literature review. Forests 2021, 12, 436. [Google Scholar] [CrossRef]
- Song, C.; Zhang, C.; Zhang, S.; Lin, H.; Kim, Y.; Ramakrishnan, M.; Du, Y.; Zhang, Y.; Zheng, H.; Barceló, D. Thermochemical liquefaction of agricultural and forestry wastes into biofuels and chemicals from circular economy perspectives. Sci. Total Environ. 2020, 749, 141972. [Google Scholar] [CrossRef]
- Stević, Ž.; Karamaşa, Ç.; Demir, E.; Korucuk, S. Assessing sustainable production under circular economy context using a novel rough-fuzzy MCDM model: A case of the forestry industry in the Eastern Black Sea region. J. Enterp. Inf. Manag. 2021; ahead-of-print. [Google Scholar] [CrossRef]
- Xu, D.; Wang, L.; Liu, J. Assessing the social performance of state-owned forest farms in China: Integrating forest social values and corporate social responsibility approaches. Scand. J. For. Res. 2017, 32, 338. [Google Scholar] [CrossRef]
- Brown, S.; Lugo, A.E. Biomass of tropical forests: A new estimate based on forest volumes. Science 1984, 223, 1290. [Google Scholar] [CrossRef]
- Fang, J.Y.; Oikawa, T.; Kato, T.; Mo, W.H.; Wang, Z.H. Biomass carbon accumulation by Japan’s forests from 1947 to 1995. Glob. Biogeochem. Cy. 2005, 19, 2253. [Google Scholar] [CrossRef]
- Fang, J.; Chen, A.; Peng, C.; Zhao, S.; Ci, L. Changes in forest biomass carbon storage in China between 1949 and 1998. Science 2001, 292, 2320. [Google Scholar] [CrossRef] [PubMed]
- Guo, Z.; Fang, J.; Pan, Y.; Birdsey, R. Inventory-based estimates of forest biomass carbon stocks in China: A comparison of three methods. For. Ecol. Manag. 2010, 259, 1225. [Google Scholar] [CrossRef]
- Qiu, Z.; Feng, Z.; Song, Y.; Li, M.; Zhang, P. Carbon sequestration potential of forest vegetation in China from 2003 to 2050: Predicting forest vegetation growth based on climate and the environment. J. Clean. Prod. 2020, 252, 119715. [Google Scholar] [CrossRef]
- Zhou, X.; Lei, X.; Liu, C.; Huang, H.; Zhou, C.; Peng, C. Re-estimating the changes and ranges of forest biomass carbon in China during the past 40 years. For. Ecosyst. 2019, 6, 51. [Google Scholar] [CrossRef] [Green Version]
- Zeng, W.; Sun, X.; Wang, L.; Wang, W.; Pu, Y. Developing stand volume, biomass and carbon stock models for ten major forest types in forest region of northeastern China. J. Beijing For. Univ. 2021, 43, 1–8. [Google Scholar] [CrossRef]
- Jagodziński, A.M.; Dyderski, M.K.; Gęsikiewicz, K.; Horodecki, P. Tree and stand level estimations of Abies alba Mill. aboveground biomass. Ann For. Sci 2019, 76, 56. [Google Scholar] [CrossRef] [Green Version]
- Zhang, Y.; Wang, X. Study on forest volume-to-biomass modeling and carbon storage dynamics in China. Sci. Sin. Vitae 2021, 51, 199. [Google Scholar] [CrossRef]
- Xue, L.; Luo, X.; Li, R.; Yu, W. Regional differences and dynamic evolution analysis of forest carbon sinks in China. J. China Agr. Univ. 2018, 23, 197–206. [Google Scholar]
- Yin, S.; Gong, Z.; Gu, L.; Deng, Y.; Niu, Y. Driving forces of the efficiency of forest carbon sequestration production: Spatial panel data from the national forest inventory in China. J. Clean. Prod. 2022, 330, 129776. [Google Scholar] [CrossRef]
- Lin, B.; Ge, J. Carbon sinks and output of China’s forestry sector: An ecological economic development perspective. Sci. Total Environ. 2019, 655, 1169. [Google Scholar] [CrossRef] [PubMed]
- Ao, G.; Wu, W.; Cao, X.; Liu, Q. Analysis on production efficiency of carbon sink bamboo forest based on three-stage DEA model: Evidence from Zhejiang Anji. J. Agr. For. Eco. Manag. 2019, 18, 656–666. [Google Scholar]
- Näyhä, A. Transition in the Finnish forest-based sector: Company perspectives on the bioeconomy, circular economy and sustainability. J. Clean. Prod. 2019, 209, 1294. [Google Scholar] [CrossRef]
- Tong, X.; Brandt, M.; Yue, Y.; Ciais, P.; Rudbeck Jepsen, M.; Penuelas, J.; Wigneron, J.-P.; Xiao, X.; Song, X.-P.; Horion, S. Forest management in southern China generates short term extensive carbon sequestration. Nat. Commun. 2020, 11, 129. [Google Scholar] [CrossRef] [PubMed]
- Koponen, K.; Soimakallio, S.; Kline, K.L.; Cowie, A.; Brandão, M. Quantifying the climate effects of bioenergy—Choice of reference system. Renew. Sust. Energ. Rev. 2018, 81, 2271. [Google Scholar] [CrossRef]
- Ni, Y.; Eskeland, G.S.; Giske, J.; Hansen, J.-P. The global potential for carbon capture and storage from forestry. Carbon Balance Manag. 2016, 11, 1172. [Google Scholar] [CrossRef] [PubMed] [Green Version]
- Koster, R.; Fuchs, J.M. Opportunity costs of growing space—An essential driver of economical single-tree harvest decisions. For. Policy Econ. 2022, 135, 102668. [Google Scholar] [CrossRef]
- Gu, L.; Wu, W.; Ji, W.; Zhou, M.; Xu, L.; Zhu, W. Evaluating the performance of bamboo forests managed for carbon sequestration and other co-benefits in Suichang and Anji, China. For. Policy Econ. 2019, 106, 101947. [Google Scholar] [CrossRef]
- Fried, H.O.; Lovell, C.K.; Schmidt, S.S.; Yaisawarng, S. Accounting for environmental effects and statistical noise in data envelopment analysis. J. prod. Ana. 2002, 17, 157. [Google Scholar] [CrossRef]
- Liu, Z.; Zhang, X.; Yang, D. Research on efficiency change of chinese government health investment:based on panel three stage DEA mode. J. Cent. Univ. Financ. Econ. 2014, 6, 97–104. [Google Scholar]
- Banker, R.D.; Charnes, A.; Cooper, W.W. Some models for estimating technical and scale inefficiencies in data envelopment analysis. Manag. Sci. 1984, 30, 1078. [Google Scholar] [CrossRef] [Green Version]
- Tobin, J. Estimation of relationships for limited dependent variables. Econom. J. Eco. Soc. 1958, 26, 24–36. [Google Scholar] [CrossRef] [Green Version]
- Młynarski, W.; Prędki, A.; Kaliszewski, A. Efficiency and factors influencing it in forest districts in southern Poland: Application of data envelopment analysis. For. Policy Econ. 2021, 130, 102530. [Google Scholar] [CrossRef]
- Shuai, S.; Fan, Z. Modeling the role of environmental regulations in regional green economy efficiency of China: Empirical evidence from super efficiency DEA-Tobit model. J. Environ. Manag. 2020, 261, 110227. [Google Scholar] [CrossRef]
- Zhang, M.; Li, L.; Cheng, Z. Research on carbon emission efficiency in the Chinese construction industry based on a three-stage DEA-Tobit model. Environ. Sci. Pollut. Res. 2021, 28, 51120. [Google Scholar] [CrossRef]
- Farrell, M.J. The measurement of productive efficiency. J. R. Stat. Soc. Ser. 1957, 120, 253. [Google Scholar] [CrossRef]
- Mustalahti, I. The responsive bioeconomy: The need for inclusion of citizens and environmental capability in the forest based bioeconomy. J. Clean. Prod. 2018, 172, 3781. [Google Scholar] [CrossRef]
- Penman, J.; Kruger, D.; Galbally, I.; Hiraishi, T.; Nyenzi, B.; Emmanuel, S.; Buendia, L.; Hoppaus, R.; Martinsen, T.; Meijer, J. Good Practice Guidance And Uncertainty Management In National Greenhouse Gas Inventories; Intergovernmental Panel on Climate Change: Kanagawa, Japan, 2000. [Google Scholar]
- Tian, M.; Wang, Z.; Li, H. The system reform of state-owned forest farms in China. J. Beijing For. Univ. 2018, 7, 54–59. [Google Scholar]
- Ross, M.L. The political economy of the resource curse. World Politics 1999, 51, 297. [Google Scholar] [CrossRef]
- Ke, S.; Wang, B.; Zhu, L.; Tang, Z. Industrial transformation in state-owned forest region: Dilemmas and paths. World For. Res. 2018, 31, 44–50. [Google Scholar] [CrossRef]
- Bai, J.; Tan, P.; Chen, W.; Liu, J. Evaluation of self-development ability and study of its obstacle factors for state—Owned forest farms: Applying the SEM–PPM. Sustainability 2021, 13, 3119. [Google Scholar] [CrossRef]
- Jia, B.; Guo, W.; He, J.; Sun, M.; Chai, L.; Liu, J.; Wang, X. Topography, diversity, and forest structure attributes drive aboveground carbon storage in different forest types in Northeast China. Forests 2022, 13, 455. [Google Scholar] [CrossRef]
- Chen, J.; Yang, H. Advances and frontiers in global forest and harvested wood products carbon science. J. Nanjing For. Univ. 2018, 61, 1. [Google Scholar]
- Chen, B.; Nakama, Y. Thirty years of forest tourism in China. J. For. Res. 2017, 18, 285–292. [Google Scholar] [CrossRef]
- Chen, R.; Chen, W.; Hu, M.; Huang, W. Measuring improvement of economic condition in state-owned forest farms’ in China. Sustainability 2020, 12, 1593. [Google Scholar] [CrossRef] [Green Version]
- Han, X.; Frey, G.E.; Geng, Y.; Cubbage, F.W.; Zhang, Z. Reform and efficiency of state-owned forest enterprises in Northeast China as “social firms”. J. For. Eco. 2018, 32, 18. [Google Scholar] [CrossRef]
- Liu, S.; Ding, Z.; Lin, Y.; Yao, S. The efficiency of forest management investment in key state-owned forest regions under the carbon neutral target: A case study of Heilongjiang Province, China. Forests 2022, 13, 609. [Google Scholar] [CrossRef]
- Yin, Z.; Lu, C.; Liu, Q. Research on carbon sink potential of forest regionin the northeast and Inner Mongolia based on the perspective of carbon trade. Guangdong Soc. Sci. 2014, 41, 194. [Google Scholar]
- Yan, Q.; Tian, M.; He, C.; Chen, W.; Wu, C.; Yuan, C. Suggestion on reform about the operation and management system of state forest farms in China. For. Eco. 2014, 36, 11. [Google Scholar]
- Wei, Y.; Yu, D.; Lewis, B.J.; Zhou, L.; Zhou, W.; Fang, X.; Zhao, W.; Wu, S.; Dai, L. Forest carbon storage and tree carbon pool dynamics under natural forest protection program in northeastern China. Chin. Geogr. Sci. 2014, 24, 397. [Google Scholar] [CrossRef]
- Larson, A.M.; Ribot, J.C. The poverty of forestry policy: Double standards on an uneven playing field. Sustain. Sci. 2007, 2, 189–204. [Google Scholar] [CrossRef]
- Peterson, R.S.; Smith, D.B.; Martorana, P.V.; Owens, P.D. The impact of chief executive officer personality on top management team dynamics: One mechanism by which leadership affects organizational performance. J. Appl. Psychol. 2003, 88, 795. [Google Scholar] [CrossRef] [Green Version]
- Wu, S.; Li, J.; Zhou, W.; Lewis, B.J.; Yu, D.; Zhou, L.; Jiang, L.; Dai, L. A statistical analysis of spatiotemporal variations and determinant factors of forest carbon storage under China’s Natural Forest Protection Program. J. For. Res. 2017, 29, 415–424. [Google Scholar] [CrossRef]
- Chen, Z.; Yu, G.; Wang, Q. Magnitude, pattern and controls of carbon flux and carbon use efficiency in China’s typical forests. Glob. Planet. Change 2019, 172, 464. [Google Scholar] [CrossRef]
- Thomas, J.; Brunette, M.; Leblois, A. The determinants of adapting forest management practices to climate change: Lessons from a survey of French private forest owners. For. Policy Econ. 2022, 135, 102662. [Google Scholar] [CrossRef]
- González-González, J.M.; Vázquez-Méndez, M.E.; Diéguez-Aranda, U. Multi-objective models for the forest harvest scheduling problem in a continuous-time framework. For. Policy Econ. 2022, 136, 102687. [Google Scholar] [CrossRef]
- Lin, B.; Ge, J. To harvest or not to harvest? Forest management as a trade-off between bioenergy production and carbon sink. J. Clean. Prod. 2020, 268, 122219. [Google Scholar] [CrossRef]
- Hou, F.; Wu, J.; Li, H.; Yang, Y.; Luo, X.; Shen, Y. Analysis on the development of Chinese under-forest economy and its effect on the increase of farmers’ income. J. Discret. Math. Sci. C. 2017, 20, 1263. [Google Scholar] [CrossRef]
- Hall, C.M.; Scott, D.; Gössling, S. Forests, climate change and tourism. J. Herit. Tour. 2011, 6, 353. [Google Scholar] [CrossRef]


| First-Level Indicator | Second-Level Indicator | Variables and Their Descriptions | Mean | S.D. |
|---|---|---|---|---|
| Forest farm attributes | Aff (Affiliation) | County = 1; Municipal = 2; Provincial = 3 | 1.18 | 0.44 |
| Pov (Poverty) | Yes = 1; No = 0 | 0.32 | 0.47 | |
| Labor factors | Edu (Education) | The proportion of the total number of employees with a college degree or above (%) | 22.69% | 0.16 |
| Agi (Aging) | The proportion of retired workers to total workers (%) | 39.13% | 0.19 | |
| Inc (Income) | Per capita annual income of in-service employees (104 yuan) | 3.01 | 1.86 | |
| Material resources | Inf (Infrastructure) | Access to electricity, internet, telephone, and sufficient water, completed four = 4; three = 3; two = 2; one = 1; none = 0 | 3.03 | 0.89 |
| Fac (Factory) | Per capita factory buildings area (m2/person) | 60.48 | 131.28 |
| Region | Provincial Unit | Number of Forest Farms (Pieces) | 2008–2010 | 2012–2014 | 2015–2018 | |||
|---|---|---|---|---|---|---|---|---|
| Carbon Storage (106t) | Carbon Density (t/ha) | Carbon Storage (106t) | Carbon Density (t/ha) | Carbon Storage (106t) | Carbon Density (t/ha) | |||
| North China | Inner Mongolia | 262 | 131.63 | 28.51 | 145.26 | 30.87 | 151.55 | 31.65 |
| Shanxi | 243 | 33.53 | 23.02 | 34.75 | 23.63 | 35.49 | 23.76 | |
| Hebei | 82 | 7.18 | 19.89 | 8.19 | 21.91 | 9.18 | 23.15 | |
| total | 587 | 172.33 | 26.78 | 188.19 | 28.74 | 196.21 | 29.38 | |
| North East | Jilin | 327 | 120.91 | 43.16 | 125.73 | 47.33 | 129.77 | 48.95 |
| Liaoning | 177 | 21.85 | 34.39 | 23.64 | 35.58 | 23.77 | 36.18 | |
| Heilongjiang | 424 | 180.96 | 35.15 | 188.89 | 35.87 | 198.06 | 37.71 | |
| total | 928 | 323.72 | 37.71 | 338.25 | 39.40 | 351.61 | 41.07 | |
| North West | Ningxia | 66 | 2.31 | 20.22 | 2.18 | 17.37 | 2.05 | 18.97 |
| Xinjiang | 58 | 70.25 | 55.17 | 69.29 | 56.03 | 77.97 | 66.03 | |
| Shaanxi | 142 | 48.40 | 30.52 | 48.97 | 30.55 | 49.41 | 29.86 | |
| total | 266 | 120.96 | 40.68 | 120.45 | 40.62 | 129.43 | 43.97 | |
| Central South | Anhui | 132 | 7.66 | 34.52 | 7.65 | 33.43 | 7.82 | 33.89 |
| Shandong | 140 | 3.72 | 31.18 | 4.07 | 32.66 | 4.17 | 33.48 | |
| Jiangsu | 31 | 1.07 | 20.98 | 1.81 | 30.30 | 1.01 | 26.38 | |
| Henan | 92 | 11.59 | 33.58 | 12.29 | 34.64 | 12.24 | 34.71 | |
| Hubei | 235 | 19.75 | 33.27 | 21.80 | 36.50 | 24.16 | 40.58 | |
| Hunan | 201 | 25.84 | 28.92 | 25.83 | 29.93 | 24.21 | 30.69 | |
| total | 831 | 69.63 | 31.30 | 73.44 | 32.96 | 73.61 | 34.55 | |
| South West | Yunnan | 110 | 48.86 | 51.72 | 48.89 | 51.44 | 49.46 | 51.65 |
| Sichuan | 123 | 35.85 | 44.08 | 35.72 | 44.23 | 38.14 | 44.61 | |
| Guizhou | 108 | 7.74 | 31.90 | 9.06 | 34.39 | 11.14 | 43.16 | |
| Chongqing | 69 | 7.76 | 29.62 | 9.01 | 31.90 | 10.99 | 30.97 | |
| total | 410 | 100.21 | 44.29 | 102.67 | 44.57 | 109.72 | 45.24 | |
| South East | Guangdong | 188 | 17.62 | 29.90 | 20.62 | 33.18 | 21.64 | 33.16 |
| Guangxi | 144 | 26.15 | 31.53 | 29.17 | 36.44 | 33.34 | 37.83 | |
| Jiangxi | 140 | 23.87 | 30.50 | 27.75 | 29.10 | 29.36 | 30.20 | |
| Zhejiang | 87 | 6.86 | 37.31 | 7.86 | 36.46 | 8.75 | 38.75 | |
| Hainan | 19 | 12.29 | 60.39 | 14.97 | 58.93 | 14.76 | 57.45 | |
| Fujian | 106 | 14.68 | 42.83 | 16.07 | 44.64 | 17.20 | 45.57 | |
| total | 684 | 101.46 | 34.61 | 116.44 | 36.33 | 125.04 | 37.15 | |
| Total | China | 3706 | 888.32 | 34.96 | 939.44 | 36.36 | 985.63 | 37.76 |
| Environment Variables | Carbon Sequestration Slack Variable | Income Slack Variable | |||
|---|---|---|---|---|---|
| Coefficient | S.D. | Coefficient | S.D. | ||
| Constant | 7.3338 *** | 0.1781 | 7.6280 *** | 0.1661 | |
| Forest farm attributes | Aff | 0.1802 *** | 0.0397 | 0.4622 *** | 0.0330 |
| Pov | 0.0229 | 0.0318 | −0.0576 ** | 0.0276 | |
| Labor factors | Agi | −0.2483 *** | 0.0757 | 0.2264 *** | 0.0683 |
| Edu | 0.4032 *** | 0.0840 | −0.0765 | 0.0793 | |
| LnInc | −0.0325 ** | 0.0154 | 0.3114 *** | 0.0152 | |
| Material resources | Inf | 0.0250 * | 0.0127 | 0.0881 *** | 0.0120 |
| Lnfac | −0.0490 *** | 0.0083 | −0.0329 *** | 0.0079 | |
| 2.8616 | 0.0695 | 1.7704 | 0.1370 | ||
| 0.8463 *** | 0.0044 | 0.7347 *** | 0.0187 | ||
| −16,455.693 | −15152.534 | ||||
| Region | Provincial Unit | 2008–2010 | 2012–2014 | 2015–2018 | ||||||
|---|---|---|---|---|---|---|---|---|---|---|
| TE | PTE | SE | TE | PTE | SE | TE | PTE | SE | ||
| North China | Hebei | 0.2413 | 0.2644 | 0.9053 | 0.2576 | 0.2747 | 0.9345 | 0.2256 | 0.2373 | 0.9483 |
| Inner Mongolia | 0.2065 | 0.2491 | 0.8483 | 0.2139 | 0.2530 | 0.8672 | 0.2145 | 0.2548 | 0.8672 | |
| Shanxi | 0.2651 | 0.2918 | 0.9070 | 0.2540 | 0.2713 | 0.9372 | 0.2748 | 0.2908 | 0.9472 | |
| mean | 0.2356 | 0.2689 | 0.8806 | 0.2366 | 0.2636 | 0.9056 | 0.2410 | 0.2673 | 0.9116 | |
| North East | Heilongjiang | 0.2279 | 0.2730 | 0.8403 | 0.2249 | 0.2645 | 0.8550 | 0.2429 | 0.2773 | 0.8803 |
| Jilin | 0.2364 | 0.2829 | 0.8495 | 0.2359 | 0.2776 | 0.8639 | 0.2266 | 0.2690 | 0.8637 | |
| Liaoning | 0.2302 | 0.2517 | 0.9151 | 0.2330 | 0.2485 | 0.9382 | 0.2519 | 0.2679 | 0.9446 | |
| mean | 0.2313 | 0.2724 | 0.8578 | 0.2303 | 0.2660 | 0.8740 | 0.2389 | 0.2726 | 0.8867 | |
| North West | Ningxia | 0.2405 | 0.2617 | 0.9182 | 0.2582 | 0.2770 | 0.9332 | 0.2770 | 0.2967 | 0.9369 |
| Shaanxi | 0.2321 | 0.2692 | 0.8612 | 0.2321 | 0.2662 | 0.8783 | 0.2356 | 0.2652 | 0.8949 | |
| Xinjiang | 0.2884 | 0.3257 | 0.8898 | 0.2651 | 0.2973 | 0.8974 | 0.3183 | 0.3623 | 0.8971 | |
| mean | 0.2465 | 0.2797 | 0.8816 | 0.2458 | 0.2756 | 0.8961 | 0.2639 | 0.2942 | 0.9058 | |
| Central South | Anhui | 0.2169 | 0.2285 | 0.9527 | 0.2186 | 0.2278 | 0.9625 | 0.2233 | 0.2315 | 0.9664 |
| Henan | 0.1997 | 0.2257 | 0.8855 | 0.2241 | 0.2491 | 0.9032 | 0.2168 | 0.2383 | 0.9129 | |
| Hubei | 0.2589 | 0.2807 | 0.9249 | 0.2549 | 0.2739 | 0.9422 | 0.2946 | 0.3131 | 0.9487 | |
| Hunan | 0.2120 | 0.2399 | 0.8837 | 0.2281 | 0.2479 | 0.9218 | 0.2537 | 0.2699 | 0.9407 | |
| Jiangsu | 0.2225 | 0.2335 | 0.9490 | 0.2381 | 0.2527 | 0.9485 | 0.2316 | 0.2393 | 0.9690 | |
| Shandong | 0.2713 | 0.2835 | 0.9655 | 0.2854 | 0.2995 | 0.9682 | 0.3012 | 0.3130 | 0.9679 | |
| mean | 0.2350 | 0.2551 | 0.9227 | 0.2437 | 0.2611 | 0.9408 | 0.2635 | 0.2786 | 0.9496 | |
| South West | Guizhou | 0.2675 | 0.2805 | 0.9525 | 0.3045 | 0.3171 | 0.9619 | 0.3206 | 0.3358 | 0.9540 |
| Sichuan | 0.2771 | 0.2963 | 0.9392 | 0.2769 | 0.2951 | 0.9446 | 0.2914 | 0.3061 | 0.9603 | |
| Yunnan | 0.3118 | 0.3340 | 0.9254 | 0.3173 | 0.3349 | 0.9390 | 0.3321 | 0.3548 | 0.9359 | |
| Chongqing | 0.2352 | 0.2516 | 0.9356 | 0.2817 | 0.2918 | 0.9662 | 0.3127 | 0.3257 | 0.9607 | |
| mean | 0.2768 | 0.2947 | 0.9384 | 0.2958 | 0.3110 | 0.9513 | 0.3136 | 0.3303 | 0.9521 | |
| South East | Fujian | 0.2849 | 0.2962 | 0.9626 | 0.2793 | 0.2994 | 0.9301 | 0.2831 | 0.3049 | 0.9262 |
| Guangdong | 0.2624 | 0.2827 | 0.9369 | 0.2846 | 0.3051 | 0.9438 | 0.3453 | 0.3681 | 0.9485 | |
| Guangxi | 0.2359 | 0.2660 | 0.8974 | 0.2637 | 0.2933 | 0.9159 | 0.2637 | 0.2938 | 0.9165 | |
| Hainan | 0.2782 | 0.3553 | 0.8522 | 0.2915 | 0.3775 | 0.8439 | 0.2754 | 0.3491 | 0.8585 | |
| Jiangxi | 0.2228 | 0.2529 | 0.8762 | 0.2181 | 0.2453 | 0.8914 | 0.2342 | 0.2619 | 0.9001 | |
| Zhejiang | 0.2893 | 0.3026 | 0.9602 | 0.3007 | 0.3141 | 0.9576 | 0.3163 | 0.3321 | 0.9541 | |
| mean | 0.2561 | 0.2797 | 0.9208 | 0.2680 | 0.2926 | 0.9241 | 0.2901 | 0.3158 | 0.9266 | |
| China | mean | 0.2435 | 0.2723 | 0.8982 | 0.2496 | 0.2751 | 0.9134 | 0.2643 | 0.289 | 0.9207 |
| Region | Provincial Unit | Rate of Change of TE | Rate of Change of PTE | Rate of Change of SE | TE Ranking | PTE Ranking | SE Ranking | Ranking Change for TE | Ranking Change for PTE | Ranking Change for SE |
|---|---|---|---|---|---|---|---|---|---|---|
| North China | Hebei | 7.78% | 10.08% | −2.18% | 15 | 18 | 15 | −4 | −6 | −4 |
| Inner Mongolia | 7.87% | 18.69% | −6.79% | 25 | 22 | 22 | −4 | −2 | 2 | |
| Shanxi | 7.60% | 10.19% | −2.22% | 12 | 12 | 13 | −4 | −4 | −3 | |
| North East | Heilongjiang | 14.37% | 23.25% | −6.73% | 19 | 16 | 24 | 0 | 2 | 1 |
| Jilin | 20.83% | 32.32% | −7.13% | 18 | 15 | 23 | 6 | 8 | 0 | |
| Liaoning | 14.07% | 16.63% | −2.37% | 16 | 19 | 12 | 2 | 0 | −4 | |
| North West | Ningxia | 4.60% | 6.54% | −2.10% | 13 | 14 | 14 | −6 | −8 | −2 |
| Shaanxi | 18.45% | 26.06% | −5.63% | 17 | 17 | 21 | 3 | 4 | 1 | |
| Xinjiang | 10.63% | 17.76% | −4.88% | 5 | 3 | 19 | −3 | −2 | 0 | |
| Central South | Anhui | 13.18% | 15.17% | −1.55% | 23 | 25 | 2 | 0 | −1 | −1 |
| Henan | 14.89% | 20.25% | −4.23% | 24 | 24 | 18 | 1 | 1 | 2 | |
| Hubei | 26.25% | 26.88% | −1.04% | 11 | 11 | 10 | 5 | 5 | 4 | |
| Hunan | 6.75% | 10.24% | −3.37% | 20 | 21 | 16 | −5 | −6 | 0 | |
| Jiangsu | 8.11% | 8.59% | −0.59% | 21 | 23 | 5 | −5 | −6 | 1 | |
| Shandong | 18.87% | 16.12% | 1.44% | 6 | 9 | 1 | 3 | 0 | 8 | |
| South West | Guizhou | 14.92% | 15.88% | −1.02% | 3 | 6 | 4 | 0 | −2 | 1 |
| Sichuan | 27.53% | 29.17% | −1.21% | 8 | 8 | 7 | 5 | 5 | 0 | |
| Yunnan | 47.11% | 47.68% | −1.61% | 1 | 2 | 11 | 13 | 12 | 2 | |
| Chongqing | 9.40% | 11.10% | −1.37% | 10 | 10 | 6 | −5 | −3 | −2 | |
| South East | Fujian | 10.87% | 14.22% | −3.16% | 7 | 7 | 9 | −3 | −2 | −6 |
| Guangdong | 18.37% | 17.56% | −0.51% | 4 | 4 | 8 | 2 | −1 | 7 | |
| Guangxi | 7.72% | 11.18% | −3.47% | 14 | 13 | 17 | −4 | −3 | 1 | |
| Hainan | 25.80% | 52.10% | −10.07% | 9 | 1 | 25 | 3 | 10 | −8 | |
| Jiangxi | 15.26% | 21.11% | −5.40% | 22 | 20 | 20 | 0 | 2 | 1 | |
| Zhejiang | 12.05% | 13.40% | −1.36% | 2 | 5 | 3 | −1 | −4 | −1 |
| Independent Variable | China | North East | North China | North West | Central South | South West | South East |
|---|---|---|---|---|---|---|---|
| FFE | 0.3240 *** | 0.2495 *** | 0.3490 *** | 0.3310 *** | 0.2864 *** | 0.1766 *** | 0.3000 *** |
| FLUS | 0.00003 * | 0.0638 *** | 0.00003 * | 0.0016 ** | 0.0128 *** | 0.1781 *** | 0.0348 *** |
| AI | 0.0005 | −0.0046 | 0.0734 *** | 0.0117 | −0.0024 | 0.0112 | −0.0023 |
| HAR | −0.0004 | 0.0042 * | 0.0166 * | 0.0542 * | −0.0094 * | −0.0452 *** | −0.0164 ** |
| UFE | 0.0315 *** | −0.0019 | 0.0409 *** | 0.0335 * | 0.0347 *** | −0.0398 ** | 0.0197 |
| FT | 0.0207 *** | 0.0058 | 0.0253 | 0.0852 *** | 0.0077 | −0.0129 | 0.0800 *** |
| 0.1058 *** | 0.0630 *** | 0.1220 *** | 0.1594 *** | 0.0859 *** | 0.1114 *** | 0.0989 *** | |
| 0.0873 *** | 0.0791 *** | 0.0774 *** | 0.0966 *** | 0.0805 *** | 0.0838 *** | 0.1059 *** | |
| 0.5947 | 0.3882 | 0.7129 | 0.7314 | 0.5322 | 0.6388 | 0.4658 | |
| 3671.43 *** | 368.40 *** | 885.37 *** | 415.55 *** | 628.64 *** | 480.71 *** | 399.72 *** |
Publisher’s Note: MDPI stays neutral with regard to jurisdictional claims in published maps and institutional affiliations. |
© 2022 by the authors. Licensee MDPI, Basel, Switzerland. This article is an open access article distributed under the terms and conditions of the Creative Commons Attribution (CC BY) license (https://creativecommons.org/licenses/by/4.0/).
Share and Cite
Liang, C.; Wei, X.; Meng, J.; Chen, W. How to Improve Forest Carbon Sequestration Output Performance: An Evidence from State-Owned Forest Farms in China. Forests 2022, 13, 778. https://doi.org/10.3390/f13050778
Liang C, Wei X, Meng J, Chen W. How to Improve Forest Carbon Sequestration Output Performance: An Evidence from State-Owned Forest Farms in China. Forests. 2022; 13(5):778. https://doi.org/10.3390/f13050778
Chicago/Turabian StyleLiang, Chen, Xue Wei, Jixian Meng, and Wenhui Chen. 2022. "How to Improve Forest Carbon Sequestration Output Performance: An Evidence from State-Owned Forest Farms in China" Forests 13, no. 5: 778. https://doi.org/10.3390/f13050778
APA StyleLiang, C., Wei, X., Meng, J., & Chen, W. (2022). How to Improve Forest Carbon Sequestration Output Performance: An Evidence from State-Owned Forest Farms in China. Forests, 13(5), 778. https://doi.org/10.3390/f13050778