Abstract
This paper presents differences in the drying behavior of red oak and yellow-poplar sapwood, heartwood, and bark and their relationship with selected physical characteristics. Drying experiments were performed on samples of sapwood, heartwood, and bark of respective species at 105 °C under nitrogen conditions. In addition, physical characteristics such as green moisture content, specific gravity, volumetric shrinkage, shrinkage of the cell wall, total porosity, pore volume occupied by water, and specific pore volume were calculated. The results showed that the volumetric and cellular shrinkages of sapwood were greater than those of heartwood for both species. For red oak, the specific gravity of sapwood and heartwood was not significantly different. Additionally, the total porosity of heartwood was lower than that of sapwood in red oak. The results also indicated that yellow-poplar dried faster than red oak. Among all three components, bark dried faster than sapwood and heartwood in both species. The activation energy for sapwood drying was less than for heartwood drying.
1. Introduction
Controlled drying operation in wood products manufacturing is crucial to maintaining product quality; however, it is energy-intensive [1]. According to [2], the drying operation accounts for about 40% to 70% of the total energy consumption in the entire wood products manufacturing. Total energy demand during drying depends on initial moisture content, size, and species of wood. The drying behavior of wood is also affected by the portion of sapwood and heartwood. Heartwood is more resistant to moisture flow and is less permeable than sapwood [3,4]. Some variations in the wood structure, such as cross-grain, reaction wood, and juvenile wood, also influence the drying behavior of wood [5,6]. The literature suggests that the distribution of final moisture content in kiln-dried lumber could be associated with the proportions of heartwood, sapwood, and juvenile wood [7], wood species [6], initial moisture content [8], drying schedules [1], and other factors. [9] reported a negative correlation between initial moisture content and several anatomical characteristics, including cell wall thickness, tangential vessel diameter, ray height, and the distance from the pith. However, initial moisture content had a positive correlation with vessel frequency. Rajewska et al. [10] reported that the application of microwaves significantly shortened the drying time without affecting the final quality of dried wood compared with conventional drying.
Physical properties of wood, such as specific gravity, total porosity, shrinkage, cellular shrinkage, and others, significantly affect the wood’s drying behavior [11,12]. In general, the rate of water transport, length in the flow direction, and concentration difference are contributing factors that affect the water vapor diffusion coefficient. In terms of wood, moisture content gradient is the measure of the concentration, which is positively related to the specific gravity of wood [3,4]. Simpson [13] reported that the water diffusion coefficient is not constant, it changes with the moisture content, and the diffusion coefficient of northern red oak (Quercus rubra L.) increased exponentially when moisture content changed from 6 to 30 percent at 43 °C. Therefore, the diffusion coefficient may be used as a characteristic of drying behavior.
Sapwood, heartwood, and bark are expected to show different physical characteristics and drying behavior mainly due to different total porosity, pore size distribution, and the quantity of extractives. Likewise, red oak and yellow-poplar are assumed to show different physical characteristics and drying behavior, particularly because the former species is ring-porous while the latter one is diffuse-porous [14,15]. Therefore, this research attempts to determine the influence of physical properties on moisture diffusion during the drying of sapwood, heartwood, and bark of two hardwood species.
2. Materials and Methods
2.1. Procurement and Processing of Raw Material
Two hardwood species, red oak (Quercus rubra) and yellow-poplar (Liriodendron tulipifera L.) were selected due to their prevalence in West Virginia and the Appalachian-Blue Ridge forests [16] and their historical use by the forest products industry [17]. Yellow-poplar and red oak account for 25.5% and 9.4% of tree harvesting in West Virginia [16]. Freshly cut logs of red oak (diameter = 215 ± 13 mm, length = 800 ± 15 mm) and yellow-poplar (diameter = 175 ± 13 mm, length = 900 ± 15 mm) were procured from the West Virginia University (WVU) Research Forest. The West Virginia Research Forest is located 10 miles northeast of Morgantown and encompasses 7600 acres. The forest cover consists of 60 to 80-year-old stands of mixed oak and mesophytic hardwood species. One disc with an average thickness of 23 ± 1 mm was cut from each log. Each disc was further cut into 18 small rectangular samples from the sapwood, heartwood, and bark regions (six samples from each region). All the slice and cube cutting operations were done using a band saw (Model: Rockwell, Pittsburgh, Pennsylvania).
The typical dimensions of the samples were 17.69 mm in radial, 16.47 mm in tangential, and 19.30 mm in longitudinal directions, which were the average values for all sapwood and heartwood samples. However, the bark samples did not have perfect cubic geometry. The intention was to prepare samples only from mature wood to avoid the effects of juvenile wood on the physical and drying properties of the samples. For this reason, no sample was cut in proximity to the first 30 growth rings (first 15 years) in the heartwood region. Figure 1 shows the cutting pattern of the discs and small samples.
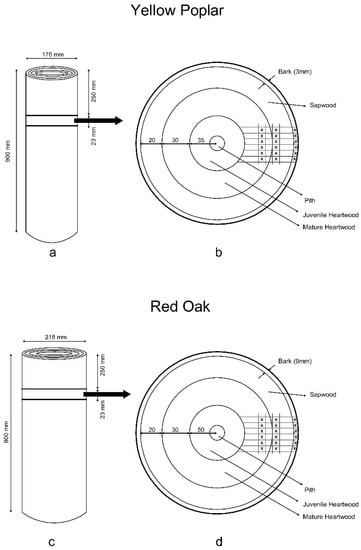
Figure 1.
(a) Cutting pattern of the yellow-poplar disc from the logs. (b) Cutting pattern of the yellow-poplar cubic samples from the discs. (c) Cutting pattern of the red oak disc from the logs. (d) Cutting pattern of the yellow-poplar cubic samples from the discs.
2.2. Drying Experiments
Each sample was weighed with an accuracy of 0.01 g using a balance (Model P603DMDS; Denver Instrument, Bohemia, NY, USA). The true volume of the samples (excluding pore volume) was measured using a pycnometer (Model Manual Multi-pycnometer; Qunatachrome, Boynton Beach, FL, USA) and according to the fluid (nitrogen) displacement method. The length, width, and thickness dimensions of sapwood and heartwood samples were measured at three locations using a caliper (Model ROHS NORM 2002/95/E.C.; Digimatic, Mitutoyo, Japan) with an accuracy of 0.01 mm. The dimensions of the bark samples were not measured due to their irregular geometric shape. The identical sets of measurements were done before and after drying.
The green samples were dried in a Thermo Gravimetric Analyzer (TGA; Model LECO 701; LECO Corporation, St. Joseph, MI, USA). Three drying experiments were done at 105 °C, 115 °C, and 125 °C under nitrogen conditions to avoid the effect of humidity. This study aimed to investigate wood drying behavior from green to oven-dry conditions. Therefore, 105 °C was used to ensure that the entire moisture could be removed from the wood, and the two other temperatures (105 °C and 105 °C) were used because evaluating activation energy requires at least three drying curves at different temperatures. The temperature interval was 10 °C because very high temperatures (above 125 °C) can potentially damage the cell wall structure and affect the physical properties. In addition, high temperatures can remove volatile extractives from wood, which was not the purpose of this study.
Each set of drying experiments used 12 samples, including a pair of red oak sapwood (R.O.S.), red oak heartwood (R.O.H.), red oak bark (R.O.B.), yellow-poplar sapwood (Y.P.S.), yellow-poplar heartwood (Y.P.H.), and yellow-poplar bark (Y.P.B.). During each drying experiment, data on the time, temperature, and weight of the samples were continuously measured and recorded.
2.3. Evaluation of Physical Properties and Drying Behavior
Physical properties, including dry-basis moisture content, volumetric shrinkage, green specific gravity, and oven-dry specific gravity, were calculated using standard equations [4].
Porosity is calculated as the fractional void volume of wood, expressed in percentage at a given MC, using Equation (1) [4].
where µtotal is total porosity (%), V is equal to the fractional volume occupied by air plus water fraction in green condition (cm3), and Vp0 = oven-dry volume of wood cell mass (cm3).
Specific pore volume or specific porosity is void volume divided by oven-dry weight, which is evaluated by Equation (2).
where Sµ is specific porosity (cm3/g) or specific pore volume, and m0 is the oven-dry mass (weight) (g).
Oven-dry cell wall specific gravity can be evaluated by Equation (3).
where SGwall0 is the oven-dry specific gravity of the cell wall, and ρwater is the density of water (g/cm3).
Water Fraction is the portion of the volume occupied by water and can be estimated by Equation (4).
where WF is water fraction (%), Vw = volume of water (cm3), and Vpore = true pore volume (cm3). Vw (cm3) is equivalent to the weight (mass) of water (g), m−m0, which is equal to the volume of water. The m−m0 is the weight (mass) of water (g), which is equal to the volume of water Vw (cm3), and Vpore is Vp−Vp0 (cm3).
Cell wall shrinkage is the volume reduction of cell walls due to moisture loss below the fiber saturation point. Equation (5) can be employed to calculate cell wall shrinkage.
where scell is cellular shrinkage (%), Vw is the volume of water (cm3), Vpore is true pore volume (cm3), and Vp is the green volume (cm3).
Drying behavior is characterized by the moisture ratio, drying rate, and diffusion coefficient [18]. The mathematical procedure to calculate the drying parameters has been documented in the previous publication [19]. Equation (6) can be employed to calculate the moisture ratio (MR).
where M, Mi, and Mf are current moisture, initial moisture, and final moisture, respectively. It is worth noting that Mf is equivalent to M0 for the samples in this study, as they are oven dried.
Drying flux is calculated by Equation (7).
where m0 is oven dry mass (weight) (kg), and A is the total surface area (m2) of the sample.
Drying flux = drying rate × (m0/A)
In addition, the influence of temperature on the overall diffusion coefficient was calculated using the Arrhenius theory of activation energy [20,21,22,23], using Equation (8).
where T is the temperature (°C), R is the gas constant having a constant value of 8.31410−3 K.J./mol K−1, D0 is the pre-exponential factor at 273 K temperature, and EA is the activation energy (K.J./mol). EA/R was obtained as the slope of the straight line of nature log of DL vs. 1/(T + 273).
The dependence of the overall diffusion coefficient is expressed by the Arrhenius expression. Therefore, additional drying experiments were conducted at 115 °C and 125 °C, and overall liquid diffusion coefficients were also calculated for these two temperatures. Stamm and Nelson [24] published values of fiber saturation point in the temperature range of 20 °C to 120 °C and illustrated that FSP decreases approximately 0.1% per degree rise in temperature. Based on prior research, the fiber saturation points for 115 °C and 125 °C were assumed to be 21% and 20% [4]. After that, the Arrhenius expression was fitted to overall liquid diffusion coefficients calculated at 105 °C, 115 °C, and 125 °C to calculate the activation energy (EA) and pre-exponential factor (D0).
3. Results and Discussion
3.1. Moisture Content and Dimensional Stability
In general, the green moisture content of wood may vary from about 30% to 200% [25]. Table 1 lists the physical characteristics (moisture content, volumetric shrinkage, and cell wall shrinkage) of the green wood samples. It is evident that R.O.S. had higher green moisture than heartwood. However, the trend in moisture content between sapwood and heartwood was the opposite for the yellow poplar, where sapwood had lower green moisture than heartwood. On the other hand, R.O.B. had a higher green moisture content than the Y.P.B.

Table 1.
Mean ± standard deviation (n = 6) values for moisture content, volumetric shrinkage, and cell wall shrinkage of green, red oak, and yellow-poplar components.
Clark et al. [15] reported that the green moisture content of yellow-poplar wood and bark is 97% and 65%, respectively. Additionally, the green moisture for wood of chestnut oak, scarlet oak, southern red oak, and white oak is 69%, 79%, 74%, and 68%, respectively [15]. The moisture content of bark also varies among species. For example, Clark et al. [15] reported green moisture content of 69% for chestnut oak, 79% for scarlet oak, 53% for southern red oak, and 67% for white oak. The reported values of green moisture content for Y.P.S. and Y.P.H. are 53% and 96%, respectively. Green moisture content for hardwoods sapwood and heartwood is 90% and 81%, while that for softwoods, sapwood, and heartwood is 142% and 53% [25,26]. Northern R.O.S. and R.O.H. have 60% and 80%, while southern sapwood and heartwood have 75% and 83% of green moisture content, respectively. Table 1 indicates that the observed moisture content values in this research are different from those of previous studies. Perhaps the variability of green moisture content exists not only among species but also within individual boards cut from the same tree. Location range is also another influential factor in green moisture content.
Upon drying, wood loses green moisture and shrinks in varying linear proportions in its three principal directions. Overall shrinkage is represented by total volumetric shrinkage. The volumetric shrinkage of sapwood and heartwood within each species varied from 11.64% to 17.10%. Volumetric shrinkage depends on the amount of wood cell mass present and the distribution of various size pores. Shrinkage of wood species is related to the fiber saturation point and specific gravity, meaning a higher fiber saturation point and greater specific gravity result in greater shrinkage and lesser dimensional stability [27].
The volumetric shrinkage of R.O.S. and R.O.H. values are more than those of Y.P.S. and Y.P.H., respectively. In addition, the cell wall shrinkage values of R.O.S. and R.O.H. are lower than those of Y.P.S. and Y.P.H.; however, in both species, the cell wall shrinkage of sapwood was greater than that of heartwood. In a prior study, changes in the microstructure of birch wood (Betula pendula) were observed and attributed to thermal treatment at three temperatures (140 °C, 160 °C, and 180 °C) [28]. According to their observations, thermal treatment increased the fiber lumen area by 2.4% when the green sample was heated to 140 °C. Additionally, the total fiber area decreased simultaneously to 37.7% because of heat treatment, which is directly proportional to total volumetric shrinkage. Changes in fiber and lumen cross-sectional area occur as wood cell shrinks [28]. The cell-wall shrinkage can be up to 46.0% if the fiber saturation point is assumed to be 30.0% moisture content [4]. It should be noted that 18%, 22%, and 20% of yellow-poplar, southern red oak, and northern red oak is composed of bark based on total volume [29].
3.2. Specific Gravity
The green samples of red oak and yellow-poplar components were also characterized for specific gravity values. Specific gravity values were calculated for green conditions (SG) as well as for oven-drying conditions (SG0). In addition, the specific gravity of the wood cell wall was also calculated. Table 2 presents the green specific gravity, oven-dry specific gravity, and oven-dry cell wall specific gravity values for the samples tested.
Table 2.
Mean and standard deviation for specific gravities for sapwood and heartwood of red oak and yellow-poplar species.
In terms of both SG and SG0, the specific gravities of the sapwood and heartwood of red oak were almost equal, whereas in yellow-poplar, the specific gravity of sapwood is considerably greater than that of heartwood. For calculating green specific gravity, oven dry mass (weight) is in the numerator, which is a constant value for a piece of wood. Also, green volume is in the denominator, which does not change above the fiber saturation point. Therefore, although sapwood and heartwood had different moisture values, they did not show various green specific gravity values. Specific gravity is unitless. However, some studies in wood drying used basic density (ρb) in lieu of specific gravity [30,31]. The unit for ρb is kg/m3. The considerable difference between the SG of sapwood and that of heartwood in yellow-poplar might be attributed to the possible presence of reaction (tension) wood, which is more prevalent in poplar than in oak [32]. In general, the specific gravity of red oak is greater than that of yellow poplar. The oven-dry specific gravity values of northern red oak, southern red oak, and yellow-poplar are reported to be 0.65, 0.62, and 0.46, respectively [25]. Diffuse-porous species such as quaking aspen, American basswood, and sugar maple have an oven-dry specific gravity of 0.40, 0.38, and 0.66, respectively. Physical properties might change among different varieties of the same species. Specific gravity and oven-dry specific gravity have been reported to be 0.60 and 0.71, respectively, for scarlet oak (Quercus coccinea), 0.52 and 0.62, respectively, for southern red oak (Quercus falcata), and 0.61 and 0.71, respectively, for cherry bark oak (Quercus falcata var. pagodaefolia) [33]. Wood species with high specific gravity show a slow drying rate and a high tendency to develop drying defects. In other words, the greater the specific gravity of wood, the more oven-dry wood mass per unit volume of green wood.
3.3. Pore Spaces
Pore spaces are negatively related to wood density and specific gravity. Large pore volumes facilitate rapid drying. Total porosity, specific pore volume, and percent of pore volume occupied by water are presented in Table 3. Studying pore spaces is paramount for bark and its application in producing biochar [34]. Researching pore spaces is also a key factor in optimizing wood protection processes using eco-friendly preservatives [35,36]. Moreover, understanding pore spaces in wood provides a fresh insight into the surface layer treatment of wood and wood products [37,38,39].
Table 3.
Mean and standard deviation for the water fraction, total porosity, and specific pore volume of sapwood, heartwood, and bark components of red oak and yellow poplar.
There is an inconsiderable difference in terms of pore volume occupied by water (water fraction) in the sapwood, heartwood, and bark of red oak. Additionally, variations in total porosity were also observed for the sapwood and heartwood of both species. Total porosity is related to specific pore volume, which ranges from 0.82 cm3/g to 2.14 cm3/g. Kellogg and Wangaard [27] reported a specific pore volume from 0.653 to 0.667 10−3 m3/Kg using the toluene displacement method for 18 wood species (hardwoods and softwoods).
3.4. Drying Behavior
3.4.1. Changes in Moisture Ratio during Drying Period
Normalized moisture content (moisture ratio, MR) was plotted as a function of time (Figure 2) to evaluate the behavior of various wood components with different initial moisture contents. Specifically, the one major observation was that the sapwood and heartwood showed similar drying behaviors (overlapping in the graph) for both species of wood. This result suggests that the sapwood and heartwood within both red oak and yellow-poplar lost moisture at a similar rate, indicating that there is no need to consider the amount of heartwood and sapwood when considering the drying times and rates for red oak and yellow-poplar lumber. Moreover, bark loses moisture faster than sapwood and heartwood for both wood species. Finally, the components of red oak dried slower than those of yellow poplar. These findings are likely attributed to yellow poplar being less dense than red oak, which can provide more pore spaces for moisture to diffuse. Comparing different components of the same species, in both species, the MR of bark was observed to decrease at a higher rate than for sapwood and heartwood. This higher rate in bark was attributed to bark being less dense than the wood, which facilitates moisture movement.
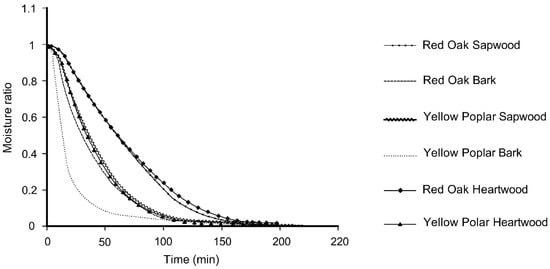
Figure 2.
Moisture ratio as a function of time for sapwood, heartwood, and bark components of red oak and yellow-poplar.
3.4.2. Unsteady State Flux during Drying Period
In the TGA experiments, block samples were used so that moisture could escape from all six faces of each block in its three principal directions. Therefore, the flux of water evaporation was calculated to compare various drying periods (constant rate and falling rate periods) (Figure 3).
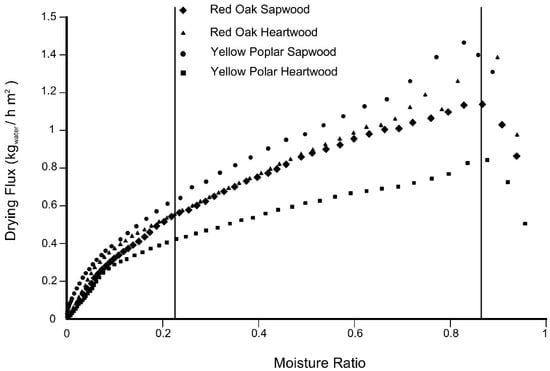
Figure 3.
Drying flux as a function of moisture ratio in red oak and yellow-poplar dried at 105 °C.
Figure 3 represents the flux of water evaporation and shows almost the same pattern for all the samples over the moisture ratio range. Yellow-poplar appears to be drying faster than red oak. Y.P.S. and Y.P.H. exhibited a higher drying curve than R.O.S. and R.O.H., respectively. These results are also explained by the greater drying rate of yellow poplar than that of red oak, as shown in Figure 2. While comparing sapwood and heartwood, on the other hand, R.O.S. and R.O.H. were observed to have the same flux over moisture ratio during the falling rate period of drying. In general, all drying curves are divided into three parts: short heating periods, gentle slope falling rate, and rapid slope falling rate.
3.4.3. Drying Differences between Species and Components
The weight of water removal per unit of time was plotted for the three components of red oak and yellow-poplar to compare all three components of wood (Figure 4a,b).
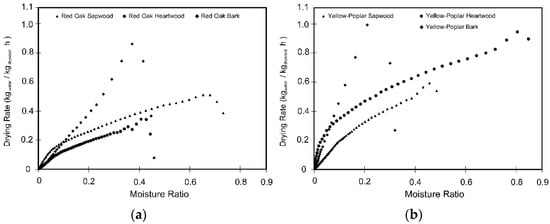
Figure 4.
Drying rate as a function of moisture ratio in (a) red oak and (b) yellow-poplar components during isothermal drying at 105 °C.
Figure 4a,b show that the slope of the drying curve in the bark is considerably greater than the drying curve slopes of the sapwood and heartwood in both red oak and yellow poplar, indicating that the bark has the highest drying rate in both species. All three components had different initial moisture contents. Moreover, at the same moisture content, bark showed a higher drying rate. Additionally, the drying curve pattern is very different between bark and wood, which could be related to different fiber saturation points within each component. Furthermore, bark has less density and specific gravity as well as more porosity compared to wood, which plays an essential role in the fast drying of bark. When comparing the drying rate of sapwood and heartwood within the same species, R.O.S. was observed to have a higher rate of drying than heartwood. On the contrary, in yellow-poplar, heartwood had a higher drying rate than sapwood.
3.4.4. Isothermal Drying Conditions
A typical temperature profile during drying is shown in Figure 5. After a short heating period, the furnace temperature reached the desired temperature and remained constant. The heating periods for the desired temperatures of 105 °C, 115 °C, and 125 °C were 16, 13, and 12 min, respectively. Therefore, the drying of wood samples was assumed to be in isothermal conditions.
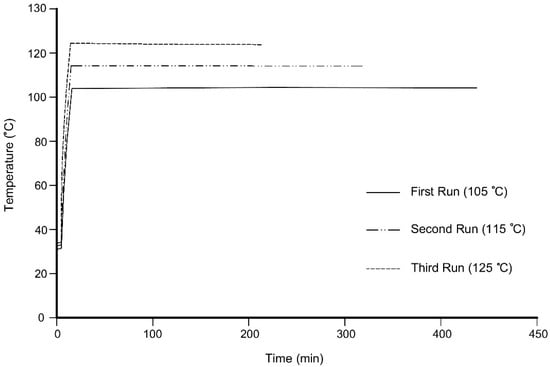
Figure 5.
Temperature profiles for the first, second, and third run of wood drying.
Three curves in Figure 5 represent the temperatures of three drying runs, which are setpoints for the ambient temperature inside the TGA equipment. Over the drying process, an ideal isothermal condition means that the temperature gradient was negligible in the wood sample. The surface of the material easily reaches the desired temperature, whereas the interior usually does not, especially in larger specimens.
3.4.5. Overall Liquid Diffusion Coefficient
The overall liquid diffusion coefficient (DL) was calculated for the two moisture ranges, including (1) within the capillary (convection) dominant, green to fiber saturation point (22% at 105 °C), and (2) within the diffusion dominant, 10% to oven-dry conditions. The intermediate moisture range from 22% to 10% moisture content was assumed to be a transition from convective dominant flow to diffusion dominant flow. Table 4 provides the values of average overall liquid diffusion coefficients.
Table 4.
Average overall liquid diffusion coefficients (n = 2) for sapwood and heartwood of red oak and yellow-poplar in the moisture range of 0 and 76 during isothermal drying at 105 °C.
The average diffusion coefficient values were in the range of 1.0610−8 to 7.0110−8 for the various wood components tested. The moisture diffusion coefficients of wood are dependent on temperature and moisture content. Stamm [40] reported that the bound water diffusion coefficient of the cell wall in the longitudinal direction is approximately 2.5 times in the transverse directions. Siau [3] plotted the liquid diffusion coefficient as a function of moisture content and illustrated that the overall diffusion coefficient increases with moisture content increment. Increasing temperature leads to an increase in liquid coefficient diffusion. In this research (Table 4), the DL values for diffusion-controlled scenarios were found to be higher than those of the capillary flow regime for both species and both wood components. For red oak, the DL of sapwood is less than that of heartwood in the diffusion-controlled part. In contrast, for the capillary-controlled portion, the DL of R.O.S. is higher than that of R.O.H. In terms of yellow-poplar, sapwood has a higher DL than heartwood in both capillary- and diffusion-controlled parts. In addition, the highest DL of sapwood is for the red oak capillary-controlled part, and the greatest DL of heartwood is for the red oak diffusion-controlled part. In addition, in the sapwood and heartwood of both red oak and yellow-poplar, the DL of the capillary-controlled part is higher than that of the diffusion-controlled part. Additionally, in the diffusion-controlled part, Y.P.S. has the highest and Y.P.H. has the lowest DL. In terms of the capillary-controlled part, R.O.H. has the highest and Y.P.H. has the lowest ones. Statistical analysis was done to compare the DL in capillary-controlled to diffusion-controlled regimes using a t-test (confidence level = 0.95). The statistical results indicated that there were significant and insignificant differences between the overall liquid diffusion coefficients in capillary-controlled and diffusion-controlled parts for red oak (p-value = 0.022) and yellow-poplar (p-value = 0.118), respectively (confidence level = 0.95). The overall liquid diffusion coefficient has been studied and evaluated for several sources of biomass. For instance, rice husk has a DL of 8.4210−9 to 1.6910−8 in the 30 °C to 60 °C range of drying temperature [41]. Mint leaves and coconut husk have a DL of 1.9710−9 to 6.1710−9 and 110−8 to 610−8 in the 35 °C to 55 °C and 30 °C to 70 °C ranges, respectively [42,43]. Chen et al. [44] reported a DL of 9.38 10−10 to 1.3810−9 for poplar dust at the temperature range of 50 °C to 90 °C. Additionally, Chen et al. [45] found that the DL of peanut shells is about 9.6010−9 to 2.2610−8 at the temperature range of 50 °C to 90 °C.
3.4.6. Dependence of the Overall Liquid Diffusion Coefficient on Temperature-Activation Energy
The values of activation energy (EA) and pre-exponential factor (D0) are listed in Table 5. Overall, the activation energy values (EA) ranged from 20.76 KJ/mol to 111.49 KJ/mol for the drying of wood components of red oak and yellow-poplar. The activation energy of capillary-controlled and diffusion-controlled phases showed a statistically insignificant difference at the confidence level of 0.95 (p-value = (0.620). Activation energy has been previously calculated for the drying of different types of biomasses. For example, the activation energy for drying mung beans was 23.28 KJ/mol [46], 14.1 KJ/mol for wheat straw [47], 12.34 KJ/mol for olive waste [48], 15.1 KJ/mol for cotton stalk, and 21.2 KJ/mol for peanut shells [45].
Table 5.
Activation energy and pre-exponential factor.
Similarly, the activation energy for the drying of poplar (Populus deltoides) was reported to be 27.8 KJ/mol and 50.8 KJ/mol for 1 m/s and 1.5 m/s airflow velocities, respectively [49]. Kang and Hart [50] studied the temperature effect on the diffusion coefficient in drying red oak and yellow-poplar and reported that when specific gravity increases, activation energy also increases, which does not accord with the findings of this research. In fact, in our research, no correlation was found between the specific gravity and activation energy of R.O.S, R.O.H, Y.P.S., and Y.P.H. In addition, the activation energy for the diffusion of bound water increases in favor of increasing the transverse bound water diffusion coefficient of wood [4], whereas our study did not show any correlation between the overall diffusion coefficient and activation energy in the diffusion-controlled phase. Stamm [51] found that the molar heat of vaporization of bound water diffusion and activation energy decreases when moisture content increases from 0% to 30%. Further research is required to study the diffusion coefficient and activation energy of red oak and yellow-poplar within different sub-ranges, especially below the fiber saturation point.
4. Conclusions
In both red oak and yellow-poplar, the volumetric shrinkage of sapwood is higher than in heartwood, while the cellular shrinkage of sapwood is noticeably higher than in heartwood. In both species, bark dried faster than wood, while sapwood and heartwood showed the same drying rate behavior. Additionally, yellow-poplar showed a faster drying rate than red oak. For all wood samples tested, drying proceeded through falling rate periods. The average diffusion coefficient values were in the range of 1.0610−8 to 7.0110−8 for the various wood components tested. Overall, the activation energy values (EA) ranged from 20.76 KJ/mol to 111.49 KJ/mol for the drying of the wood components of red oak and yellow-poplar. This research studied a small sample size due to the limited number of crucibles in the TGA. Further research is required on bigger sample sizes. While this study focused on mature and old-growth trees, future studies should target juvenile wood to investigate the drying properties of second-growth trees.
Author Contributions
Conceptualization, S.R.; methodology, K.S.; software, M.B, formal analysis, S.R and M.B.; investigation, S.R. and S.K; data curation, S.R.; writing—original draft preparation, S.R and M.B; writing—review and editing, D.D., D.C., K.S., and M.B. All authors have read and agreed to the published version of the manuscript.
Funding
This work was supported by the USDA National Institute of Food and Agriculture, McIntire Stennis project (accession number 1007044) and through the Hatch Project (accession number 1019107) within the Division of Forestry and Natural Resources at West Virginia University. One author, David DeVallance, acknowledges the European Commission for funding the InnoRenew CoE project [Grant Agreement #739574] under the Horizon 2020 Widespread-Teaming program and the Republic of Slovenia (Investment Funding of the Republic of Slovenia and the European Union of the European Regional Development Fund), which allowed for additional efforts related to publication preparation.
Institutional Review Board Statement
Not applicable.
Informed Consent Statement
Not applicable.
Data Availability Statement
All data included in this study are available upon request by contact with the corresponding author.
Conflicts of Interest
The authors declare no conflict of interest.
Nomenclature
| Symbols | |
| A | Total surface area (m2) |
| D0 | Pre-exponential factor at 273 K temperature |
| DL | Overall diffusion coefficient (m2/s) |
| EA | Activation energy (KJ/mol) |
| m0 | Oven-dry mass (weight) (g). |
| M | Current moisture (%) |
| Mf | Final moisture (%) |
| Mi | Initial moisture (%) |
| MR | Moisture ratio |
| scell | Cellular shrinkage (%) |
| Sµ | Specific porosity or specific pore volume (cm3/g) |
| SG | Green specific gravity |
| SG0 | Oven-dry specific gravity |
| SGwall0 | Oven-dry cell wall specific gravity |
| R | Gas constant having a constant value of 8.31410−3 K.J./mol K−1 |
| T | Temperature (°C) |
| V | Fractional volume occupied by air and water in green condition (cm3) |
| Vpore | True pore volume (cm3) |
| Vp0 | Oven-dry volume of wood cell wall mass (cm3) |
| Vw | Volume of water (cm3) |
| WF | Water fraction (%) |
| µtotal | Total porosity (%) |
| ρwater | Density of water (g/cm3) |
| ρb | Basic density (kg/m3) |
| Abbreviations | |
| R.O.B. | Red oak bark |
| R.O.H | Red oak heartwood |
| R.O.S. | Red oak sapwood |
| Y.P.B. | Yellow poplar bark |
| Y.P.H. | Yellow poplar heartwood |
| Y.P.S. | Yellow poplar sapwood |
References
- Gu, H.; Timothy, M.Y.; William, W. Potential sources of variation that influence the final moisture content of kiln-dried hardwood lumber. For. Prod. Lab. 2004, 54, 65–70. [Google Scholar]
- Zhang, B.G.; Liu, D.Y. Exploring a new developing way of wood drying technology in China. China For. Prod. Ind. 2006, 33, 3–6. [Google Scholar]
- Siau, J.F. Transport Processes in Wood; Springer: New York, NY, USA, 1984. [Google Scholar]
- Siau, J.F. Wood—Influence of Moisture on Wood Properties; Department of Wood Science and Forest Products, Virginia Polytechnic Institute and State University: Blacksburg, VA, USA, 1995. [Google Scholar]
- Burtin, P.; Jay-Allemand, C.; Charpentier, J.P.; Janin, G. Natural wood coloring process in Juglans sp. (J. regia and hybrid J. nigra) depends on native phenolic compound accumulated in the transition zone between sapwood and heartwood. Trees Struct. Funct. 1998, 12, 258–264. [Google Scholar]
- Mottonen, V. Variation in drying behavior and final moisture content of wood during conventional low temperature drying and vacuum drying of Betula Pendula timber. Dry. Technol. 2006, 24, 1405–1413. [Google Scholar] [CrossRef]
- Yamamoto, K.; Sulaiman, O.; Kitingan, C.; Choon, L.W.; Nhan, N.T. Moisture distribution in stems of Acacia mangium, A. auuriculiformis and hybrid acacia trees. Jpn. Agric. Res. Q. 2003, 37, 207–212. [Google Scholar] [CrossRef][Green Version]
- Moya, R.; Urueña, E.; Muñoz, F. Modulation of moisture content in conventional kiln of wood from fast-growing tropical species in plantation. In Proceedings of the SWST International Annual Convention, Concepcion, Chile, 10–12 November 2008. [Google Scholar]
- Moya, R.; Tenorio, C.; Meyer, I. Influence of wood anatomy on moisture content, shrinkage and during defects in Vovhysia guatealensis Donn Sm. Sci. For. 2012, 40, 249–258. [Google Scholar]
- Rajewska, K.; Smoczkiewicz-Wojciechowska, A.; Majka, J. Intensification of beech wood drying process using microwaves. Chem. Process Eng. 2019, 40, 179–187. [Google Scholar]
- Alden, H.A. Hardwoods of North America; Gen. Tech. Rep. FPL-83; USDA Forest Service, Forest Products Laboratory: Madison, WI, USA, 1995.
- Alden, H.A. Softwoods of North America; Gen. Tech. Rep. FPL-102; USDA Forest Service, Forest Products Laboratory: Madison, WI, USA, 1997.
- Simpson, W.T. Determination and use of moisture diffusion coefficient to characterize drying of northern red oak (Quercus rubra). Wood Sci. Technol. 1993, 27, 409–420. [Google Scholar] [CrossRef]
- Hoadley, B. Identifying Wood: Accurate Results with Simple Tools; Taunton Press: Newtown, PA, USA, 1990. [Google Scholar]
- Clark, A.; Phillips, D.R.; Frederick, D.J. Weight, Volume, and Physical Properties of Major Hardwood Species in the Piedmont; Tech. Rep. FPL-102; USDA Forest Service, Forest Products Laboratory: Madison, WI, USA, 1985.
- Grushecky, S.T.; Wiedenbeck, J.; Hassler, C.C. Examination of roundwood utilization rates in West Virginia. For. Prod. J. 2012, 62, 507–515. [Google Scholar] [CrossRef]
- Miller, R.B. Characteristics and availability of commercially important woods. In Wood Handbook: Wood as An Engineering Material; General technical report F.P.L.; GTR-113: 1999; USDA Forest Service, Forest Products Laboratory: Madison, WI, USA, 1999; Volume 113, pp. 1.1–1.34. [Google Scholar]
- Geankoplis, C.J.; Hersel, A.A.; Lepek, D.H. Transport Processes and Separation Process Principles; Prentice Hall: Boston, MA, USA, 2018. [Google Scholar]
- Rahimi, S.; Singh, K.; DeVallance, D. Effect of different hydrothermal treatments (steam and hot compressed water) on physical properties and drying behavior of yellow poplar (Liriodendron tulipifera). For. Prod. J. 2019, 69, 42–52. [Google Scholar] [CrossRef]
- Barrer, R.M. Diffusion in and Through Solid; The University Press: Cambridge, UK, 1941. [Google Scholar]
- Choong, E.T. Diffusion coefficients of softwoods by steady state and theoretical methods. For. Prod. J. 1965, 15, 21–27. [Google Scholar]
- Shi, J.; Pan, Z.; McHugh, T.H.; Wood, D.; Hirschberg, E.; Olson, D. Drying and quality characteristics of fresh and sugar-infused blueberries dried with infrared radiation heating. Food Sci. Technol. 2008, 41, 1962–1972. [Google Scholar] [CrossRef]
- Singh, B.; Gupta, A.K. Mass transfer kinetics and determination of effective diffusivity during convective dehydration of pre-osmosed carrot cubes. J. Food Eng. 2007, 79, 323–328. [Google Scholar] [CrossRef]
- Forest Products Laboratory. Physical Properties and Moisture Relations of Wood; Chapter 4 in FPL-GTR-282; Forest Products Laboratory: Madison, WI, USA, 2021. [Google Scholar]
- Stamm, A.J.; Nelson, R.M. Comparison between measure and theoretical drying diffusion coefficients for southern pine. For. Prod. J. 1961, 11, 536–543. [Google Scholar]
- Simpson, W.T. Chapter 11: Energy in Kiln Drying. In USDA Agricultural Handbook AH-188: Dry Kiln Operator’s Manual; USDA Forest Service: Madison, WI, USA, 1991; pp. 239–256. [Google Scholar]
- Kellogg, R.M.; Wangaard, F.F. Variation in the cell wall density of wood. Wood Fiber Sci. 1969, 1, 180–204. [Google Scholar]
- Biziks, V.; Andersons, B.; Beļkova, Ļ.; Kapača, E.; Militz, H. Changes in the microstructure of birch wood after hydrothermal treatment. Wood Sci. Technol. 2013, 47, 717–735. [Google Scholar] [CrossRef]
- Miles, P.D. Specific Gravity and Other Properties of Wood and Bark for 156 Tree Species Found in North America; U.S. Department of Agriculture, Forest Service, Northern Research Station: Newtown Square, PA, USA, 2009; Volume 38.
- Rahimi, S.; Nasir, V.; Avramidis, S.; Sassani, F. Wood moisture monitoring and classification in kiln-dried timber. Struct. Control. Health Monit. 2022, 29, e2911. [Google Scholar] [CrossRef]
- Rahimi, S.; Avramidis, S. Predicting moisture content in kiln dried timbers using machine learning. Eur. J. Wood Wood Prod. 2022, 1–12. [Google Scholar] [CrossRef]
- Tarmian, A.; Sepeher, A.; Rahimi, S. Drying stress and strain in tension wood: A conventional kiln schedule to efficiently dry mixed tension/normal wood boards in poplar. Dry. Technol. 2009, 27, 1033–1040. [Google Scholar] [CrossRef]
- Barger, R.L.; Ffolliott, P.F. The Physical Characteristics and Utilization of Major Woodland Tree Species in Arizona; Res. Pap. RM-83; USDA Forest Service, Forest Products Laboratory: Ft. Collins, CO, USA, 1972.
- Wang, Q.; Chu, D.; Luo, C.; Lai, Z.; Shang, S.; Rahimi, S.; Mu, J. Transformation mechanism from cork into honeycomb–like biochar with rich hierarchical pore structure during slow pyrolysis. Ind. Crops Prod. 2022, 181, 114827. [Google Scholar] [CrossRef]
- Mansoryar, E.; Karimi, A.; Ebrahimi, G.; Mirshokraei, A.; Rahimi, S. Water repelling Populus Alba by emulsion of paraffin, Quaternary ammonium and hydrated starch. IJWP 2010, 25, 211–222. (In Farsi) [Google Scholar]
- Dong, H.; Bahmani, M.; Rahimi, S.; Humar, M. Influence of copper and biopolymer/Saqez resin on the properties of poplar wood. Forests 2020, 11, 667. [Google Scholar] [CrossRef]
- Chu, D.; Mu, J.; Avramidis, S.; Rahimi, S.; Liu, S.; Lai, Z. Functionalized surface layer on poplar wood fabricated by fire retardant and thermal densification. Part 2: Dynamic wettability and bonding strength. Forests 2019, 10, 982. [Google Scholar] [CrossRef]
- Qu, L.; Rahimi, S.; Qian, J.; He, L.; He, Z.; Yi, S. Preparation and characterization of hydrophobic coatings on wood surfaces by a sol-gel method and post-aging heat treatment. Polym. Degrad. Stab. 2021, 183, 109429. [Google Scholar] [CrossRef]
- Chu, D.; Mu, J.; Avramidis, S.; Rahimi, S.; Lai, Z.; Ayanleye, S. Effect of heat treatment on bonding performance of poplar via an insight into dynamic wettability and surface strength transition from outer to inner layers. Holzforschung 2020, 74, 777–787. [Google Scholar] [CrossRef]
- Stamm, A.J. Bound water diffusion into wood in across-the-fiber directions. For. Prod. J. 1960, 10, 524–528. [Google Scholar]
- Thakur, A.K.; Gupta, A.K. Water absorption characteristics of paddy, brown rice, and husk during soaking. J. Food Eng. 2006, 75, 252–257. [Google Scholar] [CrossRef]
- Kaya, A.; Aydin, O. An experimental study on drying kinetics of some herbal leaves. Energy. Convers. Manag. 2009, 50, 118–124. [Google Scholar] [CrossRef]
- Tirawanichakul, S. Paddy dehydration by adsorption: Thermo-physical properties and diffusion model of agricultural residues. Biosyst. Eng. 2008, 99, 249–255. [Google Scholar] [CrossRef]
- Chen, D.; Zheng, Y.; Zhu, X. Determination of effective moisture diffusivity and drying kinetics for poplar sawdust by thermogravimetric analysis under isothermal condition. Bioresour. Technol. 2012, 107, 451–455. [Google Scholar] [CrossRef]
- Chen, D.; Zheng, Y.; Zhu, X. Determination of effective moisture diffusivity and activation energy for drying of powdered peanut shell under isothermal conditions. Bioresources 2012, 7, 3670–3678. [Google Scholar]
- Li, Z.; Kobayashi, N. Determination of moisture diffusivity by thermogravimetric analysis under non-isothermal condition. Dry. Technol. 2005, 23, 1331–1342. [Google Scholar] [CrossRef]
- Cai, J.; Chen, S. Determination of drying kinetics for biomass by thermogravimetric analysis under nonisothermal condition. Dry. Technol. 2008, 26, 1464–1468. [Google Scholar] [CrossRef]
- Vega-Gálvez, A.; Miranda, M.; Díaz, L.P.; Lopez, L.; Rodriguez, K.; Di Scala, K. Effective moisture diffusivity determination and mathematical modelling of the drying curve of the olive-waste cake. Bioresour. Technol. 2010, 101, 7265–7270. [Google Scholar] [CrossRef]
- Zarea Hosseinabadi, H.; Doosthoseini, K.; Layeghi, M. Drying kinetics of poplar (PopulusDeltoides) wood particles by a convective thin layer dryer. Drv. Ind. 2012, 63, 169–176. [Google Scholar] [CrossRef][Green Version]
- Kang, J.; Hart, C.A. Temperature effect on diffusion coefficient in drying wood. Wood Fiber Sci. 1996, 29, 325–332. [Google Scholar]
- Stamm, A.J. Bound water diffusion into wood in the fiber direction. For. Prod. J. 1959, 9, 27–32. [Google Scholar]


Publisher’s Note: MDPI stays neutral with regard to jurisdictional claims in published maps and institutional affiliations. |
© 2022 by the authors. Licensee MDPI, Basel, Switzerland. This article is an open access article distributed under the terms and conditions of the Creative Commons Attribution (CC BY) license (https://creativecommons.org/licenses/by/4.0/).