
Nonlinear Quantile Mixed-Effects Models for Prediction of the Maximum Crown Width of Fagus sylvatica L., Pinus nigra Arn. and Pinus brutia Ten.

 ,
,
Abstract
:1. Introduction
2. Materials and Methods
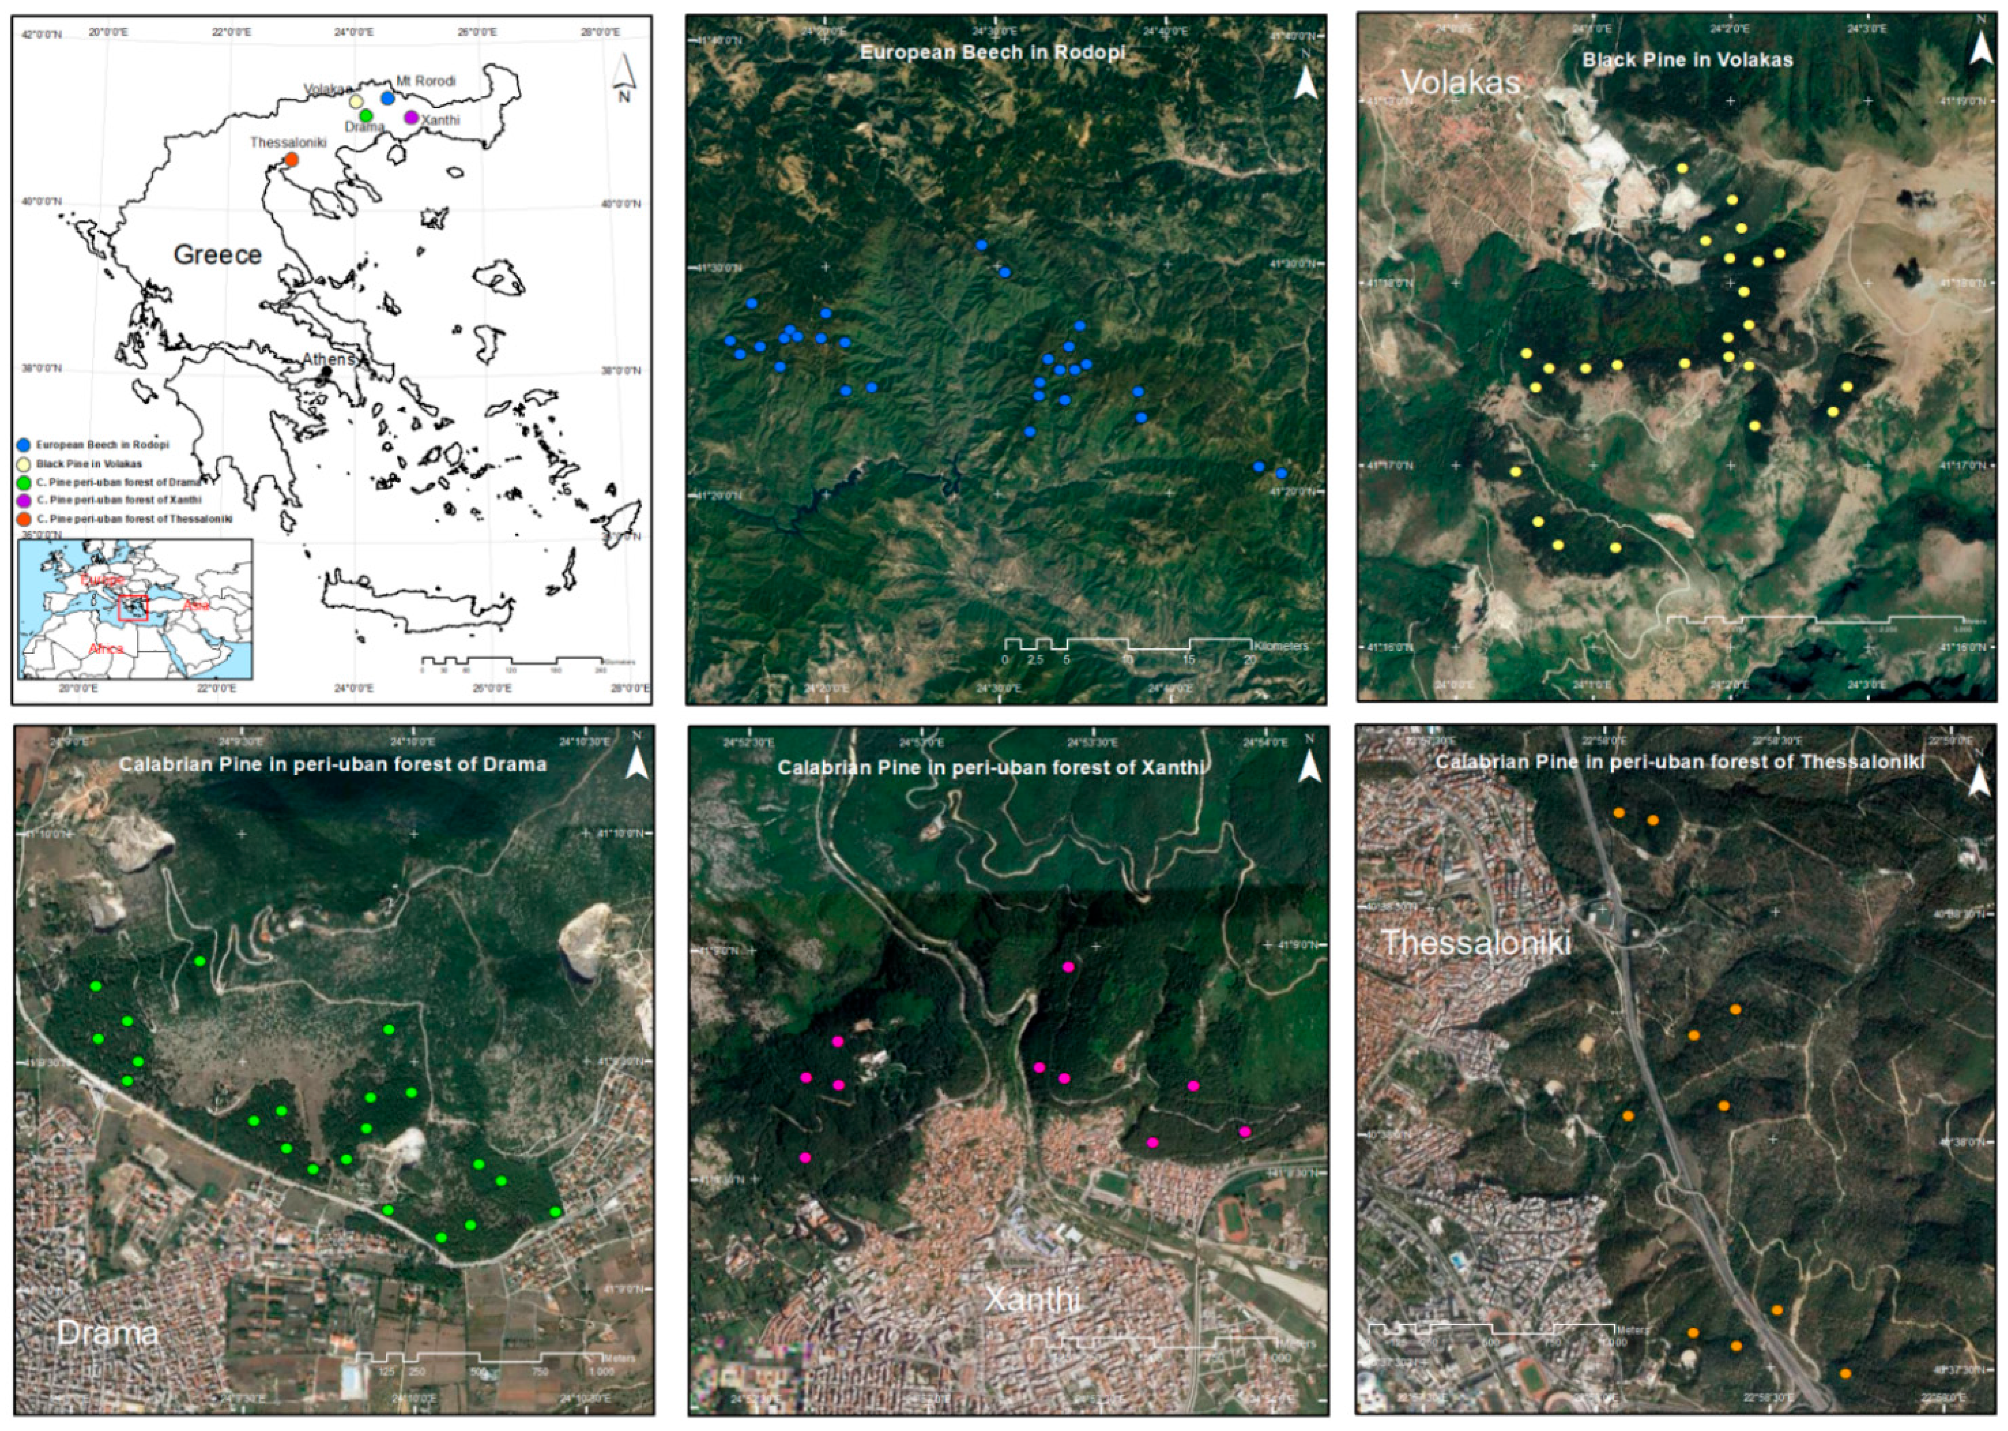
2.1. Data Sampling
2.2. Analysis
Mathematical Expression
3. Results
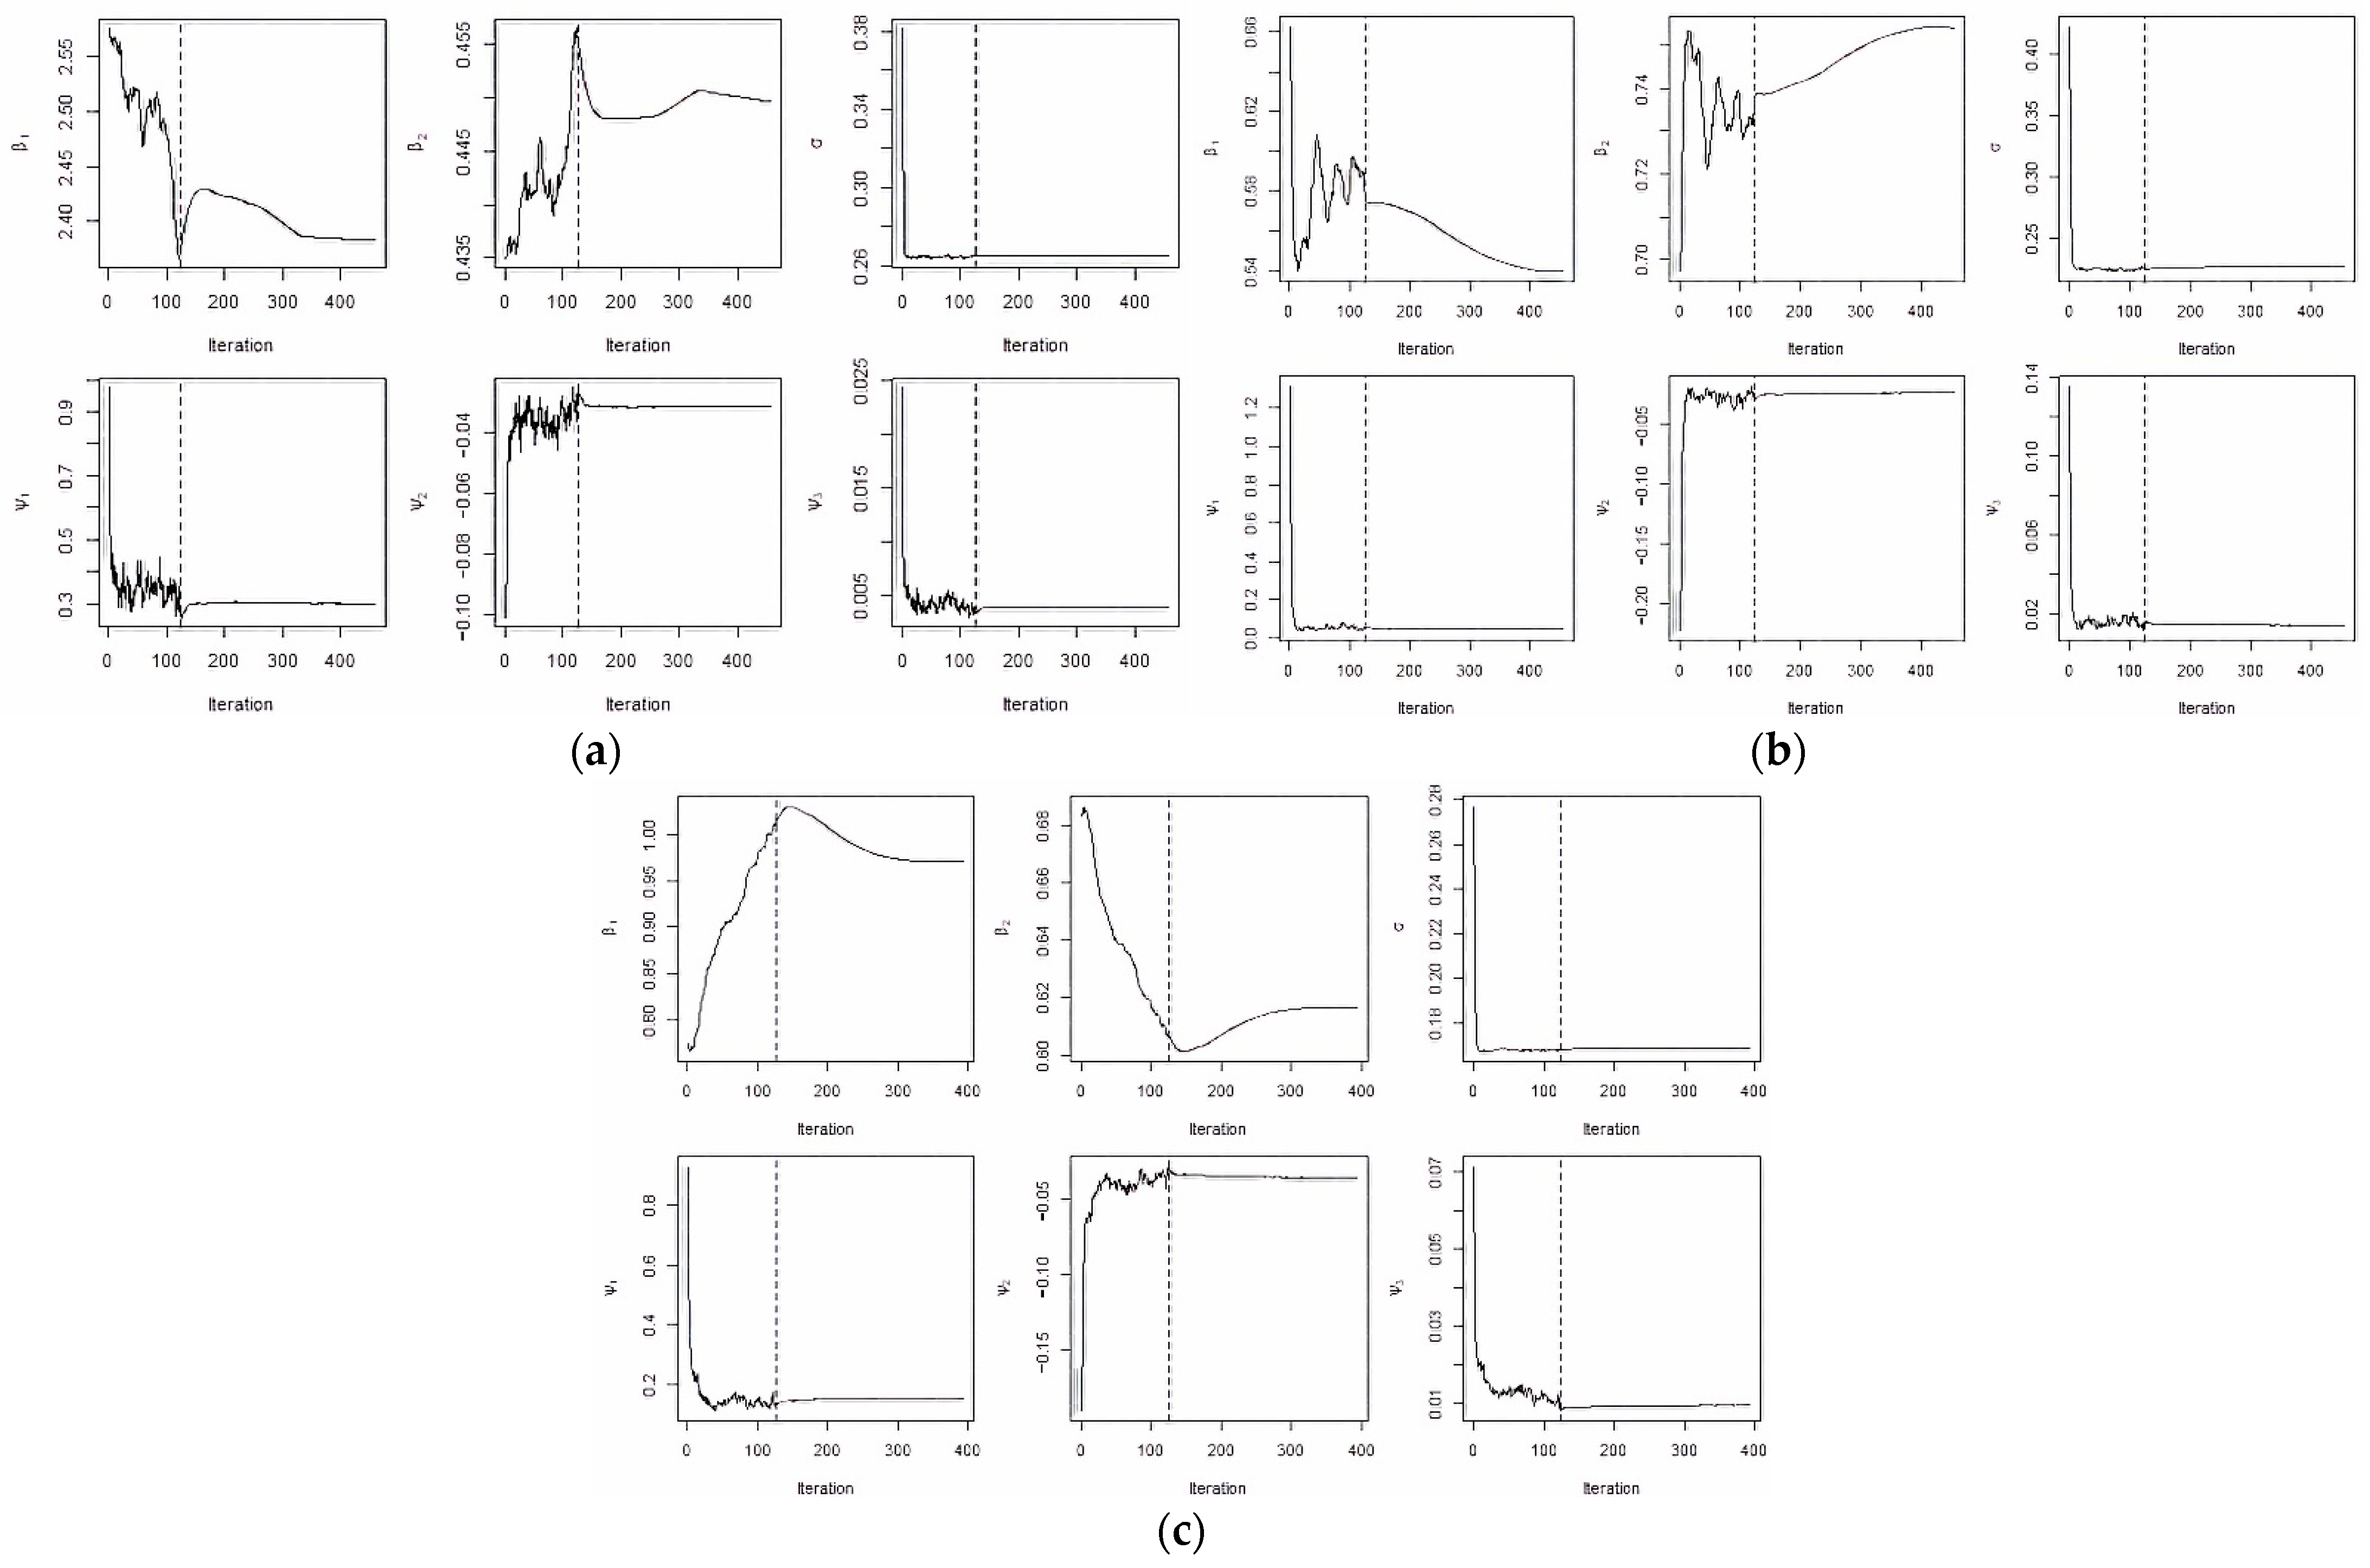
3.1. Convergence
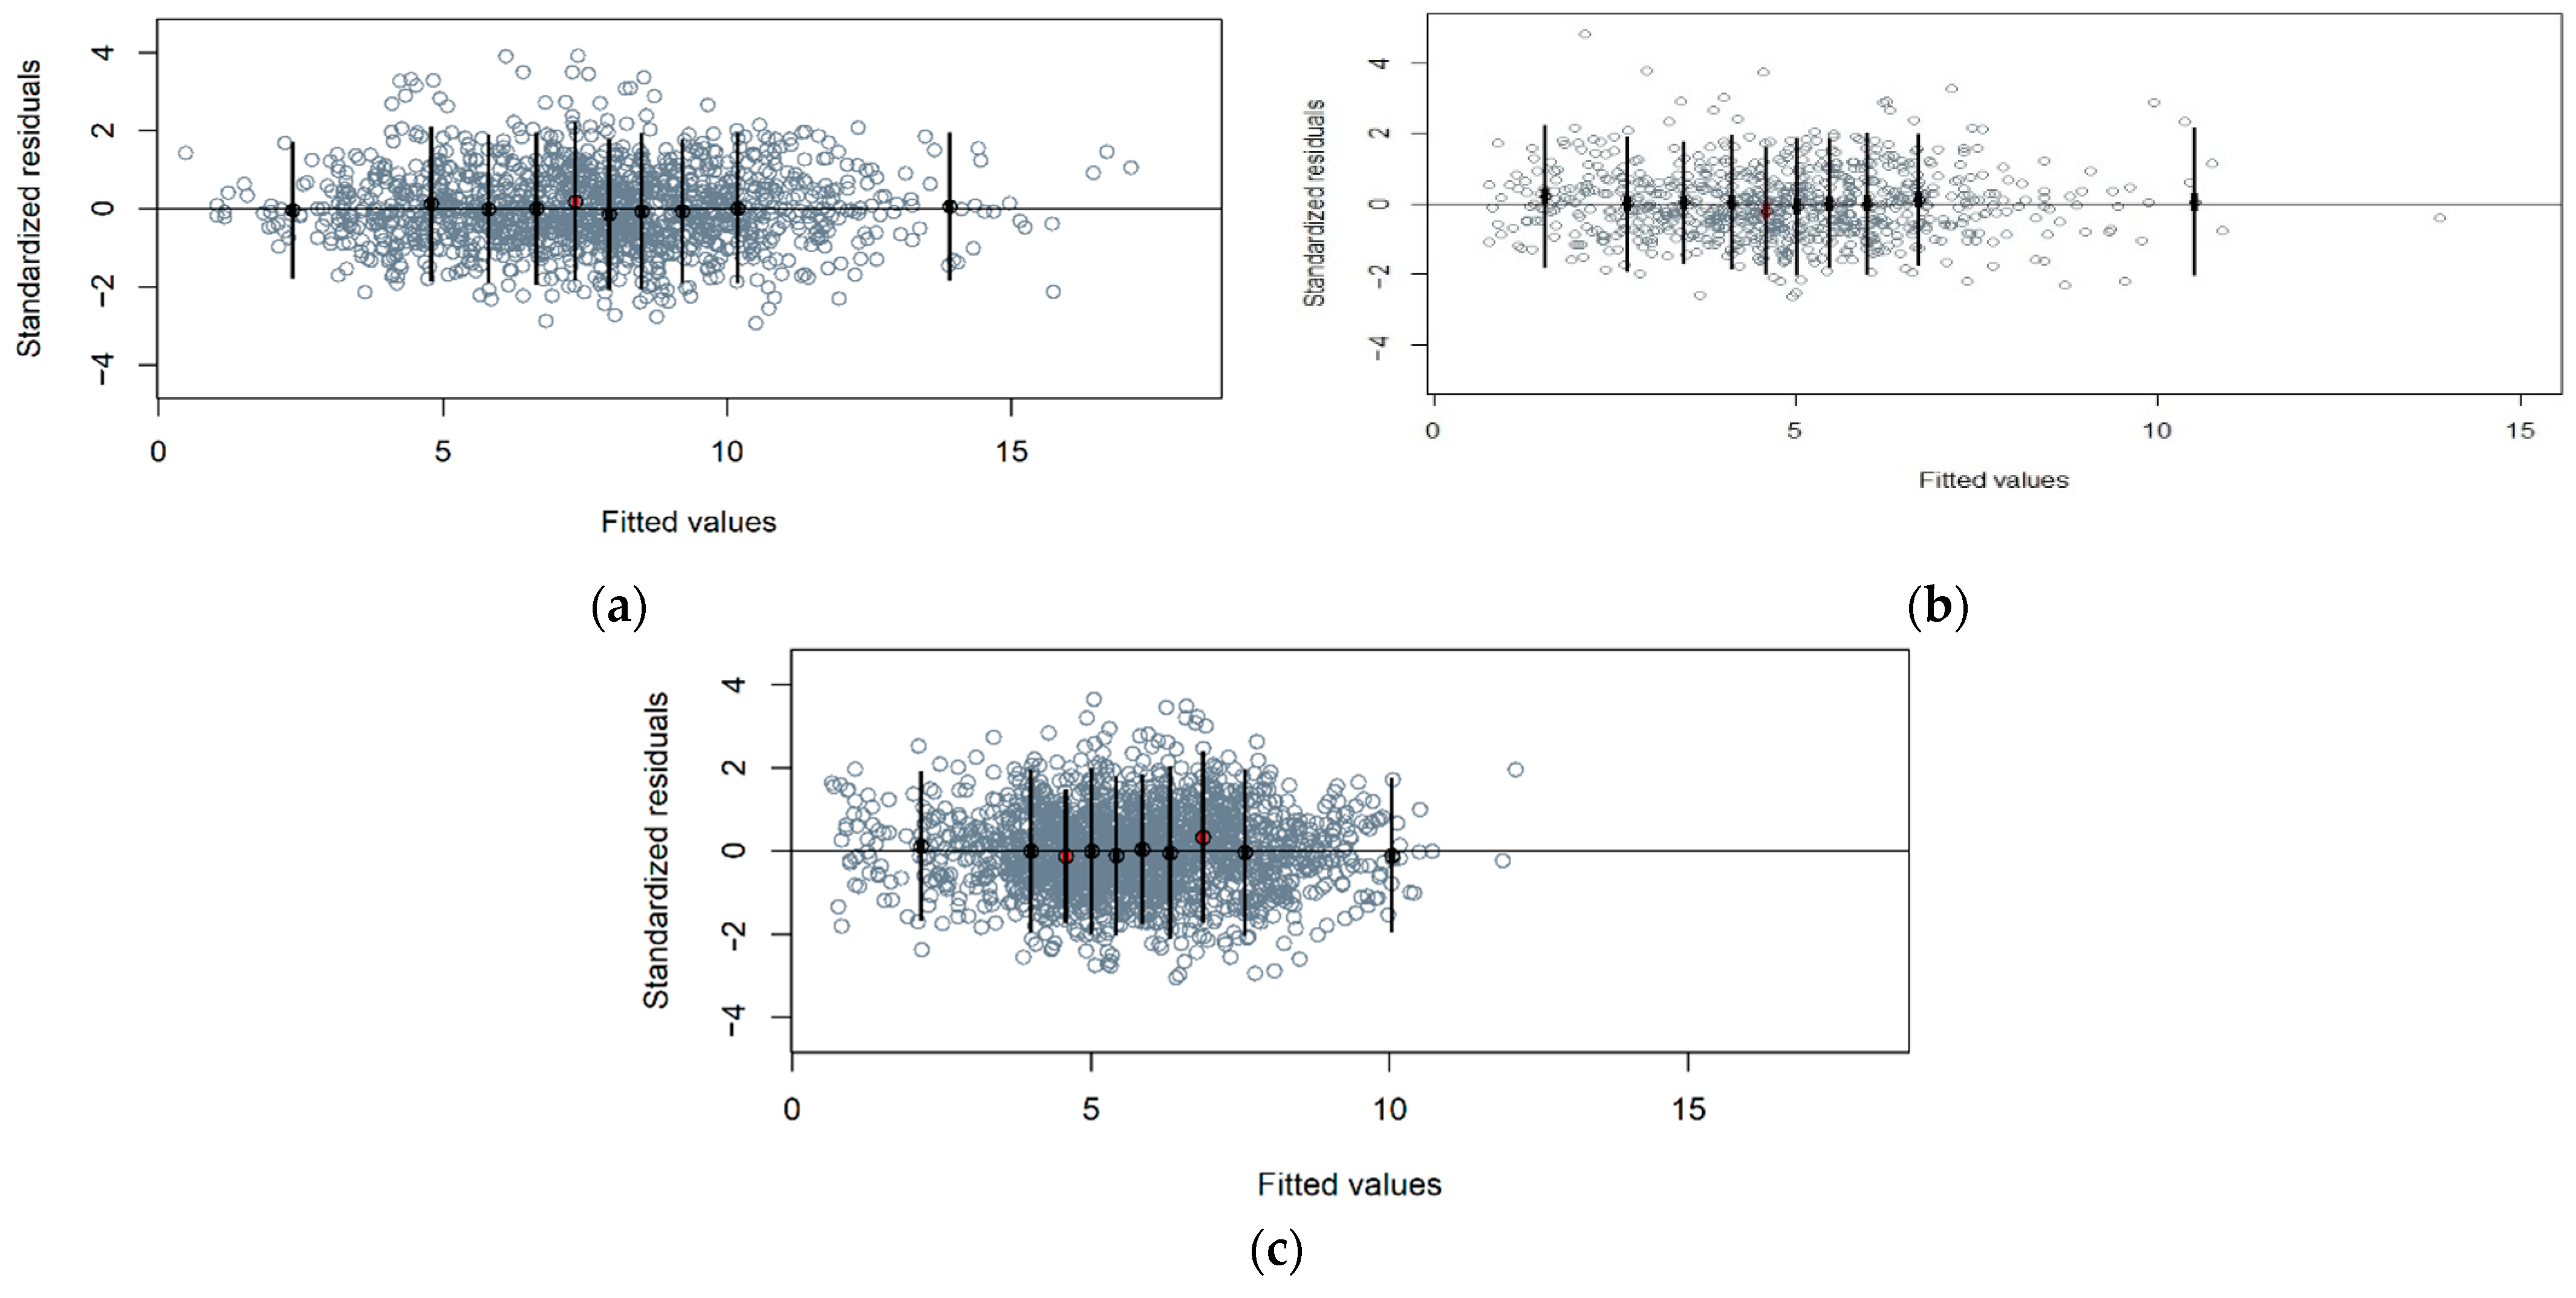
3.2. Fitting Procedure
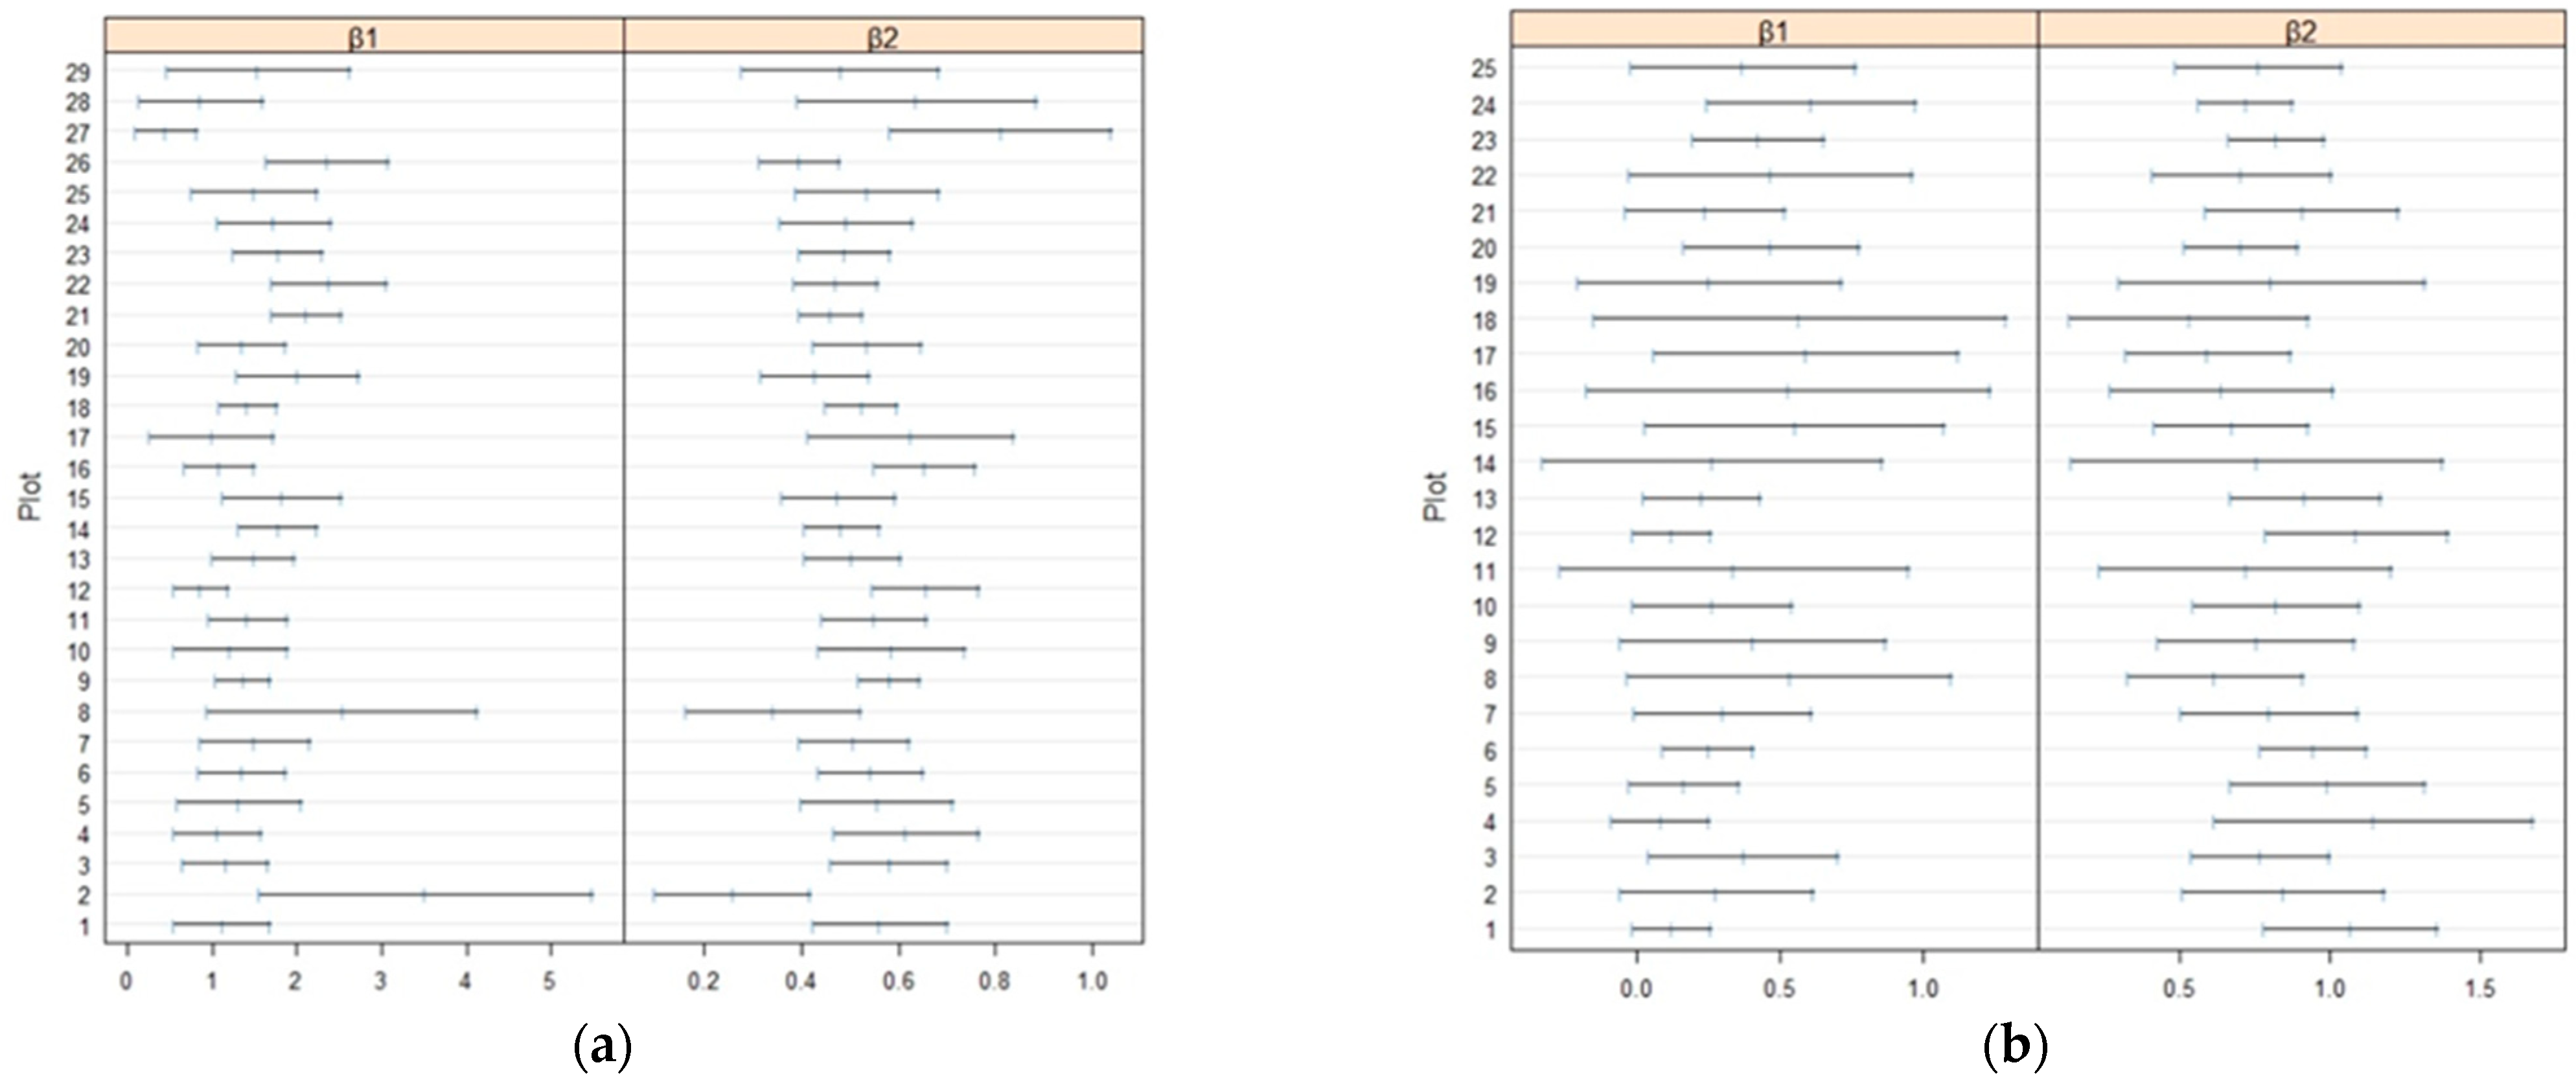
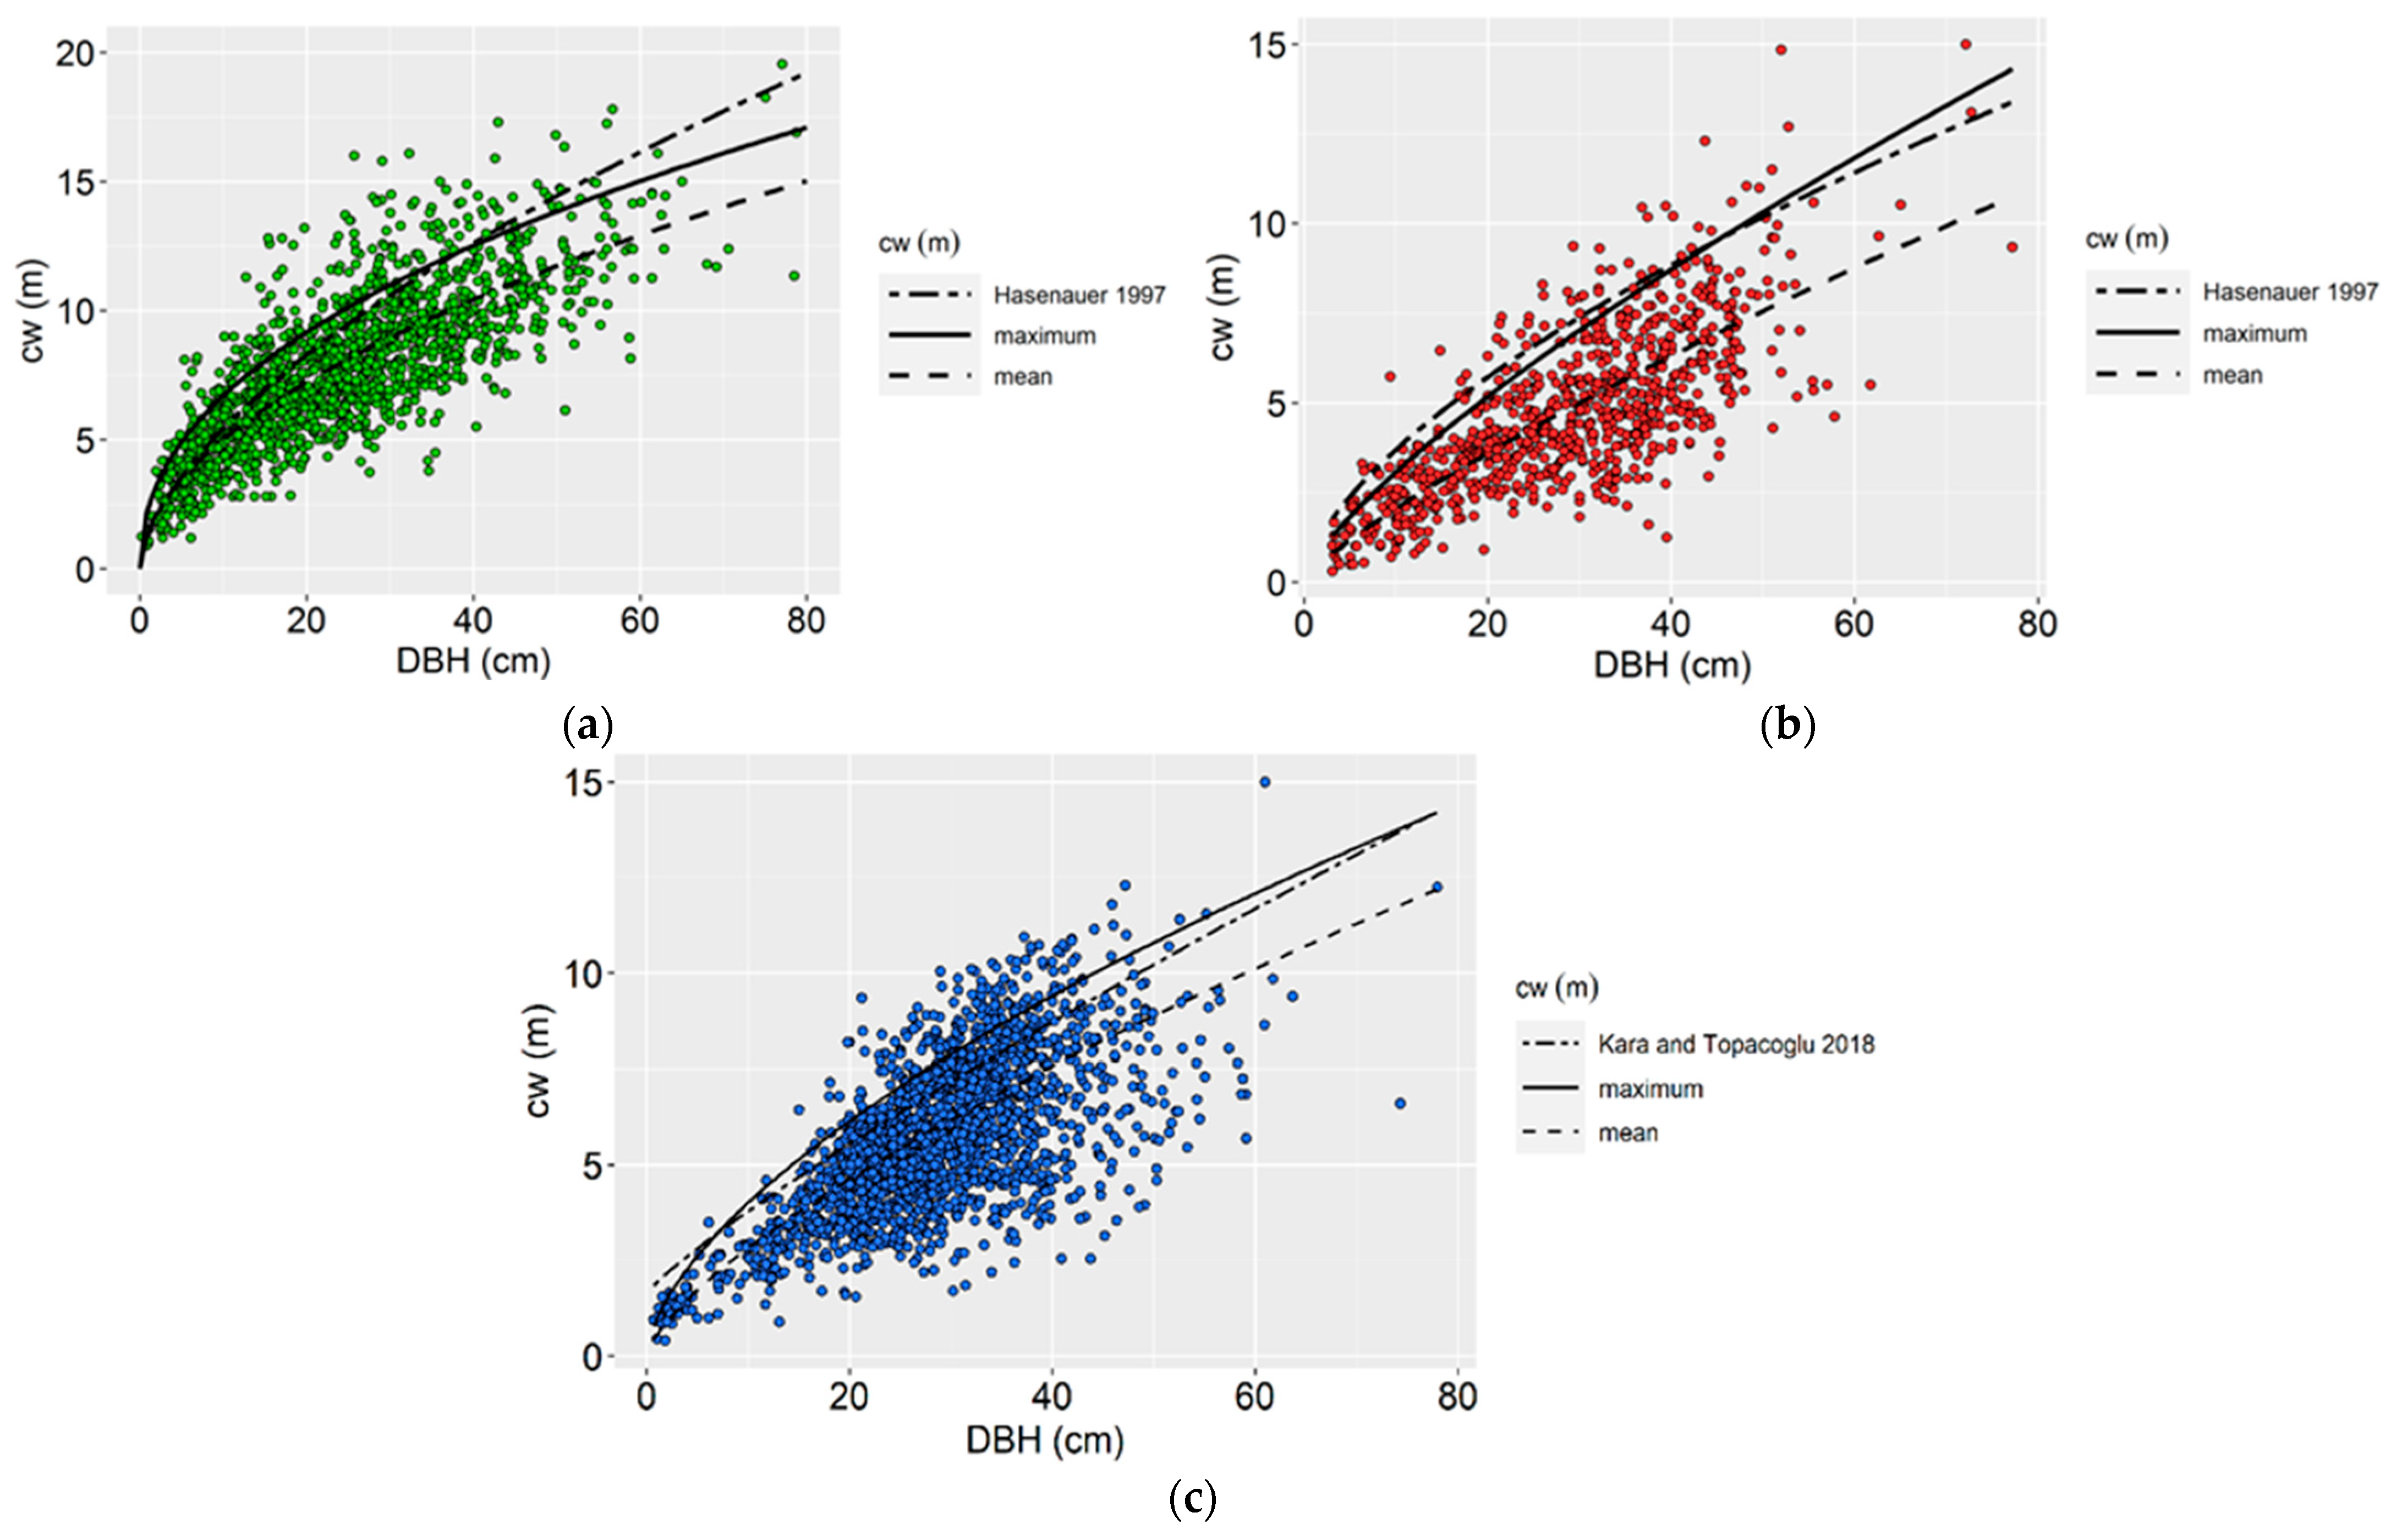
3.3. Graphical Representation
3.4. The Crown Competition Factor (CCF) Estimation
4. Discussion
5. Conclusions
Author Contributions
Funding
Data Availability Statement
Acknowledgments
Conflicts of Interest
References
- Russell, M.; Weiskittel, A. Maximum and Largest Crown Width Equations for 15 Tree Species in Maine. North. J. Appl. For. 2011, 28, 84–91. [Google Scholar] [CrossRef] [Green Version]
- Monserud, R.A.; Sterba, H. A basal area increment model for individual trees growing in even- and uneven-aged forest stands in Austria. For. Ecol. Manag. 1996, 80, 57–80. [Google Scholar] [CrossRef]
- Krajicek, J.E.; Brinkman, K.A.; Gingrich, S.F. Crown competition—A measure of density. For. Sci. 1961, 7, 35–42. [Google Scholar]
- Foli, E.G.; Alder, D.; Miller, H.G.; Swaine, M.D. Modelling growing space requirements for some tropical forest tree species. For. Ecol. Manag. 2003, 173, 79–88. [Google Scholar] [CrossRef]
- Fernandez-Moya, J.; Urbán-Martínez, I. Estimation of crown competition factor for hybrid walnut (Juglans × intermedia) Mj209xRa planted forests in Spain. Ann. Silvic. Res. 2020, 44, 24–29. [Google Scholar] [CrossRef]
- Pretzsch, H. Forest Dynamics, Growth and Yield; Springer: Berlin/Heidelberg, Germany, 2010; p. 664. [Google Scholar]
- Hall, R.B. Use of the crown competition factor concept to select clones and spacings for short-rotation woody crops. Tree Physiol. 1994, 14, 899–909. [Google Scholar] [CrossRef]
- Strub, M.R.; Vasey, R.B.; Burkhart, H.E. Comparison of diameter growth and crown competition factor in Loblolly Pine plantations. For. Sci. 1975, 21, 427–431. [Google Scholar]
- Arney, J.D. A modeling strategy for the growth projection of managed stands. Can. J. For. Res. 1985, 15, 511–518. [Google Scholar] [CrossRef]
- Rijal, B.; Weiskittel, A.R.; Kershaw, J.A. Development of height to crown base models for thirteen tree species of the North American Acadian Region. For. Chron. 2012, 88, 60–73. [Google Scholar] [CrossRef] [Green Version]
- Temesgen, H.; Lemay, V.; Mitchell, S.J. Tree crown ratio models for multi-species and multi-layered stands of southeastern British Columbia. For. Chron. 2005, 81, 133–141. [Google Scholar] [CrossRef]
- Boisvenue, C.; Temesgen, H.; Marshall, P. Selecting a small tree height growth model for mixed-species stands in the southern interior of British Columbia, Canada. For. Ecol. Manag. 2004, 202, 301–312. [Google Scholar] [CrossRef]
- Weiskittel, A.R.; Hann, D.W.; Kerhsaw, J.A., Jr.; Vanclay, J.K. Forest Growth and Yield Modeling; Wiley: Oxford, UK, 2011. [Google Scholar]
- Condés, S.; Sterba, H. Derivation of compatible crown width equations for some important tree species of Spain. For. Ecol. Manag. 2005, 217, 203–218. [Google Scholar] [CrossRef]
- West, P.W.; Ratkowsky, D.A.; Davis, A.W. Problems of hypothesis testing of regressions with multiple measurements from individual sampling units. For. Ecol. Manag. 1984, 7, 207–224. [Google Scholar] [CrossRef]
- West, P.W.; Davis, A.W.; Ratkowsky, D.A. Approaches to regression analysis with multiple measurements from individual sampling units. J. Stat. Comput. Simul. 1986, 26, 149–175. [Google Scholar] [CrossRef]
- Calama, R.; Montero, G. Interregional nonlinear height–diameter model with random coefficients for stone pine in Spain. Can. J. For. Res. 2004, 34, 150–163. [Google Scholar] [CrossRef] [Green Version]
- Kazana, V.; Kazaklis, A.; Raptis, D.; Stamatiou, C. A combined multi-criteria approach to assess forest management sustainability: An application to the forests of Eastern Macedonia & Thrace Region in Greece. Ann. Oper. Res. 2020, 294, 321–343. [Google Scholar] [CrossRef]
- Koenker, R.; Hallock, K.F. Quantile regression. J. Econ. Perspect. 2001, 15, 143–156. [Google Scholar] [CrossRef]
- Galarza, C.E.; Castro, L.M.; Louzada, F.; Lachos, V.H. Quantile regression for nonlinear mixed effects models: A likelihood based perspective. Stat. Pap. 2018, 61, 1281–1307. [Google Scholar] [CrossRef]
- Sun, Y.; Gao, H.; Li, F. Using Linear Mixed-Effects Models with Quantile Regression to Simulate the Crown Profile of Planted Pinus sylvestris var. Mongolica Trees. Forests 2017, 8, 446. [Google Scholar] [CrossRef] [Green Version]
- Delyon, B.; Lavielle, M.; Moulines, E. Convergence of a stochastic approximation version of the EM algorithm. Ann. Stat. 1999, 27, 94–128. [Google Scholar] [CrossRef]
- Paine, D.P.; Hann, D.W. Maximum Crown-Width Equations for Southwestern Oregon Tree Species; Research Paper 46; Forest Research Laboratory, Oregon State University: Corvallis, OR, USA, 1982; p. 21. [Google Scholar]
- Sharma, R.P.; Vacek, Z.; Vacek, S. Individual tree crown width models for Norway spruce and European beech in Czech Republic. For. Ecol. Manag. 2016, 366, 208–220. [Google Scholar] [CrossRef]
- Raptis, D.; Kazana, V.; Kazaklis, A.; Stamatiou, C. A Crown Width-Diameter Model for Natural Even-Aged Black Pine Forest Management. Forests 2018, 9, 610. [Google Scholar] [CrossRef] [Green Version]
- Avsar, M.D. The relationships between diameter at breast height, tree height and crown diameter in Calabrian pines (Pinus brutia ten) of Baskonus mountain, Kahramanmaras, Turkey. J. Biol. Sci. 2004, 4, 437–440. [Google Scholar]
- Pinheiro, J.C.; Bates, D.M. Mixed-Effects Models in S and S-PLUS; Spring: New York, NY, USA, 2000. [Google Scholar]
- Bronisz, K.; Zasada, M. Comparison of Fixed- and Mixed-effects Approaches to Taper Modeling for Scots Pine in West Poland. Forests 2019, 10, 975. [Google Scholar] [CrossRef] [Green Version]
- de Miguel, S.; Mehtätalo, L.; Shater, Z.; Kraid, B.; Pukkala, T. Evaluating marginal and conditional predictions of taper models in the absence of calibration data. Can. J. For. Res. 2012, 42, 1383–1394. [Google Scholar] [CrossRef]
- Hasenauer, H. Dimensional relationships of open-grown trees in Austria. For. Ecol. Manag. 1997, 96, 197–206. [Google Scholar] [CrossRef]
- Kara, F.; Topaçoğlu, O. Onset of canopy closure for black pine, Turkish red pine and Scots pine forests. J. For. Sci. 2018, 64, 224–229. [Google Scholar]
- Alegria, C. Simulation of silvicultural scenarios and economic efficiency for maritime pine (Pinus pinaster Aiton) wood-oriented management in centre inland of Portugal. For. Syst. 2011, 20, 361–378. [Google Scholar]
- Özçelik, R.; Cao, Q.V.; Trincado, G.; Göçer, N. Predicting tree height from tree diameter and dominant height using mixed-effects and quantile regression models for two species in Turkey. For. Ecol. Manag. 2018, 419–420, 240–248. [Google Scholar] [CrossRef]
- Cao, Q.V.; Wang, J. Evaluation of Methods for Calibrating a Tree Taper Equation. For. Sci. 2015, 61, 213–219. [Google Scholar] [CrossRef] [Green Version]
- Scaltsoyiannes, A.; Rohr, R.; Panetsos, K.P.; Tsaktsira, M. Allozyme frequency distributions in 5 European populations of black pine (Pinus nigra Arnold). 1. Estimation of genetic variation within and among populations. 2. Contribution of isozyme analysis to the taxonomic status of the species. Silvae Genet. 1994, 43, 20–30. [Google Scholar]
- Temesgen, H.V.J.; Monleon, V.J.; Hann, D.W. Analysis and comparison of nonlinear tree height prediction strategies for Douglas-fir forests. Can. J. For. Res. 2008, 38, 553–565. [Google Scholar] [CrossRef] [Green Version]
- Raptis, D.I.; Kazana, V.; Onisiforou, N.; Stamatiou, C.; Kazaklis, A. Height Allometry of Pinus nigra Arn. in Troodos National Forest Park, Cyprus. Sustainability 2021, 13, 5998. [Google Scholar] [CrossRef]
- Raptis, D.I.; Kazana, V.; Kazaklis, A.; Stamatiou, C. Mixed-effects height–diameter models for black pine (Pinus nigra Arn.) forest management. Trees 2021, 35, 1167–1183. [Google Scholar] [CrossRef]
- Christopoulou, O.; Polyzos, S.; Minetos, D. Peri-urban and urban forests in Greece: Obstacle or advantage to urban development? Manag. Environ. Qual. 2007, 18, 382–395. [Google Scholar] [CrossRef]
- Castaldi, C.; Vacchiano, G.; Marchi, M.; Corona, P. Projecting Nonnative Douglas Fir Plantations in Southern Europe with the Forest Vegetation Simulator. For. Sci. 2017, 63, 101–110. [Google Scholar] [CrossRef] [Green Version]


| Fagus Sylvatica L. (n = 1414) | Min | Mean | Max | SD |
|---|---|---|---|---|
| DBH (cm) | 0.2 | 24.40 | 88.5 | 14.04 |
| h (m) | 1.5 | 18.27 | 34.4 | 6.85 |
| cw (m) | 0.9 | 7.60 | 19.6 | 2.91 |
| Number of trees per ha | 220 | 488 | 880 | 166 |
| Basal area (m2·ha−1) | 11.59 | 30.32 | 48.52 | 8.75 |
| Pinus nigra Arn. (n = 770) | ||||
| DBH (cm) | 3.1 | 29.17 | 77.2 | 12.71 |
| h (m) | 1.9 | 16.45 | 24.8 | 4.76 |
| cw (m) | 0.3 | 4.78 | 15.0 | 2.27 |
| Number of trees per ha | 320 | 616 | 1060 | 165 |
| Basal area (m2·ha−1) | 26.87 | 48.94 | 82.50 | 12.85 |
| Pinus brutia Ten. (n = 1880) | ||||
| DBH (cm) | 0.7 | 28.15 | 77.9 | 9.84 |
| h (m) | 1.7 | 14.44 | 21.7 | 4.12 |
| cw (m) | 0.4 | 6.42 | 15.0 | 2.31 |
| Number of trees per ha | 210 | 498 | 750 | 129 |
| Basal area (m2·ha−1) | 11.39 | 32.87 | 60.88 | 12.71 |
| Model Form β1DBHβ2 | |||
|---|---|---|---|
| Fagus sylvatica | Pinus nigra | Pinus brutia | |
| Maximum Crown Width Model | |||
| β1 (SE) | 2.38356 (0.0692) | 0.53990 (0.0377) | 0.96984 (0.0423) |
| β2 (SE) | 0.44960 (0.0083) | 0.75397 (0.0231) | 0.61605 (0.0091) |
| var(b1) | 0.29972 | 0.04670 | 0.15569 |
| var(b2) | 0.00392 | 0.01397 | 0.09540 |
| cov(b1,b2) | −0.03149 | −0.02432 | −0.03528 |
| σ2 | 0.07032 | 0.05151 | 0.02862 |
| AIC | 6017.14 | 3069.26 | 6375.88 |
| Log likelihood | −3002.57 | −1528.63 | −3181.94 |
| Percentile | 90 | 90 | 90 |
| Average (Mean) Crown Width Model | |||
| β1 (SE) | 1.49139 (0.0810) | 0.31579 (0.0275) | 0.54825 (0.0356) |
| β2 (SE) | 0.52723 (0.0148) | 0.81158 (0.0245) | 0.71199 (0.0174) |
| var(b1) | 0.11863 | 0.00489 | 0.02402 |
| var(b2) | 0.00338 | 0.00293 | 0.00413 |
| cov(b1,b2) | −0.01821 | −0.00265 | −0.00799 |
| σ2 | 0.59047 | 0.06751 | 0.04278 |
| k | 0.21597 | 0.47467 | 0.47917 |
| AIC | 5201.23 | 2561.58 | 5474.78 |
| Log likelihood | −2593.61 | −1273.79 | −2730.39 |
| Fitting index | 0.74459 | 0.68786 | 0.74843 |
| Root mean square error | 1.4702 | 1.2649 | 1.0194 |
| Bias | 0.0000 | −0.0068 | −0.0033 |
| Species | Crown Competition Factor (CCF) | |||
|---|---|---|---|---|
| Min. | Mean | Max. | SD | |
| Fagus sylvatica | 218.3 | 378.5 | 598.6 | 89.9 |
| Pinus nigra | 138.8 | 245.2 | 388.8 | 58.9 |
| Pinus brutia | 86.5 | 214.2 | 376.4 | 65.9 |
Publisher’s Note: MDPI stays neutral with regard to jurisdictional claims in published maps and institutional affiliations. |
© 2022 by the authors. Licensee MDPI, Basel, Switzerland. This article is an open access article distributed under the terms and conditions of the Creative Commons Attribution (CC BY) license (https://creativecommons.org/licenses/by/4.0/).
Share and Cite
Raptis, D.I.; Kazana, V.; Kechagioglou, S.; Kazaklis, A.; Stamatiou, C.; Papadopoulou, D.; Tsitsoni, T. Nonlinear Quantile Mixed-Effects Models for Prediction of the Maximum Crown Width of Fagus sylvatica L., Pinus nigra Arn. and Pinus brutia Ten. Forests 2022, 13, 499. https://doi.org/10.3390/f13040499
Raptis DI, Kazana V, Kechagioglou S, Kazaklis A, Stamatiou C, Papadopoulou D, Tsitsoni T. Nonlinear Quantile Mixed-Effects Models for Prediction of the Maximum Crown Width of Fagus sylvatica L., Pinus nigra Arn. and Pinus brutia Ten. Forests. 2022; 13(4):499. https://doi.org/10.3390/f13040499
Chicago/Turabian StyleRaptis, Dimitrios I., Vassiliki Kazana, Stavros Kechagioglou, Angelos Kazaklis, Christos Stamatiou, Dimitra Papadopoulou, and Thekla Tsitsoni. 2022. "Nonlinear Quantile Mixed-Effects Models for Prediction of the Maximum Crown Width of Fagus sylvatica L., Pinus nigra Arn. and Pinus brutia Ten." Forests 13, no. 4: 499. https://doi.org/10.3390/f13040499
APA StyleRaptis, D. I., Kazana, V., Kechagioglou, S., Kazaklis, A., Stamatiou, C., Papadopoulou, D., & Tsitsoni, T. (2022). Nonlinear Quantile Mixed-Effects Models for Prediction of the Maximum Crown Width of Fagus sylvatica L., Pinus nigra Arn. and Pinus brutia Ten. Forests, 13(4), 499. https://doi.org/10.3390/f13040499