Article

Microsatellite Analysis Revealing High Genetic Diversity of the Chestnut Blight Fungus in South Tyrol (Northern Italy)

1
Faculty of Science and Technology, Free University of Bozen-Bolzano, Universitätsplatz 5, 39100 Bozen-Bolzano, Italy
2
Sustainable Forest Management Research Institute, Universidad de Valladolid, Avda. de Madrid, 34004 Palencia, Spain
*
Author to whom correspondence should be addressed.
Forests 2022, 13(2), 344; https://doi.org/10.3390/f13020344
Submission received: 16 January 2022 / Revised: 15 February 2022 / Accepted: 16 February 2022 / Published: 18 February 2022
(This article belongs to the Section Forest Health)

Abstract

:
Cryphonectria parasitica, which causes chestnut blight, is one of the most important pathogens of forest trees. In Europe, mycovirus-mediated biocontrol is the most efficient method to control the disease but can be impeded by the lack of information about the population structure of the fungus within a region. In particular, sexual reproduction and the new introduction of the pathogen can complicate biocontrol strategies. For this reason, this study aimed to determine the population structure of C. parasitica, which causes chestnut blight, in the northern Italian region of South Tyrol, using eleven multilocus microsatellite markers. Fifty-one haplotypes were found across South Tyrol, belonging to three divergent clusters. Recombinant genotypes demonstrated that sexual reproduction occurs across the different clusters. The most dominant genotypes in the region were also the most dominant in neighboring areas, such as Switzerland, northern Italy and France. All of the clusters from South Tyrol were related to the Italian genotype pool and are thought to have been introduced from northern Italian and other European populations due to naturally occurring gene flow or human-mediated introduction. At least three separate introduction events of C. parasitica might have happened in South Tyrol that could be separated by time. This study demonstrated a high genetic diversity of C. parasitica in South Tyrol and helped to shed light on the sexual reproduction and introduction events in the local populations.

1. Introduction

Fungal pathogens have been causing severe damage to forests, resulting in ecological and socio-economic losses. Driven by globalization, the number of invasive fungal pathogen species that cause emerging diseases of forest trees has significantly increased over recent decades [1,2]. Despite the severe impact of biological invasions, many questions remain open about how such events occur and what makes them successful [3]. Ash dieback, chestnut blight and Dutch elm disease are chief examples of invasive fungal diseases in forest ecosystems [4].
Cryphonectria parasitica (Murr.) Barr, the causal agent of chestnut blight, is an ascomycete fungus that provokes considerable losses in European and American chestnut tree species [5]. The pathogen induces perennial lesions in the form of bark cankers, which lead to wilting and the death of plant parts above the infection point. The disease was responsible for the loss of approximately four billion chestnut trees in North America, making American chestnut (Castanea dentata) an endangered species. Consequently, the epidemic of chestnut blight significantly affected the vegetation pattern in the areas that were hit by the disease [4]. For example, C. dentata had been a major species in the mountains of North Carolina but was largely replaced by other species. In Europe, the pathogen is thought to have been introduced from North America in the 1930s near the port of Genoa (Italy) and it rapidly became established in different European chestnut tree (Castanea sativa) populations [6]. The fungus is now present in all chestnut-growing countries in Europe and remains one of the biggest threats to this species of tree. Shortly after the introduction of chestnut blight to Europe, it was discovered that infected trees could recover due to the spread of hypovirulent pathogen strains. The phenomenon of hypovirulence is characterized by the infection of the fungus with a mycovirus, Cryphonectria hypovirus 1 (CHV-1), which reduces its ability to cause disease. Consequently, hypovirulent strains of C. parasitica have been exploited as a successful biocontrol agent [7,8].
Studying the population genetics of invasive pathogens has helped to reconstruct their introduction routes [9]. It has also contributed to the understanding of the patterns of pathogen migration, both worldwide and within countries or regions [9,10,11,12]. Studying the population genetics of C. parasitica could have ecological and practical implications because the knowledge of the genetic structure of the populations could aid in adopting control measures based on hypovirulence within a region [13]. The determination of vegetative compatibility (VC) phenotypes, through both the visual inspection of hyphal anastomosis in co-culturing assays or the direct genotyping of six unlinked bi-allelic vic loci, has been widely used to determine the genetic structure of C. parasitica populations [14,15,16,17,18,19,20,21,22,23,24,25,26,27,28,29,30,31,32,33,34]. VC-type markers appear to be particularly useful for practical biocontrol applications because CHV-1 is primarily transmitted between the same VC-type strains. However, these markers have several drawbacks in the estimation of the genetic structure of the populations. Firstly, co-culturing assays are laborious because they involve 64 tester strains [35]. Each fungal isolate to be tested must be co-cultured with each of the 64 tester strains to visually observe compatibility or incompatibility. Therefore, this approach is less suitable for the analysis of a larger number of samples. Phenotyping is also prone to human error, especially in the case of VC, because visual assessment is not always straightforward and some studies have found more than 64 VC types [21,22]. This problem was solved after the implementation of a genotyping protocol that was based on several multiplex polymerase chain reactions (PCR) that directly target vegetative incompatibility loci (vic) [23]. Still, it needs to be considered that the mycoviruses that decrease the virulence of the fungus are primarily transmitted between the same VC strains [13]. Rare VC types within a population have a selective advantage over others because they have a lower probability of being infected by mycoviruses than the dominant VC types [36]. Due to the selection pressure, VC-type markers are less suitable for estimating the genetic diversity and variability of the fungus compared to neutral markers. On the other hand, microsatellite loci are very useful in studying population structures and understanding epidemiological processes because of their co-dominance, neutrality and reproducibility and their high level of polymorphism [37,38,39]. In the study of fungi, microsatellites contribute to a better understanding of sexual reproduction processes versus clonality or parasexual events (such as hyphal anastomosis) in natural populations [40]. Furthermore, microsatellite loci are also considered robust markers for studying the migration history of invasive fungal pathogens, including introduction events [9,11,37].
Cryphonectria parasitica populations in South Tyrol (Autonomous Province of Bozen-Bolzano, Italy) were recently characterized based on the genotyping of vic loci, the mating-type locus and DNA sequencing of the internal transcribed spacer (ITS) region [41]. A high degree of VC-type diversity was found in South Tyrol with a mating-type ratio of close to 1:1 that indicated the high potential for sexual reproduction in the region. ITS sequence analysis further pointed to at least two introduction events of the fungus in the region. Therefore, this study tested the hypothesis of the multiple introductions and frequent sexual reproduction of C. parasitica in South Tyrol. The aim of this work was to study the molecular genetic diversity of C. parasitica based on multilocus microsatellite loci to determine the genetic structure of the subpopulations. Particular focus was placed on studying the recombination in the local populations of C. parasitica and on reconstructing the introduction of the fungus to South Tyrol.

2. Materials and Methods

2.1. Sampling and Isolation of C. parasitica

Bark samples from chestnut blight cankers were collected from 35 chestnut stands and one forest population in South Tyrol (northern Italy) in spring 2017 and in the winters of 2017/2018 and 2018/2019 (Supplementary Table S1). In the laboratory, the fungus was isolated on a potato dextrose agar (PDA) medium. A total of 276 isolates of C. parasitica belonging to all chestnut-growing areas of South Tyrol were included in this study. Detailed information on the study area, sampling procedure and the fungal isolation protocol can be found in [41].

2.2. DNA Extraction and Polymerase Chain Reaction (PCR)

DNA was extracted according to the protocol developed by Cassago et al. [42] with minor modifications. Both genomic microsatellite (CPG3, CPG4, CPG6, CPG14 and IO7-650) and expressed sequence tag microsatellite (EST) (CPE1, CPE3, CPE5, CPE8, CPSI006 and CPSI009) markers were used to investigate the molecular genetic composition of the C. parasitica that was present in South Tyrol [37,43,44]. Three multiplex PCR reactions of two to four loci (reaction 1: CPE3 and CPG6; reaction 2: CPE8, CPG3 and I07-650; reaction 3: CPE1, CPE5, CPG4 and CPG14) and two reactions with single primer sets (CPS1006 and CPS1009) were performed (Table 1). All forward primers were labeled at the 5′ end with a fluorescent dye (either 6-FAM or HEX). PCR amplification was carried out in a total volume of 20 µL, which contained 10 µL of 2X PCRBIO HS Taq Mix (PCR Biosystems, London, United Kingdom), varied concentrations of primers (Table 1), 1 µL of DNA and nuclease-free water to adjust the final volume. The PCR conditions were the following: an initial denaturation step of 95 °C for 10 min followed by 27 cycles of 94 °C for 30 s, 58 °C for 1 min 30 s and 72 °C for 1 min 30 s. The final extension step was performed at 72 °C for 30 min. The PCR product of CPSI006 was added to reaction 1, whereas the amplicon of CPSI009 was added to reaction 2 (Table 1). All PCR products were diluted tenfold in nuclease-free water. The capillary electrophoresis of the amplified PCR products was performed by Ecogenics GmbH (Balgach, Switzerland) on a DNA analyzer (Applied Biosystems 3730XL) with an internal size standard, ILS600-CXR (Promega). The conditions of the electrophoretic separation were the following: injection time, 10 s; injection voltage, 1.6 kV; run time, 35 min; run voltage, 15 kV; capillary length, 50 cm; polymer, POP7; filter, Dye Set Powerplex 4C Matrix Standard (Promega).

2.3. Data Analysis

The raw fragment data obtained from capillary electrophoresis were imported to Geneious Prime, version 2021.0.3 (Biomatters Ltd., Auckland, New Zealand) with the microsatellite plugin installed. Each peak was manually checked and the peak calls were edited in case of incorrect assignment by the software. Peaks were binned using the same software and allele call data were exported in a comma-separated value (.csv) file. The allele calls were re-checked to confirm the correct assignment of the fragments. Additionally, 5% of the data was randomly selected to be re-examined by another operator to ensure the correct assignments of alleles.
For each district, the total number of alleles and their frequencies were estimated using the Excel add-in GenAIEx, version 6.502 [45]. Distinct multilocus genotypes (haplotypes) at 11 microsatellite loci were determined with the Excel add-in Haplotype analysis, version 1.05 [46], by excluding samples with missing data. The program assigned each distinct multilocus haplotype with a consecutive number, which was preceded by the code “MSH” (microsatellite haplotype: for example, MSH1). The genetic diversity indices (Shannon diversity index (H′), evenness index (E) and Simpson index (D)) were calculated using GenClone, version 2.0 [47].
The contribution of sexual reproduction to the haplotypic diversity was studied by calculating (Pgen) and (Psex) values for all haplotypes that were found more than once, as described by Wang et al. [48]. Pgen is the probability that a multilocus genotype was obtained through sexual reproduction, whereas Psex is the probability that the second occurrence of the haplotype was due to sexual reproduction. Pgen and Psex were calculated using GenClone [47]. The Pareto distribution and its coefficient (C), which better describe the distribution of genotypes, their diversity, evenness and clonality, were also calculated using GenClone [47]. The occurrence of random sexual reproduction was assessed by calculating the index of multilocus linkage disequilibrium (rd) using Multilocus, version 1.3 [49]. The absence of linkage disequilibrium, rd = 0 (departure from the null hypothesis), was assessed by permuting alleles between individuals independently for each locus [50] through Multilocus [49].
The existence of divergent genetic pools of C. parasitica present in South Tyrol was tested using a model-based Bayesian clustering method, as implemented in Structure, version 2.3 [51,52]. The probability of the admixture model was tested for one to eight clusters (i.e., K = 1 to K = 8). Each model was simulated five times, with a burn-in of 100,000 iterations and a run length of 100,000 iterations after the burn-in. The results from the Structure software were uploaded to Structure Harvester (http://taylor0.biology.ucla.edu/structureHarvester, accessed on 1 October 2021) [53] to assess the delta K values, as described by Evanno et al. (2005) [54]. The number of groups (K) best represented by the data was determined based on the delta K values and the mean probability of the data [54]. Genetic distances within and among the clusters were also calculated in Structure. A Principal Coordinate Analysis (PCoA) based on genetic distances was performed in GenAlEx. A median-joining haplotype network of all genotypes of C. parasitica present in South Tyrol was drawn using Network, version 10.2 [55]. The cluster information obtained from the Structure analysis was also indicated in the PCoA plots and the haplotype network.
The multilocus microsatellite data of the C. parasitica from South Tyrol were compared to data from other regions, such as Switzerland [56], France [11], northern Italy [57] and other countries [12]. In order to compare data obtained in different laboratories, the allele lengths of the datasets had to be aligned, which was carried out by following the procedure described by Baric et al. [58]. Conversion values were determined by comparing the most dominant genotypes found in our study to the genotypes found in the other regions (Table 2). The dataset consisted of eight loci that were common in all previous studies and included a total of 810 isolates from different countries. EDENetwork [59] was used to construct a minimum spanning network and a PCoA analysis was performed with the global dataset.

3. Results

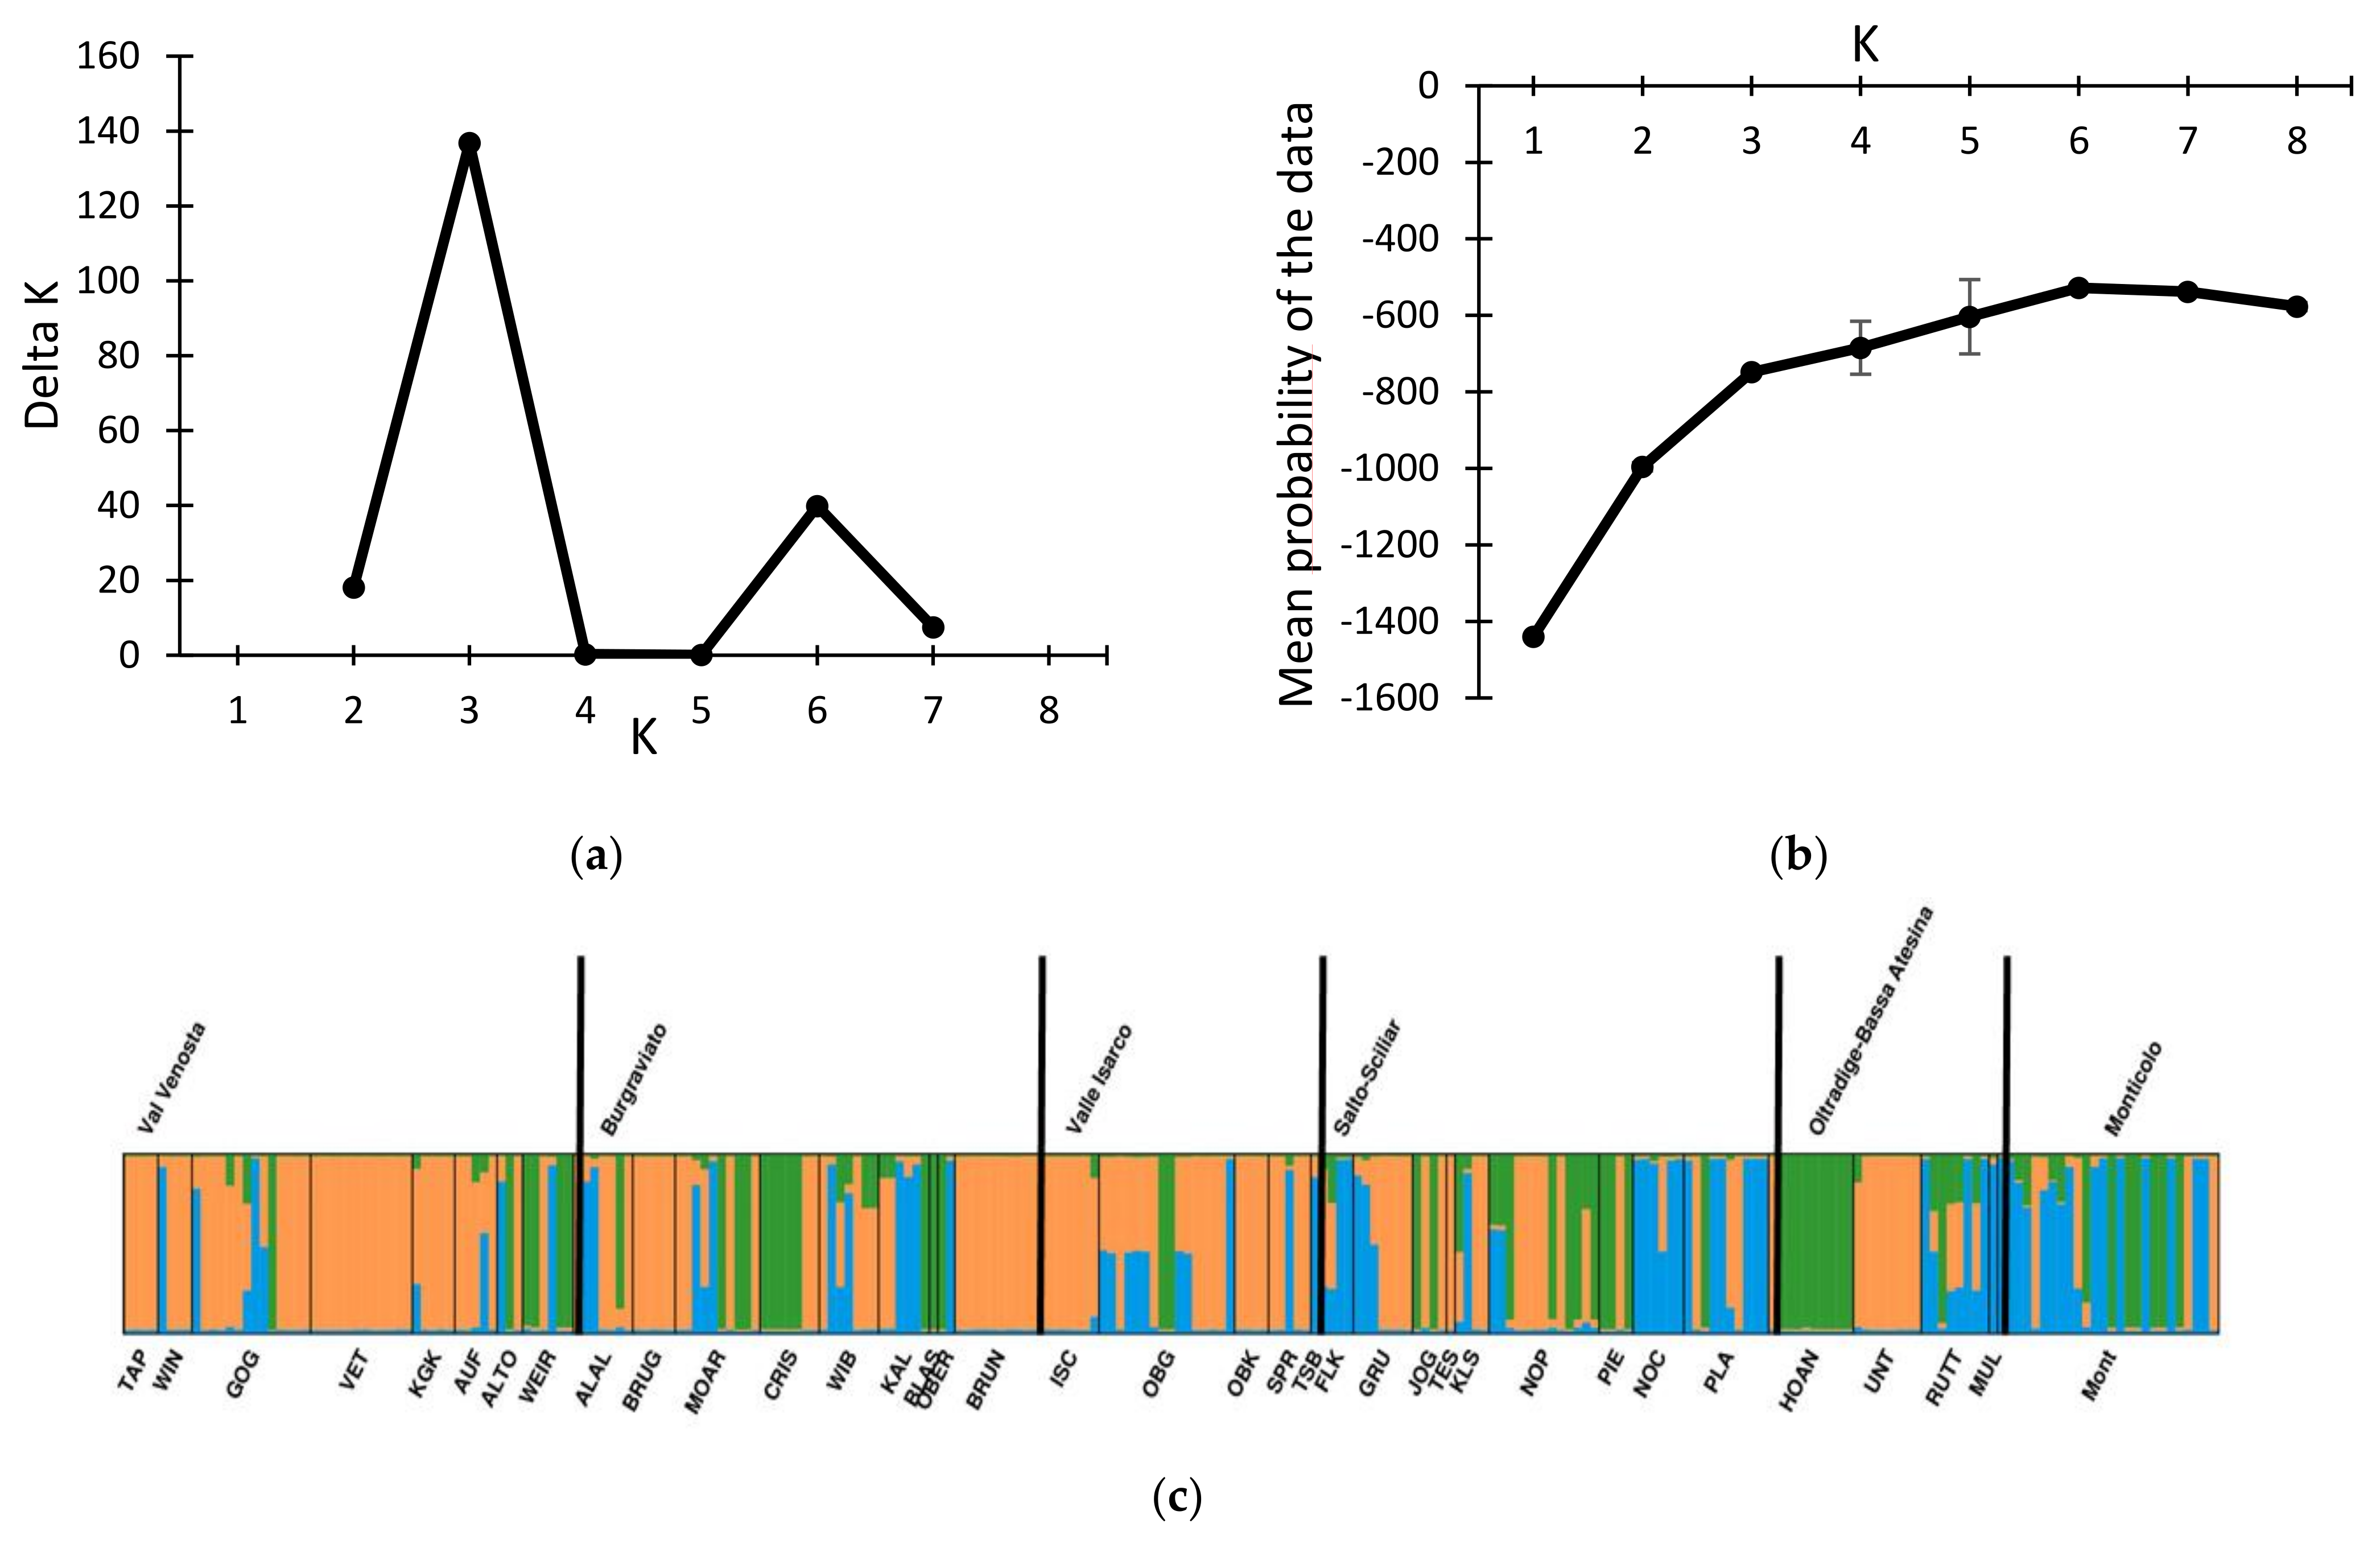
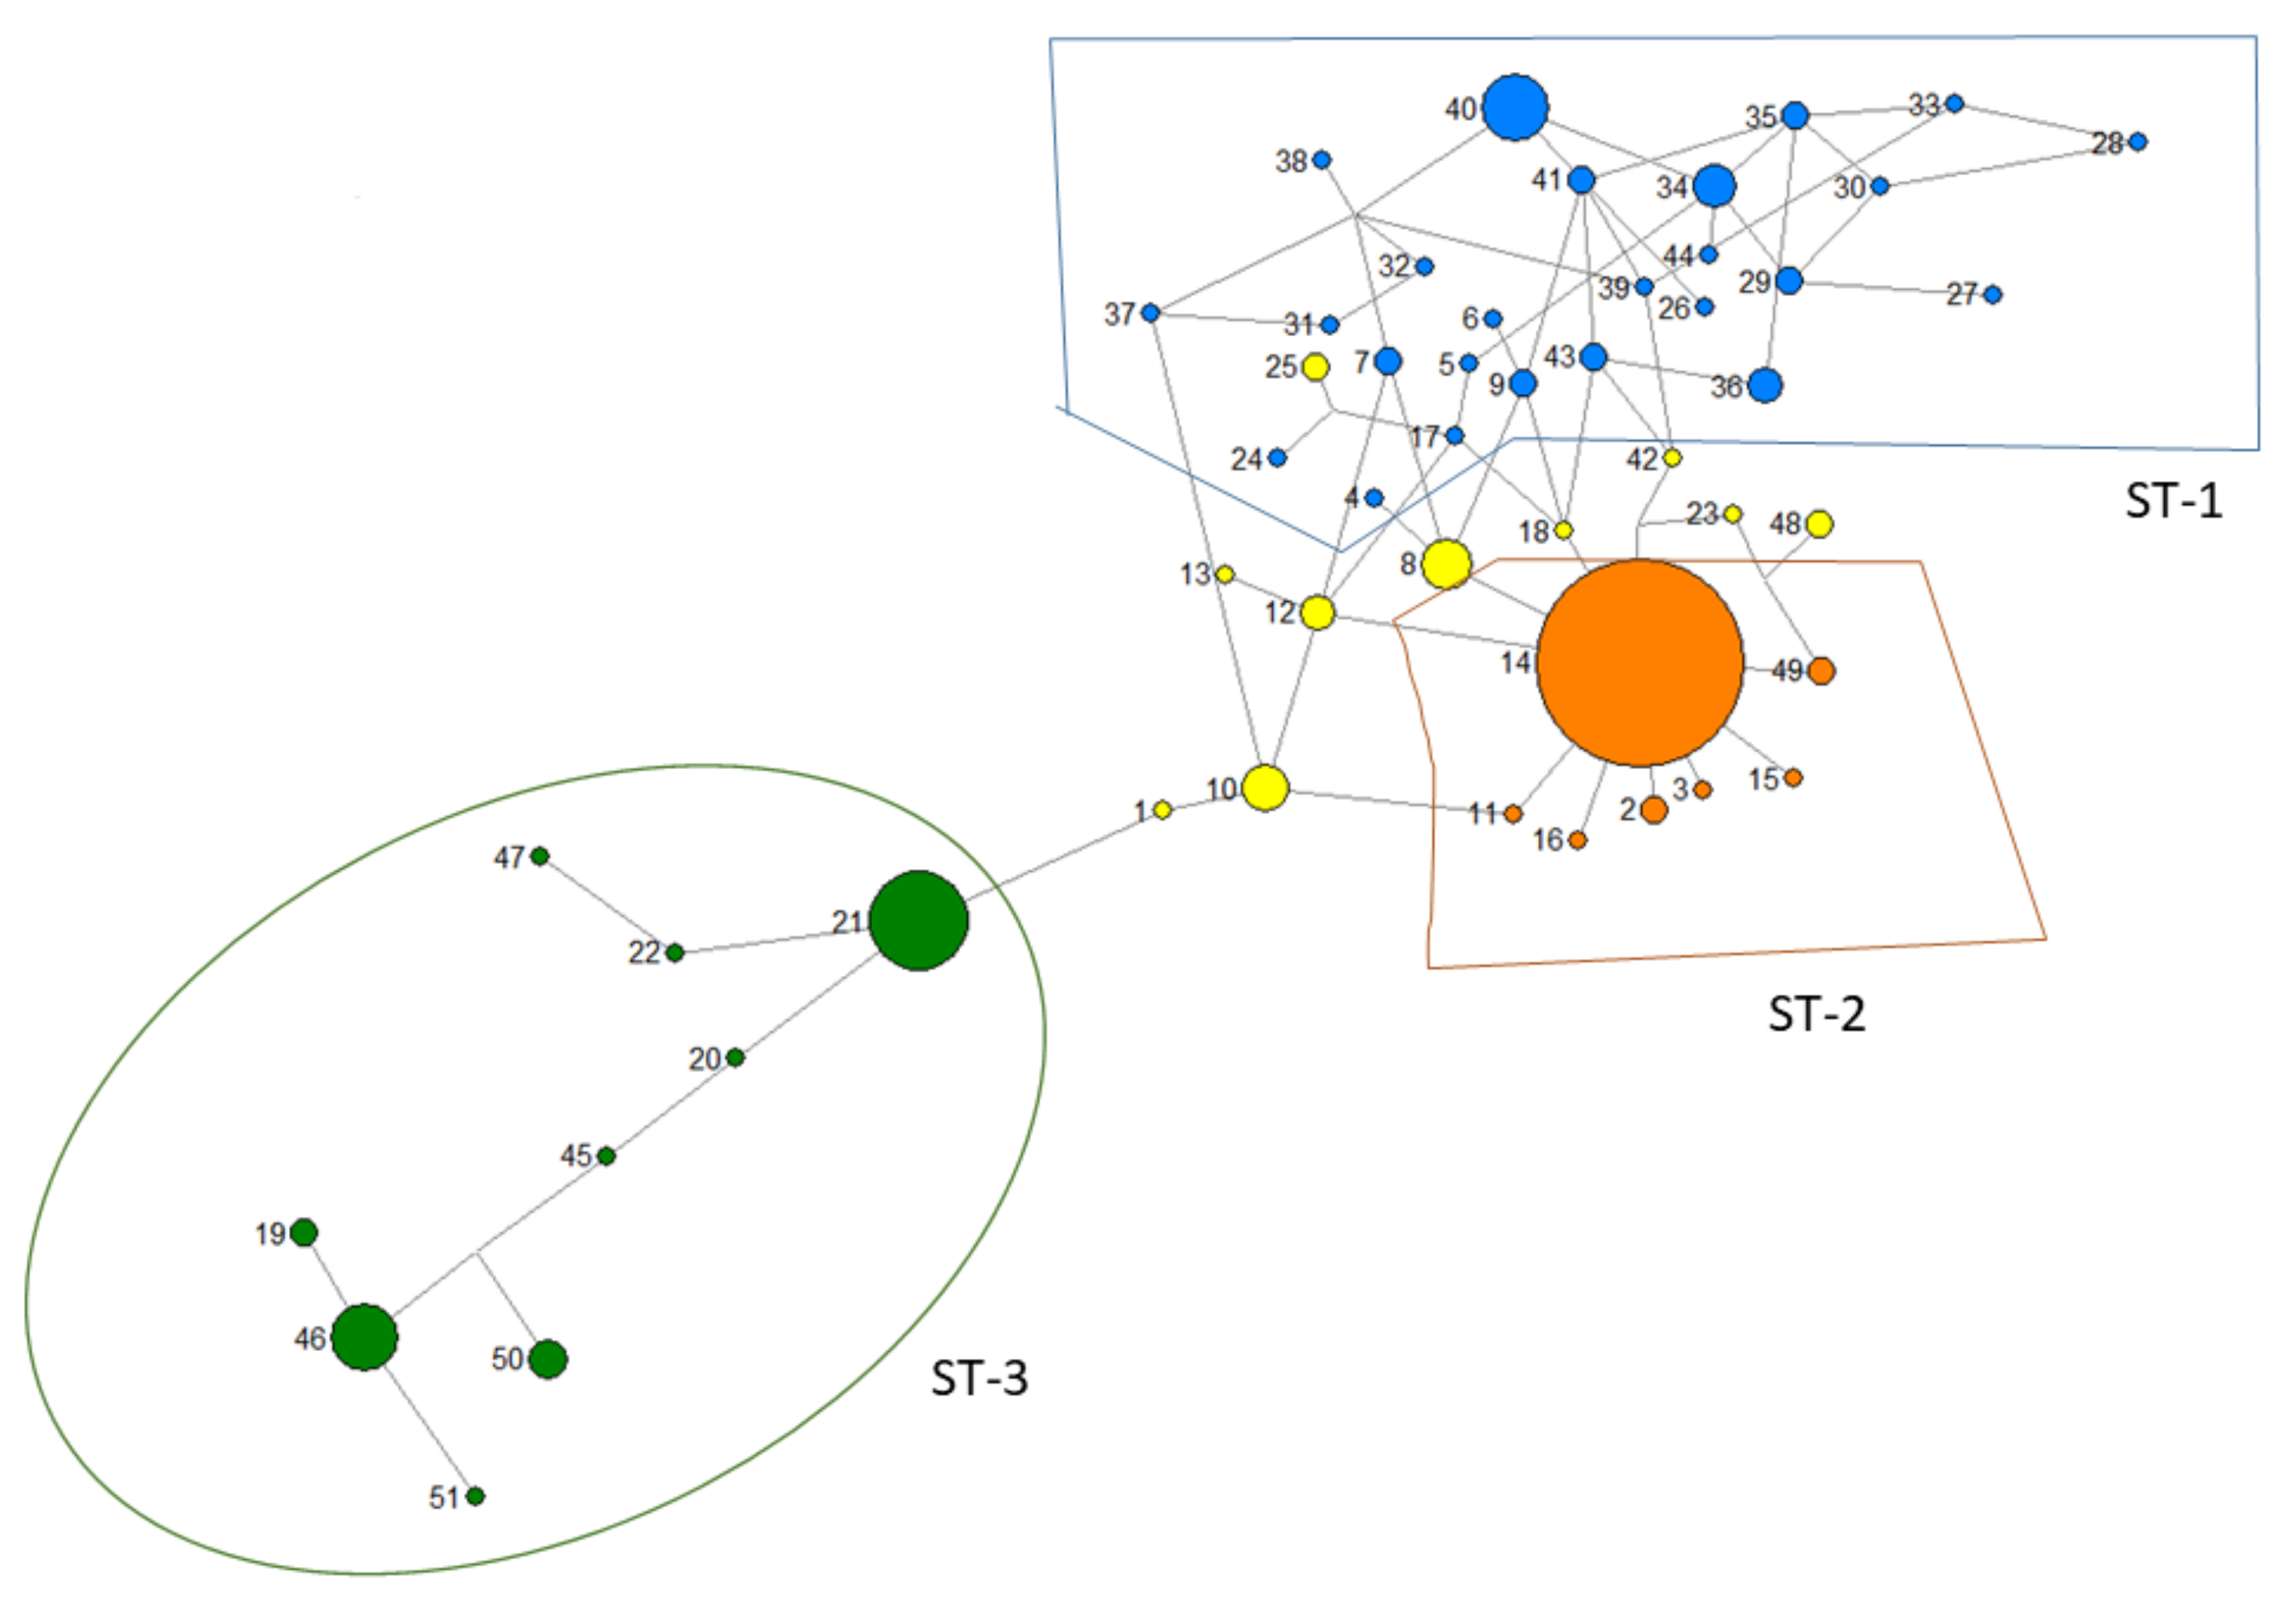
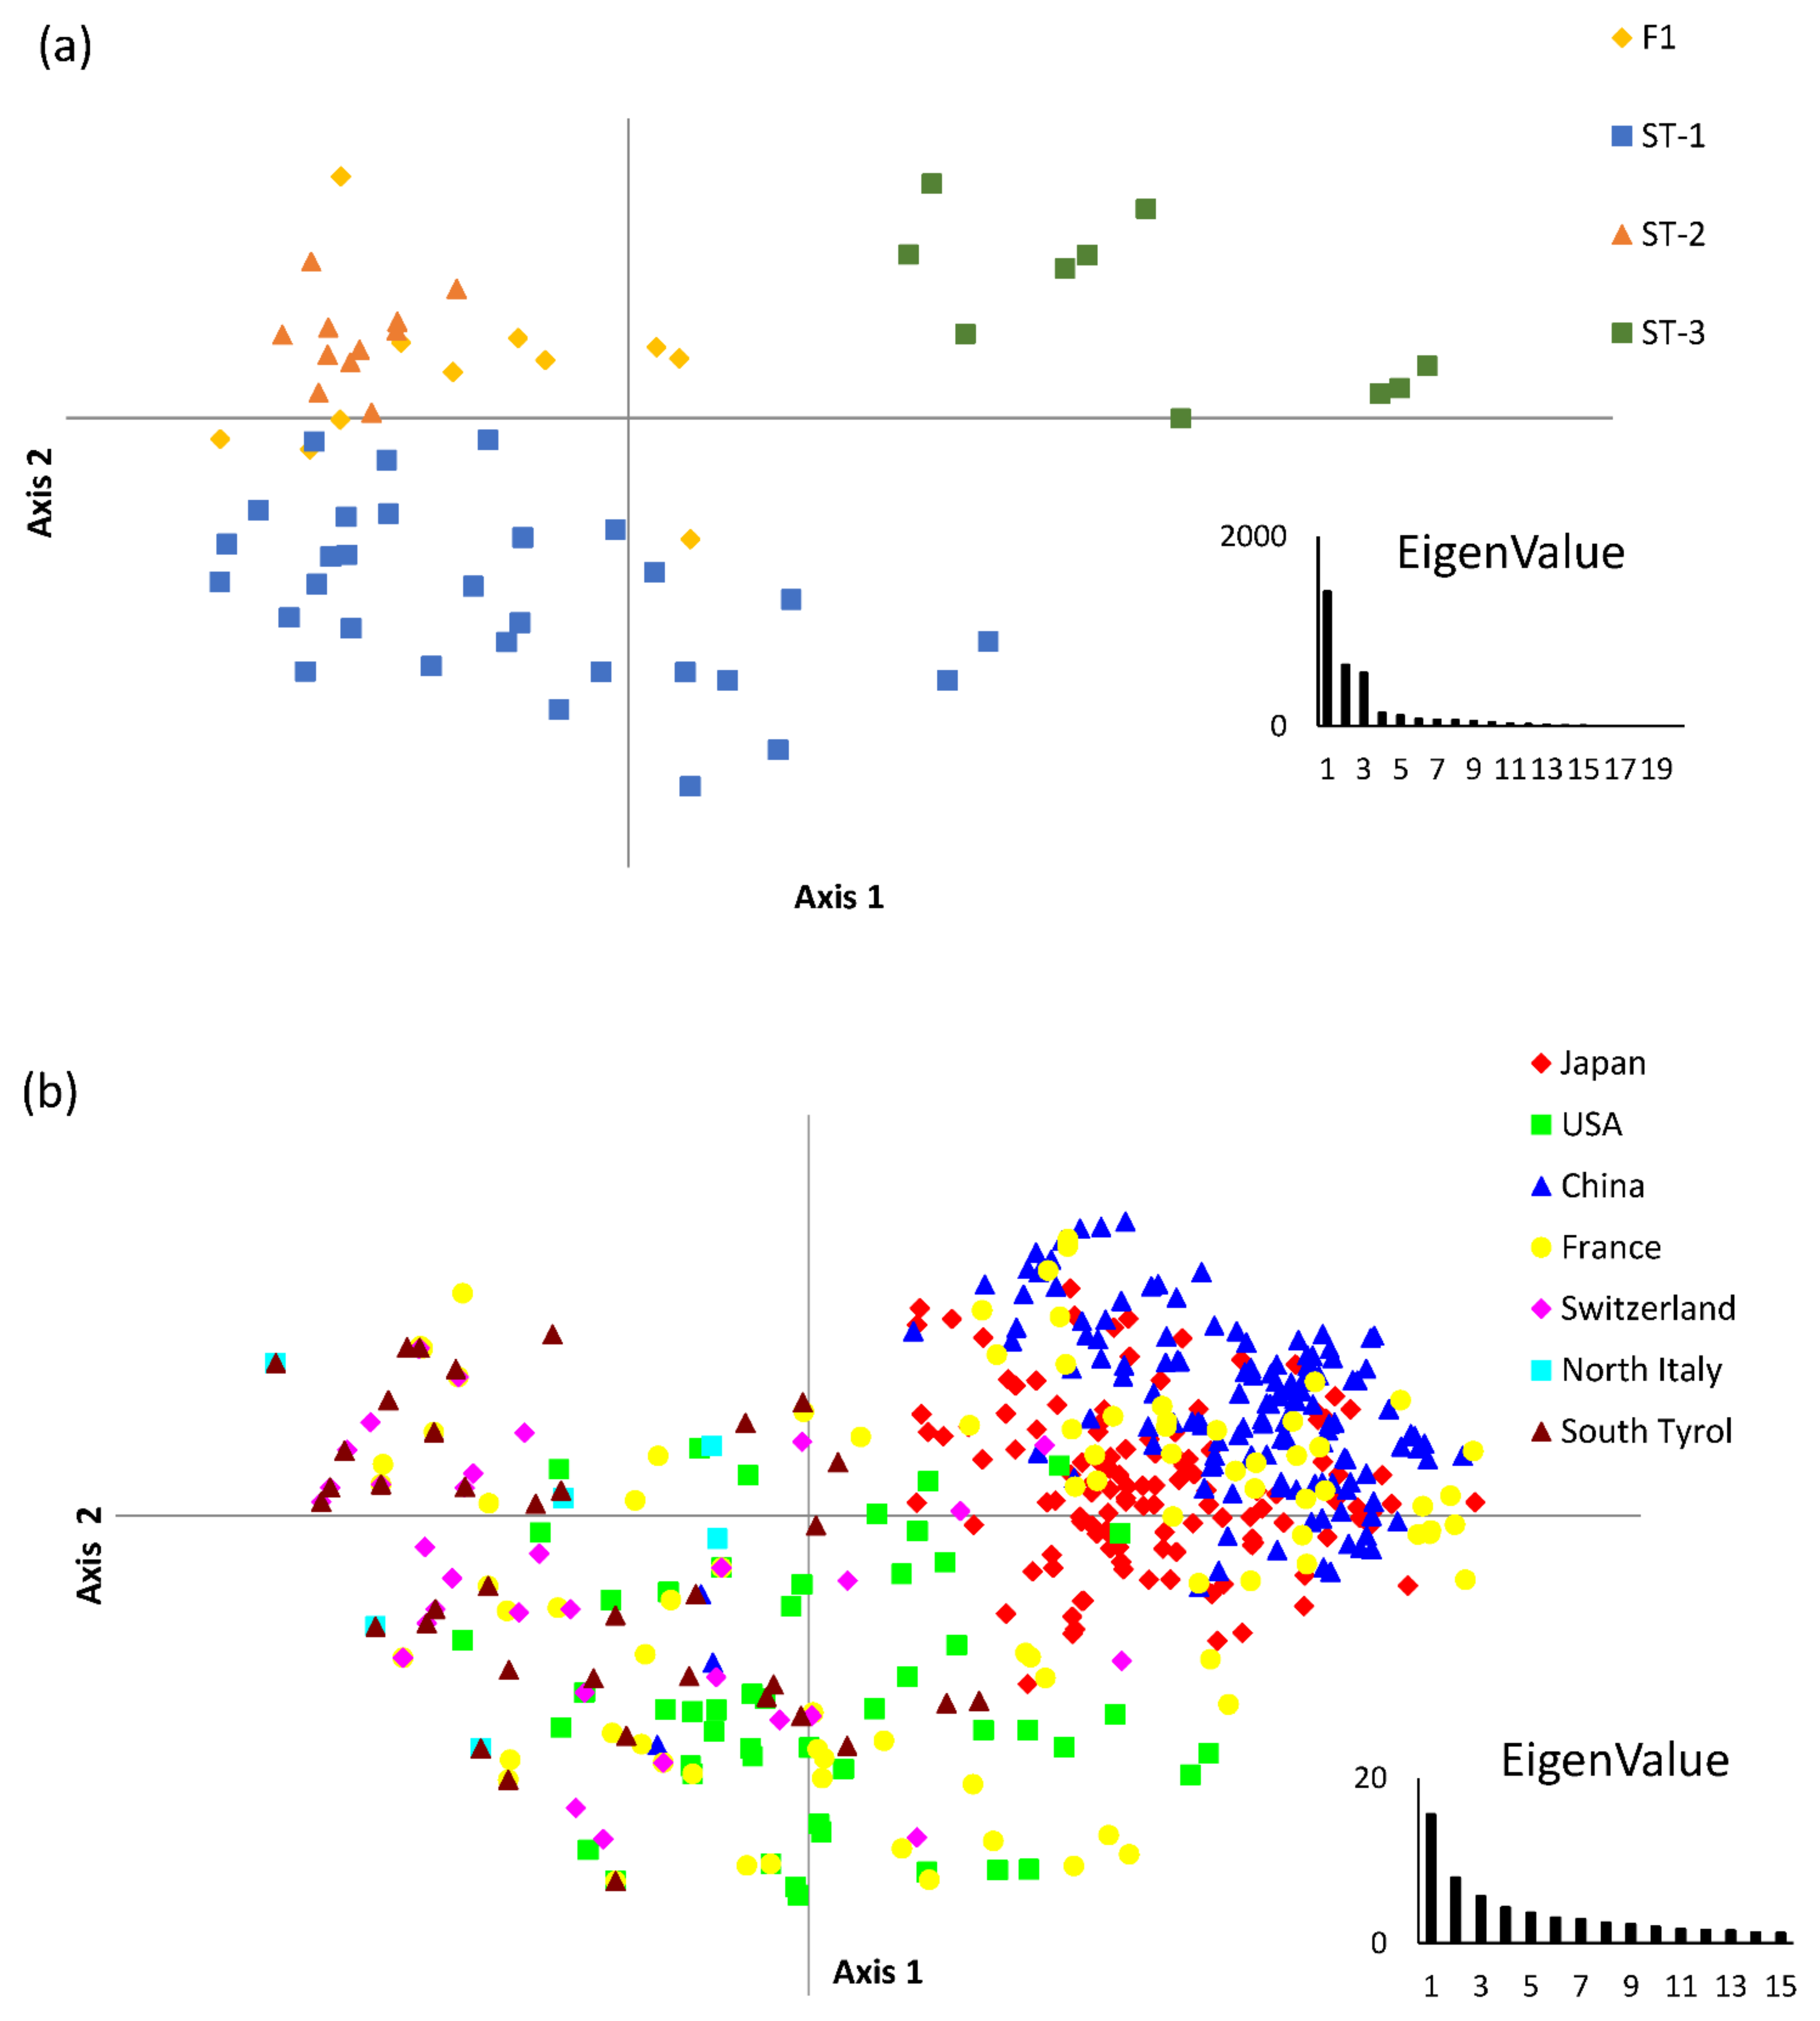
3.1. Genotypic Diversity and Population Structure

All microsatellite loci in South Tyrol were found to be polymorphic. Four microsatellite loci (CPE1, CPE3, CPE8 and CPG14) had two alleles, six loci (CPE5, CPG3, CPG4, CPG6, I07-650 and CPS1006) had three alleles and one locus (CPS1009) had four different alleles (Table 1). Out of 276 isolates, 29 isolates had missing data on more than one locus and were excluded from all analyses, whereas twelve isolates with one missing locus were included whenever the analysis programs allowed (Structure, Multilocus and GenClone) (Supplementary Table S2). Among the 235 isolates with complete genotypic information, a total of 51 multilocus genotypes (haplotypes) of C. parasitica were found in South Tyrol, based on the allelic information of eleven genomic and EST microsatellite loci. The most dominant haplotype in the region was microsatellite haplotype 14 (MSH14), which was found in 108 isolates (45.9%), and the second most widely distributed haplotype was MSH21, which was present in 25 isolates (10.6%). MSH40 and MSH46 were found in 11 samples each, and shared third place for the most dominant haplotypes in the region (4.7% each). The remaining haplotypes were associated with less than ten isolates and were considered rare; for example, 37 haplotypes were found only once. Considering the complete dataset, a Shannon diversity index of 2.45 and an evenness index of 0.63 were found, whereas the Simpson index was 0.77.
The microsatellite loci were generally polymorphic in all districts of South Tyrol, except for CPE8 that was only polymorphic in Salto-Sciliar. Instead, in the Isarco Valley, the four loci CPE3, CPE8, CPG3 and CPS1009 were monomorphic. The number of haplotypes found in the different districts of South Tyrol varied from 18 in Salto-Sciliar to 7 in the Isarco Valley, with an overall mean of 13.0 ± 4.7. A geographical pattern of haplotype distribution was observed within South Tyrol; for example, MSH14 was the dominant haplotype in the northern districts, such as the Venosta Valley (Val Venosta) (68%), Burgraviato (50%) and the Isarco Valley (Valle Isarco) (61%), compared to southern districts, such as Oltradige-Bassa Atesina (31%) or Salto-Sciliar (33%). The Monticolo forest population was different from the chestnut stands; for example, MSH14 only made up 9% of the total isolates. Out of 35 chestnut stands, 26 had more than one haplotype whereas nine had a single haplotype (Table 3). Among the nine stands, four had only one sample, so it is evident that they had isolates of a single haplotype. In most chestnut stands, C. parasitica isolates were found with the dominant MSH14 combined with some additional haplotypes, whereas C. parasitica from two chestnut stands showed MSH21 as being dominant and one showed MSH40 as being dominant. In the Monticolo forest, MSH11 was the most dominant haplotype.
Based on the mean probability of data under the admixture model obtained with Structure and the delta K values calculated with Structure Harvester, the most probable number of groups to represent our data was K = 3 (Figure 1). A small peak was also observed at K = 6, based on the delta K value, which could indicate the secondary structure within the region due to geographical distances between isolates (five districts and one forest population).
Based on the admixture values (q-values) for each cluster that were determined by Structure, the isolates were assigned to one of the three groups. If the q-value of an isolate for a particular cluster was equal to or higher than 0.8, it was assigned to that cluster. Accordingly, isolates with lower q-values were classified as recombinants. Out of 247 isolates, 53, 120 and 48 isolates were assigned to clusters ST-1, ST-2 and ST-3, respectively (Figure 1), and 26 isolates belonged to the recombinant group. In each district, the haplotypes of all three clusters (ST-1, ST-2 and ST-3) were present but varied in their frequency; for example, genotypes from the Venosta Valley and the Isarco Valley mainly belonged to the cluster ST-2 (>0.75). In contrast, genotypes from Oltradige-Bassa Atesina mainly belonged to cluster ST-3 (0.42) and genotypes from the Monticolo forest primarily belonged to cluster ST-1 (0.58). In total, 15 chestnut stands were found to have isolates that belonged to only one cluster, whereas 20 chestnut stands had isolates belonging to more than one cluster (Figure 1c).
The median-joining network (MJN) also confirmed the presence of the three clusters of C. parasitica multilocus microsatellite haplotypes in the region, which were clearly separated from each other (Figure 2). ST-1 was the most variable cluster, as isolates belonging to 25 different haplotypes were assigned to it. In this particular cluster, haplotype MSH40 was the most dominant, whereas the other haplotypes could be defined as rare as they were found in less than five isolates. Cluster ST-2 included the highest number of isolates from South Tyrol, belonging to seven different haplotypes. The most frequent haplotype in this cluster was MSH14. Cluster ST-3 included nine different haplotypes, including MSH21 and MSH46. Isolates belonging to ten microsatellite haplotypes were assigned to the recombinant group, as they appeared to represent hybrid genotypes among the three clusters (ST-1 × ST-2, ST2 × ST3 or ST1 × ST3) (Figure 2). The divergence of allele frequencies among the clusters (net nucleotide distance) in South Tyrol, which were computed with the software Structure using point estimates of P, were the following: ST-1 compared to ST-2, 0.3936; ST-2 compared to ST-3, 0.2087; ST-3 compared to ST-1, 0.3338. The genetic distances (net nucleotide distances) within each cluster were the following: ST-1, 0.3058; ST-2, 0.0063; ST-3, 0.2325.
The Principal Coordinate Analysis again confirmed the presence of three genetic clusters in South Tyrol, which were separated from each other on the axes (Figure 3a). The PCoA of C. parasitica genotypes from the different regions showed the relationship between the microsatellite haplotypes found in South Tyrol and those found in other countries (Figure 3b).

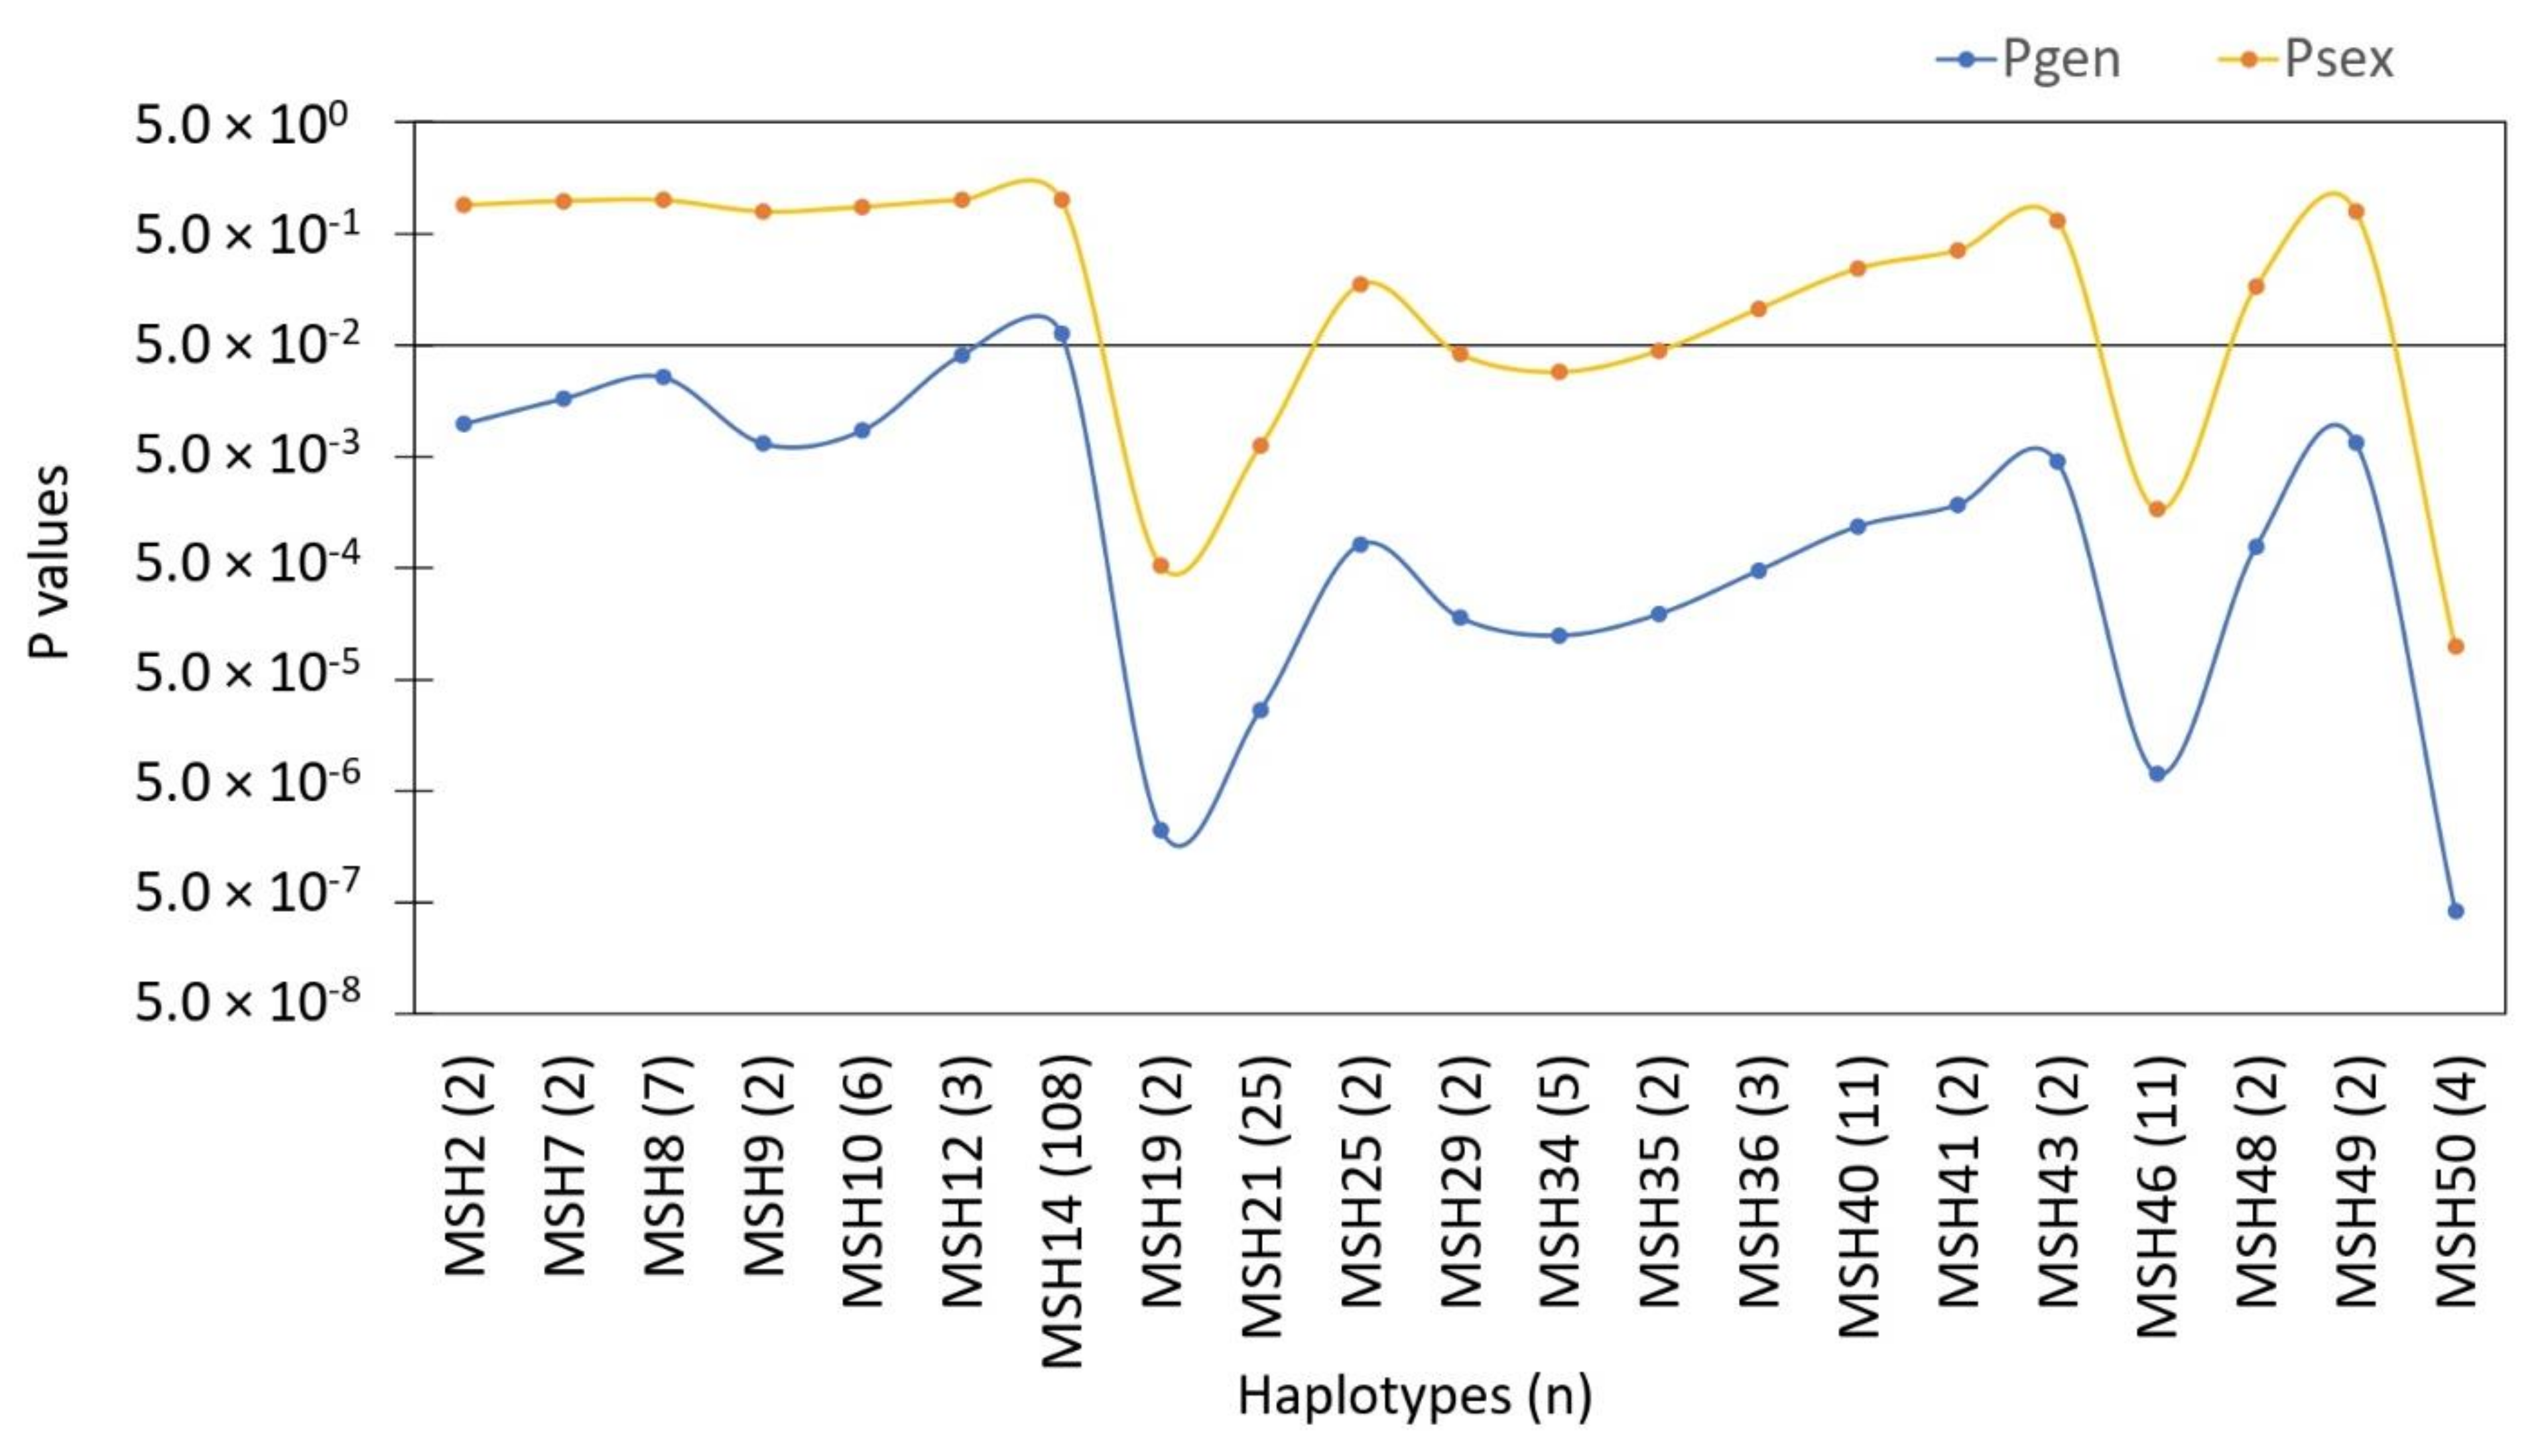
3.2. Selfing and Clonality

The decreasing straight line plot shows that the distribution of clonal membership conforms to Pareto distribution (Figure 4). Simultaneously, the shallow slope of the Pareto distribution shows the skewed distribution of genotypes, with a few large clonal lineages (such as MSH14 and MSH21) and many minor lineages. The Pareto coefficient was 1.16, which also demonstrates the low diversity and low evenness in the region for a sexually reproducing population.
The index of multilocus linkage association (rd) was 0.27 when all isolates were considered, whereas it amounted to 0.26 when only one sample per genotype was included. This index (both with and without the repeated genotypes) was significantly different from zero (p-value < 0.01), which led to the rejection of the null hypothesis of recombination. On the other hand, Pgen was significant for all haplotypes, except MSH14, which shows that almost all of the haplotypes present in South Tyrol have a high probability of resulting from random sexual reproduction (Figure 5). In contrast, Psex values were not significant for most haplotypes (14 out of 21), demonstrating that the second occurrence of these haplotypes is more probably from asexual reproduction and less likely from random sexual events.

3.3. Relationship with Other Genetic Markers

When the microsatellite data were combined with the data from other genetic markers (VC-type, mating-type locus and internal transcribed spacer region) of C. parasitica from South Tyrol that were obtained in a previous study [41], a strong association was found. For example, the MSH14 haplotype was mainly associated with VC type EU-2, mating type MAT-1 and internal transcribed spacer region haplotype ITS-H2. In contrast, the MSH21 haplotype was mainly associated with EU-13, MAT-2 and ITS-H1 (Table 4). Isolates with VC types EU-2 and EU-13 were associated with only two and one different microsatellite haplotype, respectively, whereas isolates carrying VC type EU-1 (the second most common VC type in South Tyrol) were associated with 14 different microsatellite haplotypes. It is worth mentioning that EU-1 was only the predominant VC type in the Monticolo forest (>50%).

4. Discussion

Knowledge about population genetics could help to manage invasive forest pathogens by providing critical insights into their migration pathways and demographic history [60]. In addition, through the application of variable microsatellite markers, insights could be gained into whether populations are driven by clonal or sexual reproduction. This information is essential for the development of successful management strategies for invasive pathogens. There was no information available about the genetic structure of the C. parasitica populations in South Tyrol, which could have an adverse impact on the control of the disease in the region and lead to considerable economic losses and damage to the local ecosystem. In the present study, multilocus microsatellite markers were utilized to investigate the molecular genetic variation of C. parasitica in South Tyrol and assess its prevailing mode of reproduction. Finally, the molecular genetic data were used to reconstruct the possible introduction events of C. parasitica to South Tyrol from other regions and countries.
The most remarkable result from our data is the presence of 51 different microsatellite haplotypes of C. parasitica in a geographic region as small as South Tyrol. This diversity is considerably higher than in many other European populations, for example, 57 haplotypes were found collectively in Switzerland, Croatia and Macedonia [33]. In addition, we found three genetic clusters in the region, whereas two different clusters were found in a multinational study; one in Switzerland and Croatia and another in Macedonia [33]. Two main reasons for this high diversity of C. parasitica in South Tyrol could be (i) the multiple introductions of diverse genotypes to the region (by natural gene flow and/or human activities) and (ii) the high rates of sexual reproduction, which are critically addressed in the following sections.
It was hypothesized previously [41] that C. parasitica reproduces sexually in this region, and the microsatellite data present evidence of this. Sexual reproduction could have played an essential role in increasing the genetic diversity, as all of the genotypes found were significantly likely to have resulted from random sexual reproduction, except for one. Within chestnut stands, the presence of different genotypes also indicated a high rate of sexual reproduction. Genotypes belonging to different genetic clusters were also found to reproduce sexually among each other, as ten multilocus microsatellite haplotypes appeared to be recombinant between two clusters. Most of them were private genotypes and were only found once, which led us to hypothesize that they may have developed locally from sexual reproduction events. Isolates belonging to these genotypes also had VC types that were private and were found only a few times. These VC types could have arisen from crosses between EU-1 and EU-13 or EU-2 and EU-13, further confirming the recombination hypothesis. The high VC-type diversity already indicated frequent sexual reproduction in the region [41]. In all chestnut-growing areas of South Tyrol and several chestnut stands, both mating types were present, signifying that sexual reproduction is possible in the region.
Although sexual reproduction was frequent in the region, clonality/asexual reproduction was more common than sexual reproduction, as evidenced by the Pareto distribution. Only a few haplotypes were found to be widespread and dominant in the region. The three most common haplotypes, which represented more than 65% of the isolates, were found to have a single dominant mating type (either MAT-1 or MAT-2), which further corroborates their clonality. The microsatellite multilocus genotypes corresponded well with the VC-type diversity and showed the dominance of few genotypes in the region. High Psex values demonstrated the low possibility of the second occurrence of a genotype from sexual reproduction and further confirmed that the second occurrence was due to clonality and not independent, random sexual events. For introduced pathogens, such as C. parasitica in Europe, asexual reproduction may provide reproductive assurance at the beginning of an invasion, when the other mating type is not available, and promote a rapid population expansion [56]. Considering the small size and patchy distribution of chestnut stands in South Tyrol, which are isolated between villages, apple orchards and vineyards, limited rates of gene flow can be assumed. This is in contrast to the forest ecosystem, where hundreds and thousands of trees grow together. Landscape limitations in the region, such as the Alps, could be another barrier to the fungus finding a mate and reproducing sexually. The low value of multilocus linkage disequilibrium supported the assumption that asexual reproduction may be the most common way that the fungus colonized and established itself in South Tyrol. Previous studies have identified several clonal lineages of C. parasitica that spread throughout Europe and have also suggested that asexuality was the primary mode of reproduction during colonization [11,12,37,56,61,62]. Since C. parasitica is an introduced pathogen in South Tyrol that was first detected in 1958, the clonal spread of the fungus probably made it a successful pathogen in a non-native range where the availability of opposite mating type and overall genetic diversity was relatively low [63,64].
In the majority of chestnut stands in South Tyrol, more than two multilocus microsatellite haplotypes of C. parasitica were found, which was possible due to either separate introductions to the stands (either natural or human-mediated) or sexual reproduction. Our data showed that both of these processes could have contributed to the high variability of the fungus in the chestnut stands. Nevertheless, the dominance of a few haplotypes in the region points to the importance of clonal processes in the major proportion of chestnut stands. One reason for the clonal reproduction of the fungus, even in the case of the availability of a sexual mate, could be the suppressive effect of the mycovirus, which infects C. parasitica, decreases its fertility and forces the fungus to reproduce mainly asexually [65]. CHV-1 is frequently detected in Italy and other western European populations [13,20,21,27,66,67,68] and its presence could strongly limit the sexual reproduction of C. parasitica. Low sexual reproduction causes clonality, leading to a better spread of the mycovirus among the host populations. In South Tyrol, mycovirus-infected C. parasitica strains were artificially introduced in the 1990s to control the pathogen, which could have increased the viral infections within the chestnut stands [63]. Another reason for the clonal distribution of some genotypes among the chestnut stands could be their higher fitness rates, determined by a higher virulence and dissemination potential and a beneficial relationship with the mycovirus; as variable degrees of fitness of different fungal–viral combinations were observed in other European C. parasitica populations [69]. On the other hand, many private genotypes were also found in several chestnut stands in South Tyrol, demonstrating the contribution of sexual reproduction to the high genetic diversity. For example, if MSH14 and MSH 21 were reproducing sexually, we would expect to find 32 different recombinants of five different alleles. However, the sample size from each chestnut stand was considerably smaller due to the limited number of trees per stand, not all of which were infected with chestnut blight [41]. Consequently, the small sample size made it harder to interpret the results correctly at the chestnut stand level. Data about the infection rates of C. parasitica with CHV-1 and the variability of the fungus–mycovirus combinations in South Tyrol are still outstanding and will be addressed in a future study. Furthermore, studying local C. parasitica genotypes with different combinations of the mycovirus would be required to identify the hypovirulent strains of C. parasitica with the best potential for biocontrol applications.
Other European populations of C. parasitica were also found to mainly reproduce asexually and have a higher degree of clonality [11,37,61] compared to the native populations of Asia and America [12]. However, a whole-genome sequencing study revealed the frequent recombination between the clonal lineages of C. parasitica and suggested that a clonal population does not necessarily involve the absence of sexual reproduction [70], as was observed in other fungal species [71,72]. Prospero and Rigling [56] also stated that sexual reproduction could have been underestimated in Europe because a high genetic similarity among the individuals of an introduced pathogen is usually observed, which can only lead to a few new haplotypes through sexual reproduction. As our study was based on the investigation of microsatellite data to infer the importance of sexual reproduction, it cannot be ruled out that the sexual reproduction rate is even higher, especially in the chestnut stands where both mating types were detected. A study of the population genomics would be required to determine the exact rate of the sexual reproduction of the fungus. Nevertheless, recombination in neutral markers, such as microsatellite loci, is a good indicator of variability, especially for practical purposes, such as biocontrol.
The forest population of Monticolo showed the highest haplotypic richness, genetic diversity and mean genetic distances between individuals compared to the other districts (data not shown). Every other isolate from the forest population belonged to a different genotype, as the number of multilocus microsatellite haplotypes found was approximately half the number of isolates. While the Monticolo forest represents the only natural population of chestnut trees in South Tyrol, the administrative districts comprise isolated chestnut stands. This evidence confirms that the overall clonality in the region was probably due to the isolation of the chestnut stands, while a high sexual reproduction was observed in the forest population. The genetic makeup of the forest population was also very different compared to the other districts, as it was dominated by genotypes grouped in a cluster that are relatively rare in other areas of South Tyrol. These differences led us to hypothesize that the human-mediated spread of some genotypes could have contributed to fungal dissemination and establishment in the chestnut stands.
Our data raise another question: what are the possible reasons for the high VC-type, microsatellite and ITS haplotype diversity in the region compared to other European populations? Different introduction events from different populations of C. parasitica could have occurred in South Tyrol, mainly because of its geographical location and proximity to the VC-type-rich neighboring regions of Switzerland and Lombardy (northern Italy) [35]. In France, three different genetic clusters of C. parasitica were found, which points to at least three different introduction events [11]. French Cluster 1 (C1) was most likely introduced from northern Italy, whereas C2 and C3 were unrelated to the Italian clusters and represented separate introduction events, probably from Asia and North America [11]. A comparison of C. parasitica in the different regions showed that the most dominant haplotype in South Tyrol (MSH14) was also the most prevalent in Switzerland and eastern France, which was referred to as CPMG15 and RE019, respectively [11,56]. MSH14 and MSH40 were frequently found in northern Italy, southeastern France and Switzerland, where they are primarily associated with EU-2 and EU-5, respectively [11,56,57]. Our data showed that these two genotypes probably founded the populations of C. parasitica in South Tyrol. MSH46, however, was similar to the French genotype RE019 and was not detected in Switzerland. All of these haplotypes are thought to have originated from other northern Italian populations because of their high similarity to French Cluster 1, which probably originated from northern Italy [11]. A close relationship between the genotypes found in South Tyrol and those found in neighboring regions, such as northern Italy and Switzerland, was depicted in the PCoA, which also indicates that the direct introduction of genotypes to South Tyrol from China or Japan is unlikely as both clusters were clearly separated. A recent study also found that most of the central-western European populations of C. parasitica could be related to the first introduction event to Italy in the 1930s [33]. The high VC-type and microsatellite haplotype diversity in the region led us to hypothesize that the neighboring populations may have actively played a role in increasing local genetic diversity through natural dissemination or human-mediated transmission. For example, MSH21 was not found in France or northern Italy but was found in southern Switzerland and South Tyrol. Another piece of evidence to support the multiple introduction hypothesis is all genetic clusters belonging to a particular VC type that is consistent in different populations, such as France, Switzerland and northern Italy. As South Tyrol is located close to northern Italian populations of C. sativa, natural dissemination could have been responsible for its initial introduction to the region. Dutech et al. (2012) found that C. parasitica in Italy was introduced from North America and from there, it spread to other western European regions. However, human-mediated activities, such as the import of chestnut-planting materials from other regions, could have introduced more genotypes [73]. For example, a French cultivar, Bouche de Bétizac, was introduced to South Tyrol because it is resistant to the chestnut gall wasp Dryocosmus kuriphilus, which invaded South Tyrol in 2008 [74,75]. It is possible that the import of plant material could also have introduced some French genotypes of C. parasitica to the region. The PCoA demonstrated that at least three genotypes found in South Tyrol were similar to the French genotypes and showed that a direct introduction from France to South Tyrol could have occurred.
Nevertheless, the finding of three genetic clusters indicates that at least three different introduction events could have happened in South Tyrol. The presence of three divergent genetic clusters in South Tyrol was confirmed using three different analyses: Structure analysis, PCoA and MJN. We also found evidence that these introductions could have separated temporally; ST-1 could have been introduced earlier and had more time to evolve into several microsatellite haplotypes and VC types. For example, the number of genotypes that belong to cluster ST-1 was more than three times higher than the more dominant cluster, ST-2. The genetic distances within each cluster also showed considerable differences and indicate that ST-2 is the least diverse and was probably introduced later. However, it is also possible that ST-1 is more sexually active and hence, more diverse than ST-2, which appears to be more successful due to asexual reproduction. The fact that ST-1 was primarily found in the forest population could have provided an advantage for sexual reproduction compared to ST-2, which was predominant in chestnut stands that are usually isolated.
It is poorly understood why some genotypes are better at colonizing and establishing themselves in different European chestnut tree populations. One interesting question could be whether this is related to the human-mediated application of hypovirulence. In South Tyrol, some hypovirulent fungal genotypes were used as biocontrol strains, which could have changed the genetic structure of the local C. parasitica populations and helped some genotypes to establish themselves [63,64]. In contrast, some genotypes could also be better adapted to local climatic conditions and hence, more ecologically fit. An investigation into these genotypes, their virulence and dissemination potential, and the associated hypovirus could help us understand their successful establishment in European chestnut tree populations.

5. Conclusions

A high genetic diversity of C. parasitica was found in South Tyrol, showing that the fungus is well established in the region and well adapted to local climatic conditions. The primary reason for this high diversity is a high rate of sexual reproduction, especially in the forest population that could serve as a source of diversity for the chestnut stands. Introduction events to South Tyrol could also have increased the genetic diversity of the fungus. Our data suggest that C. parasitica was probably introduced to South Tyrol from the neighboring populations of northern Italy through natural dissemination and/or human-related activities. Anthropogenic introductions from other European regions, such as France and Switzerland, could also have occurred. However, all the genotype clusters appear to be the result of the first introduction event to Genoa, Italy, in the 1930s. The evidence from this study suggests that the dissemination of C. parasitica in South Tyrol results mainly from asexual reproduction, due to the isolated chestnut stands. A low recombination rate was observed between the genotype clusters. Nevertheless, the low recombination rate and high clonality of the C. parasitica isolates in South Tyrol compared to the native populations signify favorable conditions for the application of biocontrol through hypovirulence. The presence of sexual reproduction, on the other hand, represents a potential threat to local chestnut trees and illustrates the need to reinforce control strategies against the disease.

Supplementary Materials

The following are available online at https://www.mdpi.com/article/10.3390/f13020344/s1, Table S1: Sampling localities and the number of isolates of Cryphonectria parasitica included in the study, Table S2: Dataset with microsatellite allele scores at 11 loci of the 247 isolates of Cryphonectria parasitica from South Tyrol. Allele lengths are given in base pairs (bp) and missing data are indicated with zero (0). For each isolate with complete allelic data, the information about the assignment to a particular microsatellite haplotype (MSH) and Structure group (ST) is provided.

Author Contributions

Conceptualization, F.A. and S.B.; data curation, F.A.; formal analysis, F.A.; funding acquisition, S.B.; investigation, F.A. and S.B.; methodology, F.A. and S.B.; project administration, S.B.; resources, S.B.; supervision, S.B.; validation, F.A. and S.B.; visualization, F.A.; writing—original draft, F.A.; writing—review and editing, F.A. and S.B. All authors have read and agreed to the published version of the manuscript.

Funding

This research project was funded by the Free University of Bozen-Bolzano. S.B. received the start-up grant ChestnutBlight (TN2809), while FA was awarded a PhD scholarship. The Department of Innovation, Research, University and Museums of the Autonomous Province of Bozen-Bolzano covered the Open Access publication costs.

Institutional Review Board Statement

Not applicable.

Informed Consent Statement

Not applicable.

Data Availability Statement

The data produced is presented in the article and as supplementary information.

Acknowledgments

Sampling activities were supported by collaborators from the Department of Forestry of the autonomous province of Bozen-Bolzano, members of the Chestnut Growers Association of South Tyrol and G. Tonon (Free University of Bozen-Bolzano). The valuable support of M. Niedrist, K. Marschall and M. Vittur at the beginning of the project is acknowledged. The authors would like to thank the Department of Innovation, Research, University and Museums of the Autonomous Province of Bozen-Bolzano for covering the Open Access publication costs.

Conflicts of Interest

The authors declare no conflict of interest.

References

  1. Aukema, J.E.; Leung, B.; Kovacs, K.; Chivers, C.; Britton, K.O.; Englin, J.; Frankel, S.J.; Haight, R.G.; Holmes, T.P.; Liebhold, A.M. Economic impacts of non-native forest insects in the continental United States. PLoS ONE 2011, 6, e24587. [Google Scholar] [CrossRef] [PubMed]
  2. Santini, A.; Ghelardini, L.; De Pace, C.; Desprez-Loustau, M.-L.; Capretti, P.; Chandelier, A.; Cech, T.; Chira, D.; Diamandis, S.; Gaitniekis, T.; et al. Biogeographical patterns and determinants of invasion by forest pathogens in Europe. New Phytol. 2013, 197, 238–250. [Google Scholar] [CrossRef] [Green Version]
  3. Desprez-Loustau, M.; Robin, C.; Buee, M.; Courtecuisse, R.; Garbaye, J.; Suffert, F.; Sache, I.; Rizzo, D. The fungal dimension of biological invasions. Trends Ecol. Evol. 2007, 22, 472–480. [Google Scholar] [CrossRef] [PubMed]
  4. Ghelardini, L.; Luchi, N.; Pecori, F.; Pepori, A.L.; Danti, R.; Della Rocca, G.; Capretti, P.; Tsopelas, P.; Santini, A. Ecology of invasive forest pathogens. Biol. Invasions 2017, 19, 3183–3200. [Google Scholar] [CrossRef]
  5. Anagnostakis, S. Chestnut blight: The classical problem of an introduced pathogen. Mycologia 1987, 79, 23. [Google Scholar] [CrossRef] [Green Version]
  6. Biraghi, A. La distribuzione del cancro del castagno in Italia. L’Italia For. E Mont. 1950, 5, 18–21. [Google Scholar]
  7. Heiniger, U.; Rigling, D. Biological control of chestnut blight in Europe. Annu. Rev. Phytopathol. 1994, 32, 581–599. [Google Scholar] [CrossRef]
  8. Peever, T.L.; Liu, Y.C.; Wang, K.; Hillman, B.I.; Foglia, R.; Milgroom, M.G. Incidence and diversity of double-stranded RNAs occurring in the chestnut blight fungus, Cryphonectria parasitica, in China and Japan. Phytopathology 1998, 88, 811–817. [Google Scholar] [CrossRef] [Green Version]
  9. Berbegal, M.; Pérez-Sierra, A.; Armengol, J.; Grünwald, N.J. Evidence for multiple introductions and clonality in Spanish populations of Fusarium circinatum. Phytopathology 2013, 103, 851–861. [Google Scholar] [CrossRef] [Green Version]
  10. Goss, E.M.; Larsen, M.; Vercauteren, A.; Werres, S.; Heungens, K.; Grünwald, N.J. Phytophthora ramorum in Canada: Evidence for migration within North America and from Europe. Phytopathology 2011, 101, 166–171. [Google Scholar] [CrossRef] [Green Version]
  11. Dutech, C.; Fabreguettes, O.; Capdevielle, X.; Robin, C. Multiple introductions of divergent genetic lineages in an invasive fungal pathogen, Cryphonectria parasitica, in France. Heredity 2010, 105, 220–228. [Google Scholar] [CrossRef] [PubMed] [Green Version]
  12. Dutech, C.; Barres, B.; Bridier, J.; Robin, C.; Milgroom, M.G.; Ravigné, V. The chestnut blight fungus world tour: Successive introduction events from diverse origins in an invasive plant fungal pathogen. Mol. Ecol. 2012, 21, 3931–3946. [Google Scholar] [CrossRef] [PubMed]
  13. Heiniger, U.; Rigling, D. Applicaction of the Cryphonectria hypovirus (CHV-1) to control the chestnut blight, experience from Switzerland. Acta Hortic. 2009, 815, 233–246. [Google Scholar] [CrossRef]
  14. Aguin, O.; Mata, M.; Mansilla, J.P.; Romero, A. Occurrence and diversity of vegetative compatibility types of Cryphonectria parasitica in Galicia (NW Spain). Acta Hortic. 2005, 693, 597–604. [Google Scholar] [CrossRef]
  15. Anagnostakis, S. Vegetative incompatibility in Endothia parasitica. Exp. Mycol. 1977, 1, 306–316. [Google Scholar] [CrossRef]
  16. Liu, Y.C.; Milgroom, M.G. High diversity of vegetative compatibility types in Cryphonectria parasitica in Japan and China. Mycologia 2007, 99, 279–284. [Google Scholar] [CrossRef]
  17. Mlinarec, J.; Ježić, M.; Ćosić, J.; Ćurković-Perica, M. Multilocus PCR assay reveals high diversity of vegetative compatibility types in populations of Cryphonectria parasitica in Croatia. Plant Pathol. 2018, 67, 741–749. [Google Scholar] [CrossRef]
  18. Moghadam, S.; Khodaparast, S.; Farsi, M. Vegetative compatibility groups in populations of Cryphonectria parasitica, the causal agent of chestnut blight in Guilan Province, Iran. Iran. J. Plant Pathol. 2010, 46, 1–3. [Google Scholar]
  19. Montenegro, D.; Aguín, O.; Sainz, M.J.; Hermida, M.; Mansilla, J.P. Diversity of vegetative compatibility types, distribution of mating types and occurrence of hypovirulence of Cryphonectria parasitica in chestnut stands in NW Spain. For. Ecol. Manag. 2008, 256, 973–980. [Google Scholar] [CrossRef]
  20. Murolo, S.; De Miccolis Angelini, R.M.; Faretra, F.; Romanazzi, G. Phenotypic and molecular investigations on hypovirulent Cryphonectria parasitica in Italy. Plant Dis. 2018, 102, 540–545. [Google Scholar] [CrossRef] [Green Version]
  21. Pérez-Sierra, A.; Romón-Ochoa, P.; Gorton, C.; Lewis, A.; Rees, H.; Van Der Linde, S.; Webber, J. High vegetative compatibility diversity of Cryphonectria parasitica infecting sweet chestnut (Castanea sativa) in Britain indicates multiple pathogen introductions. Plant Pathol. 2019, 68, 727–737. [Google Scholar] [CrossRef]
  22. Robin, C.; Capdevielle, X.; Martin, M.; Traver, C.; Colinas, C. Cryphonectria parasitica vegetative compatibility type analysis of populations in south-western France and northern Spain. Plant Pathol. 2009, 58, 527–535. [Google Scholar] [CrossRef]
  23. Short, D.P.G.; Double, M.; Nuss, D.L.; Stauder, C.M.; MacDonald, W.; Kasson, M.T. Multilocus PCR assays elucidate vegetative incompatibility gene profiles of Cryphonectria parasitica in the United States. Appl. Environ. Microbiol. 2015, 81, 5736–5742. [Google Scholar] [CrossRef] [PubMed] [Green Version]
  24. Sotirovski, K.; Papazova-Anakieva, I.; Grunwald, N.J.; Milgroom, M.G. Low diversity of vegetative compatibility types and mating type of Cryphonectria parasitica in the southern Balkans. Plant Pathol. 2004, 53, 325–333. [Google Scholar] [CrossRef]
  25. Trestic, T.; Uscuplic, M.; Colinas, C.; Rolland, G.; Giraud, A.; Robin, C. Vegetative compatibility type diversity of Cryphonectria parasitica populations in Bosnia-Herzegovina, Spain and France. For. Snow Landsc. Res. 2001, 76, 391–396. [Google Scholar]
  26. Bragança, H.; Simões, S.; Onofre, N.; Tenreiro, R.; Rigling, D. Cryphonectria parasitica in Portugal: Diversity of vegetative compatibility types, mating types, and occurrence of hypovirulence. For. Pathol. 2007, 37, 391–402. [Google Scholar] [CrossRef]
  27. Zamora, P.; Martín, A.B.; Rigling, D.; Diez, J.J. Diversity of Cryphonectria parasitica in western Spain and identification of hypovirus-infected isolates. For. Pathol. 2012, 42, 412–419. [Google Scholar] [CrossRef]
  28. Bryner, S.F.; Rigling, D. Hypovirus virulence and vegetative incompatibility in populations of the chestnut blight fungus. Phytopathology 2012, 102, 1161–1167. [Google Scholar] [CrossRef] [Green Version]
  29. Cornejo, C.; Šever, B.; Kupper, Q.; Prospero, S.; Rigling, D. A multiplexed genotyping assay to determine vegetative incompatibility and mating type in Cryphonectria parasitica. Eur. J. Plant Pathol. 2019, 155, 81–91. [Google Scholar] [CrossRef]
  30. Daldal, M.; Erincik, Ö.; Wall, J.R. Geographical distribution of vegetative compatibility and mating types of Cryphonectria parasitica in Izmir, Manisa and Denizli provinces in western Turkey. For. Pathol. 2018, 48, e12444. [Google Scholar] [CrossRef]
  31. Erincik, B.G.; Erincik, Ö.; Açikgöz, S. The potential diversity of vegetative compatibility types in the population of Cryphonectria parasitica in Turkey. For. Pathol. 2020, 50, e12646. [Google Scholar] [CrossRef]
  32. Ježić, M.; Kolp, M.; Prospero, S.; Sotirovski, K.; Double, M.; Rigling, D.; Risteski, M.; Karin-Kujundžić, V.; Idžojtić, M.; Poljak, I.; et al. Diversity of Cryphonectria parasitica in callused chestnut blight cankers on European and American chestnut. For. Pathol. 2019, 49, e12566. [Google Scholar] [CrossRef]
  33. Ježić, M.; Schwarz, J.M.; Prospero, S.; Sotirovski, K.; Risteski, M.; Ćurković-Perica, M.; Nuskern, L.; Krstin, L.; Katanić, Z.; Maleničić, E.; et al. Temporal and spatial genetic population structure of Cryphonectria parasitica and its associated hypovirus across an invasive range of chestnut blight in Europe. Phytopathology 2021, 111, 1327–1337. [Google Scholar] [CrossRef] [PubMed]
  34. Krstin, L.; Novak-Agbaba, S.; Rigling, D.; Krajačić, M.; Ćurković Perica, M. Chestnut blight fungus in Croatia: Diversity of vegetative compatibility types, mating types and genetic variability of associated Cryphonectria hypovirus 1. Plant Pathol. 2008, 57, 1086–1096. [Google Scholar] [CrossRef]
  35. Cortesi, P.; Rigling, D.; Heiniger, U. Comparison of vegetative compatibility types in Italian and Swiss subpopulations of Cryphonectria parasitica. Eur. J. For. Pathol. 1998, 28, 167–176. [Google Scholar] [CrossRef]
  36. Pearson, M.N.; Beever, R.E.; Boine, B.; Arthur, K. Mycoviruses of filamentous fungi and their relevance to plant pathology. Mol. Plant Pathol. 2009, 10, 115–128. [Google Scholar] [CrossRef]
  37. Breuillin, F.; Dutech, C.; Robin, C. Genetic diversity of the chestnut blight fungus Cryphonectria parasitica in four French populations assessed by microsatellite markers. Mycol. Res. 2006, 110, 288–296. [Google Scholar] [CrossRef]
  38. Jarne, P.; Lagoda, P.J.L. Microsatellites, from molecules to populations and back. Trends Ecol. Evol. 1996, 11, 424–429. [Google Scholar] [CrossRef]
  39. Selkoe, K.A.; Toonen, R.J. Microsatellites for ecologists: A practical guide to using and evaluating microsatellite markers. Ecol. Lett. 2006, 9, 615–629. [Google Scholar] [CrossRef]
  40. Giraud, T.; Enjalbert, J.; Fournier, E.; Delmotte, F.; Dutech, C. Population genetics of fungal diseases of plants. Parasite 2008, 15, 449–454. [Google Scholar] [CrossRef] [Green Version]
  41. Ahmad, F.; Baric, S. Genetic diversity of Cryphonectria parasitica causing chestnut blight in South Tyrol (northern Italy). Eur. J. Plant Pathol. 2022, 162, 621–635. [Google Scholar] [CrossRef]
  42. Cassago, A.; Panepucci, R.A.; Baião, A.M.T.; Henrique-Silva, F. Cellophane based mini-prep method for DNA extraction from the filamentous fungus Trichoderma Reesei. BMC Microbiol. 2002, 2, 14. [Google Scholar] [CrossRef] [PubMed]
  43. Kubisiak, T.L.; Dutech, C.; Milgroom, M.G. Fifty-three polymorphic microsatellite loci in the chestnut blight fungus, Cryphonectria parasitica. Mol. Ecol. Notes 2007, 7, 428–432. [Google Scholar] [CrossRef] [Green Version]
  44. Davis, J.E.; Kubisiak, T.L.; Milgroom, M.G. Polymorphic sequence-characterized codominant loci in the chestnut blight fungus, Cryphonectria parasitica. Mol. Ecol. Notes 2005, 5, 195–197. [Google Scholar] [CrossRef]
  45. Peakall, R.O.D.; Smouse, P.E. GENALEX 6: Genetic analysis in Excel. Population genetic software for teaching and research. Mol. Ecol. Notes 2006, 6, 288–295. [Google Scholar] [CrossRef]
  46. Eliades, N.G.; Eliades, D.G. HAPLOTYPE ANALYSIS: Software for analysis of haplotype data. Distributed by the authors. In Forest Genetics and Forest Tree Breeding; Georg-Augst University Göttingen: Göttingen, Germany, 2009. [Google Scholar]
  47. Arnaud-Haond, S.; Belkhir, K. GENCLONE: A computer program to analyse genotypic data, test for clonality and describe spatial clonal organization. Mol. Ecol. Notes 2007, 7, 15–17. [Google Scholar] [CrossRef]
  48. Wang, X.R.; Szmidt, A.E.; Ennos, R.A.; Hansson, P. Genetic variability in the canker pathogen fungus, Gremmeniella abietina. 2. Fine-scale investigation of the population genetic structure. Can. J. Bot. 1997, 75, 1460–1469. [Google Scholar] [CrossRef] [Green Version]
  49. Agapow, P.M.; Burt, A. Indices of multilocus linkage disequilibrium. Mol. Ecol. Notes 2001, 1, 101–102. [Google Scholar] [CrossRef]
  50. Dutech, C.; Rossi, J.-P.; Fabreguettes, O.; Robin, C. Geostatistical genetic analysis for inferring the dispersal pattern of a partially clonal species: Example of the chestnut blight fungus. Mol. Ecol. 2008, 17, 4597–4607. [Google Scholar] [CrossRef]
  51. Pritchard, J.K.; Stephens, M.; Donnelly, P. Inference of population structure using multilocus genotype data. Genetics 2000, 155, 945–959. [Google Scholar] [CrossRef]
  52. Falush, D.; Stephens, M.; Pritchard, J.K. Inference of population structure using multilocus genotype data: Linked loci and correlated allele frequencies. Genetics 2003, 164, 1567–1587. [Google Scholar] [CrossRef] [PubMed]
  53. Earl, D.A.; vonHoldt, B.M. STRUCTURE HARVESTER: A website and program for visualizing STRUCTURE output and implementing the Evanno method. Conserv. Genet. Resour. 2012, 4, 359–361. [Google Scholar] [CrossRef]
  54. Evanno, G.; Regnaut, S.; Goudet, J. Detecting the number of clusters of individuals using the software STRUCTURE: A simulation study. Mol. Ecol. 2005, 14, 2611–2620. [Google Scholar] [CrossRef] [PubMed] [Green Version]
  55. Bandelt, H.J.; Forster, P.; Röhl, A. Median-joining networks for inferring intraspecific phylogenies. Mol. Biol. Evol. 1999, 16, 37–48. [Google Scholar] [CrossRef] [PubMed]
  56. Prospero, S.; Rigling, D. Invasion genetics of the chestnut blight fungus Cryphonectria parasitica in Switzerland. Phytopathology 2012, 102, 73–82. [Google Scholar] [CrossRef] [PubMed] [Green Version]
  57. Rostagno, L. Interaction between Cryphonectria parasitica and CHV1: A Model for Virus Caused Hypovirulence. Ph.D. Thesis, Università degli Studi di Torino, Turin, Italy, 2009. [Google Scholar]
  58. Baric, S.; Storti, A.; Hofer, M.; Guerra, W.; Dalla Via, J. Molecular genetic identification of apple cultivars based on microsatellite DNA analysis. I. The database of 600 validated profiles. Erwerbs-Obstbau 2020, 62, 117–154. [Google Scholar] [CrossRef]
  59. Kivelä, M.; Arnaud-Haond, S.; Saramäki, J. EDENetworks: A user-friendly software to build and analyse networks in biogeography, ecology and population genetics. Mol. Ecol. Resour. 2015, 15, 117–122. [Google Scholar] [CrossRef]
  60. Grünwald, N.J.; Goss, E.M. Evolution and population genetics of exotic and re-emerging pathogens: Novel tools and approaches. Annu. Rev. Phytopathol. 2011, 49, 249–267. [Google Scholar] [CrossRef] [Green Version]
  61. Milgroom, M.G.; Sotirovski, K.; Spica, D.; Davis, J.E.; Brewer, M.T.; Milev, M.; Cortesi, P. Clonal population structure of the chestnut blight fungus in expanding ranges in southeastern Europe. Mol. Ecol. 2008, 17, 4446–4458. [Google Scholar] [CrossRef]
  62. Stauber, L.; Badet, T.; Feurtey, A.; Prospero, S.; Croll, D. Emergence and diversification of a highly invasive chestnut pathogen lineage across southeastern Europe. eLife 2021, 10, e56279. [Google Scholar] [CrossRef]
  63. Maresi, G.; Minerbi, S.; Sottovia, A.; Turchetti, T. Der Kastanienrinderkrebs in Südtirol. Allg. Forst Z. Waldwirtsch. Umweltvorsorge 1993, 3, 140–144. [Google Scholar]
  64. Windegger, A. La Lotta Biologica Contro il Cancro del Castagno in Alto Adige. Bachelor’s Thesis, The University of Firenze, Florence, Italy, 1994. [Google Scholar]
  65. Nuss, D.L. Hypovirulence: Mycoviruses at the fungal–plant interface. Nat. Rev. Microbiol. 2005, 3, 632–642. [Google Scholar] [CrossRef] [PubMed]
  66. Zamora, P.; Rigling, D.; Diez, J.J. Detection of hypovirulent isolates of Cryphonectria parasitica in Castilla y Leon, Spain. Acta Hortic. 2008, 784, 163–168. [Google Scholar] [CrossRef]
  67. Castaño, C.; Bassie, L.; Oliach, D.; Gómez, M.; Medina, V.; Liu, B.; Colinas, C. Cryphonectria hypovirus 1 (CHV-1) survey reveals low occurrence and diversity of subtypes in NE Spain. For. Pathol. 2014, 45, 51–59. [Google Scholar] [CrossRef]
  68. Peters, F.S.; Bußkamp, J.; Prospero, S.; Rigling, D.; Metzler, B. Genetic diversification of the chestnut blight fungus Cryphonectria parasitica and its associated hypovirus in Germany. Fungal Biol. 2014, 118, 193–210. [Google Scholar] [CrossRef]
  69. Peever, T.L.; Liu, Y.C.; Cortesi, P.; Milgroom, M.G. Variation in tolerance and virulence in the chestnut blight fungus-hypovirus interaction. Appl. Environ. Microbiol. 2000, 66, 4863–4869. [Google Scholar] [CrossRef] [Green Version]
  70. Demené, A.; Legrand, L.; Gouzy, J.; Debuchy, R.; Saint-Jean, G.; Fabreguettes, O.; Dutech, C. Whole-genome sequencing reveals recent and frequent genetic recombination between clonal lineages of Cryphonectria parasitica in western Europe. Fungal Genet. Biol. 2019, 130, 122–133. [Google Scholar] [CrossRef]
  71. Milgroom, M.G.; del Mar Jiménez-Gasco, M.; Garcia, C.O.; Drott, M.T.; Jiménez-Diaz, R.M. Recombination between clonal lineages of the asexual fungus Verticillium dahliae detected by genotyping by sequencing. PLoS ONE 2014, 9, e106740. [Google Scholar] [CrossRef] [Green Version]
  72. Henk, D.A.; Shahar-Golan, R.; Devi, K.R.; Boyce, K.J.; Zhan, N.; Fedorova, N.D.; Nierman, W.C.; Hsueh, P.-R.; Yuen, K.-Y.; Sieu, T.P.M.; et al. Clonality despite sex: The evolution of host-associated sexual neighborhoods in the pathogenic fungus Penicillium marneffei. PLoS Pathog. 2012, 8, e1002851. [Google Scholar] [CrossRef]
  73. Romon-Ochoa, P.; Kranjec Orlović, J.; Gorton, C.; Lewis, A.; van der Linde, S.; Pérez-Sierra, A. New detections of chestnut blight in Britain during 2019–2020 reveal high Cryphonectria parasitica diversity and limited spread of the disease. Plant Pathol. 2021. [Google Scholar] [CrossRef]
  74. Associazione Turistica Lana e Dintorni. L’uomo Che Sussurrava… Alle Castagne. Available online: https://www.merano-suedtirol.it/it/lana-e-dintorni/informazioni-servizi/brochures/greatthings/l-uomo-che-sussurrava-alle-castagne.html (accessed on 1 October 2021).
  75. Mair, K. Die Esskastanien-Gallwespe–ein neuer, gefährlicher Schädling. Obstbau Weinbau 2009, 46, 149–150. [Google Scholar]
Figure 1. The results of the Structure analysis, showing the delta K values (a) and the mean probability of the data (b) for each tested K value. The bar plot (c) shows the assignment of individual isolates of Cryphonectria parasitica from each chestnut stand to one of the three (K = 3) groups (ST-1, blue; ST-2, orange; ST-3, green). The labels on the bottom indicate the chestnut stands (for the localities, see Supplementary Table S1), which are separated with thin black vertical lines. The labels above the bar represent the district names, which are separated by bold vertical lines.
Forests 13 00344 g001
Figure 2. The median-joining network of Cryphonectria parasitica multilocus haplotypes from South Tyrol obtained with Network [55]. The lengths of the lines roughly visualize the genetic distances. Each number next to the node represents a microsatellite haplotype (MSH), whereas each group represents the genetic clusters found in South Tyrol through Structure analysis (ST-1, blue; ST-2, orange; ST-3, green). Each node is a haplotype, whereas the node area corresponds to the haplotype frequency that was found. Microsatellite genotypes assigned to the recombinant group are indicated in yellow.
Forests 13 00344 g002
Figure 3. The Principal Coordinate Analysis (PCoA) of Cryphonectria parasitica genotypes found in South Tyrol (a) and globally (b). Each genotype found in South Tyrol was assigned to a genetic cluster (ST-1, ST-2 or ST-3) or to the recommbinant group (F1), based on the Structure analysis (a).
Forests 13 00344 g003
Figure 4. The straight line and decreasing slope of the Pareto distribution reveals that the population of Cryphonectria parasitica in South Tyrol is mainly clonal, with a few dominant lineages and many rare genotypes.
Forests 13 00344 g004
Figure 5. The probability of the first (Pgen) and second (Psex) occurrences of multilocus genotypes (haplotypes) of Cryphonectria parasitica resulting from random sexual reproduction that were found more than once in South Tyrol. A significant p-value (p < 0.5) demonstrates the high probability that these haplotypes occurred for the first time (Pgen) or the second time (Psex) through random sexual reproduction.
Forests 13 00344 g005
Table 1. A list of the microsatellite primers used for the molecular genetic characterization of Cryphonectria parasitica and their amplicon size range found in South Tyrol.
Primer NameSequence (5′ to 3′) aConc. [µM] bSize Range (bp) cNA dNucleotide MotifMultiplex ReactionReference
CPE1-F6-FAM-GTCTCACCACACATCGCAAG0.4
0.4
127–1452(GT)n3[37]
CPE1-RTCATCACGACAAAAGAAGACG
CPE3-F6-FAM-CAACTCGTCACCCACCTTG0.2188–1902(GT)n1[37]
CPE3-RATAGGCATTCTCCGCTCTTG0.2
CPE5-FHEX-TGTCAACAACGGTCAACACC0.2
0.2
248–2573(AAC)n3[37]
CPE5-RCGGAGAGGAGAACTCTGAGAC
CPE8-F6-FAM-GCGAGCAAGCGTGATTCC0.4
0.4
109–1152(AAC)n2[37]
CPE8-RGCTCGTCCTGGTCCTCCT
CPG3-FHEX-CGTAAGGCAGAGGCAGAGAC0.2
0.2
194–2123(GT)n2[37]
CPG3-RTCCCTATGCCCAAGACACTC
CPG4-F6-FAM-ATGCTCCGAAGGTTTGTCAC0.2
0.2
186–2063(GA)n3[37]
CPG4-RCAACCGCAATCTGTTTCCTC
CPG6-F6-FAM-ATCATCACGACGCAATGGTA0.2
0.2
240–2623(GA)n1[43]
CPG6-RTCCGGGCATTCAGCAMAT
CPG14-F6-FAM-TTCTGAAGGTGGTTGTGGTG0.2
0.2
252–2642(AGGAAG)n3[43]
CPG14-RGGTCCGAACCATCAAAAGAC
CPSI006-FHEX-ATGTCGAGTTTACCCGATGG0.2
0.2
133–1393(AC)n1 e[43]
CPSI006-RGAGATGTGTGGAATGCAACG
CPSI009-F6-FAM-ATCATCCATCCTGTCCGAGT0.2
0.2
138–1564(AT)n2 e[43]
CPSI009-RTGGGGTTGGCATAATCTTCT
IO7-650-F6-FAM-CATGCGAGAAATGCAGGAGTGTTG0.2
0.2
270–2903(AC)n2[44]
IO7-650-RGGGCTCCAGGATATCGAAGACATT
a The fluorescent dyes used to label the forward primers at the 5′ end are provided in italics; b the final concentration of each primer used in the polymerase chain reaction; c the range of fragment lengths determined in South Tyrol; d NA, the number of alleles of each microsatellite locus found in South Tyrol; e the amplification in a singleplex reaction and the addition of the PCR product to multiplex reaction prior to fragment analysis.
Table 2. The conversion values used to adjust the allele sizes at different microsatellite loci of Cryphonectria parasitica to compare the data from previous studies to the data obtained in this study.
SSR LocusSwitzerland
[56]
France
[11]
Northern Italy
[57]
China, Japan and USA [12]
CPE1−3−2−2−2
CPE3−4−4−4−4
CPE5−4−3−3−3
CPE8−2−3−3−3
CPG3−4−2−2−2
CPG4−3−1−1−1
CPG6−3−2−2−2
CPG14−4−3−3−3
IO7-650−4---
CPSI006--−3-
CPSI009--−4-
Table 3. The occurrence of the different multilocus microsatellite haplotypes of Cryphonectria parasitica in the chestnut stands of South Tyrol.
District aChestnut Stand bN. IsolatesN. HaplotypesDominant Haplotype c
Val Venosta–VinschgauTAP41-
WIN42-
GOG147MSH14
VET124MSH14
KGK52MSH14
AUF53MSH14
ALTO33-
WEIR53*
Burgraviato–BurggrafenamtALAL74MSH14
BRUG51MSH14
MOAR106*
CRIS72MSH21
WIB75*
KAL65*
BLAS11-
OBER22-
BRUN101MSH14
Valle Isarco–EisacktalISC74MSH14
OBG144*
OBK41MSH14
SPR52MSH14
TSB11-
Salto-Sciliar–Salten-SchlernFLK43-
GRU74MSH14
JOG32-
TES11-
KLS43-
NOP133*
PIE32-
NOC42-
PLA94MSH40
Oltradige-Bassa Atesina–Überetsch-UnterlandHOAN103MSH21
UNT81MSH14
RUTT74*
MUL11-
Monticolo ForestMont2312MSH11
a South Tyrol is a bilingual region and in this table, the names of the districts are provided in the official languages Italian and German, whereas in the text, only Italian names are used for simplicity reasons; b The names of the municipalities in which the chestnut stands are located can be found in Supplementary Table S1; c the dominant (>50%) multilocus microsatellite haplotype; * no haplotype exceeded the frequency threshold of 50%; - stands with less than five isolates were not assigned a dominant haplotype.
Table 4. The association of the five most dominant microsatellite haplotypes of Cryphonectria parasitica with the results obtained for other molecular genetic markers from a previous study [41].
Microsatellite HaplotypenC aMAT-1 bMAT-2 bDominant VC Type c% of Dominant VC Type dHaplotype ITS
H1H2H3
MSH14108ST-26835EU-284.11161
MSH2125ST-3322EU-1380.0300
MSH4011ST-137EU-554.6101
MSH4611ST-374EU-1790.9100
MSH87ST-1×2 *15EU-283.3020
a The assignment to one of three groups or to recombinants among them (*) was based on the Structure analysis; b the number of isolates that belong to a particular mating type; c the most dominant vegetative compatibility type associated with a multilocus microsatellite haplotype; d the percentage of the most dominant VC type associated with a multilocus microsatellite haplotype.
Publisher’s Note: MDPI stays neutral with regard to jurisdictional claims in published maps and institutional affiliations.

