Article

Effects of Nitrogen Addition on Microbial Carbon Use Efficiency of Soil Aggregates in Abandoned Grassland on the Loess Plateau of China

1
College of Life Sciences, Yan’an University, Yan’an 716000, China
2
Shaanxi Key Laboratory of Chinese Jujube, Yan’an University, Yan’an 716000, China
3
College of Agronomy, Northwest A & F University, Yangling, Xianyang 712100, China
*
Author to whom correspondence should be addressed.
Forests 2022, 13(2), 276; https://doi.org/10.3390/f13020276
Submission received: 20 December 2021 / Revised: 4 February 2022 / Accepted: 5 February 2022 / Published: 9 February 2022
(This article belongs to the Section Forest Soil)

Abstract

:
Soil microbial carbon use efficiency (CUE) plays a crucial role in terrestrial C cycling. However, how microbial CUE responds to nitrogen addition and its mechanisms in soil aggregates from abandoned grassland systems remains poorly understood. In this study, we designed a nitrogen (N) addition experiment (0 (N0), 10 (N1), 20 (N2), 40 (N3), 80 (N4) kg N ha−1yr−1) from abandoned grassland on the Loess Plateau of China. Subsequently, the enzymatic stoichiometry in soil aggregates was determined and modeled to investigate microbial carbon composition and carbon utilization. The vegetation and soil aggregate properties were also investigated. Our research indicated that soil microbial CUE changed from 0.35 to 0.53 with a mean value of 0.46 after N addition in all aggregates, and it significantly varied in differently sized aggregates. Specifically, the microbial CUE was higher and more sensitive in macro-aggregates after N addition than in medium and micro-aggregates. The increasing microbial CUE in macro-aggregates was accompanied by an increase in soil organic carbon and microbial biomass carbon, indicating that N addition promoted the growth of microorganisms in macro-aggregates. N addition significantly improved the relative availability of nitrogen in all aggregates and alleviated nutrient limitation in microorganisms, thus promoting microbial CUE. In conclusion, our study indicates that soil microbial CUE and its influencing factors differ among soil aggregates after N addition, which should be emphasized in future nutrient cycle assessment in the context of N deposition.

1. Introduction

Large-scale vegetation restoration has been used to control soil erosion and improve ecological conditions in the Loess Plateau of China [1,2]. Abandoned grassland is one of the most essential vegetation restoration types, accounting for about 42% of the total vegetation area of the Loess Plateau [3]. In recent decades, vegetation restoration has provided large potential carbon sequestration and accumulation and has played a crucial role in regulating the carbon cycle and mitigating climate change [4,5]. Soil microbial carbon use efficiency (CUE), defined as the ratio between the carbon (C) allocated to growth and the C taken up by microorganisms, is a pivotal index for controlling C cycling in terrestrial ecosystems [6], which ultimately determines soil C storage. However, nitrogen (N) availability in soil strongly controls microbial growth and respiration, and hence microbial CUE, as microbes need to maintain a balanced ratio of C to nutrients in their cells [7]. Li et al. conducted a long-term N addition experiment in temperate forest soil in 2021 and reported that N addition could control the soil C cycling process by affecting microbial CUE [8], indicating that the change in microbial CUE is affected by nitrogen availability [9]. However, the responses of microbial CUE to N addition vary considerably, from positive [8,10,11] or neutral [12] to negative [13,14]. There is still limited understanding of the magnitude and direction of the changes in microbial CUE in the context of different nitrogen inputs. Therefore, it is urgent to explore the varying CUE patterns and their underlying mechanism under ongoing N deposition.
Several studies have reported that soil microbial CUE varied with different N addition levels because of changed soil properties. For example, Devêvre et al. reported in 2000 that N addition could reduce the C:N ratio of the soil substrate, determining the direction of microbial CUE [15]. This is because microbial communities usually have higher CUE when using substrates with a low C:N ratio. Soil pH can also affect microbial CUE. Soil acidification results in conversion from microbial N limitation to C limitation. In response to the increasing C limitation, the microbial community tends to alter the soil’s enzymes and increase CUE under soil acidification [16]. In addition, soil microbial CUE is also driven by soil aggregate size and other factors. For instance, Wang et al.’s research on the agroecosystem of a tea plantation in 2017 revealed that the microbial biomass of C and respiration rate were higher in macro-aggregates [17]. At the same time, Chen et al. also reported in 2019 that soil macro-aggregate structures have an important impact on soil carbon stability and microbial community structure and activity and promote the protection of soil organic carbon [18]. In particular, a meta-analysis also showed that nitrogen addition significantly increased the proportion of macro-aggregates and promoted the accumulation of particulate organic C by increasing macro-aggregate C and soil acidification [19]. However, there is uncertainty about soil carbon sequestration because of the differences between carbon microbial metabolic activities [20] and carbon components [21] in different aggregates. Therefore, it is not clear how nitrogen addition affects the size and direction of microbial CUE through the vegetation community, soil physical and chemical properties, carbon composition, and aggregates.
To fill this knowledge gap, we conducted an N addition experiment with urea (CH4N2O) in the abandoned grassland of the Loess Plateau, aiming to reveal the response of microbial CUE under N addition in different soil aggregate sizes and to explore how environmental variables affect microbial CUE in soil after N addition. Since previous studies have reported that more unstable soil organic carbon (SOC) is formed in macro-aggregates than in micro-aggregates [22] and microbial activity in soil macro-aggregates are higher and more sensitive to nitrogen fertilization [23], we hypothesize that (1) microbial CUE in all three soil aggregates will show an increasing trend with the increasing N addition concentration, (2) microbial CUE in macro-aggregates will be more sensitive after N addition than in micro-aggregates, and (3) the microbial CUE will be affected by the soil’s nitrogen availability and carbon components after N addition. This study may contribute to a future assessment of the terrestrial ecosystem carbon cycle in the context of climate change.

2. Materials and Methods

2.1. Site Description

The experimental land was located in the Wuliwan catchment, located in Ansai County, Shaanxi Province, on the Loess Plateau, China (36°52′ N; 109°21′ E, 1061–1371 m above sea level). This area is characterized by a typical warm temperate semi-arid climate, with a mean annual temperature of 8.8 °C and annual precipitation of 505 mm. The nitrogen deposition of this area is 10.49 kg N ha−1yr−1. The soil is mainly composed of Calcisols with a typical loose and soft texture (judged by the Food and Agriculture Organization of the United Nations), and the average soil pH is 8.4. The dominant herbaceous species in the sample land are Artemisia sacrorum, Stipa bungeana, Melilotus officinalis, Lespedeza floribunda, etc.

2.2. Experimental Design

A typically abandoned grassland was selected in the Wuliwan catchment in March 2017, and 15 plots (3 m × 3 m) were established in this land. The distance between each plot was >1 m. The 15 plots were divided into 3 blocks to reduce errors caused by potential topographic position and nutrient heterogeneity. A total of 5 treatments with different N addition levels (0, 10, 20, 40, 80 kg N ha−1yr−1, represented by N0, N1, N2, N3, N4) were added into each block, and each treatment was repeated 3 times. Urea (CH4N2O) was used as fertilizer. The nitrogen deposition in this area is mainly distributed in the growth period (mainly May to October) [24]. To simulate the continuous but uneven N deposition throughout the year, the fertilization experiment was conducted in March, June, September, and December, with 1/6, 1/3, 1/3, and 1/6 of the total fertilizer used in a year, respectively. The fertilizers were dissolved in 1.5 L water and sprayed evenly, close to the soil surface. The control (N0) was treated the same way, except urea was not added.

2.3. Vegetation Community Characteristics

Five small quadrats (1 m × 1 m) were selected to conduct a vegetation survey. The overall vegetation coverage and the name, height, and coverage of all species were recorded in each small quadrat. In addition, the surface litter of each small quadrat was collected in autumn and then dried at 80 °C until its weight remained unchanged. Then, the dry litters were weighed. In mid-August, the aboveground parts of the plants in 3 random small quadrats were cut off and then dried at 65 °C to a constant weight, and this dry weight constitutes the vegetation’s aboveground biomass.
The Shannon–Wiener index (H) was used to reflect the species diversity of the herb community, which was calculated as:
H = P i l n P i
where Pi is the ratio of the number of individuals of the ith species to the number of individuals of all species.

2.4. Soil Sampling and Aggregate Fractionation Sieving

Soil samples were collected in August 2020 after three years of fertilization. Three sample points were selected along the diagonal of each quadrat. The topsoil was collected with an aluminum box (20 cm × 12 cm × 6 cm) after removing surface litter to avoid breaking the soil structure. The soil samples were immediately transported to the laboratory and broken into small pieces with sizes of about 1 cm3 along the natural cracks; the root, gravel, animal, and plant residues were also picked out. Three soil samples from the same quadrat were mixed for subsequent aggregate grading. The optimal moisture sieving procedure was used for the separation of soil aggregates [25]. In brief, the soil clods were partially dried to a 10% water content at 4 °C in an incubator. The dried soil (about 500 g) was placed on a stack of sieves with 2 mm and 0.25 mm mesh openings. The sieves were shaken at 200 rpm for 3 min. Then, differently sized aggregates were obtained, including macro-aggregates (>2 mm), medium aggregates (2–0.25 mm), and micro-aggregates (<0.25 mm). Additionally, the soil properties were determined at aggregate scales. The soil sample for each aggregate was divided into three parts. One part was stored at −20 °C for determining the soil enzyme activity and soil microbial biomass, one part was used to determine the soil physical and chemical properties after air-drying, and the final part was dried at 105 °C and weighed to calculate the weight of the aggregates of each size.

2.5. Soil Property Analyses

SOC was measured using the K2Cr2O7 oxidation method [26]. The soil’s dissolved organic carbon (DOC) was determined by a total organic carbon analyzer (TOC-L, Shimadzu, Kyoto, Japan) after water extraction and filtered through a 0.45 µm filter membrane [26], which represents the unstable carbon component easily used by the microorganisms in the soil. Soil labile organic C (LOC) was determined by the KMnO4 (333 mol L−1) oxidation method [27], which can reflect the availability and timeliness of SOC to varying degrees. Total nitrogen (TN) in the soil was determined following the Kjeldahl digestion method [28]. The soil’s total phosphorus (TP) was determined by H2SO4–HClO4 digestion and then Mo-Sb anti-spectrophotography method [29]. Soil pH was measured in 1:5 mixtures of soil and deionized water using a pH meter (INESA Scientific Instrument Corp. Shanghai, China). Soil bulk density (SBD, g cm−3) was calculated from the weight of the soil cores after drying at 105 °C [30]. The soil’s microbial biomass carbon (MBC), nitrogen (MBN), and phosphorus (MBP) were analyzed by the chloroform fumigation-extraction method [31,32,33].

2.6. Soil Enzyme Activity Assays

The soil was pre-cultured for one week before determining enzyme activity to offset the effect of low temperature on enzyme activity. Four enzymes related to microbial metabolism rates and biogeochemical processes were measured, including β-1,4-glucosidase (BG, EC 3.2.1.21), β-1,4-n-acetylglucosaminidase (NAG, EC 3.2.1.30), leucine aminopeptidase (LAP, EC 3.4.11.1), and alkaline phosphatase (ALP, EC 3.1.3.1). These enzymes were generally used as indicators of microbial nutrient demand [34]. All four enzymes’ activities were determined using the modified method of standard fluorometric techniques as described in [35]. The fluorometric substrates used for BG, NAG, LAP, and ALP were 4-MUB-β-D-glucoside, 4-MUB-N-acetyl-β-D-glucosaminide, L-Leucine-7-amido-4-methylcoumarin, and 4-MUB-phosphate, respectively. The soil enzymatic activity was expressed as nmol·h−1·g−1 dry soil.

2.7. Calculation of Microbial Carbon Use Efficiency

Microbial carbon use efficiency was estimated from stoichiometric relationships in our study. This calculation method was based on two assumptions: (1) indicator enzyme activities have steady-state scaling coefficients of approximately 1.0 in relation to microbial production and organic matter concentration; and (2) microbial communities exhibit optimum resource allocation with respect to enzyme expression and environmental resources [6]. Specifically, the microbial CUEs were calculated based on C:N and C:P stoichiometry using Formulas (2) and (3) [6]. C:X represents the C:N or C:P ratio. EEAC:X, calculated as BG:(NAG + LAP) or BG:ALP, was the ecological enzyme activity ratio of C and X obtained from the environment. C:X ratios of the microbial biomass were used as estimates of BC:X. LC:X represents the C:N or C:P:
C U E C : X = C U E m a x S C : X ( S C : X + K X )
S C : X = 1 E E A C : X B C : X L C : X
where SC:X represents the extent to which the allocation of EEAs offsets the difference between the elemental composition of available resources and the composition of microbial biomass [6]. In this model, the value of KX is assumed to be 0.5. CUEmax was set as 0.6, which is the upper limit for microbial growth efficiency based on thermodynamic constraints [6]. Finally, the microbial CUE used in this study is the arithmetic mean of CUEC:N and CUEC:P.

2.8. Statistical Analyses

All data were distributed normally based on the Kolmogorov–Smirnov test (p > 0.05 for each null hypothesis). One-way analysis of variance (ANOVA) and Duncan’s multiple comparisons were used to test the effects of N addition and soil aggregates on the variables measured in this study. The relationship between soil microbial CUE and carbon composition was analyzed by linear regression analysis. A Mantel test was used to test the correlation between microbial CUE and the environmental impact factor matrix under N addition treatment. Pearson’s correlation analysis was used to evaluate the correlation between soil microbial CUE and ecological factors. Variance allocation analysis (VPA) was also performed to identify the influence of different categories of indicators on soil microbial CUE. All the analyses were performed using the R 3.6.2 (R Core Team, Vienna, Austria).

3. Results

3.1. Changes in Vegetation Community and Soil Characteristics

N addition significantly improved vegetation community characteristics, such as coverage, species number, Shannon–Wiener index, and plant biomass (Table 1, p < 0.05). At the same time, the soil’s physical and chemical properties also changed. In detail, the addition of N significantly reduced the soil’s pH, but the contents of SOC, TN, NO3-N, MBC, and MBN in the soil first decreased and then increased with the increasing N concentration. Soil BG, LAP, NAG, and ALP activities decreased from N0 to N2 by 43.67%, 29.36%, 6.43%, and 21.32%, respectively, and then significantly increased from N2 to N4 (p < 0.05). The LOC and AP in soil significantly increased with the increasing N concentration (p < 0.05), and the CUE and NH4+-N in the whole soil showed no significant changes.
More importantly, the soil properties varied with different aggregate sizes (Table 2). With the increasing N concentration, the soil TN content first decreased and then increased in three aggregates (p < 0.05), but the soil TP did not change significantly. NO3-N decreased in micro-aggregates; it decreased first and then increased in medium and macro-aggregates (p < 0.05). Soil AP content increased with N addition in medium aggregates (p < 0.05). N addition and soil aggregate size significantly affected the enzymatic activities (p < 0.05). The BG decreased first and then increased in soil micro-aggregates, while it increased in soil medium and macro-aggregates with the increasing N concentration (p < 0.05). The NAG and LAP increased with the increasing N concentration in all three soil aggregates (p < 0.05). The ALP increased and then decreased with the increasing N concentration in all three soil aggregates. The soil TP, NH4+-N, MBN, and MBP showed no significant differences at different N addition levels and soil aggregate sizes.

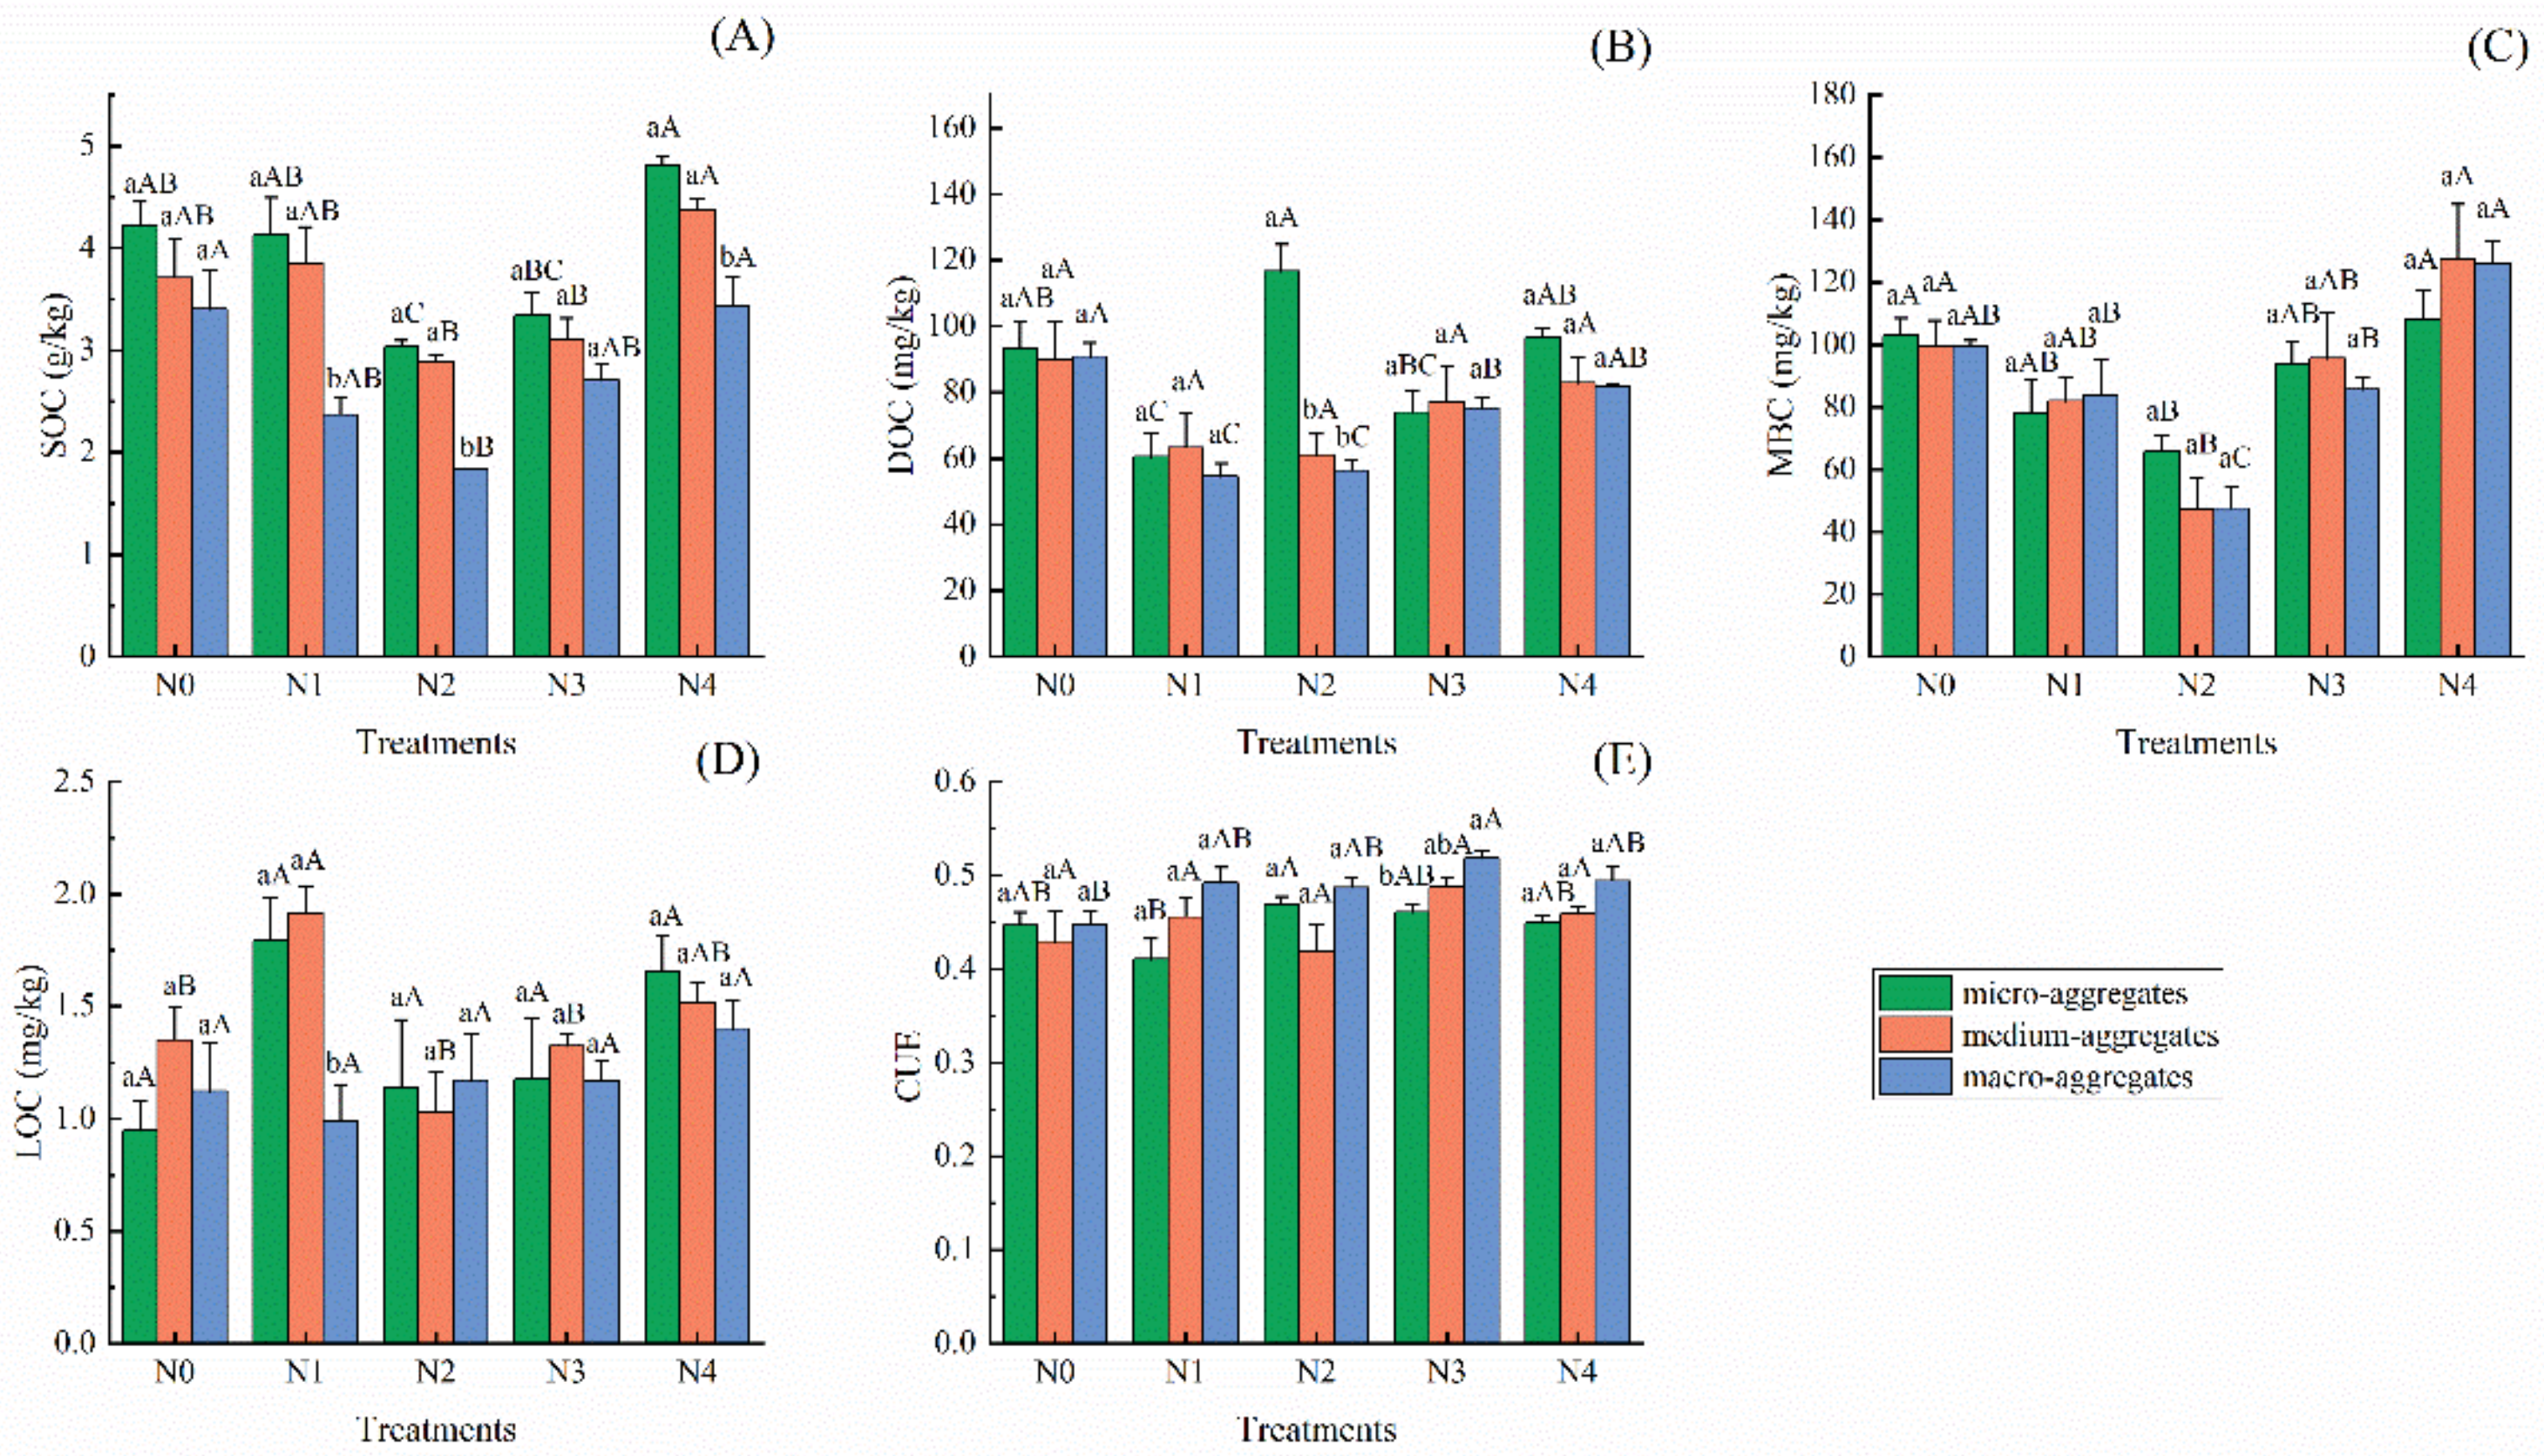
3.2. Variations in Soil Aggregate Carbon Composition and Microbial CUE under Different N Addition Concentration

The SOC was higher in soil micro-aggregates and was significantly decreased from N0 to N2 and then increased from N2 to N4 along with the increasing N concentration in all three aggregate sizes (p < 0.05). The coefficient of variation of SOC among N addition treatments in macro-aggregates was 0.27, which was much higher than that in medium and micro-aggregates (0.19). The soil MBC and DOC also showed decreased and then increased trends with increasing N concentration (p < 0.05), but the differences among different aggregate sizes were not significant (Figure 1). The soil LOC showed no significant differences at different N addition levels and soil aggregate sizes. Moreover, N addition had a positive effect on microbial CUE, especially in macro-aggregates.
The SOC showed a significant negative correlation with soil microbial CUE in macro-aggregates (Figure 2A, p < 0.05). DOC had a significant positive correlation with CUE in medium aggregates (Figure 2B, p < 0.05). However, there was no significant correlation between the CUE and other soil C components.

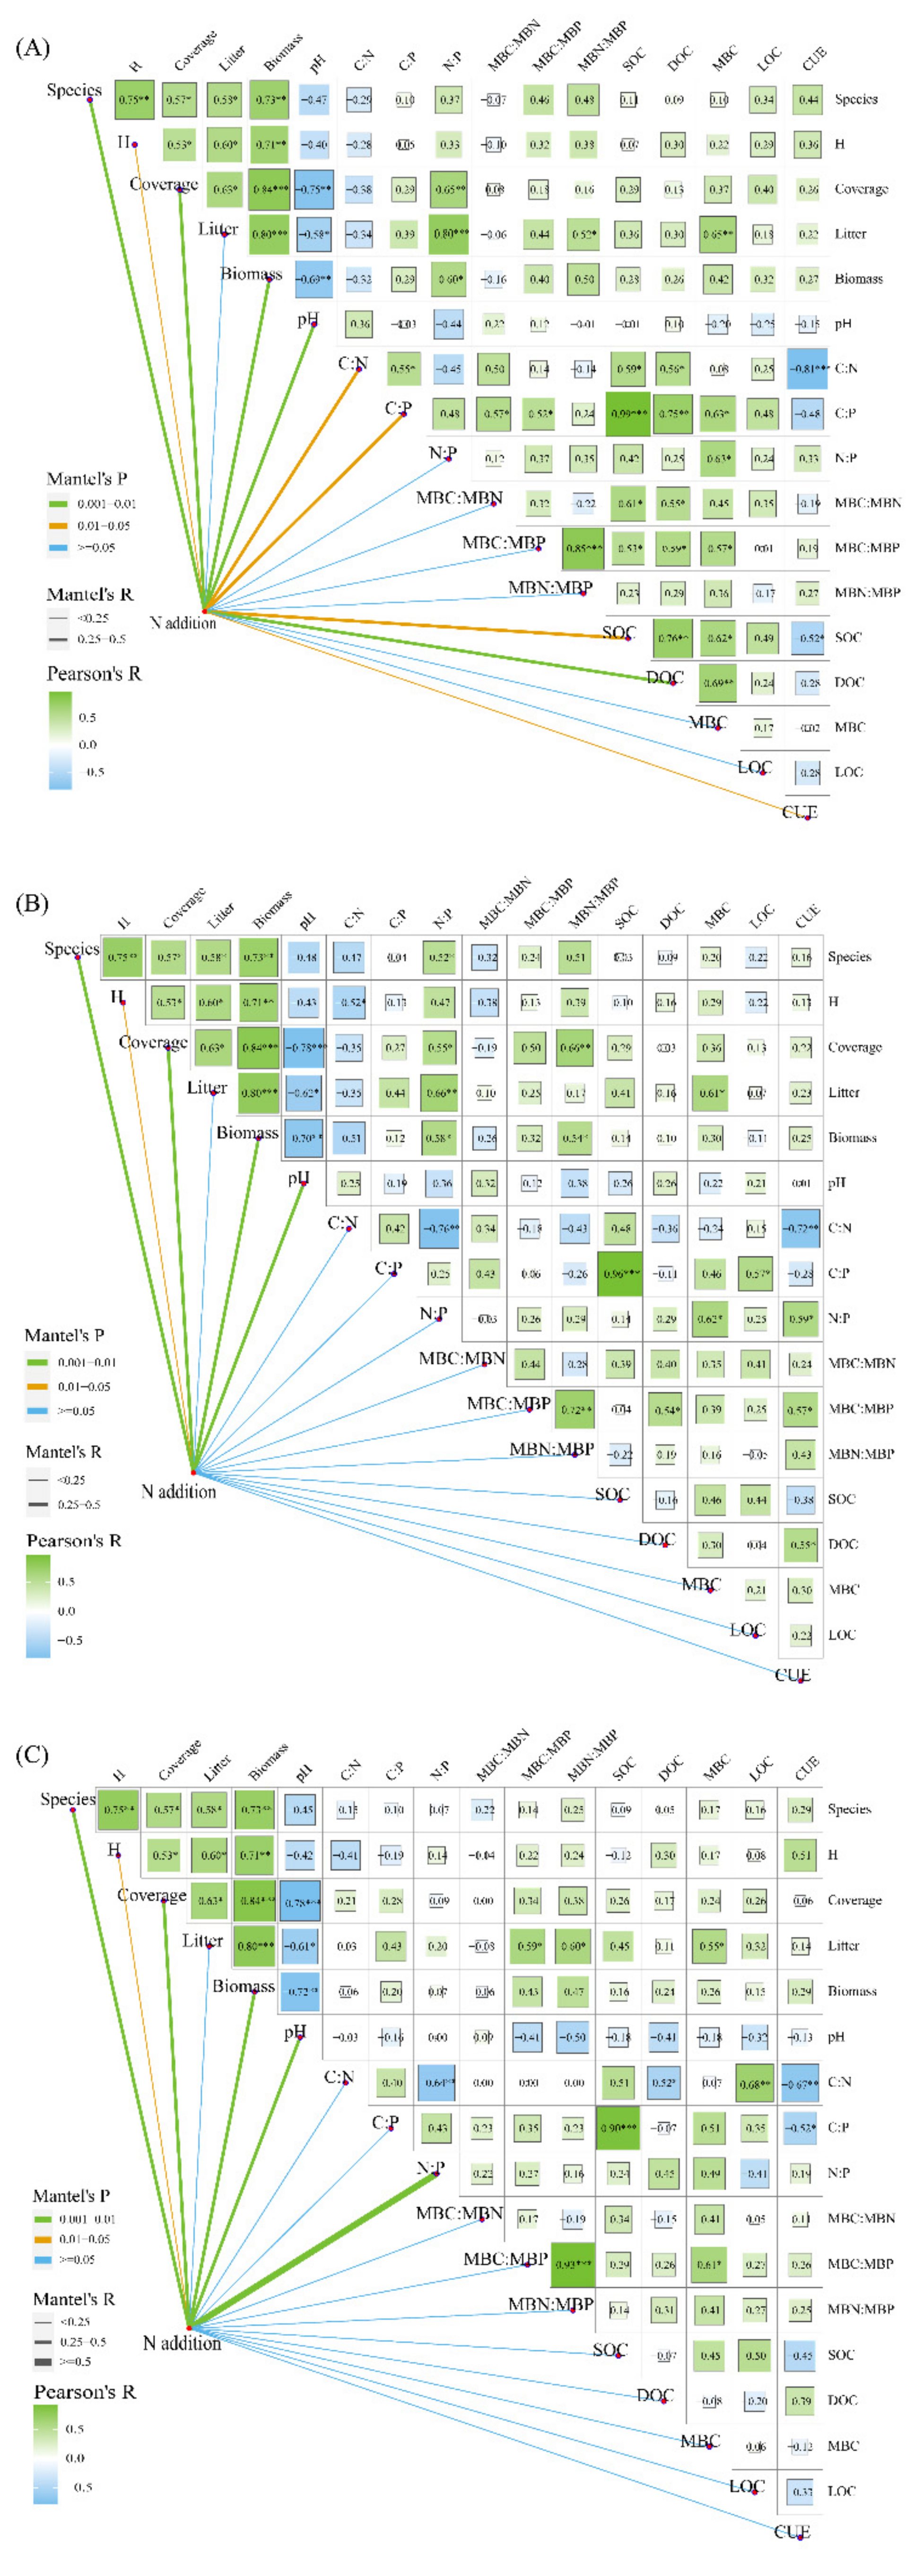
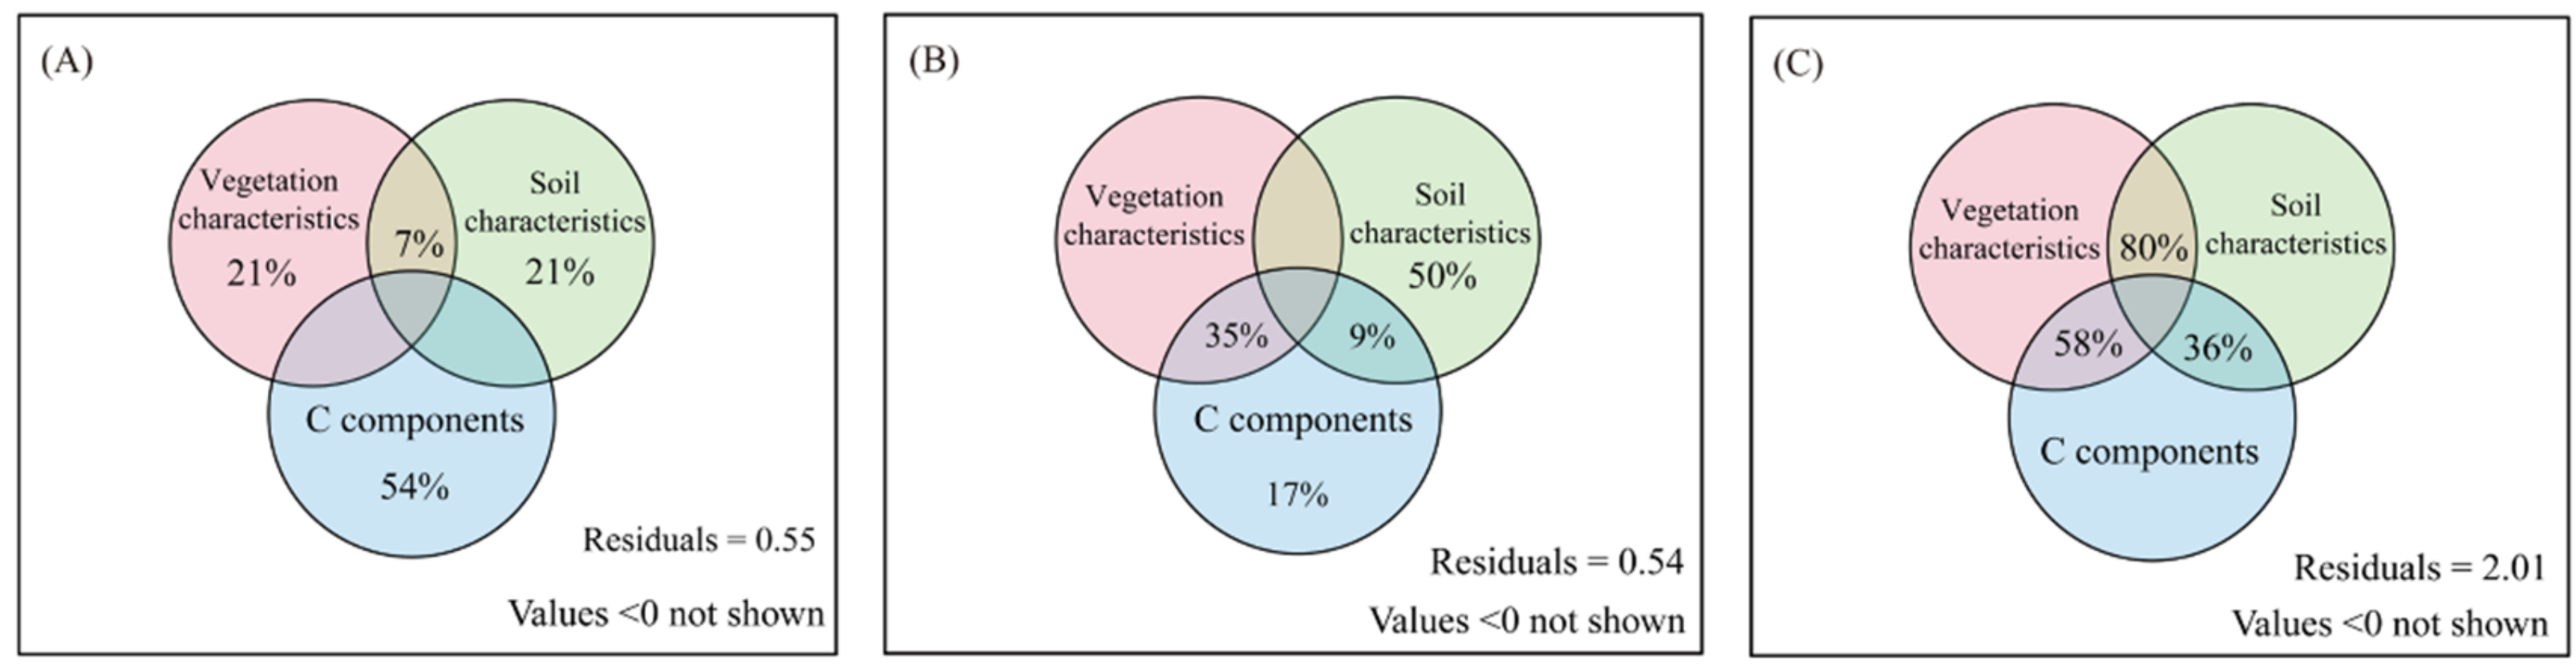
3.3. Effects of Vegetation Community, Soil Characteristics, and Carbon Components on Microbial Carbon Use Efficiency

The Mantel test was used to test the correlation between soil microbial CUE and environmental impact factor matrix in different soil aggregate sizes. We found that the responses of microbial CUE to environmental variables varied with aggregate size (Figure 3). For soil macro-aggregates, SOC (r = −0.52) and C:N (r = −0.81) were negatively and significantly related to microbial CUE (p < 0.01). The C:N ratio exhibited a positive and strong association with SOC and DOC (p < 0.05). N addition was significantly correlated with soil C:N, SOC, and DOC (Figure 3A, p < 0.01). In medium aggregates (Figure 3B), C:N (r = −0.72, p < 0.01) was significantly negatively correlated, whereas N:P (r = 0.59, p < 0.05) was positively correlated with microbial CUE. Furthermore, N:P exhibited a positive association with vegetation species number, coverage, and biomass. N addition was significantly correlated with vegetation species, coverage, and vegetation biomass (p < 0.01). In micro-aggregates (Figure 3C), C:N was significantly negatively correlated with microbial CUE (r = −0.67, p < 0.01) and N:P (r = −0.64, p < 0.01), and N addition also had a strong and significant impact on N:P (p < 0.01).
The results of variation partitioning analysis (VPA) showed the effects of the soil’s physicochemical properties, vegetation characteristics, and C components on soil microbial CUE in three aggregates (Figure 4). In the macro-aggregates, the carbon component had the highest effect on microbial CUE (54%), followed by vegetation and soil characteristics (21%). In the medium aggregates, the influence of soil characteristics on CUE was the highest (50%). In micro-aggregates, the interaction among C components, soil characteristics, and vegetation characteristics had a prominent impact on CUE. In general, from macro-aggregates to micro-aggregates, the independent effect of carbon components on CUE is gradually decreasing, and the interaction effects between different factors are gradually strengthening.

4. Discussion

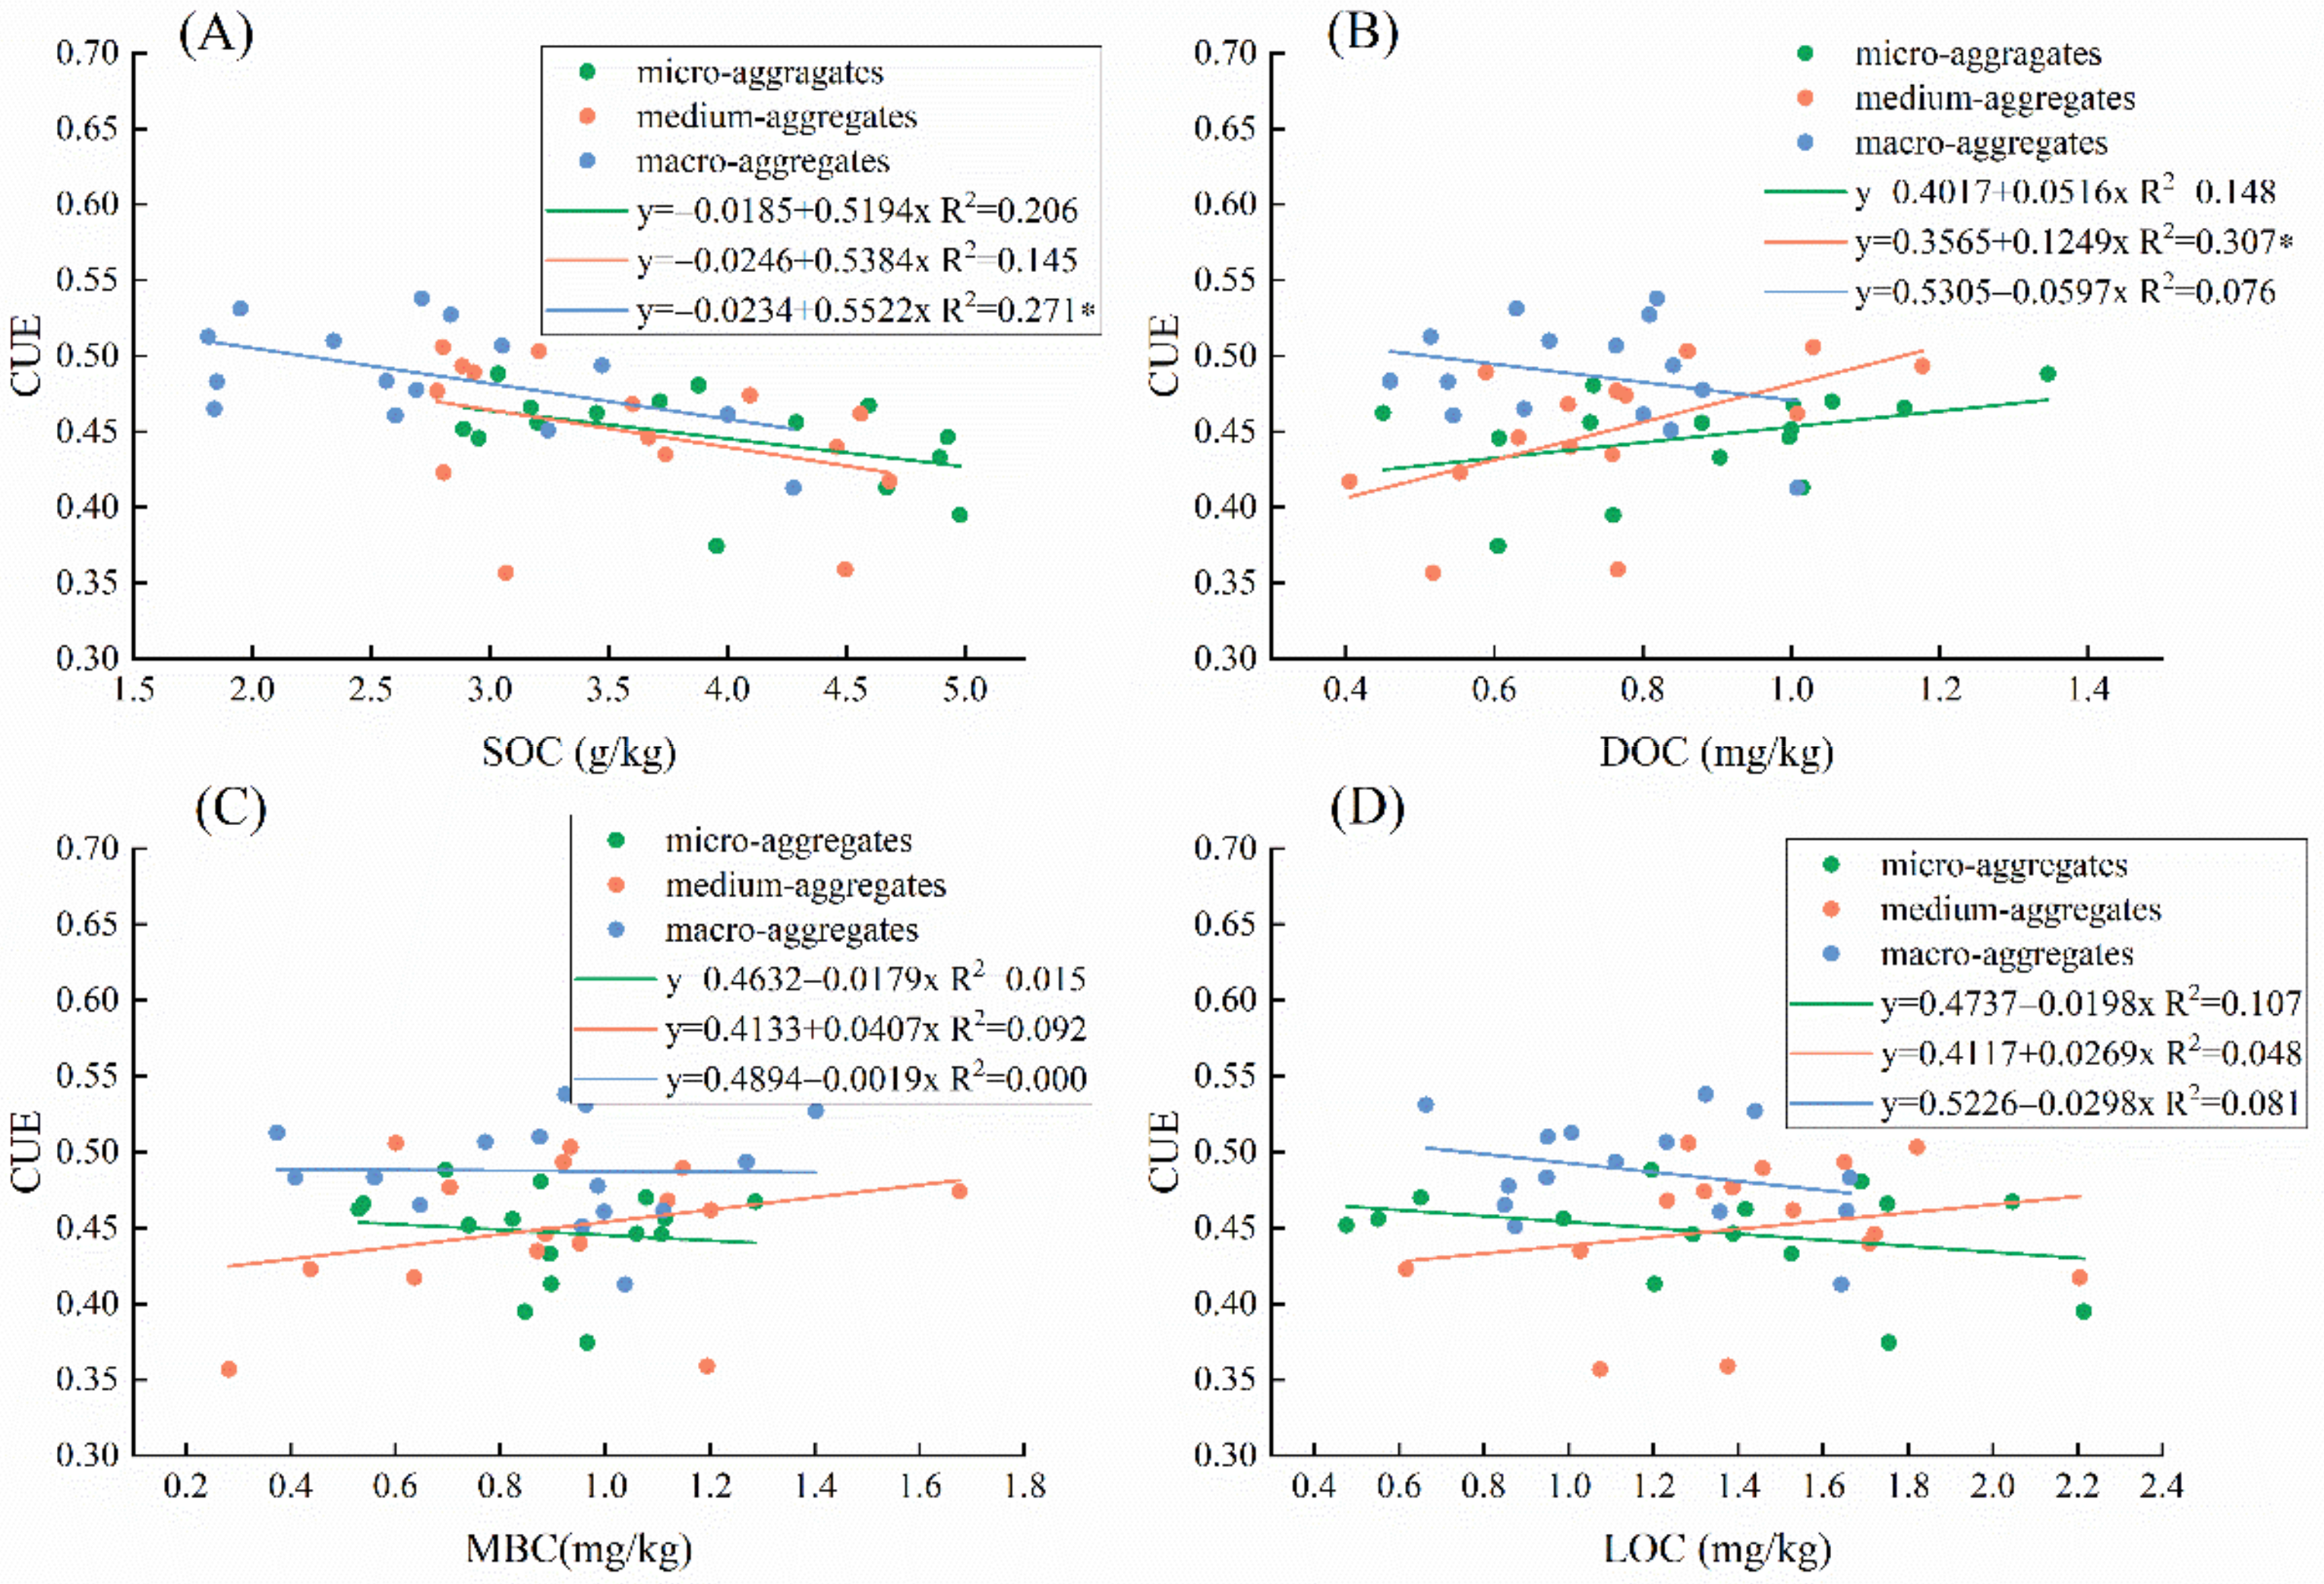
4.1. Linkages of Soil Aggregate Carbon Components and Microbial Carbon Use Efficiency

We found that soil microbes in 3 aggregates invested 0.35–0.53 of the C they absorbed into growth (mean CUE of macro-, medium, and micro-aggregates, respectively, were 0.48, 0.45, and 0.44), which approaches the upper limit for microbial growth efficiency (0.6) based on thermodynamic constraints [36,37]. More importantly, soil microbial CUE in macro-aggregates increased under N addition, indicating that nitrogen addition can increase the utilization of carbon by microorganisms, stimulate microbial growth, and promote carbon absorption [11]. However, N addition did not increase microbial CUE in medium and micro-aggregates. The possible reason affecting microbial CUE is soil substrate availability [38]. Specifically, when soil microorganisms use substrates with low availability, they will change their resource allocation, enhance carbon investment in resource acquisition, and then invest more carbon sources in secreting extracellular enzymes to decompose substrates and obtain carbon, eventually leading to lower microbial CUE [9,39,40]. In contrast, high available substrates can be easily used by microbes without investing more C resources to secrete extracellular enzymes, and thus microbes may yield a higher CUE value. In our study, we observed increased vegetation biomass, litter return (Table 1), and soil DOC in macro-aggregates (Figure 1) under high nitrogen addition, which may indicate an improved availability of substrates. However, contrarily to our study, it is also reported that microbial CUE either decreased [14] or had no effect [12] after nitrogen addition in grassland soils, which is interpreted as the decrease in the fungi:bacteria ratio potentially reducing microbial CUE [37] or the respiration and growth of the microbial community under nutrient addition maybe coupling more tightly, leading to unaltered CUE [12]. This inconsistent change in microbial CUE to N addition may be due to two reasons. Firstly, the soil’s physicochemical properties (e.g., soil carbon contents and pH) are vastly varied in different studies. Soil nutrients are the main factors affecting soil microbial activity [41,42], and nutrient limitation (usually shown as high C:N or C:P ratios) can touch off overflow mitigation, causing low microbial CUE [9]. In addition, soil pH affected microbial CUE by changing the dominance of bacteria and fungi [43], microbial growth, and respiration [44]. Secondly, the differences in nitrogen addition rates and nitrogen availability [45] may also lead to the different responses of microbial CUE. In 2019, it was reported that when bacterial growth was restrained by higher N availability, a competitive release led to a stimulated fungal growth and detrital C use, which yielded reduced microbial CUE [43].
In addition, though there are negative links between SOC and CUE for all aggregates, only the relationship in macro-aggregates was significant (Figure 2). The studies of Bai et al., in 2020 and Wang et al., in 2019 have shown that more C was fixed in the macro-aggregates rather than the micro-aggregates with the increase in SOC [46,47]. Our study also revealed that SOC in macro-aggregates is more sensitive to nitrogen addition. This may result from the difference in soil organic carbon accumulation and its biological activity in different aggregates. On the one hand, the substrate availability was different in differently sized aggregates. The SOC in macro-aggregates from plant and microbial residues is more easily absorbed and utilized by microbial communities [48], but SOC in micro-aggregates with a protective effect is not easy to decompose [49,50,51]. This also explains why the SOC content in micro-aggregates is higher, which is consistent with previous studies [52,53]. On the other hand, there are differences in microbial biomass and activity in different aggregates [54]. The microbial biomass and activity are usually higher in macro-aggregates but lower in micro-aggregates [55,56].

4.2. The Direct and Indirect Effect of Environmental Variability on the Linkages of C Aggregate and Microbial CUE

The changes in microbial CUE in soil aggregates are determined by many factors and especially vary with aggregate levels [57,58]. In our study, soil microbial CUE is significantly related to soil C:N and SOC in macro-aggregates and to soil stoichiometric ratio (e.g., C:N and C:P, Supplementary Materials Table S1) in medium and micro-aggregates (Figure 3). Variation partitioning analysis results also showed that the variation in the soil microbial CUE was mainly explained by C components (54%) in macro-aggregates. However, the variation in the microbial CUE was explained by the soil’s physicochemical properties in medium aggregates since the resource demand was an important constraint on microbial CUE [59]. The differences in the relationship between microbial CUE and nutrients may result from the different nutrient equilibrium states of a substrate in differently sized aggregates after N addition. To be specific, the SOC and DOC of macro-aggregates were lower. At the same time, TN, mineral nitrogen, and AP contents were higher, leading to the C:N and C:P of macro-aggregates being significantly lower than those of medium and micro-aggregates. The microbes in the macro-aggregates were subject to stronger carbon limitation, so their microbial CUE was more sensitive to SOC and other carbon components [7,14]. On the other hand, we found a higher MBC:MBN in the macro-aggregates, indicating that there may be a higher ratio of fungi to bacteria [60]. Since fungi have higher carbon requirements than bacteria, they prefer a high C:N substrate environment than bacteria [59,61]. As a result, microorganisms in macro-aggregates were more sensitive to SOC, DOC, and C:N. At the same time, since fungi generally have a higher CUE than bacteria [59], the high fungal–bacterial ratio indicated by the high MBC:MBN in macro-aggregates may lead to a higher microbial CUE. This result was indeed observed in our study (Figure 1).
Moreover, we found a significant negative correlation between microbial CUE and soil C:N in all three aggregates (Figure 3). This relationship is consistent with previous studies, which also found that microbial CUE could be improved by reducing soil C:N [7,14,62]. Related theoretical models have predicted that CUE will increase as the availability of nutrients increases [10,63], which is mainly because low nutrient availability (usually nitrogen) inhibits the uptake of both substrate C and nutrient, or excessive C is routed to overflow respiration or excretion [64,65]. Nitrogen addition significantly increased the content and availability of soil nitrogen (as shown in the decrease in soil C:N) (Table 2) and alleviated this limitation, thereby increasing microbial CUE. However, the relationship between soil C: N and microbial CUE also has different manifestations. For example, Soares et al.’s research [45] in 2019 reported that the microbial CUE was positively related to soil C:N. We speculate that this different relationship may be caused more by the composition of microbial communities than by the regional climate and vegetation types. Keiblinger et al.’s research in 2010 reported that resource C nutrient stoichiometry was positively correlated with fungal community CUE, but negatively correlated with bacterial community CUE [59]. Bacteria may contribute more to microbial CUE under N addition treatment in our study. Existing studies have also shown that N addition leads to a decline in C:N in grassland soils along with a significant decrease in fungal activity and biomass [66]. The reduction in MBC:MBN with increasing N concentration in this study also responded to similar information.
Although the Mantel analysis did not observe a direct impact of vegetation community characteristics on microbial CUE in different aggregates after N addition, their indirect impacts on microbial characteristics were still present. N addition significantly increased aboveground biomass and litter biomass, and these indicators had significant impacts on microbial MBC and MBN:MBP. In addition, vegetation characteristics individually explained 21% of microbial CUE variation in macro-aggregates and interacted with the soil’s physicochemical properties and carbon fraction in medium and micro-aggregates (Figure 4). The effects of aboveground vegetation properties on soil physicochemical properties and microbial characteristics after N addition have been confirmed in previous studies [67,68]. This effect is mainly due to the fact that N additions usually promote aboveground productivity, alter ecosystem nutrient cycling and balance, and in turn affect microbial processes [69,70].

5. Conclusions

We found that N addition promoted soil microbial CUE in grassland soils, but the degree of response differed significantly among differently sized soil aggregates. Microbial CUE was higher and more sensitive to N addition in macro-aggregates. This is mainly because N addition significantly altered SOC and increased the relative availability of N (as a decrease in C:N) in macro-aggregates. In addition, vegetation, soil properties, and carbon fraction also showed independent or interactive effects on microbial CUE at different aggregate levels. Overall, our study highlights the differential response of soil microbial CUE and its related physicochemical properties to nitrogen addition at aggregate scales, which is helpful to understand the change mechanism of soil carbon pool activity in semi-arid grassland.

Supplementary Materials

The following supporting information can be downloaded at: https://www.mdpi.com/article/10.3390/f13020276/s1, Table S1: Changes of soil stoichiometric ratio of nutrients and microbial biomass of different soil aggregates under nitrogen addition.

Author Contributions

Formal analysis, X.Z. (Xue Zhao), X.L., J.Y. and D.Z.; Investigation, X.L., J.Y. and D.Z.; Methodology, C.R. and J.D.; Visualization, X.Z. (Xue Zhao); Writing—original draft, X.Z. (Xue Zhao); Writing—review and editing, C.R., X.W., X.Z. (Xiaoxi Zhang) and J.D. All authors have read and agreed to the published version of the manuscript.

Funding

This work was supported by the National Natural Science Foundation of China (No. 41907086), the Scientific research program of Yan’an University (No. YDY2020-33), the Ph.D. research startup foundation of Yan’an University (No. YDBK2017-22), and the Graduate education innovation program of Yan’an University (No. YCX2021078).

Institutional Review Board Statement

Not applicable.

Informed Consent Statement

Not applicable.

Data Availability Statement

The data presented in this study are available on request from the corresponding author for research purposes.

Conflicts of Interest

The authors declare no conflict of interest.

References

  1. Li, G.; Sun, S.; Han, J.; Yan, J.; Liu, W.; Wei, Y.; Lu, N.; Sun, Y. Impacts of Chinese Grain for Green program and climate change on vegetation in the Loess Plateau during 1982–2015. Sci. Total Environ. 2019, 660, 177–187. [Google Scholar] [CrossRef] [PubMed]
  2. Feng, X.; Fu, B.; Piao, S.; Wang, S.; Ciais, P.; Zeng, Z.; Lü, Y.; Zeng, Y.; Li, Y.; Jiang, X.; et al. Revegetation in China’s Loess Plateau is approaching sustainable water resource limits. Nat. Clim. Chang. 2016, 6, 1019–1022. [Google Scholar] [CrossRef]
  3. Gang, C.; Zhao, W.; Zhao, T.; Zhang, Y.; Gao, X.; Wen, Z. The impacts of land conversion and management measures on the grassland net primary productivity over the Loess Plateau, Northern China. Sci. Total Environ. 2018, 645, 827–836. [Google Scholar] [CrossRef]
  4. Hu, X.; Li, Z.; Chen, J.; Nie, X.; Liu, J.; Wang, L.; Ning, K. Carbon sequestration benefits of the grain for Green Program in the hilly red soil region of southern China. Int. Soil Water Conserv. Res. 2021, 9, 271–278. [Google Scholar] [CrossRef]
  5. Ayoubi, S.; Khormali, F.; Sahrawat, K.L.; DeLima, A.C.R. Assessing Impacts of Land Use Change on Soil Quality Indicators in a Loessial Soil in Golestan Province, Iran. J. Agric. Sci. Technol. 2011, 13, 727–742. [Google Scholar]
  6. Sinsabaugh, R.L.; Turner, B.L.; Talbot, J.M.; Waring, B.G.; Powers, J.S.; Kuske, C.R.; Moorhead, D.L.; Follstad Shah, J.J. Stoichiometry of microbial carbon use efficiency in soils. Ecol. Monogr. 2016, 86, 172–189. [Google Scholar] [CrossRef] [Green Version]
  7. Manzoni, S.; Taylor, P.; Richter, A.; Porporato, A.; Agren, G.I. Environmental and stoichiometric controls on microbial carbon-use efficiency in soils. New Phytol. 2012, 196, 79–91. [Google Scholar] [CrossRef] [PubMed]
  8. Li, J.; Sang, C.; Yang, J.; Qu, L.; Xia, Z.; Sun, H.; Jiang, P.; Wang, X.; He, H.; Wang, C. Stoichiometric imbalance and microbial community regulate microbial elements use efficiencies under nitrogen addition. Soil Biol. Biochem. 2021, 156, 108207. [Google Scholar] [CrossRef]
  9. Spohn, M.; Pötsch, E.M.; Eichorst, S.A.; Woebken, D.; Wanek, W.; Richter, A. Soil microbial carbon use efficiency and biomass turnover in a long-term fertilization experiment in a temperate grassland. Soil Biol. Biochem. 2016, 97, 168–175. [Google Scholar] [CrossRef]
  10. Schimel, J.P.; Weintraub, M.N. The implications of exoenzyme activity on microbial carbon and nitrogen limitation in soil: A theoretical model. Soil Biol. Biochem. 2003, 35, 549–563. [Google Scholar] [CrossRef]
  11. Poeplau, C.; Helfrich, M.; Dechow, R.; Szoboszlay, M.; Tebbe, C.C.; Don, A.; Greiner, B.; Zopf, D.; Thumm, U.; Korevaar, H.; et al. Increased microbial anabolism contributes to soil carbon sequestration by mineral fertilization in temperate grasslands. Soil Biol. Biochem. 2019, 130, 167–176. [Google Scholar] [CrossRef]
  12. Widdig, M.; Schleuss, P.; Biederman, L.A.; Borer, E.T.; Crawley, M.J.; Kirkman, K.P.; Seabloom, E.W.; Wragg, P.D.; Spohn, M. Microbial carbon use efficiency in grassland soils subjected to nitrogen and phosphorus additions. Soil Biol. Biochem. 2020, 146, 107815. [Google Scholar] [CrossRef]
  13. Luo, R.; Kuzyakov, Y.; Liu, D.; Fan, J.; Luo, J.; Lindsey, S.; He, J.; Ding, W. Nutrient addition reduces carbon sequestration in a Tibetan grassland soil: Disentangling microbial and physical controls. Soil Biol. Biochem. 2020, 144, 107764. [Google Scholar] [CrossRef]
  14. Riggs, C.E.; Hobbie, S.E. Mechanisms driving the soil organic matter decomposition response to nitrogen enrichment in grassland soils. Soil Biol. Biochem. 2016, 99, 54–65. [Google Scholar] [CrossRef] [Green Version]
  15. Devêvre, O.C.; RHorwáth, W. Decomposition of rice straw and microbial carbon use e ciency under di erent soil temperatures and moistures. Soil Biol. Biochem. 2000, 32, 1773–1785. [Google Scholar] [CrossRef]
  16. Li, T.; Wang, R.; Cai, J.; Meng, Y.; Wang, Z.; Feng, X.; Liu, H.; Turco, R.F.; Jiang, Y. Enhanced carbon acquisition and use efficiency alleviate microbial carbon relative to nitrogen limitation under soil acidification. Ecol. Processes 2021, 10, 1–13. [Google Scholar] [CrossRef]
  17. Wang, S.; Li, T.; Zheng, Z. Distribution of microbial biomass and activity within soil aggregates as affected by tea plantation age. CATENA 2017, 153, 1–8. [Google Scholar] [CrossRef]
  18. Chen, X.; Han, X.; You, M.; Yan, J.; Lu, X.; Horwath, W.R.; Zou, W. Soil macroaggregates and organic-matter content regulate microbial communities and enzymatic activity in a Chinese Mollisol. J. Integr. Agric. 2019, 18, 2605–2618. [Google Scholar] [CrossRef]
  19. Lu, X.; Hou, E.; Guo, J.; Gilliam, F.S.; Li, J.; Tang, S.; Kuang, Y. Nitrogen addition stimulates soil aggregation and enhances carbon storage in terrestrial ecosystems of China: A meta-analysis. Glob. Chang. Biol. 2021, 27, 2780–2792. [Google Scholar] [CrossRef] [PubMed]
  20. Chen, J.; Luo, Y.; van Groenigen, K.J.; Hungate, B.A.; Cao, J.; Zhou, X.; Wang, R. A keystone microbial enzyme for nitrogen control of soil carbon storage. Sci. Adv. 2018, 4, eaaq1689. [Google Scholar] [CrossRef] [Green Version]
  21. Yuan, X.; Qin, W.; Xu, H.; Zhang, Z.; Zhou, H.; Zhu, B. Sensitivity of soil carbon dynamics to nitrogen and phosphorus enrichment in an alpine meadow. Soil Biol. Biochem. 2020, 150, 107984. [Google Scholar] [CrossRef]
  22. Nie, M.; Pendall, E.; Bell, C.; Wallenstein, M.D. Soil aggregate size distribution mediates microbial climate change feedbacks. Soil Biol. Biochem. 2014, 68, 357–365. [Google Scholar] [CrossRef]
  23. Wang, Y.; Wang, Z.; Zhang, Q.; Hu, N.; Li, Z.; Lou, Y.; Li, Y.; Xue, D.; Chen, Y.; Wu, C.; et al. Long-term effects of nitrogen fertilization on aggregation and localization of carbon, nitrogen and microbial activities in soil. Sci. Total Environ. 2018, 624, 1131–1139. [Google Scholar] [CrossRef] [PubMed]
  24. Yanlong, J.; Qiufeng, W.; Jianxing, Z.; Zhi, C.; Nianpeng, H.; Guirui, Y. A spatial and temporal dataset of atmospheric inorganic nitrogen wet deposition in China (1996–2015). Sci. Data Bank 2019, 1, 4–13. [Google Scholar]
  25. Bach, E.M.; Hofmockel, K.S. Soil aggregate isolation method affects measures of intra-aggregate extracellular enzyme activity. Soil Biol. Biochem. 2014, 69, 54–62. [Google Scholar] [CrossRef]
  26. Ren, C.; Kang, D.; Wu, J.P.; Zhao, F.; Yang, G.; Han, X.; Feng, Y.; Ren, G. Temporal variation in soil enzyme activities after afforestation in the Loess Plateau, China. Geoderma 2016, 282, 103–111. [Google Scholar] [CrossRef]
  27. Blair, G.J.; Lefroy, R.D.B.; Lisle, L. Soil Carbon Fractions Based on their Degree of Oxidation, and the Development of a Carbon Management Index for Agricultural Systems. Aust. J. Agric. Res. 1995, 7, 1459–1466. [Google Scholar] [CrossRef]
  28. Dalai, R.C.; Sahrawat, K.L.; Myers, R.J.K. Inclusion of nitrate and nitrite in the Kjeldahl nitrogen determination of soils and plant materials using sodium thiosulphate. Commun. Soil Sci. Plant Anal. 1984, 15, 1453–1461. [Google Scholar] [CrossRef] [Green Version]
  29. Koide, R.T.; Petprakob, K.; Peoples, M. Quantitative analysis of biochar in field soil. Soil Biol. Biochem. 2011, 43, 1563–1568. [Google Scholar] [CrossRef]
  30. Shidan, B. Methods for Soil Agricultural and Chemical Analysis; China Agricultural Press: Beijing, China, 2000; pp. 30–34. [Google Scholar]
  31. Vance, E.D.; Brookes, P.C.; Jenkinson, D.S. An extraction method for measuring soil microbial biomass C. Soil Biol. Biochem. 1987, 6, 703–707. [Google Scholar] [CrossRef]
  32. Brookes, P.C.; Landman, A.; Pruden, G.; Jenkinson, D.S. Chloroform fumigation and the release of soil nitrogen: A rapid direct extraction method to measure microbial biomass nitrogen in soil. Soil Biol. Biochem. 1985, 6, 837–842. [Google Scholar] [CrossRef]
  33. Wu, J.; Joergensen, R.G.; Pommerening, B.; Chaussod, R.; Brookes, P.C. Measurement of soil microbial biomass C by fumigation-extraction-An automated procedure. Soil Biol. Biochem. 1990, 8, 1167–1169. [Google Scholar] [CrossRef]
  34. Peng, X.; Wang, W. Stoichiometry of soil extracellular enzyme activity along a climatic transect in temperate grasslands of northern China. Soil Biol. Biochem. 2016, 98, 74–84. [Google Scholar] [CrossRef]
  35. Zhang, W.; Xu, Y.; Gao, D.; Wang, X.; Liu, W.; Deng, J.; Han, X.; Yang, G.; Feng, Y.; Ren, G. Ecoenzymatic stoichiometry and nutrient dynamics along a revegetation chronosequence in the soils of abandoned land and Robinia pseudoacacia plantation on the Loess Plateau, China. Soil Biol. Biochem. 2019, 134, 1–14. [Google Scholar] [CrossRef]
  36. Sinsabaugh, R.L.; Manzoni, S.; Moorhead, D.L.; Richter, A. Carbon use efficiency of microbial communities: Stoichiometry, methodology and modelling. Ecol. Lett. 2013, 16, 930–939. [Google Scholar] [CrossRef] [PubMed]
  37. Ullah, M.R.; Carrillo, Y.; Dijkstra, F.A. Drought-induced and seasonal variation in carbon use efficiency is associated with fungi: Bacteria ratio and enzyme production in a grassland ecosystem. Soil Biol. Biochem. 2021, 155, 108159. [Google Scholar] [CrossRef]
  38. Geyer, K.M.; Dijkstra, P.; Sinsabaugh, R.; Frey, S.D. Clarifying the interpretation of carbon use efficiency in soil through methods comparison. Soil Biol. Biochem. 2019, 128, 79–88. [Google Scholar] [CrossRef]
  39. Allison, S.D. Modeling adaptation of carbon use efficiency in microbial communities. Front. Microbiol. 2014, 5, 571. [Google Scholar] [CrossRef] [PubMed] [Green Version]
  40. Öquist, M.G.; Erhagen, B.; Haei, M.; Sparrman, T.; Ilstedt, U.; Schleucher, J.; Nilsson, M.B. The effect of temperature and substrate quality on the carbon use efficiency of saprotrophic decomposition. Plant Soil 2017, 414, 113–125. [Google Scholar] [CrossRef] [Green Version]
  41. Borase, D.N.; Nath, C.P.; Hazra, K.K.; Senthilkumar, M.; Singh, S.S.; Praharaj, C.S.; Singh, U.; Kumar, N. Long-term impact of diversified crop rotations and nutrient management practices on soil microbial functions and soil enzymes activity. Ecol. Indic. 2020, 114, 106322. [Google Scholar] [CrossRef]
  42. Tajik, S.; Ayoubi, S.; Lorenz, N. Soil microbial communities affected by vegetation, topography and soil properties in a forest ecosystem. Appl. Soil Ecol. 2020, 149, 103514. [Google Scholar] [CrossRef]
  43. Silva-Sánchez, A.; Soares, M.; Rousk, J. Testing the dependence of microbial growth and carbon use efficiency on nitrogen availability, pH, and organic matter quality. Soil Biol. Biochem. 2019, 134, 25–35. [Google Scholar] [CrossRef]
  44. Jones, D.L.; Cooledge, E.C.; Hoyle, F.C.; Griffiths, R.I.; Murphy, D.V. pH and exchangeable aluminum are major regulators of microbial energy flow and carbon use efficiency in soil microbial communities. Soil Biol. Biochem. 2019, 138, 107584. [Google Scholar] [CrossRef]
  45. Soares, M.; Rousk, J. Microbial growth and carbon use efficiency in soil: Links to fungal-bacterial dominance, SOC-quality and stoichiometry. Soil Biol. Biochem. 2019, 131, 195–205. [Google Scholar] [CrossRef]
  46. Bai, Y.; Zhou, Y.; He, H. Effects of rehabilitation through afforestation on soil aggregate stability and aggregate-associated carbon after forest fires in subtropical China. Geoderma 2020, 376, 114548. [Google Scholar] [CrossRef]
  47. Wang, X.; Qi, J.; Zhang, X.; Li, S.; Latif Virk, A.; Zhao, X.; Xiao, X.; Zhang, H. Effects of tillage and residue management on soil aggregates and associated carbon storage in a double paddy cropping system. Soil Tillage Res. 2019, 194, 104339. [Google Scholar] [CrossRef]
  48. Tian, J.; Pausch, J.; Yu, G.; Blagodatskaya, E.; Gao, Y.; Kuzyakov, Y. Aggregate size and their disruption affect 14C-labeled glucose mineralization and priming effect. Appl. Soil Ecol. 2015, 90, 1–10. [Google Scholar] [CrossRef]
  49. Mutuo, P.K.; Shepherd, K.D.; Albrecht, A.; Cadisch, G. Prediction of carbon mineralization rates from different soil physical fractions using diffuse reflectance spectroscopy. Soil Biol. Biochem. 2006, 38, 1658–1664. [Google Scholar] [CrossRef]
  50. Zeraatpisheh, M.; Ayoubi, S.; Mirbagheri, Z.; Mosaddeghi, M.R.; Xu, M. Spatial prediction of soil aggregate stability and soil organic carbon in aggregate fractions using machine learning algorithms and environmental variables. Geoderma Reg. 2021, 27, e00440. [Google Scholar] [CrossRef]
  51. Ayoubi, S.; Mirbagheri, Z.; Mosaddeghi, M.R. Soil organic carbon physical fractions and aggregate stability influenced by land use in humid region of northern Iran. Int. Agrophysics 2020, 34, 343–353. [Google Scholar] [CrossRef]
  52. Su, F.; Xu, S.; Sayer, E.J.; Chen, W.; Du, Y.; Lu, X. Distinct storage mechanisms of soil organic carbon in coniferous forest and evergreen broadleaf forest in tropical China. J. Environ. Manag. 2021, 295, 113142. [Google Scholar] [CrossRef] [PubMed]
  53. Zhu, Y.; Wang, D.; Wang, X.; Li, W.; Shi, P. Aggregate-associated soil organic carbon dynamics as affected by erosion and deposition along contrasting hillslopes in the Chinese Corn Belt. CATENA 2021, 199, 105106. [Google Scholar] [CrossRef]
  54. Yang, C.; Liu, N.; Zhang, Y. Soil aggregates regulate the impact of soil bacterial and fungal communities on soil respiration. Geoderma 2019, 337, 444–452. [Google Scholar] [CrossRef]
  55. Li, N.; Yao, S.; Qiao, Y.; Zou, W.; You, M.; Han, X.; Zhang, B. Separation of soil microbial community structure by aggregate size to a large extent under agricultural practices during early pedogenesis of a Mollisol. Appl. Soil Ecol. 2015, 88, 9–20. [Google Scholar] [CrossRef]
  56. Helgason, B.L.; Walley, F.L.; Germida, J.J. No-till soil management increases microbial biomass and alters community profiles in soil aggregates. Appl. Soil Ecol. 2010, 46, 390–397. [Google Scholar] [CrossRef]
  57. Tian, J.; Pausch, J.; Yu, G.; Blagodatskaya, E.; Kuzyakov, Y. Aggregate size and glucose level affect priming sources: A three-source-partitioning study. Soil Biol. Biochem. 2016, 97, 199–210. [Google Scholar] [CrossRef]
  58. Bimüller, C.; Kreyling, O.; Kölbl, A.; von Lützow, M.; Kögel-Knabner, I. Carbon and nitrogen mineralization in hierarchically structured aggregates of different size. Soil Tillage Res. 2016, 160, 23–33. [Google Scholar] [CrossRef]
  59. Keiblinger, K.M.; Hall, E.K.; Wanek, W.; Szukics, U.; Hämmerle, I.; Ellersdorfer, G.; Böck, S.; Strauss, J.; Sterflinger, K.; Richter, A.; et al. The effect of resource quantity and resource stoichiometry on microbial carbon-use-efficiency. FEMS Microbiol. Ecol. 2010, 73, 430–440. [Google Scholar] [CrossRef]
  60. Waring, B.G.; Averill, C.; Hawkes, C.V. Differences in fungal and bacterial physiology alter soil carbon and nitrogen cycling: Insights from meta-analysis and theoretical models. Ecol. Lett. 2013, 16, 887–894. [Google Scholar] [CrossRef] [PubMed]
  61. Bossuyt, H.; Denef, K.; Six, J.; Frey, S.D.; Merckx, R.; Paustian, K. Influence of microbial populations and residue quality on aggregate stability. Appl. Soil Ecol. A Sect. Agric. Ecosyst. Environ. 2001, 16, 195–208. [Google Scholar] [CrossRef]
  62. Jansson, M.; Bergström, A.; Lymer, D.; Vrede, K.; Karlsson, J. Bacterioplankton Growth and Nutrient Use Efficiencies under Variable Organic Carbon and Inorganic Phosphorus Ratios. Microb. Ecol. 2006, 52, 358–364. [Google Scholar] [CrossRef] [PubMed]
  63. Ågren, G.I.; Bosatta, E.; Magill, A.H. Combining theory and experiment to understand effects of inorganic nitrogen on litter decomposition. Oecologia 2001, 128, 94–98. [Google Scholar] [CrossRef] [PubMed]
  64. Manzoni, S.; Porporato, A. Soil carbon and nitrogen mineralization: Theory and models across scales. Soil Biol. Biochem. 2009, 41, 1355–1379. [Google Scholar] [CrossRef]
  65. Russell, J.B.; Cook, G.M. Energetics of bacterial growth: Balance of anabolic and catabolic reactions. Microbiol. Rev. 1995, 59, 48–62. [Google Scholar] [CrossRef] [PubMed]
  66. De Vries, F.T.; Bloem, J.; van Eekeren, N.; Brusaard, L.; Hoffland, E. Fungal biomass in pastures increases with age and reduced N input. Soil Biol. Biochem. 2007, 39, 1620–1630. [Google Scholar] [CrossRef]
  67. Treseder, K.K. Nitrogen additions and microbial biomass: A meta-analysis of ecosystem studies. Ecol. Lett. 2008, 11, 1111–1120. [Google Scholar] [CrossRef] [PubMed] [Green Version]
  68. Liu, W.; Jiang, Y.; Wang, G.; Su, Y.; Smoak, J.M.; Liu, M.; Duan, B. Effects of N addition and clipping on above and belowground plant biomass, soil microbial community structure, and function in an alpine meadow on the Qinghai-Tibetan Plateau. Eur. J. Soil Biol. 2021, 106, 103344. [Google Scholar] [CrossRef]
  69. Zhi, C.; Guirui, Y. Spatial variations and controls of carbon use efciency in China’s terrestrial ecosystems. Sci. Rep. 2019, 9, 19516. [Google Scholar]
  70. Yu, G.; Zhu, X.; Fu, Y.; He, H.; Wang, Q.; Wen, X.; Li, X.; Zhang, L.; Zhang, L.; Su, W.; et al. Spatial patterns and climate drivers of carbon fluxes in terrestrial ecosystems of China. Glob. Chang. Biol. 2013, 19, 798–810. [Google Scholar] [CrossRef] [PubMed]
Figure 1. Effects of N addition on SOC (A), DOC (B), MBC (C), LOC (D), and CUE (E) in three soil aggregates. The green, orange, and blue bars indicate the changes of five indexes in micro-aggregates, medium aggregates, and macro-aggregates, respectively. The error bar is the standard error of mean. Different small and capital letters above bars indicate significant differences among different soil aggregates and N addition rates at the level of p < 0.05. SOC: soil organic carbon; DOC: dissolved organic carbon; MBC: microbial biomass carbon; LOC: labile organic carbon; CUE: microbial carbon use efficiency.
Forests 13 00276 g001
Figure 2. Relationship between four carbon components and microbial carbon use efficiency in three aggregate sizes. The scatter subplot in each panel (AD) demonstrates the relationship between carbon components (SOC, DOC, MBC, and LOC, respectively) and CUE. Different colors (green, orange, and blue) represent different aggregates (micro-aggregates, medium aggregates, and macro-aggregates, respectively). The formula corresponding to each aggregate and R2 is shown. * indicates significance at the level of p < 0.05.
Forests 13 00276 g002
Figure 3. The drivers of soil microbial CUE in macro-aggregates (A), medium aggregates (B), and micro-aggregates (C). The pairwise correlation heat map of environmental factor indicators and the correlation coefficient of Pearson are expressed by the color gradient. The nitrogen addition treatment was correlated with each index by a biased (geographic distance corrected) Mantel test. Edge width corresponds to Mantel’s R statistic of distance correlation, and edge color represents statistical significance.
Forests 13 00276 g003
Figure 4. Variation partitioning analysis (VPA) displaying the effects of soil physicochemical properties, vegetation characteristics, and C components on soil microbial CUE in macro-aggregates (A), medium aggregates (B), and micro-aggregates (C). During data analysis, species number, H, litter, and biomass were used for vegetation characteristics; pH, SBD, NO3-N, NH4+-N, and AP were used for soil characteristics; DOC, MBC, and LOC were used for carbon components.
Forests 13 00276 g004
Table 1. Changes in vegetation community and whole soil’s physical and chemical properties under nitrogen addition.
IndexN Addition
N0N1N2N3N4
Coverage (%)62.92 ± 5.50 C71.67 ± 3.23 BC71.50 ± 3.18 BC82.00 ± 1.48 AB89.50 ± 1.41 A
Species Number14.67 ± 0.72 C15.00 ± 0.47 C18.00 ± 1.25 BC22.00 ± 0.82 A21.00 ± 0.94 AB
Shannon–Wiener index3.00 ± 0.15 AB2.78 ± 0.10 B3.19 ± 0.15 AB3.46 ± 0.10 A3.47 ± 0.06 A
Biomass (g·m−2)128.33 ± 15.83 C134.63 ± 1.71 C189.73 ± 25.77 BC254.23 ± 10.33 B335.73 ± 28.24 A
Litter (g·m−2)45.35 ± 2.55 B45.21 ± 2.09 B45.43 ± 1.88 B54.75 ± 6.12 B95.86 ± 4.62 A
pH8.57 ± 0.02 A8.51 ± 0.03 AB8.43 ± 0.05 BC8.44 ± 0.02 BC8.35 ± 0.02 C
SBD (g·cm−3)119.48 ± 1.84 A122.43 ± 0.66 A119.17 ± 4.65 A117.88 ± 4.18 A119.26 ± 2.31 A
SOC (g·kg−1)3.88 ± 0.31 A3.60 ± 0.33 A2.55 ± 0.06 B3.84 ± 0.22 A3.57 ± 0.13 A
DOC (mg·kg−1)220.41 ± 5.82 A227.23 ± 9.03 A227.76 ± 5.89 A242.25 ± 10.78 A240.86 ± 2.88 A
TP (g·kg−1)0.67 ± 0.01 A0.64 ± 0.03 A0.68 ± 0.01 A0.70 ± 0.01 A0.69 ± 0.00 A
TN (g·kg−1)0.52 ± 0.01 B0.46 ± 0.01 BC0.40 ± 0.01 C0.51 ± 0.01 AB0.66 ± 0.03 A
AP (mg·kg−1)4.89 ± 0.47 B5.75 ± 0.11 AB6.53 ± 1.01 AB7.52 ± 0.78 A7.75 ± 0.40 A
NH4+-N (mg·kg−1)4.27 ± 0.45 A3.94 ± 0.29 A5.97 ± 1.23 A5.12 ± 1.06 A5.03 ± 1.45 A
NO3-N (mg·kg−1)4.57 ± 0.14 A3.48 ± 0.26 BC2.82 ± 0.19 C3.71 ± 0.24 AB4.30 ± 0.22 AB
MBC (mg·kg−1)102.43 ± 8.44 AB76.90 ± 3.14 B49.82 ± 4.11 C99.87 ± 5.96 AB120.98 ± 8.90 A
MBN (mg·kg−1)20.07 ± 1.67 BC15.21 ± 0.59 CD14.08 ± 0.68 D24.99 ± 1.69 AB27.75 ± 1.60 A
MBP (mg·kg−1)3.93 ± 0.38 B3.21 ± 0.12 B3.30 ± 0.16 B5.17 ± 0.10 A5.57 ± 0.12 A
BG (nmol·h−1·g−1)23.83 ± 2.33 AB19.73 ± 1.06 B13.42 ± 0.87 C20.12 ± 0.84 AB28.51 ± 0.47 A
LAP (nmol·h−1·g−1)18.24 ± 0.93 B17.58 ± 0.13 B12.89 ± 0.85 C16.97 ± 1.18 B27.48 ± 0.45 A
NAG (nmol·h−1·g−1)4.16 ± 0.67 B4.17 ± 0.58 B3.90 ± 0.70 B7.22 ± 0.93 AB10.30 ± 1.07 A
ALP (nmol·h−1·g−1)41.92 ± 4.13 AB39.30 ± 2.29 AB32.98 ± 2.65 B39.73 ± 4.19 AB46.72 ± 1.38 A
LOC (mg kg−1)0.94 ± 0.06 B1.02 ± 0.03 AB1.04 ± 0.04 AB1.15 ± 0.03 AB1.19 ± 0.08 A
CUE0.45 ± 0.01 A0.47 ± 0.01 A0.46 ± 0.00 A0.47 ± 0.01 A0.47 ± 0.01 A
SBD: soil bulk density; SOC: soil organic carbon; TN: total nitrogen; TP: total phosphorus; DOC: dissolved organic carbon; LOC: labile organic carbon; AP: available phosphorous; NH4+-N: ammonium nitrogen; NO3-N: nitrate nitrogen; MBC: microbial biomass carbon; MBN: microbial biomass nitrogen; MBP: microbial biomass phosphorus; BG: β-1,4-glucosidase; NAG: β-1,4-N-acetylglucosaminidase; LAP: leucine aminopeptidase; ALP: alkaline phosphatase; CUE: microbial carbon use efficiency. The data are presented as mean ± standard error. Different capital letters indicate the difference between different nitrogen addition treatments (p < 0.05).
Table 2. Changes in soil physical and chemical properties of different soil aggregates under nitrogen addition.
N additionpHTN (g·kg−1)TP (g·kg−1)NH4+-N (g·kg−1)NO3-N (g·kg−1)AP (g·kg−1)MBN (mg·kg−1)MBP (mg·kg−1)BG (nmol·h−1·g−1)LAP (nmol·h−1·g−1)NAG (nmol·h−1·g−1)ALP (nmol·h−1·g−1)
N0micro-8.55 ± 0.02 aA0.67 ± 0.02 aA0.59 ± 0.01 aA5.07 ± 0.22 aA4.73 ± 0.05 aA5.33 ± 0.95 aA15.80 ± 0.76 aA6.10 ± 0.66 aA27.92 ± 2.29 aAB16.25 ± 0.95 aB4.64 ± 0.92 aB47.26 ± 1.24 aA
medium8.55 ± 0.01 aA0.38 ± 0.02 bCD0.59 ± 0.00 aA2.55 ± 0.19 aA4.78 ± 0.30 aA5.03 ± 0.64 aB14.48 ± 2.36 aA6.40 ± 0.71 aA21.06 ± 4.02 aAB14.39 ± 1.19 aB3.48 ± 0.47 aB29.66 ± 0.08 bAB
macro-8.56 ± 0.02 aA0.41 ± 0.02 bBC0.55 ± 0.01 aA4.17 ± 0.95 aA4.24 ± 0.22 aA4.06 ± 0.37 aA15.89 ± 1.56 aAB5.13 ± 0.71 aA15.42 ± 3.37 aAB10.03 ± 0.63 bC2.37 ± 0.20 aB26.79 ± 0.95 bBC
N1micro-8.49 ± 0.03 aAB0.38 ± 0.01 aD0.61 ± 0.03 aA3.50 ± 0.29 aA3.75 ± 0.37 aAB6.44 ± 1.21 aA14.83 ± 1.56 aA5.13 ± 0.43 aA19.88 ± 3.36 aBC16.51 ± 1.38 aB4.07 ± 0.56 aB26.66 ± 0.84 bB
medium8.47 ± 0.03 aAB0.49 ± 0.05 aBC0.55 ± 0.01 aA3.74 ± 0.38 aA3.70 ± 0.09 aB5.20 ± 0.50 aB14.94 ± 2.75 aA6.43 ± 1.18 aA15.84 ± 2.08 aB13.71 ± 0.59 aB3.26 ± 0.43 aB43.11 ± 6.04 aA
macro-8.48 ± 0.03 aAB0.48 ± 0.01 aBC0.56 ± 0.01 aA4.16 ± 0.90 aA3.21 ± 0.44 aAB5.75 ± 0.64 aA15.75 ± 2.92 aAB6.17 ± 1.83 aA14.82 ± 2.31 aB13.49 ± 1.16 aBC2.99 ± 0.31 aB29.80 ± 2.21 abB
N2micro-8.40 ± 0.05 aBC0.49 ± 0.01 aC0.57 ± 0.03 aA5.66 ± 1.24 aA3.24 ± 0.30 aB5.82 ± 1.05 aA14.71 ± 0.48 aA6.57 ± 1.84 aA14.77 ± 0.69 aC15.16 ± 1.42 aB5.50 ± 0.74 aB36.55 ± 3.23 aAB
medium8.41 ± 0.04 aBC0.34 ± 0.02 bD0.60 ± 0.01 aA6.03 ± 1.30 aA3.08 ± 0.35 aB6.68 ± 1.02 aAB12.02 ± 0.35 aA4.27 ± 0.53 aA13.17 ± 0.92 abB13.22 ± 1.82 aB4.98 ± 0.21 aAB23.31 ± 1.80 bB
macro-8.41 ± 0.05 aBC0.37 ± 0.05 abC0.55 ± 0.01 aA6.17 ± 1.47 aA2.38 ± 0.15 aB6.83 ± 1.62 aA12.61 ± 2.09 aB4.67 ± 0.83 aA10.10 ± 1.09 bB12.80 ± 1.10 aBC2.97 ± 0.25 bB20.02 ± 1.91 bC
N3micro-8.43 ± 0.02 aABC0.47 ± 0.01 bC0.58 ± 0.03 aA4.89 ± 0.82 aA3.71 ± 0.42 aAB8.94 ± 2.09 aA16.87 ± 2.95 aA6.30 ± 0.54 aA21.58 ± 1.82 aBC18.95 ± 1.95 aB7.20 ± 0.84 aAB29.96 ± 3.54 aB
medium8.42 ± 0.02 aBC0.59 ± 0.02 aAB0.58 ± 0.03 aA5.01 ± 0.86 aA4.01 ± 0.03 aAB6.06 ± 0.40 aAB20.36 ± 4.13 aA5.20 ± 1.11 aA18.22 ± 2.00 abB15.98 ± 1.06 aB5.44 ± 0.85 aAB39.34 ± 5.49 aA
macro-8.42 ± 0.02 aBC0.50 ± 0.01 bB0.58 ± 0.02 aA5.44 ± 1.38 aA3.42 ± 0.29 aAB6.43 ± 0.53 aA15.07 ± 1.42 aB3.60 ± 0.08 aA11.96 ± 1.18 bB15.02 ± 1.08 aB5.08 ± 1.32 aAB23.65 ± 2.27 aBC
N4micro-8.32 ± 0.02 aC0.60 ± 0.03 bB0.62 ± 0.03 aA5.32 ± 1.45 aA4.28 ± 0.41 aAB8.00 ± 0.34 aA19.69 ± 1.91 aA4.93 ± 0.70 aA31.19 ± 0.60 aA26.89 ± 1.38 aA9.62 ± 0.83 aA42.85 ± 3.66 aA
medium8.32 ± 0.02 aC0.64 ± 0.03 abA0.58 ± 0.00 aA5.25 ± 1.35 aA4.67 ± 0.24 aA8.58 ± 0.52 aA21.55 ± 1.82 aA6.77 ± 0.92 aA28.22 ± 0.71 aA22.89 ± 0.32 abA7.04 ± 0.62 aA44.19 ± 0.20 aA
macro-8.34 ± 0.02 aC0.72 ± 0.01 aA0.54 ± 0.00 aA4.47 ± 1.33 aA3.88 ± 0.25 aA6.94 ± 0.39 aA23.29 ± 1.07 aA5.57 ± 0.96 aA23.12 ± 1.22 bA20.12 ± 0.96 bA6.61 ± 0.63 aA41.72 ± 0.81 aA
TN: total nitrogen; TP: total phosphorus; AP: available phosphorous; NH4+-N: ammonium nitrogen; NO3--N: nitrate nitrogen; MBN: microbial biomass nitrogen; MBP: microbial biomass phosphorus; BG: β-1,4-glucosidase; NAG: β-1,4-N-acetylglucosaminidase; LAP: leucine aminopeptidase; ALP: alkaline phosphatase. The data are presented as mean ± standard error. Different capital letters and small letters indicate the difference between different nitrogen addition concentrations and different soil aggregate sizes, respectively (p < 0.05).
Publisher’s Note: MDPI stays neutral with regard to jurisdictional claims in published maps and institutional affiliations.

