Article

Deforestation for Agriculture Temporarily Improved Soil Quality and Soil Organic Carbon Stocks

1
Co-Innovation Center for Sustainable Forestry in Southern China, College of Forestry, Nanjing Forestry University, Nanjing 210037, China
2
CAS Key Laboratory of Tropical Forest Ecology, Xishuangbanna Tropical Botanical Garden, Chinese Academy of Sciences, Xishuangbanna 666303, China
3
Qingtian County Forestry Bureau of Zhejiang Province, Lishui 323900, China
*
Author to whom correspondence should be addressed.
Forests 2022, 13(2), 228; https://doi.org/10.3390/f13020228
Submission received: 13 December 2021 / Revised: 19 January 2022 / Accepted: 26 January 2022 / Published: 2 February 2022

Abstract

:
Deforestation for agricultural development or extension is a common land-use problem that may cause a series of changes in the ecological environment and soil carbon stock in planting systems. However, the response of soil physical, chemical properties and carbon stocks in agricultural systems in the initial period after deforestation have not been thoroughly examined, especially in the subsoil. We investigated the variations in the soil physicochemical properties and organic carbon stocks to a depth of 100 cm in a poplar (Populus deltoides cv. 35) plantation, a summer maize (Zea mays L.) followed by winter wheat (Triticum aestivum L.) field after 1 year of deforestation of a poplar plantation, and a wheat–maize rotation field used for decades. The soil bulk density and pH decreased, and the soil total nitrogen (TN), total phosphorus, and total potassium contents increased considerably. The soil organic carbon (SOC) content and stocks (to 100 cm) increased by 32.8% and 20.1%, respectively. The soil TN content was significantly (p < 0.001) positively correlated with the SOC content, and the C:N ratio increased for the field following deforestation. Furthermore, the nitrogen in the poplar plantation and the field following deforestation was limited. We recommend increasing the amount of nitrogen fertilizer following deforestation to improve fertility and this will be beneficial to SOC storage.

1. Introduction

Forest ecosystems are the most important carbon reservoirs on Earth, accounting for 46% of the total terrestrial carbon reserves [1]. Soil stores most of the carbon in forest ecosystems, and soil organic carbon (SOC) stocks in forests account for more than 40% of the SOC stocks in terrestrial ecosystems [2]. Thus, the soil is considered one of the most crucial C pools in the terrestrial system. Compared with the vegetation and atmospheric carbon pools, the soil organic carbon pool is 4.5 and 3 times as large [3]. A slight fluctuation in the soil C pool may cause a significant change in the atmospheric C pool [4]. Additionally, SOC plays a role in improving soil physicochemical properties and soil fertility [5] and affects soil characteristics related to ecosystem functions [6]. Thus, SOC can also be considered one of the critical factors for maintaining soil quality and health [7].
The accumulation of SOC is affected by climatic conditions [8,9], topography [10], soil management, agricultural practices, land cover [11,12], and land-use changes [13,14]. Land-use change will lead to a change in the vegetation type and quantity and will affect the physical and chemical properties of the soil [15]. Land-use change has a significant impact on SOC stocks and is the second-largest source of carbon dioxide emissions into the atmosphere [8,16] following fossil fuel combustion. Deforestation for cropland, which is the primary type of land-use change [17], may cause a significant variation in soil ecological processes and ecosystem functions. These effects include variations in the input, output, composition, and dynamics of SOC and disturbances in the balance of the SOC stock [18,19]. Changes in land use from natural vegetation to cropland may cause significant reductions in SOC stocks in the long term. Smith et al. [17] reported that the replacement of forest with crops had the most significant impact on SOC and decreased the soil carbon stocks by 24% to 52%. In the Amazon forest region, the conversion of original forests to soybean plantations led to the collapse of ecosystem carbon stocks [20]. Ten years after deforestation for agriculture, a loss of SOC (nearly 60%) was found at a depth of 0–30 cm in the semi-arid Chaco region of Argentina [7]. Grünzweig and Chapin (2014) [21] investigated the changes in SOC reserves in the first few years after deforestation and established that the SOC and nitrogen stocks showed an increasing trend. Studying the change in soil properties in the initial period after deforestation is helpful to understanding the impact of deforestation on SOC dynamics and to formulating corresponding management measures in order to mitigate the carbon loss caused by deforestation. However, there are only a few studies on the change in soil properties in the initial period after deforestation.
Poplar (Populus L.) is the most widely distributed and most adaptable tree species globally, especially in China, and plantations of this species are widely established for afforestation purposes. The Chinese 9th National Forest Resources Inventory [22] showed that the area of poplar plantations was 7.57 × 10⁷ ha. It has been reported that continuous planting of poplar leads to the accumulation of phenolic acids and other bioactive substances [23]. As a result, a severe decline in soil fertility and productivity was found [24] that was not conducive to the growth of poplar. Thus, it is necessary to change the type of mature poplar forestland. Compared with natural forests, fast-growing plantation species have a short maturity cycle and unstable SOC stocks, and the transformation from farms to cropland is quite different from the transformations in natural forests. Currently, most studies focus on the changes in SOC stocks in the conversion of ancient woodlands to cropland [25,26], and limited information is available on the effect of the transformation of poplar plantations to cropland on SOC stocks. The relationships between SOC and soil nutrients (such as nitrogen) are important indicators of the sustainability of SOC accumulation [10,27]. However, the responses of soil physicochemical properties and SOC stocks have not been well studied in the deep soils following deforestation for cropland [8,28], which is also sensitive to land-use change [29].
Thus, a poplar plantation system before deforestation (P), a wheat field after deforestation of a poplar plantation (P–W), and a wheat field (W) were selected in this study. Three objectives were established: (1) characterize the differences in soil carbon pools among the various land-use systems; (2) quantify the contents of organic carbon, total nitrogen, total phosphorus and total potassium in different soil layers (0–10, 10–20, 20–40, 40–60, 60–100 cm); and (3) analyze the influence of the various land-use systems on soil stoichiometry. This work will provide the required information to estimate regional soil carbon stocks and insights for vegetation reconstruction after deforestation and to develop appropriate land planning strategies.

2. Materials and Methods
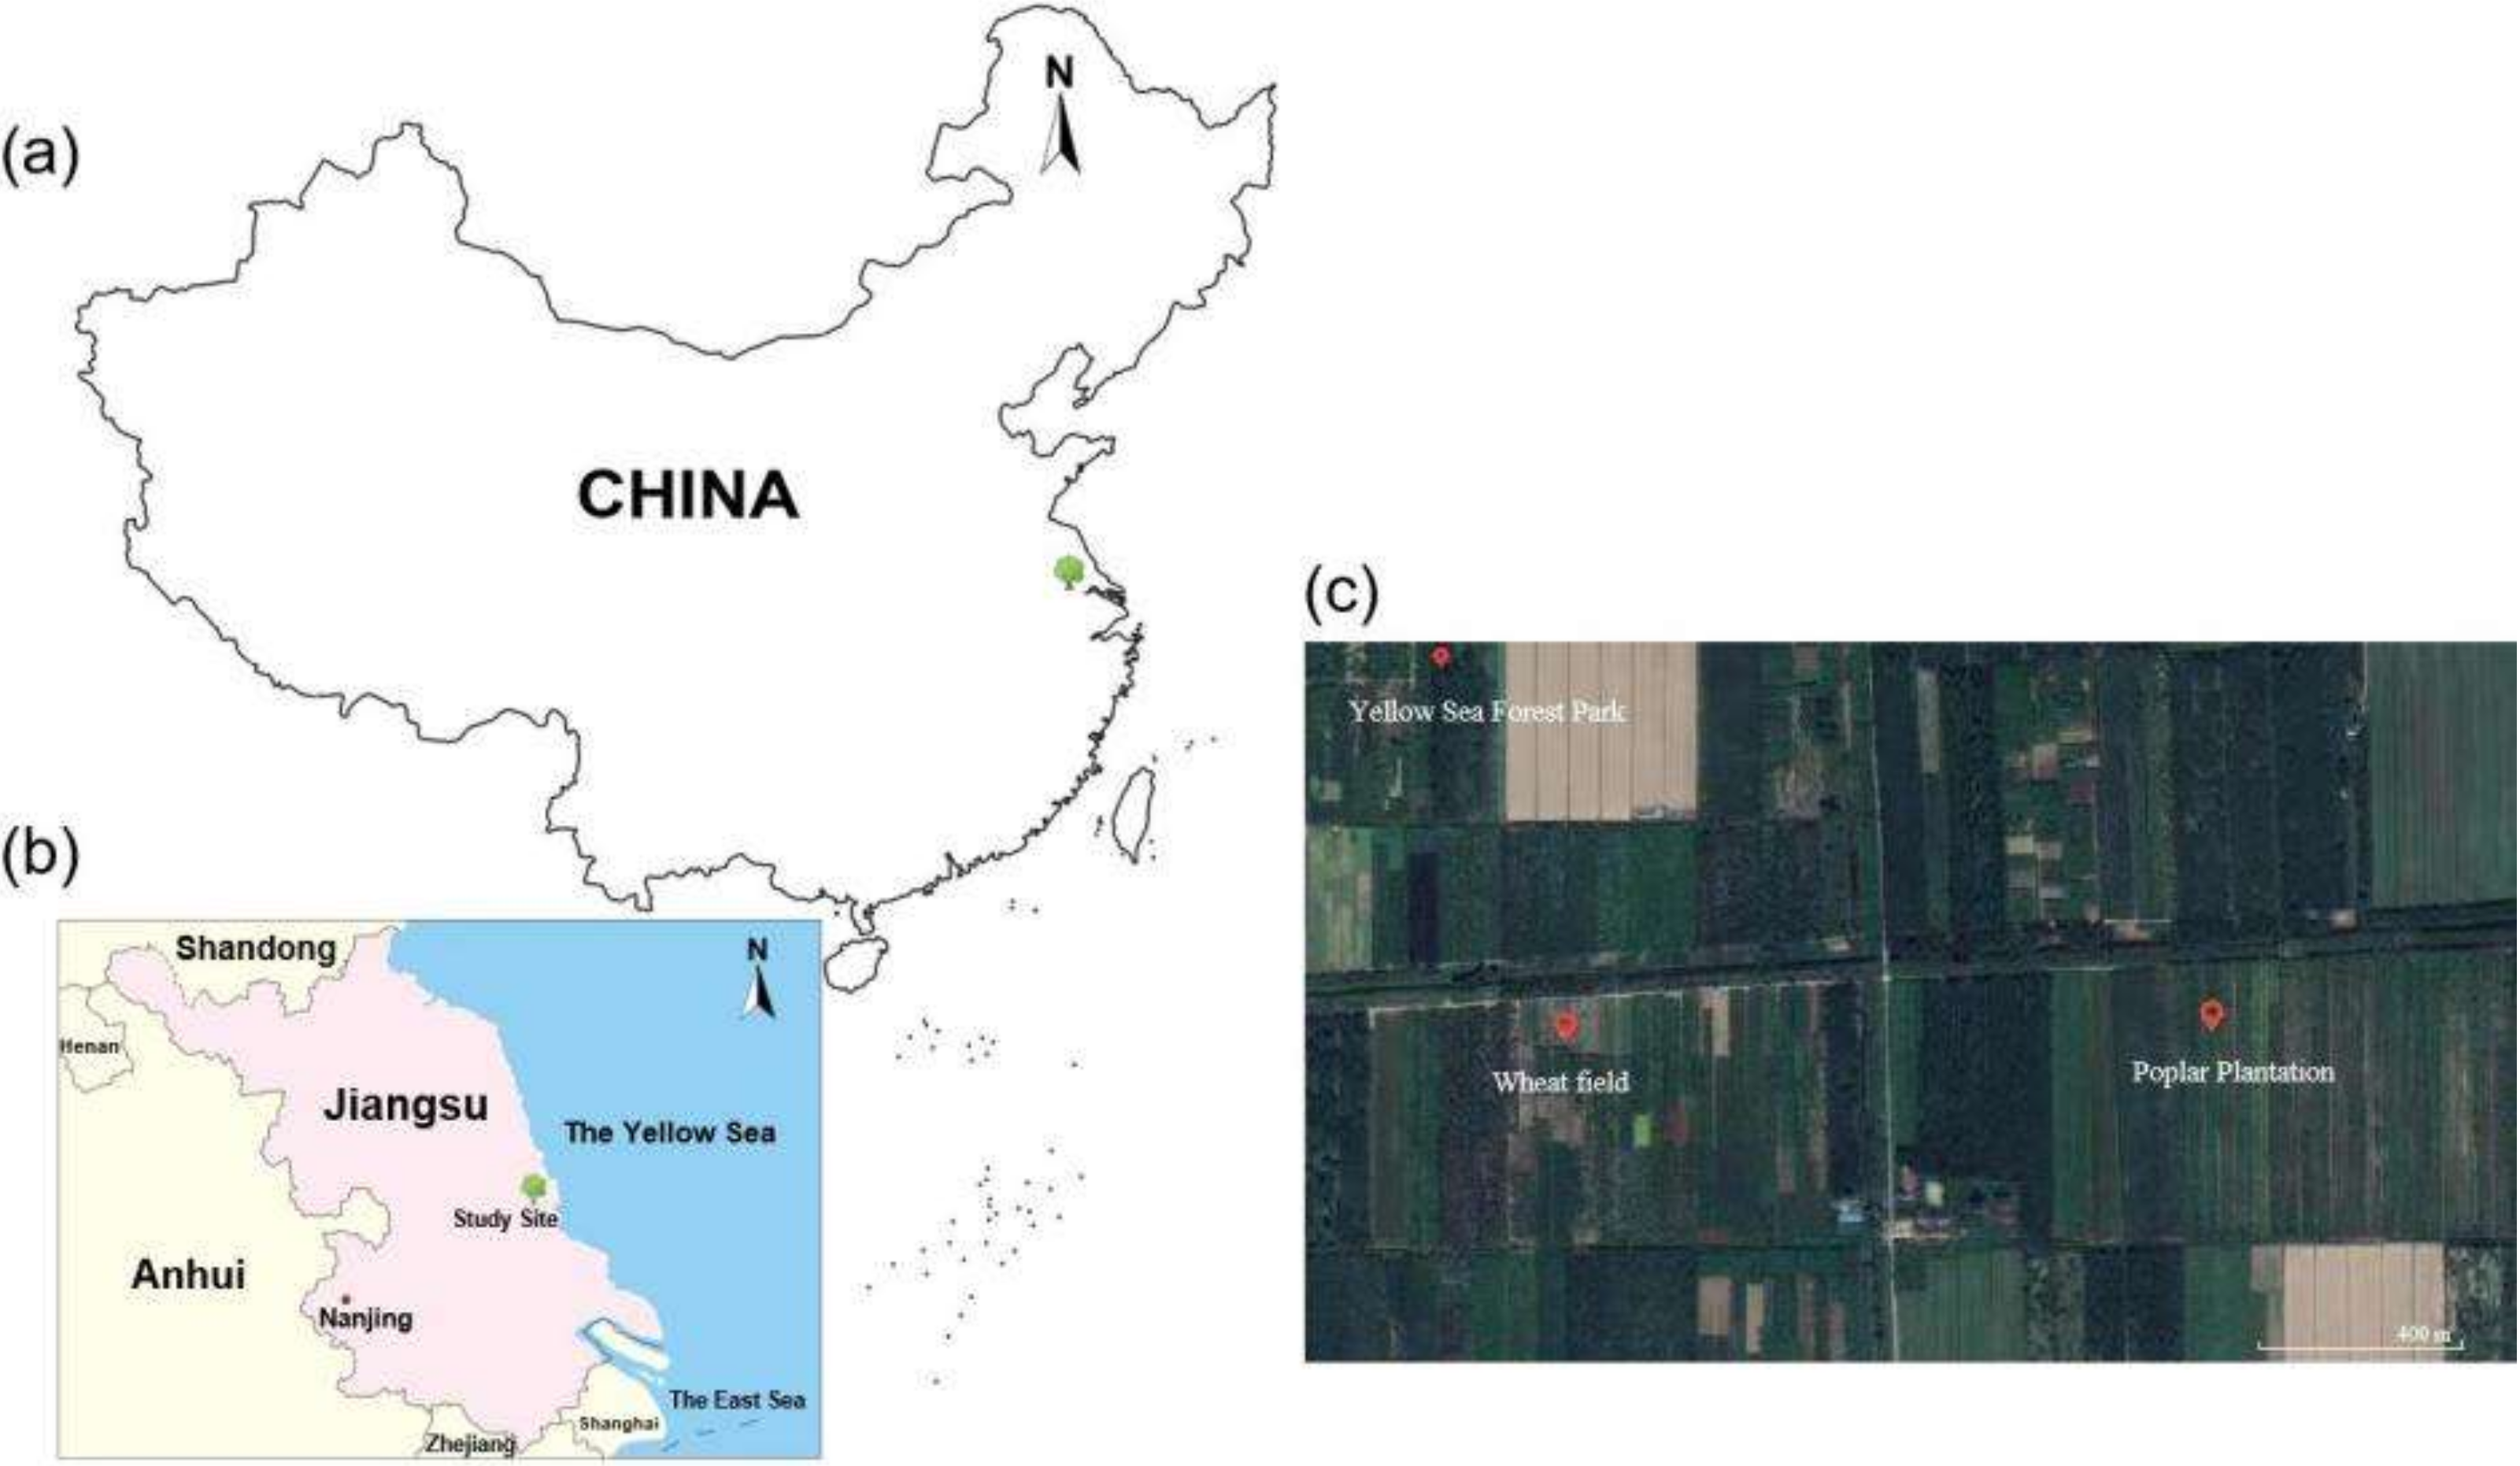
2.1. Study Area

The study site (32°33′–32°57′ N, 120°07′–120°53′ E; average elevation of 5 m above sea level) in Yellow Sea Forest Park, Yancheng County, Jiangsu Province, PRC, is situated on relatively flat terrain, belongs to the middle and lower areas of the Yangtze River alluvial plains, and has a coastline of 85 km and a wetland area of more than 10,000 hectares. The study area experiences a northern sub-tropical monsoon transitional climate, with an annual mean air temperature of 15.6 °C (a minimum temperature of −7.5 °C, a maximum temperature of 35.9 °C), annual precipitation of 1044 mm and annual evaporation of 911.9 mm. The yearly mean frost-free period is 237 days, and the annual sunshine duration is 2209 h. Sandy loam soil is prevalent in this area. Figure 1 shows the study area map of the study site.

2.2. Experimental Design and Soil Sampling

The three planting systems, a poplar plantation (P), a wheat field after deforestation of a poplar plantation (P–W), and a wheat field (W), were selected for the experiments. At the site, more than 20 hectares of poplar had been planted in 2004, with a row and plant spacing of 3 × 5 m. The mean DBH of the poplars was 20.85 ± 4.03 cm, and the mean height was 18.91 ± 2.99 m according to a stand survey conducted in March 2015. The trees in the P system were cut down in March 2015. A summer maize (June to October)–winter wheat (October of the previous year—June) rotation was implemented following deforestation, and a wheat–maize rotation had been used for decades in the W system. Based on the information provided by local farmers, compound fertilizer (N:P2O5:K2O ratio of 15%:15%:15%) was applied in mid-June at 0.25 t ha−1 and mid–October at 0.45 t ha−1 in the P–W and W systems.
Soil samples from the P system were collected in March 2015 before deforestation, and samples from the P–W system were collected in March 2016 following deforestation. Soil samples from the W system were collected in March 2016 within 2 km of the poplar plantation. A 10 × 10 m sample plot was chosen for all systems, and soil samples were collected from each plot (three replicates). The distance of each plot was greater than 100 m within the same system. Soil samples were collected from different soil depths (0–10, 10–20, 20–40, 40–60, and 60–100 cm) at five points in each plot based on an S-shaped curve, the samples were combined into a composite sample and 45 samples were transported to the laboratory to determine the chemical properties after air drying. All samples were sieved through 2 mm and 0.25 mm screens, and roots and other debris were discarded.

2.3. Soil Analyses

The soil samples were collected with a stainless steel cylinder with a thickness of 1 mm and an internal diameter and height of 5 cm to determine the soil bulk density. Soil pH was determined with a Sartorius PB–10 Basic pH meter (1:2.5 soil:water (w:v) ratio). The chemical properties were determined as follows: SOC was measured with a modified Walkley and Black method [30], soil total nitrogen (TN) was measured with the Kjeldahl method, soil total phosphorus (TP) was measured with a molybdenum colorimetric method, and soil total potassium (TK) was measured with an acid solution and flame photometric method with a solar–100 atomic absorption spectrophotometer [27].
Based on the SOC content, BD, and soil sampling depth, the total SOC stocks (TSOC, t ha–1) at a depth of 100 cm were calculated with the following formula [31]:
TSOC = ∑SOCi × BDi × Di × 0.1
where TSOC is the total soil organic carbon (SOC) stock (t ha–1), SOCi is the SOC concentration in the ith layer (g kg–1), BDi is the soil bulk density (g cm–3) in the ith soil layer, Di is the soil sampling depth (cm), and 0.1 is the conversion value from g cm−2 to t ha−1.

2.4. Statistical Analyses

The statistical tests were conducted using SPSS version 24.0 (IBM, Chicago, IL, USA). All data in this study are expressed as the mean ± standard deviation (n = 3). One-way analysis of variance (ANOVA) was conducted to compare the differences in the soil physical and chemical properties and SOC stocks among different land-use types or different soil depths. The main effects and interaction effects of the planting forms and soil depths on the pH, BD, nutrient contents, and SOC contents were determined using two-way analysis of variance (ANOVA). The linear fitting method was used to quantify the relationships between SOC and the soil physical and chemical properties (Origin version 2018, OriginLab, Northampton, MA, USA). We used ordinary least squares and standardized residual methods to validate the regression analysis with an alpha level of 0.05.

3. Results

3.1. Vertical Variations of Bulk Density (BD) and pH Values in Different Land-Use Types

The BD values increased with soil depth in the three planting systems, ranging from an average of 1.21 g cm3 in the topsoil (0–10 cm) to 1.46 g cm3 in the subsoil (60–100 cm) (Figure 2a). There were no significant interaction effects of soil depth and planting system on BD (Table 1). The BD values of the P–W system were lower than those of the other systems in all soil layers, and the BD values in the 0–10 and 10–20 cm layers of the P system were significantly (p < 0.05) higher than those of the P–W and W systems. The variation trend of soil porosity in each system was opposite to that of the BD. In 20–40 cm and 60–100 cm soil layers, the soil porosity of the P–W system were significantly higher than those of the other systems (p < 0.05) (Figure 2b).The pH of the three planting systems generally increased with soil depth and ranged from 7.97–8.67 (Figure 2c); the soil was classified as slightly alkaline. At 0–10 cm, the pH values in the P–W and W systems were significantly lower than those in the P system (p < 0.05), while the pH values in the deep soil layers (40–60, 60–100 cm) of the W system were higher than those of the P and P–W systems. Overall, the pH values in the P–W system were lower than those in the P and W systems, and the interaction between soil depth and planting system had no significant influence on the soil pH (Table 1).

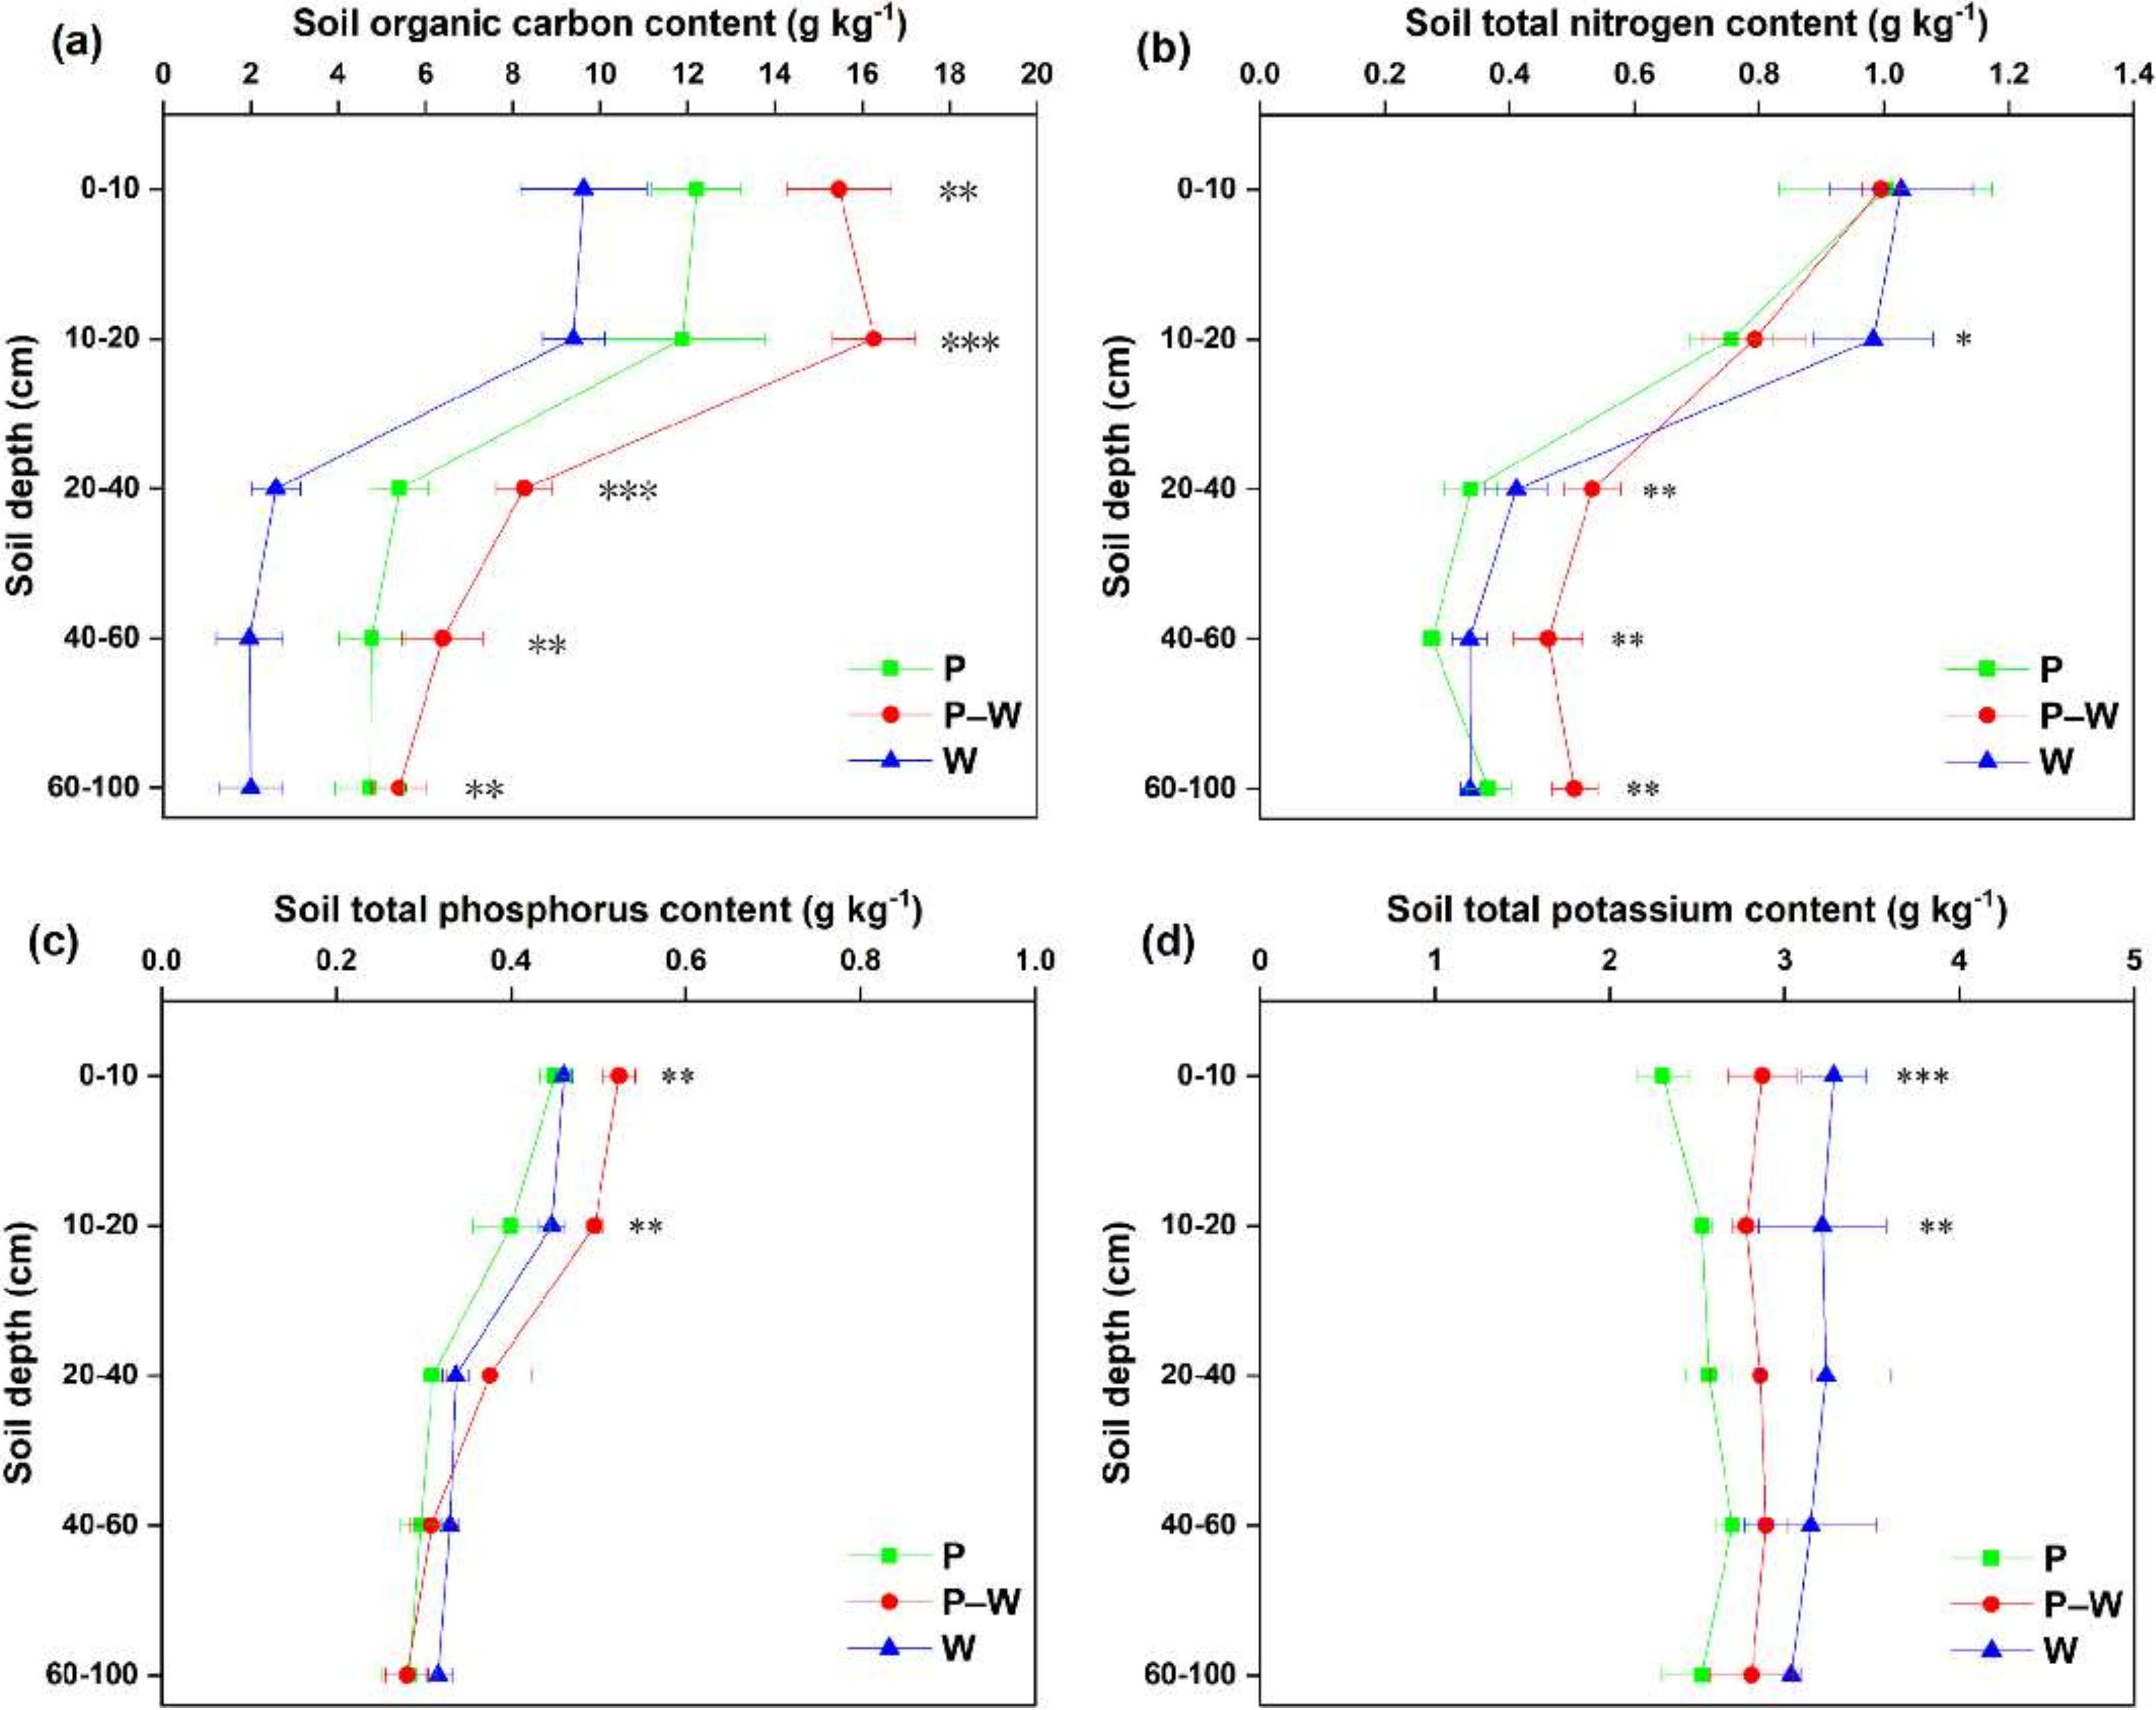
3.2. Vertical Variations of the Soil Organic Carbon (SOC), Total Nitrogen (TN), Total Phosphorus (TP), and Total Potassium (TK) Contents in Different Land-Use Types

The SOC contents in the topsoil (0–10, 10–20 cm) were significantly (p < 0.05) higher than those observed in other soil layers of different land-use types (Figure 3a). Overall, the SOC contents in the P–W system were significantly higher than those observed in the P and W systems (p < 0.05). The average SOC contents based on all sampling layers were as follows: P–W system (10.36 g kg−1) > P system (7.80 g kg−1) > W system (5.04 g kg−1). The repeated-measures ANOVA showed significant interaction effects of soil depth and planting system on SOC contents (Table 1).
The variation trends of the soil TN and TP contents with soil depth were similar to those of the SOC contents (Figure 3b,c). However, the soil TN contents at 0–10 cm showed little difference in the three planting systems. In the P–W system, there was significantly (p < 0.01) higher TN contents in the deep soil layers (20–40, 40–60 and 60–100 cm). The soil TP contents in the P–W system were significantly higher than those of the other systems at 0–10 and 10–20 cm (p < 0.05) (Figure 3c), which was in contrast with the TN variation trends. Meanwhile, the variation in TP contents at 20–40, 40–60 and 60–100 cm showed little difference in all planting systems. The highest TP content (0.523 g kg−1) was observed in the 0–10 cm P–W system. The interaction of soil depth and planting system significantly affected soil TN and TP contents (Table 1).
The soil TK contents exhibited diversity at different soil depths for the different land-use types (2.30–3.28 g kg−1) (Figure 3d). In the P system, the TK contents increased as the soil depth increased up to 60 cm (0–10, 10–20, 20–40 and 40–60 cm) but then decreased for further increases (60–100 cm). In the P–W system and W system, the variation range of TK contents had little difference among different soil depths. Throughout the soil profile, higher soil TK contents were observed in the W system and lower contents in the P system.

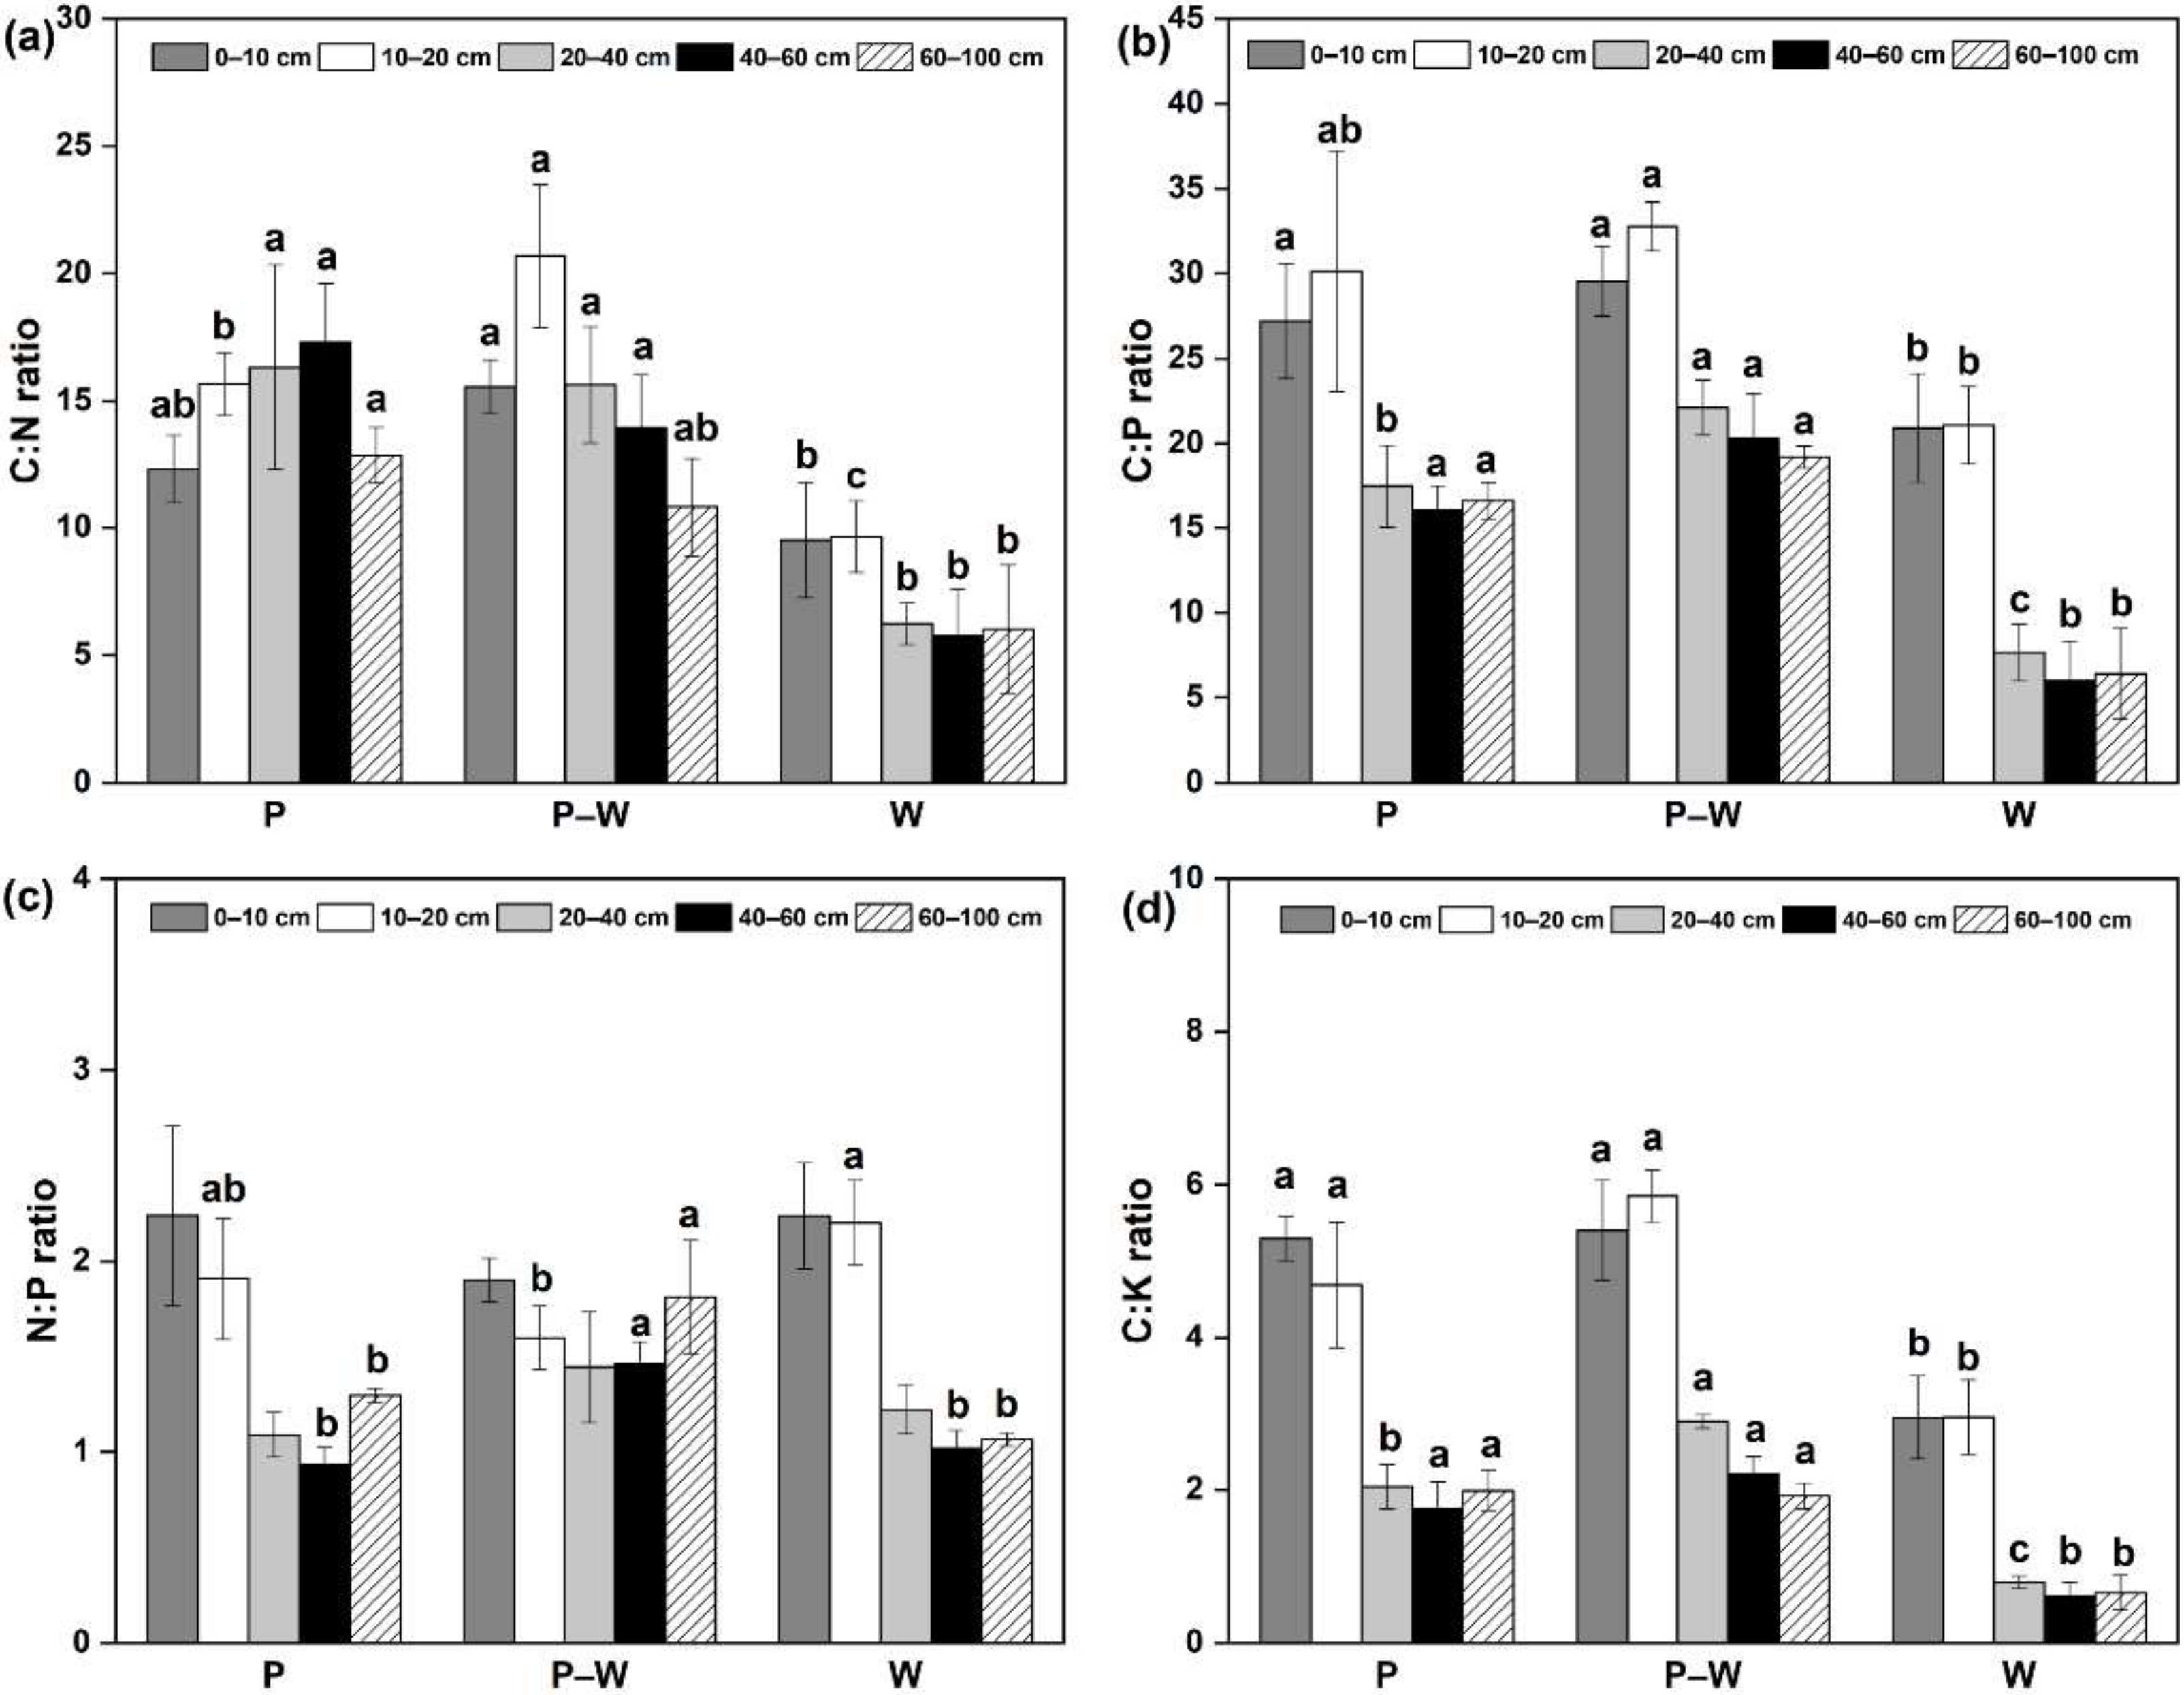
3.3. Vertical Variation of Ratios of SOC, TN, TP, and TK in Different Land-Use Types

The ratios of SOC, TN, TP, and TK in the three systems showed different trends among soil depths (Figure 4). The ranges of the C:N ratio (5.78–20.70), C:P ratio (5.99–32.77), C:K ratio (0.61–5.85) and N:P ratio (0.93–2.24) are shown in Figure 4. Both the C:N and C:P ratios first decreased and then increased with the soil depth of the three planting systems, while the N:P ratio showed the opposite trend. The C:N ratio, C:P ratio, and C:K ratio in the W system were lower than those in the P and P–W systems throughout the soil profile. A significantly higher C:N ratio was measured in the topsoil (0–10 and 10–20 cm) (p < 0.05) in the P–W system compared with the P system, whereas it was lower in the subsoil (Figure 4a), and the variation trend of the C:P ratio was exactly the reverse of that of the C:N ratio (Figure 4b). The P system had a considerably higher C:K ratio than the P–W system, especially at 0–10 cm, while there were slight differences at 10–20, 20–40, 40–60 and 60–100 cm (Figure 4c). The N:P ratios of the P–W system were significantly lower than those of the other systems in the topsoil (0–10 and 10–20 cm) (p < 0.05) but were substantially higher at 40–60 and 60–100 cm (Figure 4d). The interaction of soil depth and planting system significantly affected the soil C:N, C:K, and N:P ratios (Table 2).

3.4. Vertical Variations of SOC Stocks in Different Land-Use Types

The SOC stocks in the whole soil profile of the P–W system were the highest (107.73 Mg ha−1), as shown in Figure 5a, and were 120.1% of those in the P system and 235.9% of those in the W system. Among the three planting systems, the SOC stocks were ranked as follows: P–W system > P system > W system for each soil layer (p < 0.01); there was an initial increase and then a decrease with soil depth under the condition of the same soil layer thickness. The highest values were observed at 10–20 cm, while the changes in the SOC stocks at 40–60 and 60–100 cm were relatively small. Notably, the SOC stock (48.02 Mg ha−1) in the 40–60 and 60–100 cm layers of the P–W system was higher than that in the W system (45.67 Mg ha−1). In addition, the proportion of the SOC stocks in the P and P–W systems was roughly the same in each soil layer (Figure 5b). Approximately 36% of the SOC stocks accumulated at 0–10 and 10–20 cm, compared with 63–65% at 20–40 and 40–60 cm, while the SOC stocks at 0–10 and 10–20 cm contributed approximately 52% to the SOC stocks in the whole soil profile of the W system.

3.5. Relationships of the SOC Content and Soil Physical and Chemical Properties

To investigate the relationships of the SOC content and the soil BD, pH, TN, TP, and TK, a linear fitting method was used in this study. Generally, Pearson’s correlation coefficient between BD and the SOC content was −0.7651 (Figure 6a; p < 0.001), while that between pH and the SOC content was −0.8436 (Figure 6b; p < 0.001), which exhibited a significant negative correlation. Significant positive linear relationships were observed between the SOC content and TN (Pearson’s r = 0.7994; p < 0.001) and TP (Pearson’s r = 0.9243; p < 0.001) (Figure 6c,d), while there was a slightly negative correlation between the SOC and TK contents (Figure 6e; Pearson’s r = −0.3103; p < 0.05).

4. Discussion

Deforestation dominates land-use changes worldwide [16] and has a significant impact on the environment, such as biodiversity loss and climate and soil-quality changes [32]. In this study, the soil BD increased gradually with soil depth, similar to previous studies [33]. Soil BD might be related to a high organic matter content, dense root system of plants, and high abundance of soil microorganisms in the topsoil [28]. Due to the different tillage practices, the soil BD in the P system was higher than that in the P–W and W systems at 0–10 and 10–20 cm. High amounts of wheat stubble in the W system after conventional tillage practices and litter and roots in the PW system after deforestation increased the organic matter content; as a result, the soil BD was reduced indirectly. In our results, a significant negative linear relationship between the SOC content and BD confirmed the dependence of BD on SOC [34]. Soil organic colloids can change the soil porosity and water–air ratio to create a suitable soil structure. In the PW system, deep plowing was used to clear the deep roots, and the soil BD in deep soil (20–40, 40–60 and 60–100 cm) was lower than that in the other systems. Contrary to the trend of the soil BD, due to the tillage practices, the soil porosity in the P system was lower than that in the P–W and W systems in the topsoil.
Soil pH can affect the interaction of organic matter and minerals in the soil, the microbial community, the soil microbial activity, and the enzyme activity, which significantly influences the turnover of soil organic matter. Due to the influence of precipitation, soluble salt ions in soil gradually infiltrate through precipitation leaching [35], and due to the high input of organic matter in the topsoil, the pH values in the topsoil (0–10 and 10–20 cm) were significantly lower than those in deep soil (20–40, 40–60 and 60–100 cm). Changes in land use can lead to variations in soil pH [36], and the pH values of the P–W system were generally low; the pH of the P–W and P systems was lower than that of the W system at 0–10 cm. Although some studies attributed the acidification of the rooting zone to the accumulation of large amounts of cations in tree biomass [28,37], the production of organic acids and chelation of carbon dioxide are also the main regulating factors of soil acidification [34,38,39]. This was supported by the significant negative correlation between SOC and pH in this study. Similarly, the pH value in the deep soil of the P system was higher than that of the P–W system on average. After deforestation and deep plowing, the soil organic matter and permeability increased decomposition and caused soil acidification.
The vertical distribution of the soil TN and TP contents was similar among the three systems and gradually decreased as the soil depth increased, which was identical to the results observed by other studies [40,41,42]. Jobbágy et al. [43] considered that the “nutrient pumping” effect caused nutrient redistribution: plant roots can absorb nutrients from deep soil and then re-enter topsoil through litter decomposition [44]. The root system of the poplar plantation was relatively less distributed in the 60–100 cm layer, and the nutrient absorption efficiency was lower than that of topsoil [42]. Thus, in poplar systems, the nutrient contents at 60–100 cm were slightly higher than those at 20–40 and 40–60 cm. As most of the fertilizer was applied to the topsoil in the W system, few nutrients could enter the deeper soil. Therefore, the contents of nitrogen and phosphorus decreased gradually at medium soil depths and increased gradually in the topsoil. At 0–10 and 10–20 cm, the soil TN of the W system was slightly higher than that of the P and P–W systems, and the soil TP of the W system was also higher than that of the P system, which might be related to fertilization. In deep soil layers (20–40, 40–60 and 60–100 cm), the soil TN of the P–W system was significantly higher than that of the P and W systems, which may have been caused by large amounts of topsoil and residues entering the deep soil after deforestation [45]. The TP in deep soil did not differ greatly among the different systems, and this phenomenon might be related to the lower mobility of soil phosphorus than soil nitrogen [46]. There was no consistent variation in TK among soil depths; this may have been caused by the high mobility of potassium in soil [28]. The soil TK content of the W system was the highest, followed by that of the P–W system. In the W system, annual fertilization of the farmland increased potassium input, resulting in the accumulation of this nutrient [46]. The soil TK in the poplar plantations, which had a relatively low amount of external K input, mainly benefited from litter input and throughfall water [47]. Fertilization was also carried out in the P–W system, but the cultivation time was short.
Compared with cropland, the tree-based cropping systems had significantly higher organic carbon contents at all sampled soil depths. This is consistent with previous studies [48,49], and forestland has a higher carbon sequestration capacity than cropland. Perennial tree species can fix carbon oxides by photosynthesis and serve as important carbon sinks. Plant residues and dead branches on the soil surface are essential for improving soil carbon input [50]. Deep tree roots can release stable organic matter directly into deep soil, which is conducive to the long-term storage of organic carbon [51]. Compared with shoot-derived carbon, root-derived carbon is more stabilized in soil [52]. A previous study reported that residues and root rhizodeposition were the primary sources of SOC accumulation [53]. Plantations receive higher input of dead and decomposing litter, while cropland undergoes the repeated removal of biomass and frequent tillage practices, which improve soil aeration and accelerate SOC mineralization [28].
Compared with the P system, the SOC stock was significantly increased in the P–W system after deforestation, which is different from the results from other studies [17,54,55]. This may be related to differences in the survey period after deforestation; we chose the first year after deforestation in this study. Although most plant tissues were removed after deforestation, forest litter and roots and residues from understory species remained in the system [52], and the amounts were higher than the carbon sources (litter and root exudates) from the poplar plantation with average growth. The understory vegetation and crop residues in the autumn of 2015 remained in the system and increased the carbon sources of the system. These carbon sources entered the soil through agricultural practices such as plowing with remaining plant tissue, which might significantly impact soil properties [50]. Additionally, the SOC stocks increased significantly in the deeper soil layers, which may have been due to the relatively deep plowing to mix the topsoil into the subsoil. Without the shade of trees after deforestation, the soil system’s light, temperature, and moisture conditions favor the decay of a large pool of dead fine roots and other quickly decomposing litter in the soil [21]. Moreover, the increase in soil permeability improved the activity of the soil microbial community and accelerated the decomposition of litter and storage in soil as SOC. In the short term, the loss of organic carbon decomposition was offset by the rapid decay of litter, resulting in SOC accumulation.
Significantly, the change in SOC was controlled by the decomposition rate of SOC [8], the soil permeability and soil respiration greatly improved after deforestation, which would accelerate the decomposition and mineralization of SOC [24], and deep plowing would reduce the stability of SOC [55]. Therefore, appropriate measures should be carried out to slow the decomposition and mineralization of SOC and mitigate the loss of SOC storage after deforestation.
Stoichiometry is an important index of ecological interaction and element balance [56]. Crovo et al. [29] reported that soil properties control the range of SOC stocks and stoichiometry after land-use changes. In the present investigation, the land-use change caused a shift in the stoichiometric relationships of SOC, TN, and TP, and the results were similar to those of Cao and Chen [57]. Land-use change has a significant influence on soil stoichiometry [58]. The C:N, C:P and N:P ratios in deep soil also showed significant differences among the three systems, which indicated that land-use change also affected the soil nutrient stoichiometry in deep layers [56].
The range of soil C:N ratios (5.78–9.64) in the W system implied that the soil microbial biomass began to increase and that the mineralized soil nitrogen significantly increased compared with P and P–W systems. The soil C:N ratio (10.82–20.70) in the P and P–W systems indicated that the soil microbial biomass increased rapidly, mineralized soil nitrogen was released, and the organic matter decayed [59]. Compared with cropland, the soil C:N ratio after afforestation and deforestation was significantly higher and indicated that the unstable components made up a more significant proportion of the organic matter, which would increase the soil carbon mineralization rates [60]. Although the soil TN contents increased after deforestation, the proportion of C:N in the P–W system increased and indicated that the available nitrogen in the system was limited and more nitrogen was fixed by SOC; the low N:P ratio confirmed this viewpoint.
The soil C:P ratio (5.99–32.77) indicated the net mineralization of organic phosphorus by soil microorganisms [58]. Plant growth is limited by nitrogen when the N:P ratio is less than 14 [59], and our results showed that the N:P ratio (0.93–2.24) indicated that there was a high nitrogen content in the soil [46]. The soil C:K ratio decreased as the soil depth increased in all systems, and the highest C:K value was measured in the P–W system, indicating that the stoichiometric relationship between K and other nutrients may also be affected by land use [56]. In contrast to other studies [42,61], compared with the 0–10 cm depth in the P–W system, better C:N and C:P ratios were observed at 10–20 cm, thus indicating that the decomposition rate of SOC in the topsoil was higher than that in the subsoil.
The SOC was positively correlated with the contents of TN and TP in the soil. In most ecosystems, nitrogen availability in soil determines the cycling rate of soil organic matter and regulates plant growth and forest productivity [62]. Similarly, the availability of phosphorus can affect the above- and belowground biomass of plants, thus changing the allocation of carbon [63], and can significantly influence SOC stocks [29]. Due to the high migration of K in soil [28], the distribution of TK at different soil depths was not evident. Thus, there was only a weak correlation between SOC and TK.
According to the ecological stoichiometry and correlation analysis, our data showed that nitrogen was the limiting element in this study area. Therefore, long-term N addition is necessary in the P–W system, which will decrease the soil carbon mineralization rates and further improve the stability of soil organic carbon [60]. This can be an essential theoretical basis for local farmers to formulate and modify land management measures after deforestation.

5. Conclusions

In this study, compared with the poplar plantation, the soil BD and pH in the system decreased in the whole soil profile 1 year after deforestation. Soil nutrients such as TN, TP, and TK increased significantly, and the SOC contents and stocks were temporarily increased. The vertical distribution of the SOC stocks changed after deforestation, and the proportion of SOC stocks in deep soil increased. Based on stoichiometry and correlation analysis, we found that nitrogen was limited in the study area, and deforestation reduced the availability of nitrogen and exacerbated the nitrogen limitation. Notably, the decrease in soil BD increased the activity of soil microorganisms, which can accelerate the decomposition of SOC. The limitation of nitrogen also reduced the stability of the SOC in the system. These results can be used as an important basis for modifying and optimizing tillage practices; by increasing the proportion of nitrogen fertilizer as well as other tillage practices, the availability of soil nutrients and the stability of SOC stocks can be improved, especially in deep soil, and the decomposition of SOC can be decreased after deforestation.

Author Contributions

Methodology, G.W.; investigation, S.T.Z.M. and Y.L.; writing—original draft preparation, B.W.; writing—review and editing, L.T.; visualization, C.X., Z.L. and Z.Q. All authors have read and agreed to the published version of the manuscript.

Funding

This research was funded by the Jiangsu Agricultural Science and Technology Innovation Fund [CX(19)2039].

Institutional Review Board Statement

Not applicable.

Informed Consent Statement

Not applicable.

Data Availability Statement

Data are available on request from the corresponding author.

Conflicts of Interest

The authors declare that they have no conflict of interest.

References

  1. Watson, R.T.; Noble, I.R.; Bolin, B.; Ravindranath, N.; Verardo, D.J.; Dokken, D.J. Land Use, Land-Use Change, and Forestry: A Special Report of the Intergovernmental Panel on Climate Change; Cambridge University Press: Cambridge, UK, 2000. [Google Scholar]
  2. IPCC. Climate Change 2007: The Physical Science Basis. Contribution of Working Groups I, the Fourth Assessment Report of IPCC; Cambridge University Press: Cambridge, UK, 2007. [Google Scholar]
  3. Lal, R. Soil carbon sequestration to mitigate climate change. Geoderma 2004, 123, 1–22. [Google Scholar] [CrossRef]
  4. Cai, Y.; Chang, S.X. Disturbance Effects on Soil Carbon and Greenhouse Gas Emissions in Forest Ecosystems. Forests 2020, 11, 297. [Google Scholar] [CrossRef] [Green Version]
  5. Guo, J.; Wang, B.; Wang, G.; Myo, S.T.Z.; Cao, F. Effects of three cropland afforestation practices on the vertical distribution of soil organic carbon pools and nutrients in eastern China. Glob. Ecol. Conserv. 2020, 22, e00913. [Google Scholar] [CrossRef]
  6. Powlson, D.S.; Gregory, P.J.; Whalley, W.R.; Quinton, J.N.; Hopkins, D.W.; Whitmore, A.P.; Hirsch, P.R.; Goulding, K.W.T. Soil management in relation to sustainable agriculture and ecosystem services. Food Policy 2011, 36, S72–S87. [Google Scholar] [CrossRef]
  7. Villarino, S.H.; Studdert, G.A.; Baldassini, P.; Cendoya, M.G.; Ciuffoli, L.; Mastrángelo, M.; Piñeiro, G. Deforestation impacts on soil organic carbon stocks in the Semiarid Chaco Region, Argentina. Sci. Total Environ. 2017, 575, 1056–1065. [Google Scholar] [CrossRef] [Green Version]
  8. Don, A.; Schumacher, J.; Freibauer, A. Impact of tropical land-use change on soil organic carbon stocks—A meta-analysis. Glob. Chang. Biol. 2011, 17, 1658–1670. [Google Scholar] [CrossRef] [Green Version]
  9. Han, X.; Gao, G.; Chang, R.; Li, Z.; Ma, Y.; Wang, S.; Wang, C.; Lü, Y.; Fu, B. Changes in soil organic and inorganic carbon stocks in deep profiles following cropland abandonment along a precipitation gradient across the Loess Plateau of China. Agric. Ecosyst. Environ. 2018, 258, 1–13. [Google Scholar] [CrossRef]
  10. Gao, G.; Tuo, D.; Han, X.; Jiao, L.; Li, J.; Fu, B. Effects of land-use patterns on soil carbon and nitrogen variations along revegetated hillslopes in the Chinese Loess Plateau. Sci. Total Environ. 2020, 746, 141156. [Google Scholar] [CrossRef]
  11. Zeraatpisheh, M.; Ayoubi, S.; Jafari, A.; Tajik, S.; Finke, P. Digital mapping of soil properties using multiple machine learning in a semi-arid region, central Iran. Geoderma 2019, 338, 445–452. [Google Scholar] [CrossRef]
  12. Zeraatpisheh, M.; Garosi, Y.; Reza Owliaie, H.; Ayoubi, S.; Taghizadeh-Mehrjardi, R.; Scholten, T.; Xu, M. Improving the spatial prediction of soil organic carbon using environmental covariates selection: A comparison of a group of environmental covariates. Catena 2022, 208, 105723. [Google Scholar] [CrossRef]
  13. Liu, D.; Liu, Y.; Fang, S.; Tian, Y. Tree species composition influenced microbial diversity & nbsp; and nitrogen availability in rhizosphere soil. Plant Soil Environ. 2016, 61, 438–443. [Google Scholar] [CrossRef]
  14. Yonekura, Y.; Ohta, S.; Kiyono, Y.; Aksa, D.; Morisada, K.; Tanaka, N.; Kanzaki, M. Changes in soil carbon stock after deforestation and subsequent establishment of “Imperata” grassland in the Asian humid tropics. Plant Soil 2009, 329, 495–507. [Google Scholar] [CrossRef]
  15. Wei, X.; Shao, M.; Fu, X.; Horton, R.; Li, Y.; Zhang, X. Distribution of soil organic C, N and P in three adjacent land use patterns in the northern Loess Plateau, China. Biogeochemistry 2009, 96, 149–162. [Google Scholar] [CrossRef]
  16. Jallat, H.; Khokhar, M.F.; Kudus, K.A.; Nazre, M.; Saqib, N.U.; Tahir, U.; Khan, W.R. Monitoring Carbon Stock and Land-Use Change in 5000-Year-Old Juniper Forest Stand of Ziarat, Balochistan, through a Synergistic Approach. Forests 2021, 12, 51. [Google Scholar] [CrossRef]
  17. Smith, P.; House, J.I.; Bustamante, M.; Sobotka, J.; Harper, R.; Pan, G.; West, P.C.; Clark, J.M.; Adhya, T.; Rumpel, C.; et al. Global change pressures on soils from land use and management. Glob. Chang. Biol. 2016, 22, 1008–1028. [Google Scholar] [CrossRef] [PubMed]
  18. Bradford, M.A.; Berg, B.; Maynard, D.S.; Wieder, W.R.; Wood, S.A.; Cornwell, W. Understanding the dominant controls on litter decomposition. J. Ecol. 2016, 104, 229–238. [Google Scholar] [CrossRef]
  19. Zaninovich, S.C.; Gatti, M.G. Carbon stock densities of semi-deciduous Atlantic forest and pine plantations in Argentina. Sci. Total Environ. 2020, 747, 141085. [Google Scholar] [CrossRef]
  20. Bonini, I.; Hur Marimon-Junior, B.; Matricardi, E.; Phillips, O.; Petter, F.; Oliveira, B.; Marimon, B.S. Collapse of ecosystem carbon stocks due to forest conversion to soybean plantations at the Amazon-Cerrado transition. For. Ecol. Manag. 2018, 414, 64–73. [Google Scholar] [CrossRef]
  21. Grünzweig, J.M.; Valentine, D.W.; Chapin, F.S. Successional Changes in Carbon Stocks after Logging and Deforestation for Agriculture in Interior Alaska: Implications for Boreal Climate Feedbacks. Ecosystems 2014, 18, 132–145. [Google Scholar] [CrossRef]
  22. State Forestry and Grassland Bureau (SFGB). China Forest Resources Report (2014–2018); China Forestry Publishing: Beijing, China, 2019. [Google Scholar]
  23. Liang, G.T.; Zhang, S.Y.; Guo, J.; Yang, R.; Li, H.; Fang, X.C.; Zhang, G.C. The effects of para-hydroxybenzoic acid treatment on photosynthetic parameters of Populus *euramericana “Neva”. Photosynthetica 2018, 56, 505–511. [Google Scholar] [CrossRef]
  24. Weidenhamer, J.D.; Romeo, J.T. Allelochemicals of Polygonella myriophylla: Chemistry and Soil Degradation. J. Chem. Ecol. 2004, 30, 1067–1082. [Google Scholar] [CrossRef] [PubMed]
  25. Finstad, K.; Straaten, O.; Veldkamp, E.; McFarlane, K. Soil Carbon Dynamics Following Land Use Changes and Conversion to Oil Palm Plantations in Tropical Lowlands Inferred From Radiocarbon. Glob. Biogeochem. Cycles 2020, 34, e2019GB006461. [Google Scholar] [CrossRef]
  26. Pérez, A.; Machado, W.; Gutierrez, D.; Stokes, D.; Sanders, L.; Smoak, J.M.; Santos, I.; Sanders, C.J. Changes in organic carbon accumulation driven by mangrove expansion and deforestation in a New Zealand estuary. Estuar. Coast. Shelf S 2017, 192, 108–116. [Google Scholar] [CrossRef]
  27. Durán, J.; Morse, J.L.; Rodríguez, A.; Campbell, J.L.; Christenson, L.M.; Driscoll, C.T.; Fahey, T.J.; Fisk, M.C.; Mitchell, M.J.; Templer, P.H.; et al. Differential sensitivity to climate change of C and N cycling processes across soil horizons in a northern hardwood forest. Soil Biol. Biochem. 2017, 107, 77–84. [Google Scholar] [CrossRef] [Green Version]
  28. Guo, J.; Wang, B.; Wang, G.; Wu, Y.; Cao, F. Afforestation and agroforestry enhance soil nutrient status and carbon sequestration capacity in eastern China. Land Degrad. Dev. 2019, 31, 392–403. [Google Scholar] [CrossRef]
  29. Crovo, O.; Aburto, F.; Albornoz, M.F.; Southard, R. Soil type modulates the response of C, N, P stocks and stoichiometry after native forest substitution by exotic plantations. Catena 2021, 197, 104997. [Google Scholar] [CrossRef]
  30. Gao, X.; Meng, T.; Zhao, X. Variations of Soil Organic Carbon Following Land Use Change on Deep-Loess Hillsopes in China. Land Degrad. Dev. 2017, 28, 1902–1912. [Google Scholar] [CrossRef]
  31. Li, Z.; Liu, C.; Dong, Y.; Chang, X.; Nie, X.; Liu, L.; Xiao, H.; Lu, Y.; Zeng, G. Response of soil organic carbon and nitrogen stocks to soil erosion and land-use types in the Loess hilly–gully region of China. Soil Till. Res. 2017, 166, 1–9. [Google Scholar] [CrossRef]
  32. Foley, J.A.; Asner, G.P.; Costa, M.H.; Coe, M.T.; DeFries, R.; Gibbs, H.K.; Howard, E.A.; Olson, S.; Patz, J.; Ramankutty, N.; et al. Amazonia revealed: Forest degradation and loss of ecosystem goods and services in the Amazon Basin. Front. Ecol. Environ. 2007, 5, 25–32. [Google Scholar] [CrossRef]
  33. Chen, L.; Gong, J.; Fu, B.; Huang, Z.; Huang, Y.; Gui, L. Effect of land-use conversion on soil organic carbon sequestration in the loess hilly area, loess plateau of China. Ecol. Res. 2006, 22, 641–648. [Google Scholar] [CrossRef]
  34. Abbasi, M.K.; Rasool, G. Effects of different land-use types on soil quality in the hilly area of Rawalakot Azad Jammu and Kashmir. Acta Agric. Scand. Section B Soil Plant Sci. 2005, 55, 221–228. [Google Scholar] [CrossRef]
  35. Islam, K.R.; Weil, R.R. Land use effects on soil quality in a tropical forest ecosystem of Bangladesh. Agric. Ecosyst. Environ. 2000, 79, 9–16. [Google Scholar] [CrossRef]
  36. Yimer, F.; Ledin, S.; Abdelkader, A. Changes in soil organic carbon and total nitrogen contents in three adjacent land use types in the Bale Mountains, south-eastern highlands of Ethiopia. For. Ecol. Manag. 2007, 242, 337–342. [Google Scholar] [CrossRef]
  37. Clarholm, M.; Skyllberg, U.; Rosling, A. Organic acid-induced release of nutrients from metal-stabilized soil organic matter—The unbutton model. Soil Biol. Biochem. 2015, 84, 168–176. [Google Scholar] [CrossRef]
  38. Farley, K.A.; Kelly, E.F.; Hofstede, R.G.M. Soil Organic Carbon and Water Retention after Conversion of Grasslands to Pine Plantations in the Ecuadorian Andes. Ecosystems 2004, 7, 729–739. [Google Scholar] [CrossRef]
  39. Liao, K.; Wu, S.; Zhu, Q. Can Soil pH Be Used to Help Explain Soil Organic Carbon Stocks? CLEAN Soil Air Water 2016, 44, 1685–1689. [Google Scholar] [CrossRef]
  40. Hu, Y.F.; Shu, X.Y.; He, J.; Zhang, Y.L.; Xiao, H.H.; Tang, X.Y.; Gu, Y.F.; Lan, T.; Xia, J.G.; Ling, J.; et al. Storage of C, N, and P affected by afforestation with Salix cupularisin an alpine semiarid desert ecosystem. Land Degrad. Dev. 2018, 29, 188–198. [Google Scholar] [CrossRef]
  41. Sperfeld, E.; Wagner, N.D.; Halvorson, H.M.; Malishev, M.; Raubenheimer, D.; Harwood, J. Bridging Ecological Stoichiometry and Nutritional Geometry with homeostasis concepts and integrative models of organism nutrition. Funct. Ecol. 2016, 31, 286–296. [Google Scholar] [CrossRef]
  42. Yao, Y.; Shao, M.; Jia, Y.; Li, T. Distribution of soil nutrients under and outside tree/shrub canopies on a revegetated loessial slope. Can. J. For. Res. 2017, 97, 637–649. [Google Scholar] [CrossRef] [Green Version]
  43. Jobbágy, E.G.; Jackson, R.B. Patterns and mechanisms of soil acidification in the conversion of grasslands to forests. Biogeochemistry 2003, 64, 205–229. [Google Scholar] [CrossRef]
  44. Yang, Y.; Liu, B. Effects of planting Caragana shrubs on soil nutrients and stoichiometries in desert steppe of Northwest China. Catena 2019, 183, 104213. [Google Scholar] [CrossRef]
  45. He, H.; Xia, G.; Yang, W.; Zhu, Y.; Wang, G.; Shen, W. Response of soil C:N:P stoichiometry, organic carbon stock, and release to wetland grasslandification in Mu Us Desert. J. Soil Sediment. 2019, 19, 3954–3968. [Google Scholar] [CrossRef]
  46. Wang, W.; Sardans, J.; Zeng, C.; Zhong, C.; Li, Y.; Penuelas, J. Responses of soil nutrient concentrations and stoichiometry to different human land uses in a subtropical tidal wetland. Geoderma 2014, 232–234, 459–470. [Google Scholar] [CrossRef] [PubMed] [Green Version]
  47. Meiresonne, L.; Schrijver, A.D.; Vos, B.D. Nutrient cycling in a poplar plantation (Populus trichocarpa × Populus deltoides ‘Beaupré’) on former agricultural land in northern Belgium. Can. J. For. Res. 2007, 37, 141–155. [Google Scholar] [CrossRef]
  48. Shi, S.; Zhang, W.; Zhang, P.; Yu, Y.; Ding, F. A synthesis of change in deep soil organic carbon stores with afforestation of agricultural soils. Forest Ecol. Manag. 2013, 296, 53–63. [Google Scholar] [CrossRef]
  49. Wang, S.; Zhuang, Q.; Jia, S.; Jin, X.; Wang, Q. Spatial variations of soil organic carbon stocks in a coastal hilly area of China. Geoderma 2018, 314, 8–19. [Google Scholar] [CrossRef]
  50. Zhao, M.S.; Zhang, G.L.; Wu, Y.J.; Li, D.C.; Zhao, Y.G. Driving forces of soil organic matter change in Jiangsu Province of China. Soil Use Manage. 2015, 31, 440–449. [Google Scholar] [CrossRef]
  51. Poeplau, C.; Don, A. Sensitivity of soil organic carbon stocks and fractions to different land-use changes across Europe. Geoderma 2013, 192, 189–201. [Google Scholar] [CrossRef]
  52. Fujisaki, K.; Perrin, A.S.; Garric, B.; Balesdent, J.; Brossard, M. Soil organic carbon changes after deforestation and agrosystem establishment in Amazonia: An assessment by diachronic approach. Agric. Ecosyst. Environ. 2017, 245, 63–73. [Google Scholar] [CrossRef]
  53. Rasse, D.P.; Rumpel, C.; Dignac, M.F. Is soil carbon mostly root carbon? Mechanisms for a specific stabilisation. Plant Soil 2005, 269, 341–356. [Google Scholar] [CrossRef]
  54. Guillaume, T.; Damaris, M.; Kuzyakov, Y. Losses of soil carbon by converting tropical forest to plantations: Erosion and decomposition estimated by delta(13) C. Glob. Chang. Biol. 2015, 21, 3548–3560. [Google Scholar] [CrossRef] [PubMed]
  55. Sharma, S.; MacKenzie, R.A.; Tieng, T.; Soben, K.; Tulyasuwan, N.; Resanond, A.; Blate, G.; Litton, C.M. The impacts of degradation, deforestation and restoration on mangrove ecosystem carbon stocks across Cambodia. Sci. Total Environ. 2020, 706, 135416. [Google Scholar] [CrossRef] [PubMed]
  56. Liu, X.; Ma, J.; Ma, Z.W.; Li, L.H. Soil nutrient contents and stoichiometry as affected by land-use in an agro-pastoral region of northwest China. Catena 2017, 150, 146–153. [Google Scholar] [CrossRef]
  57. Cao, Y.; Chen, Y. Ecosystem C:N:P stoichiometry and carbon storage in plantations and a secondary forest on the Loess Plateau, China. Ecol. Eng. 2017, 105, 125–132. [Google Scholar] [CrossRef]
  58. Fazhu, Z.; Jiao, S.; Chengjie, R.; Di, K.; Jian, D.; Xinhui, H.; Gaihe, Y.; Yongzhong, F.; Guangxin, R. Land use change influences soil C, N, and P stoichiometry under ‘Grain-to-Green Program’ in China. Sci. Rep. 2015, 5, 10195. [Google Scholar] [CrossRef] [Green Version]
  59. Han, Y.; Dong, S.; Zhao, Z.; Sha, W.; Li, S.; Shen, H.; Xiao, J.; Zhang, J.; Wu, X.; Jiang, X.; et al. Response of soil nutrients and stoichiometry to elevated nitrogen deposition in alpine grassland on the Qinghai-Tibetan Plateau. Geoderma 2019, 343, 263–268. [Google Scholar] [CrossRef]
  60. Lu, X.; Mao, Q.; Wang, Z.; Mori, T.; Mo, J.; Su, F.; Pang, Z. Long-Term Nitrogen Addition Decreases Soil Carbon Mineralization in an N-Rich Primary Tropical Forest. Forests 2021, 12, 734. [Google Scholar] [CrossRef]
  61. Su, L.; Du, H.; Zeng, F.; Peng, W.; Rizwan, M.; Nunez-Delgado, A.; Zhou, Y.; Song, T.; Wang, H. Soil and fine roots ecological stoichiometry in different vegetation restoration stages in a karst area, southwest China. J. Environ. Manag. 2019, 252, 109694. [Google Scholar] [CrossRef]
  62. Gärdenäs, A.I.; Agren, G.I.; Bird, J.A.; Clarholm, M.; Hallin, S.; Ineson, P.; Kätterer, T.; Knicker, H.; Nilsson, S.I.; Näsholm, T.; et al. Knowledge gaps in soil carbon and nitrogen interactions – From molecular to global scale. Soil Biol. Biochem. 2011, 43, 702–717. [Google Scholar] [CrossRef]
  63. Huang, W.J.; Zhou, G.Y.; Liu, J.X. Nitrogen and phosphorus status and their influence on aboveground production under increasing nitrogen deposition in three successional forests. Acta Oecol. 2012, 44, 20–27. [Google Scholar] [CrossRef]
Figure 1. Location of the study site in China. (a) China map content approval number GS (2016) 1550; (b) Jiangsu map content approval number GS (2019) 3266 (data source http://bzdt.ch.mnr.gov.cn/ 18 January 2022); and (c) Yellow Sea Forest Park map content.
Forests 13 00228 g001
Figure 2. Vertical variations of BD (a), soil porosity (b) and pH values (c) in different land-use types. The different lowercase letters indicate significant differences among planting systems for the same soil layer based on Duncan’s multiple comparison test at p < 0.05. P, poplar plantation system; P–W, wheat field system after deforestation of a poplar plantation; W, wheat field system.
Forests 13 00228 g002
Figure 3. Vertical variations of SOC (a), TN (b), TP (c) and TK (d) contents in different land-use types. The asterisks indicate significant differences among the three land-use types within the same soil layer, * p < 0.05, ** p < 0.01, and *** p < 0.001. P, poplar plantation system; P–W, wheat field system after deforestation of a poplar plantation; W, wheat field system.
Forests 13 00228 g003
Figure 4. Vertical variation of the C:N (a), C:P (b), N:P (c) and C:K (d) ratios for the different land-use types. The different lowercase letters indicate significant differences among the three land-use types within the same soil layer based on Duncan’s multiple comparison test at p < 0.05. P, poplar plantation system; P–W, wheat field system after deforestation of a poplar plantation; W, wheat field system.
Forests 13 00228 g004
Figure 5. Vertical variation of SOC stocks in different land-use types (a) and the proportion in each soil layer in the different land-use types (b). The different lowercase letters indicate significant differences among planting systems for the same soil layer based on Duncan’s multiple comparison test at p < 0.05. P, poplar plantation system; P–W, wheat field system after deforestation of a poplar plantation; W, wheat field system.
Forests 13 00228 g005
Figure 6. Relationships of the SOC content and BD (a), pH (b), TN (c), TP (d) and TK (e). P, poplar plantation system; P–W, wheat field system after deforestation of a poplar plantation; W, wheat field system.
Forests 13 00228 g006
Table 1. The analysis of variance of BD, soil porosity, pH, SOC, TN, TP, and TK contents affected by land-use type and soil depth.
BDSPpHSOCTNTPTK
F
PS21.34729.8356.247160.9009.09317.25830.634
S40.07862.55887.533259.613155.562110.7161.064
PS × S1.8421.7942.0792.7763.8593.3240.763
P
PS0.0000.0000.0050.0000.0010.0000.000
S0.0000.0000.0000.0000.0000.0000.391
PS × S0.1080.1180.0700.0200.0030.0080.637
Notes: BD, bulk density; SP, soil porosity; TN, total nitrogen; TP, total phosphorus; TK, total potassium; SOC, soil organic carbon; PS, planting system; S, soil depth.
Table 2. Analysis of variance results of the C:N, C:P, C:K, N:P ratios affected by land-use type and soil depth.
C:NC:PC:KN:P
F
PS67.42678.271113.4251.807
S7.65053.085146.77834.570
PS × S3.5270.5953.0605.573
P
PS0.0000.0000.0000.181
S0.0000.0000.0000.000
PS × S0.0050.7740.0120.000
Notes: PS, planting system; S, soil depth.
Publisher’s Note: MDPI stays neutral with regard to jurisdictional claims in published maps and institutional affiliations.

