Article

A Comparison of the Environmental Performance between Construction Materials and Operational Energy of Nearly Zero-Energy Wood-Based Educational Building

1
Department of Wood Processing and Biomaterials, Faculty of Forestry and Wood Sciences, Czech University of Life Sciences Prague, Kamýcká 129, 16500 Prague, Czech Republic
2
Department of Wood Structures, Faculty of Wood Sciences and Technology, Technical University in Zvolen, T. G. Masaryka 24, 96053 Zvolen, Slovakia
*
Author to whom correspondence should be addressed.
Forests 2022, 13(2), 220; https://doi.org/10.3390/f13020220
Submission received: 5 January 2022 / Revised: 26 January 2022 / Accepted: 28 January 2022 / Published: 1 February 2022
(This article belongs to the Section Wood Science and Forest Products)

Abstract

:
This paper focused on the environmental performance of a nearly zero-energy wood-based educational building (NZEB-W) via the life cycle impact assessment (LCIA). It identifies the environmental impacts of construction materials and operational energy demands of the NZEB-W and compares them using the SimaPro 8 software with the IMPACT 2002+ method. The LCIA results from NZEB-W show that the overall environmental impact of construction materials (98.9 Pt) and 45 years operational energy demands (98.6 Pt) will be at the same level. Its overall environmental impact 197.75 Pt for 45 years is relatively small. NZEB-W has the greatest impact on the environment in the category of damage respiratory inorganics (34.5%), 419 kg PM2.5 eq from construction materials, and 271 kg PM2.5 eq from operational energy for 45 years; follows global warming (31.7%), 1.98 × 10⁵ kg CO2 eq from construction materials, and 4.23 × 10⁵ kg CO2 eq from operational energy for 45 years; and non-renewable energy (21.8%), 2.82 × 10⁶ MJ primary from construction materials, and 3.73 × 10⁶ MJ primary from operational energy for 45 years. As this environmental assessment shows, the material composition of construction materials compared to the energy consumption in the use phase is an essential element for understanding the life cycle impact of buildings.

1. Introduction

Collectively, buildings in the EU are responsible for 40% of our energy consumption and 36% of greenhouse gas emissions, which mainly stem from construction, usage, renovation, and demolition. Therefore, improving energy efficiency in buildings has a key role to play in achieving the ambitious goal of carbon-neutrality by 2050, set out in the European Green Deal [1]. In Directive 2010/31/EU [2] are NZEBs, defined as buildings with a very high energy performance, where energy requirements should mostly be covered by renewable energy sources. There is a mandatory introduction in all member states of NZEB for all new buildings or those receiving a significant retrofit from 2020 (from 2018 for public buildings).
One of the methods evaluating the environmental impacts of human activities and identifying potential areas for improvement is the life cycle assessment—LCA [3,4]. This methodology is broadly applied in practice and provides a sound assessment to the understanding of environmental issues and buildings [5,6,7,8,9,10,11]. LCA provides a holistic approach that is based on studying the whole industrial system involved in the production, use, and waste management of a product or service [12].
Adalberth [12] proved conformity between energy use and environmental impact during the life cycle of buildings. In both aspects, the use stage constitutes a majority of the life cycle (approximately 85% of the total estimated energy use) and 70–90% of the total environmental impact arises in this stage. Since the distribution of energy use and the environmental impact over the life cycle have a similar pattern, the energy use of a building can be used as one indicator of a building’s environmental status. Moreover, the energy requirement of buildings is directly related to the technology of their construction and the type and amount of used construction materials [13,14]. Building operations worldwide account for 28% of energy-related greenhouse gas (GHG) emissions, which mainly come from the energy used for heating and/or cooling, hot water supply, ventilation and air conditioning, lighting, and process-related climate-relevant GHG emissions (i.e., the release of refrigerants and blowing agents) [15,16].
Reduction in environmental demands of the electricity production and the influence of climate change and the electricity mix are being increasingly studied [17,18,19,20].
Amongst a number of strategies to reduce energy consumption in buildings, nearly zero energy buildings (NZEB) have the potential to significantly reduce the energy they use while increasing the share of renewable resources [21,22]. Due to the findings of Hernandez and Kenny [23], the main energy consumption in a building is the energy for operation (heating, cooling, lighting, etc.), and they suggest that the amount of consumption can be regulated by technical innovations. However, it has not always been proven that the selected design choices are the most suitable from both an environmental and economic perspective [22,24].
Several studies have shown construction materials to be major contributors to environmental impacts for low energy buildings [25,26]. Each building has a unique structural composition consisting of individual elements forming a separate unit. Of course, all types of building materials have many specific technical [27,28,29] and environmental properties [7,30,31]. The life cycle impact assessment (LCIA) of buildings is therefore significantly influenced by the specific construction materials used for the construction. Takano et al. [32] showed that a building with a wood envelope has a better score on embodied GHG emissions and on carbon storage than an envelope made with concrete, steel, or brick. Hence, the life cycle of buildings is a complex system, since it involves the aggregate effects of a host of life cycles of their constituent materials, components, and assemblies [25,33,34,35]. Therefore, analysis of the environmental impact of particular structures may be helpful in selecting construction materials, with regard to the environmental performance of buildings in the early project phase [36].
In light of the above, the aim of this contribution is to evaluate the environmental performance of a nearly zero energy wood-based educational building (NZEB-W) via the LCIA, identify the environmental impacts of construction materials as well as the operational energy demands of the NZEB-W and compare them.

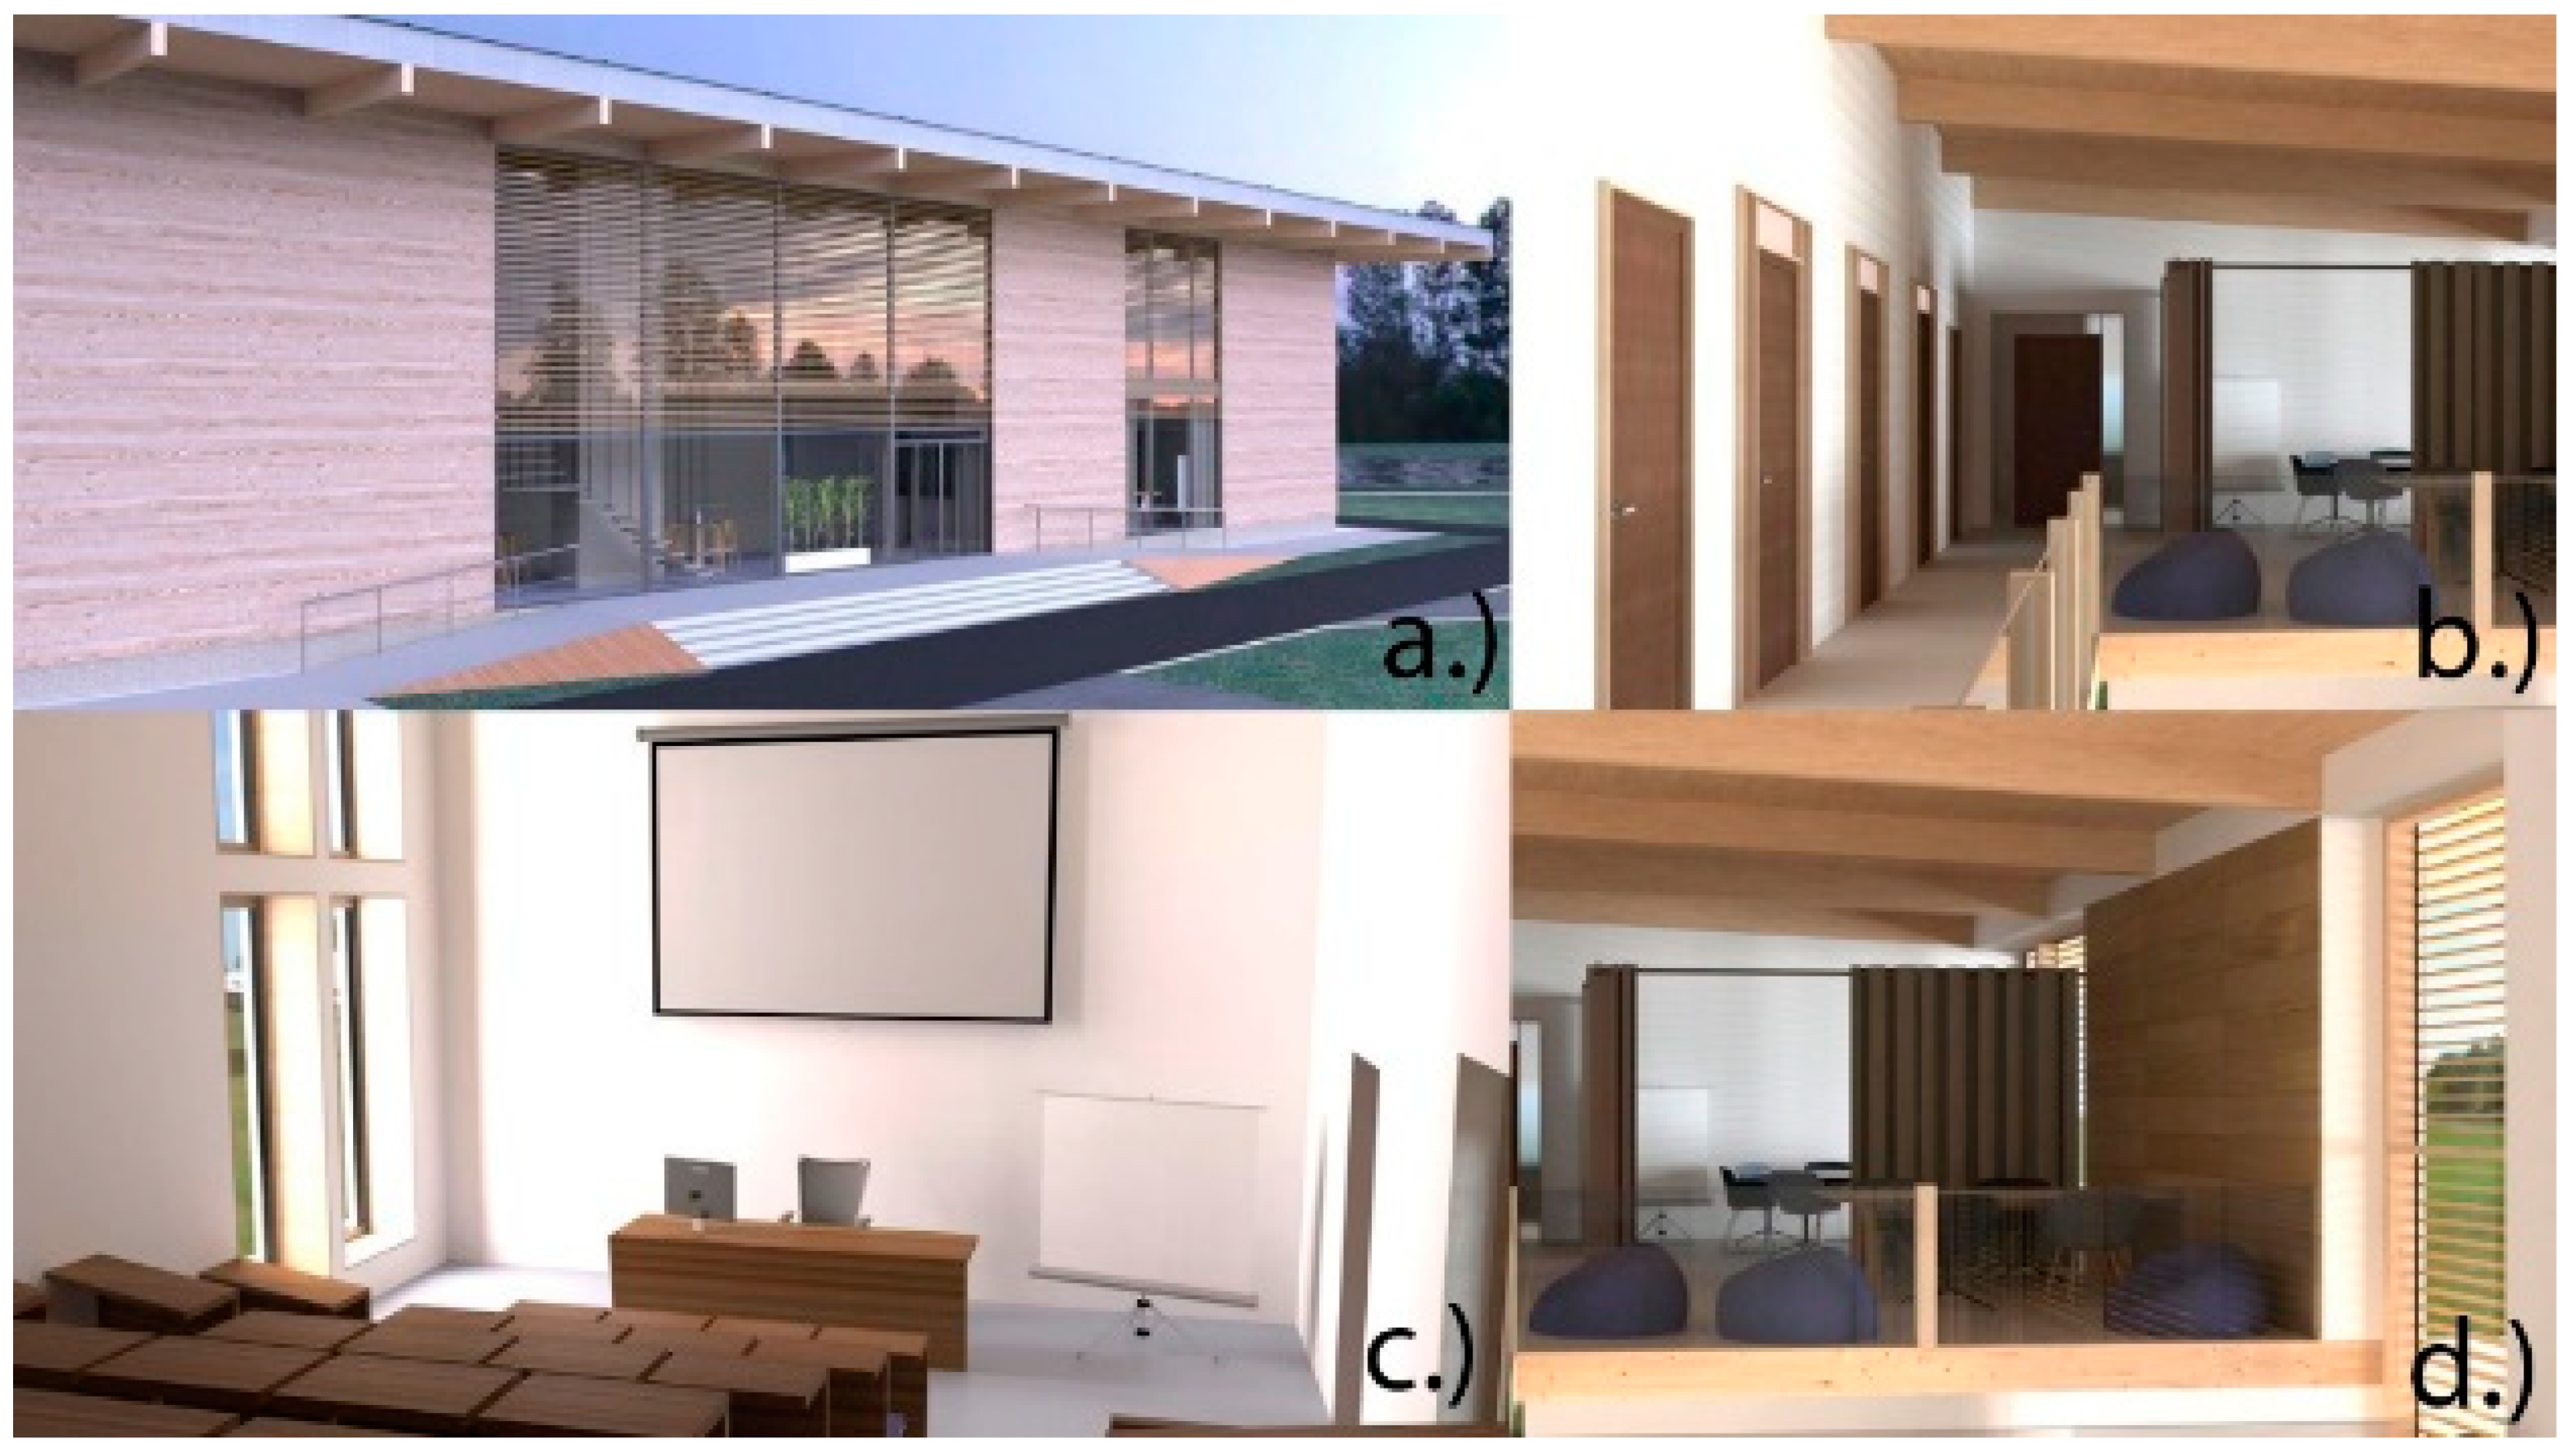
2. Materials and Methods

The system boundaries for LCIA [3,4] of the NZEB-W (Figure 1) are defined from cradle to the end of use with options [7], and activities included in the assessment were divided into construction materials (stage A1–A3), the energy required to operate the NZEB-W for 45 years (stage B6), and construction stage. Stages B1 to B5 and B7 were excluded from the assessment (Table 1).
NZEB-W is a two-story structure with a countertop roof, standing on a flat terrain without a basement, located in Zvolen, Slovakia (Central Europe). Actual location factors, solar radiation, and climatic elements that have a direct impact on the energy performance of the structure were taken into account in all calculations (technical, thermotechnical, and environmental). The ground plan is rectangular with a total area of 19.2 × 29.8 m and a 572.16 m2 built-up area. The supporting structure consists of wooden (OSB + solid wood column of spruce) box beams 400 × 80 mm, together with straw bale insulation with a bulk density ρ = 90 kg/m3. The foundations are on reinforced concrete feet. The floor above the terrain is formed by a beam construction with a double beam 150 × 300 mm in the 2000 mm module. Above this construction, the construction of a peripheral wall is also created with straw bale insulation (400 mm thick) and additional mineral insulation (50 mm thick). The construction of windows was designed to be made of A+ triple glazed windows. The proposed NZEB-W complies with the normalized value of the specific heat demand according to EN 73 0540 − 2 + Z1 + Z2 [37] and meets the assumption of achieving energy efficiency QN, EP < 40.7 kWh/(m2/year) [38]. Base building characteristics and operational energy needs of NZEB-W are listed in Table 2. Construction materials used and their distribution within the NZEB-W components are listed in Table 3.
The construction and thermal characteristics of the NZEB-W (Figure 1) were analyzed in detail by Mitterpach et al. [39] and use ultra-low energy building technologies with an intelligent operational management system.
Operational energy demands of NZEB-W (22,366.93 kWh/year) are linked to electricity consumption by the lighting (4926.82 kWh/year) and technical equipment (1478.05 kWh/year) of the building together with heating (11,415.07 kWh/year) and domestic hot water (4546.99 kWh/year). For lighting, the requirement of ≤9 kWh/m2 per year for the energy efficiency of buildings is met. This dataset uses electricity available on the low-voltage public network in the Slovak Republic. For technical equipment, the calculations included electricity consumed by the technical equipment of buildings (computers, vending machines, portable personal equipment, etc.). These values represent 30% of the need for electricity for lighting. The dataset used was the same as for lighting. For the calculation of the specific heat demand for heating, natural ventilation with heat recovery with a normative air exchange number of 0.5/h was considered. As a residential heating system, a detailed model of a wall-mounted natural gas condensing boiler was used with a maximum heat output of 14.9 kW. To produce domestic hot water, wood chips are used in a co-generation plant with a capacity of 6667 kW (referring to fuel input).
The SimaPro 9.0 database software [40] and the IMPACT 2002+ method [41] are used for LCIA. The dataset covers all relevant process steps and technologies over the supply chain of the represented cradle to gate inventory with good overall data quality [42].
For uncertainty analysis, we used a Monte Carlo simulation. Monte Carlo analysis was chosen because it offers fast capability and simplicity to produce probabilistic results and is the most common method. LCA software SimaPro has a built-in Monte Carlo simulation capability [38]. Parameter uncertainty was evaluated for 10,000 simulation runs and 95% confidence intervals of whole NZEB-W.

3. Results

A comparison of LCIA between the environmental damage of the construction materials and operational energy demands of NZEB-W (Figure 2) shows that the overall environmental impact of construction materials (98.9 Pt) and 45 years operational energy demands (98.6 Pt) will be at the same level.
Figure 3 presents the environmental impact comparison of construction materials and operational energy demands for 45 years of the NZEB-W; IMPACT2002+ method; midpoints single score Pt (Eco-indicator point). This comparison shows a different amount of influence on the individual impact categories (Figure 3, Table 4 and Table 5). The total negative impact of NZEB-W had the greatest impact on the environment in the category of damage respiratory inorganics (34.5%), 419 kg PM2.5 eq from construction materials and 271 kg PM2.5 eq from operational energy for 45 years; followed by global warming (31.7%), 1.98 × 10⁵ kg CO2 eq from construction materials and 4.23 × 10⁵ kg CO2 eq from operational energy for 45 years; and non-renewable energy (21.8%), 2.82 × 10⁶ MJ primary from construction materials and 3.73 × 10⁶ MJ primary from operational energy for 45 years. These first three impacts on the environment accounted for 88% of the total environmental impact.

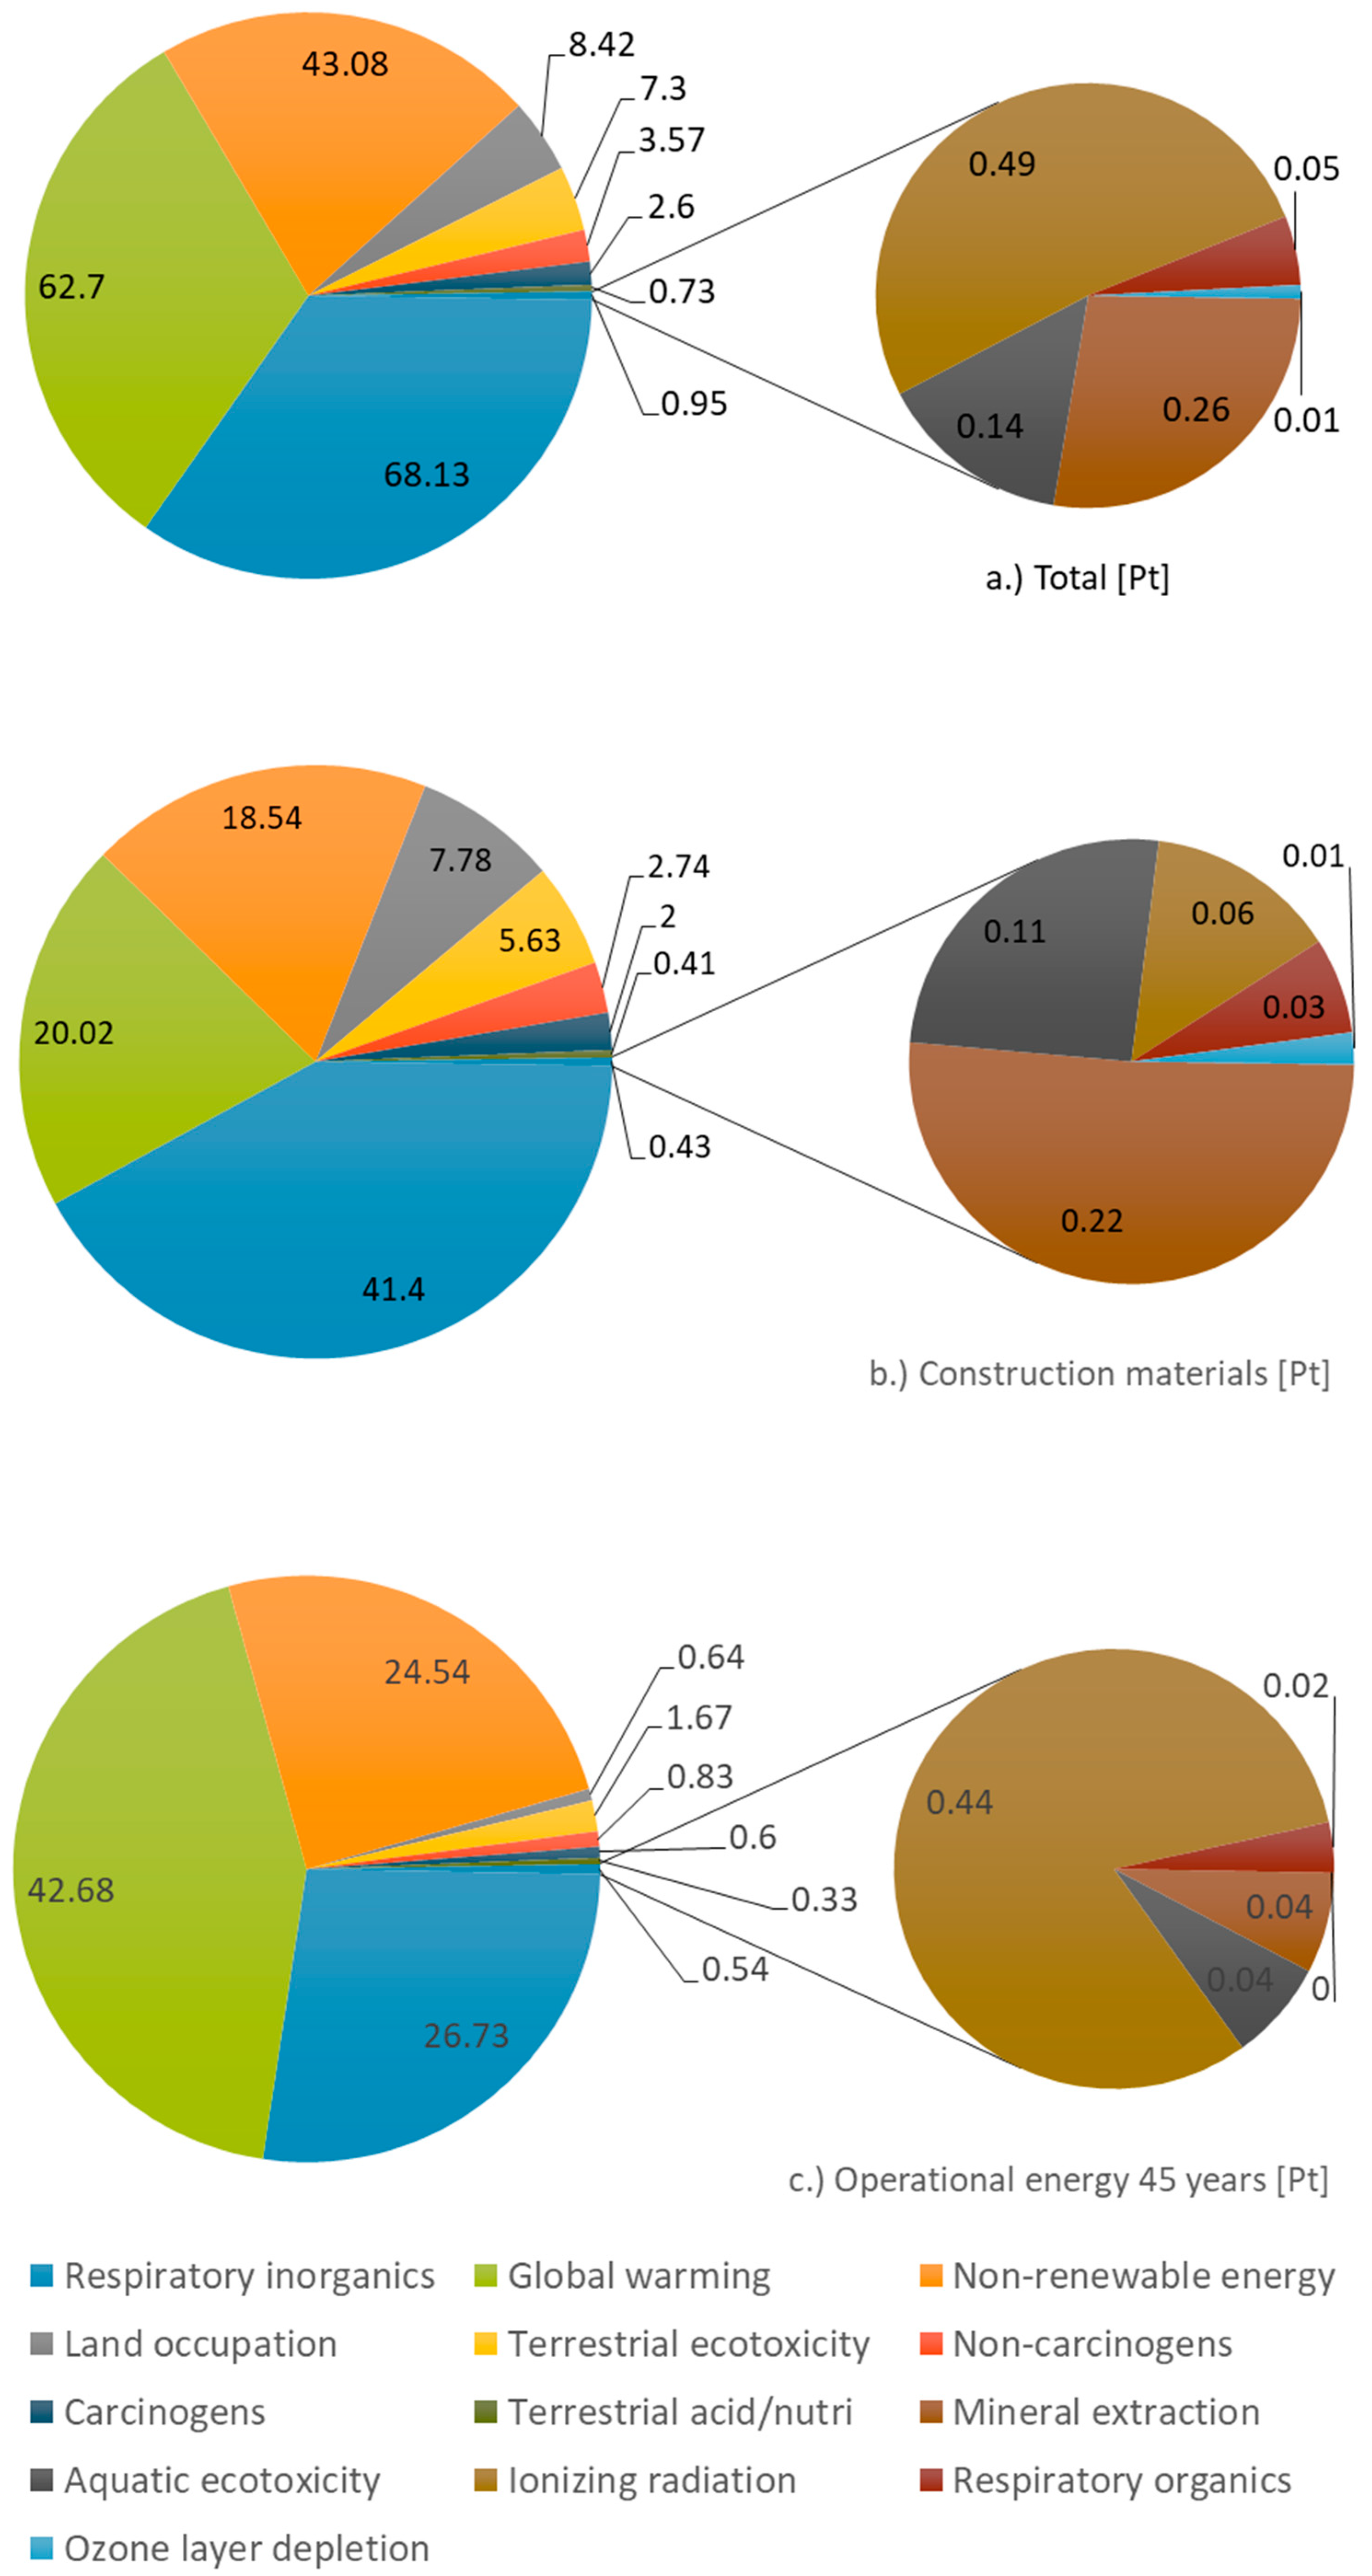
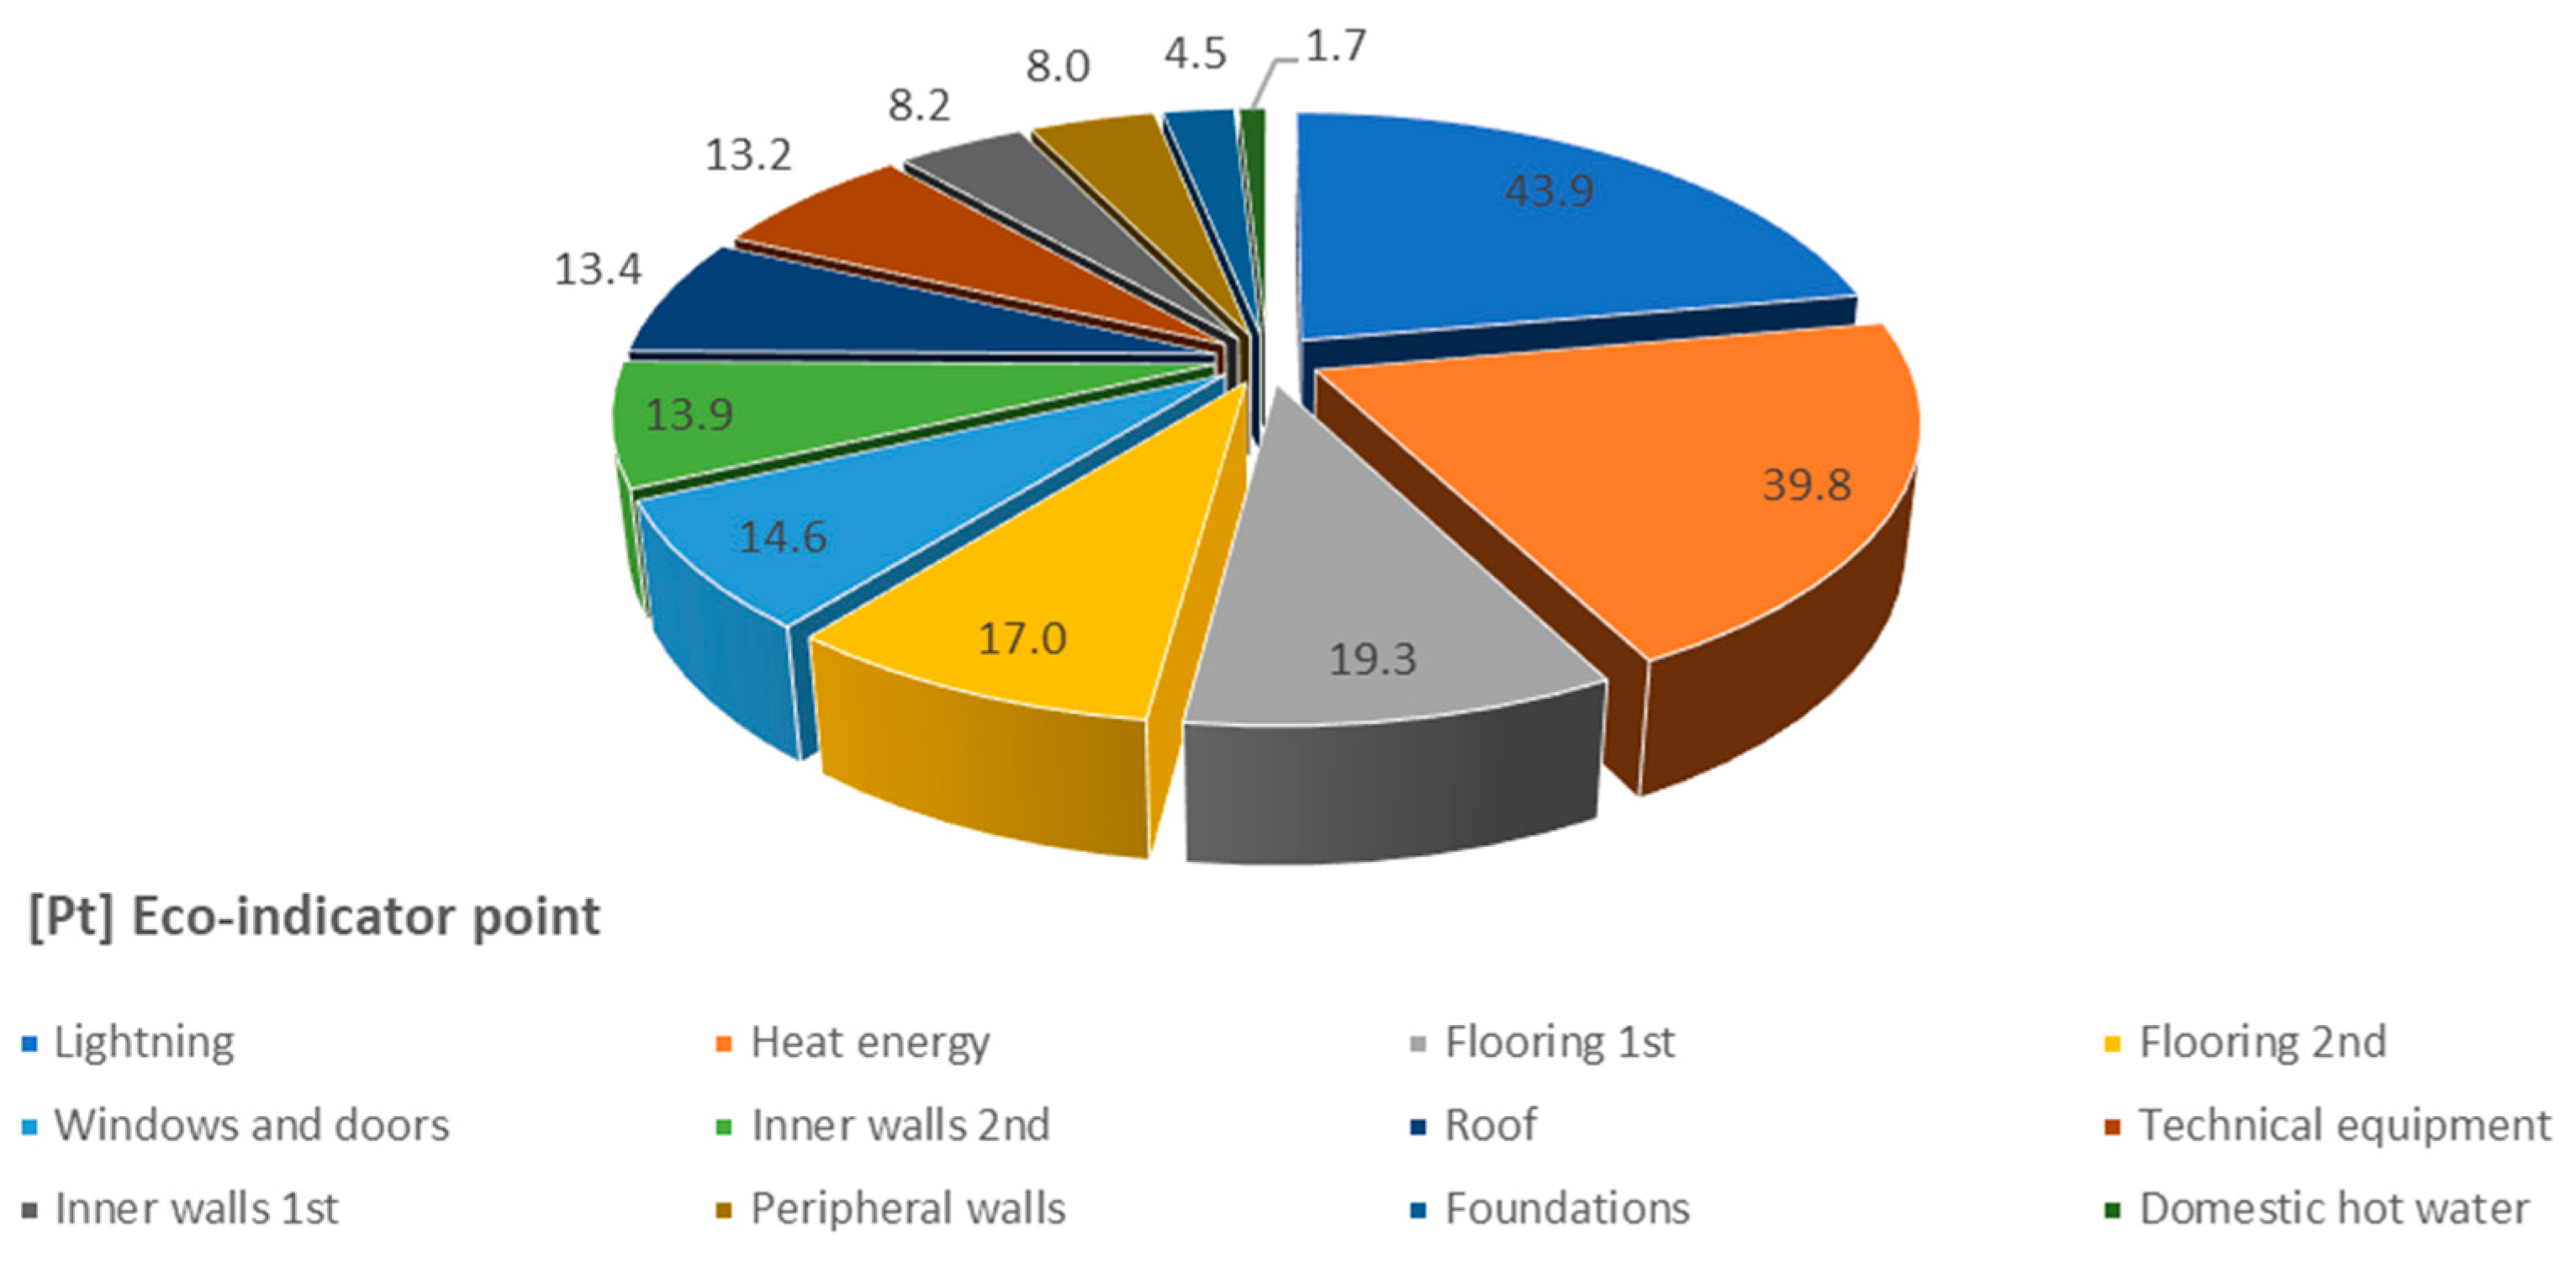
3.1. LCIA Construction Materials

The major negative impact of construction materials is presented by respiratory inorganics (41.40 Pt), followed by global warming (20.02 Pt), and non-renewable energy (18.54 Pt). The course of environmental damage from construction materials incorporated into structural units (Table 2) as well as damage from the composition of energy requirements (type of energy consumption) NZEB-W are shown in Figure 4 and Table 5.
The greatest damage of construction materials is caused by the first floor materials, second floor, and infill structures (windows and doors). For example, ceramic paving caused first floor flooring had the highest impact (15.8 Pt) among the construction elements mainly affecting respiratory inorganics (133 kg PM2.5 eq), global warming (1.00 × 10⁴ kg CO2 eq), and non-renewable energy (1.51 × 10⁵ MJ primary). The contribution of wood as a construction material is displayed in second floor flooring where 93.3% of weight came from CLT panel, which was also the second-highest value within the whole construction, representing 20.8% of the total weight. The total impact of CLT (9.76 Pt) was mainly in respiratory inorganics (33.2 kg PM2.5 eq), global warming (1.32 × 10⁴ kg CO2 eq), and non-renewable energy (2.01 × 10⁵ MJ primary). The third-largest contributors of the structural unit were windows (13.4 Pt) and doors (1.16 Pt), which had a relatively high impact due to the large glass filling area (non-renewable energy 7.08 × 10⁵ MJ primary; respiratory inorganics 43.4 kg PM2.5 eq; and global warming 3.58 × 10⁴ kg CO2 eq). For example, the influence of inner walls 2nd (13.9 Pt) is largely due to the most filling structures of glazed walls (80.3%). The roof also had a relatively high impact (13.4 Pt) caused by sheet metal roofing, which contained only 6.3% of the weight of the roof and 1% of the total weight of the building.
A whole building assessment was conducted by Tushar et al. [27] and research was conducted to find the contribution to environmental impacts for different building components (e.g., ceiling, wall, and floor) and to compare design options to find the most suitable materials for building components. For example, the most adverse effects of the four paving materials used were ceramic tiles, with an effect on global warming potential of 15,227 CO2 eq and the primary energy consumption of 255,896 MJ. As in our study (although the buildings were structured differently), floors and walls had the total greatest impact on both global warming potential and primary energy demand. However, a complete and conclusive comparison was not possible because the research used different evaluation methods and the buildings did not have completely comparable characteristics in common.
Najjar et al. [43] suggested a new proposal for a building and compared the potential reduction in energy consumption and environmental impacts. After calculating the quantities of construction materials, a simulation was made to measure the impact categories such as global warming potential. Global warming potential was from 4,537,449 kg CO2 equivalent to 2,934,501 kg CO2 equivalent, which corresponds to a decrease of 35.33%. Insights into the results show that all components of building envelopes affect the consumption of energy in buildings, however, exterior walls and windows account the most in these values. For example, Estokova et al. [44] showed that the overall environmental impacts of a residential house, on average, were represented by 220 kg CO2eq emissions for global warming and 1.03 kg SO2eq emissions for acidification potential. Related to 1 m2 of floor area, our NZEB-W reached higher values of 359.9 kg CO2eq and 12.216 kg SO2eq. These values should also not be simply compared with each other as the individual studies have different inventory bases and were compared with different evaluation methods.
Generally, embodied emissions of wood-based construction are generally less than conventional masonry constructions [45,46,47]. According to Vilčeková et al. [48], wooden log houses have a significantly lower negative impact on the environment compared to a wooden house, which is a combination of a wooden frame and other conventional materials. As is shown, the impact of wood constructions can also be influenced by other types of used construction materials.

3.2. LCIA Operational Energy

For the highest impact values of operational energy for 45 years, the global warming (42.68 Pt), followed by respiratory inorganics (26.73 Pt) and non-renewable energy (24.54 Pt) impact categories were responsible.
According to Fouquet et al. [25], NZEB introduces highly energy-efficient systems through renewable energy sources, reducing the energy demand together with adequate regulation of thermal insulation thickness. The results of our study proved the use stage environmental impact of energy-efficient buildings reached a balance in the 45th year of use. In this respect, construction materials are major contributors to environmental impact for low-energy buildings. It was also confirmed that the effects of electricity produced from renewable sources (production domestic hot water, wood chips in a cogeneration plant) had less environmental impacts (1.77%) than the energy used from the public grid (44.5% lighting and 13.4% technical equipment; the energy mix for Slovakia uses electricity mostly from brown coal, lignite combustion, and nuclear energy) and the production of heat from natural gas (40.3%; is the second non-renewable resource). The overall results showed that the highest negative impact connected with operational energy needs came from global warming (4.23 × 10⁵ kg CO2 eq), respiratory inorganics (271 kg PM2.5 eq), and non-renewable energy (3.73 × 10⁶ MJ primary). The main contributor to global warming remained heat from natural gas. Ionizing radiation is connected to the electricity consumption mix of Slovakia, which widely uses nuclear energy, and the impact on non-renewable energy is from brown coal combustion.
Rodrigues and Freire [49] confirmed that the use phase impacts are highly correlated with electricity use, so changes in the electricity mix may have a significant influence on the results. Pajchrowski et al. [14] stated that the main source of negative environmental impact in the life cycle of buildings is the energy consumption at the stage of long-term building use and the impact categories that are mainly influenced by the negative impact are as follows: respiratory inorganics, global warming, and non-renewable energy. Our study confirmed the substantial impact of these impact categories, but the magnitude of the impact was different. The sequences of construction materials were the same, unlike the 45th year of energy consumption where the order was altered to non-renewable energy, global warming, and respiratory inorganics, respectively (Table 4 and Table 5 and Figure 3 and Figure 4). From Luo and Chen’s [50] analysis, it can be seen that the total carbon emissions during the building use phase is the highest, and is the focus of reducing carbon emissions. The comparison in our study confirms this finding and specifies that for NZEB-W after the 45th year of using the building, the environmental impact of electricity consumption is higher than the environmental impact of the building materials. Röck et al. [51] showed a clear reduction trend in life cycle GHG emissions due to improved operational energy performance. The analysis revealed an increase in relative and absolute contributions of so-called ‘embodied’ GHG emissions. Due to the study, the average share of embodied GHG emissions from buildings, following the current energy performance regulations, was approximately 20–25% of life cycle GHG emissions, followed by 45–50% for highly energy-efficient buildings, and surpassed 90% in extreme cases. At the same time, the contribution of embodied GHG emissions increased up to and beyond a ratio of 1:1 (embodied:operational) when we considered a 50-year period. Our study confirmed the validity of these statements. Reduction in environmental demands of the electricity production and the influence of climate change and the electricity mix are being increasingly studied [17,18,19,20]. It is expected that electricity mixed with lower GHG intensity leads to a change in the most influential variables due to a reduction in use phase impacts [49,52].
Therefore, given the type of building, its overall environmental impact of 197.75 Pt (Respiratory inorganics 690 kg PM2.5 eq; Global warming 6.21 × 10⁵ kg CO2 eq; non-renewable energy 6.55 × 10⁶ MJ primary) is relatively small, and when comparing the environmental impacts of construction materials and up to 45 years of energy consumption, the environmental suitability of the construction materials as well as the energy efficiency of NZEB-W is indicated. If public policies requiring decreased energy demands in buildings are to be implemented, one can expect embodied loads in most buildings to become as relevant as (if not more than) operational loads [53].

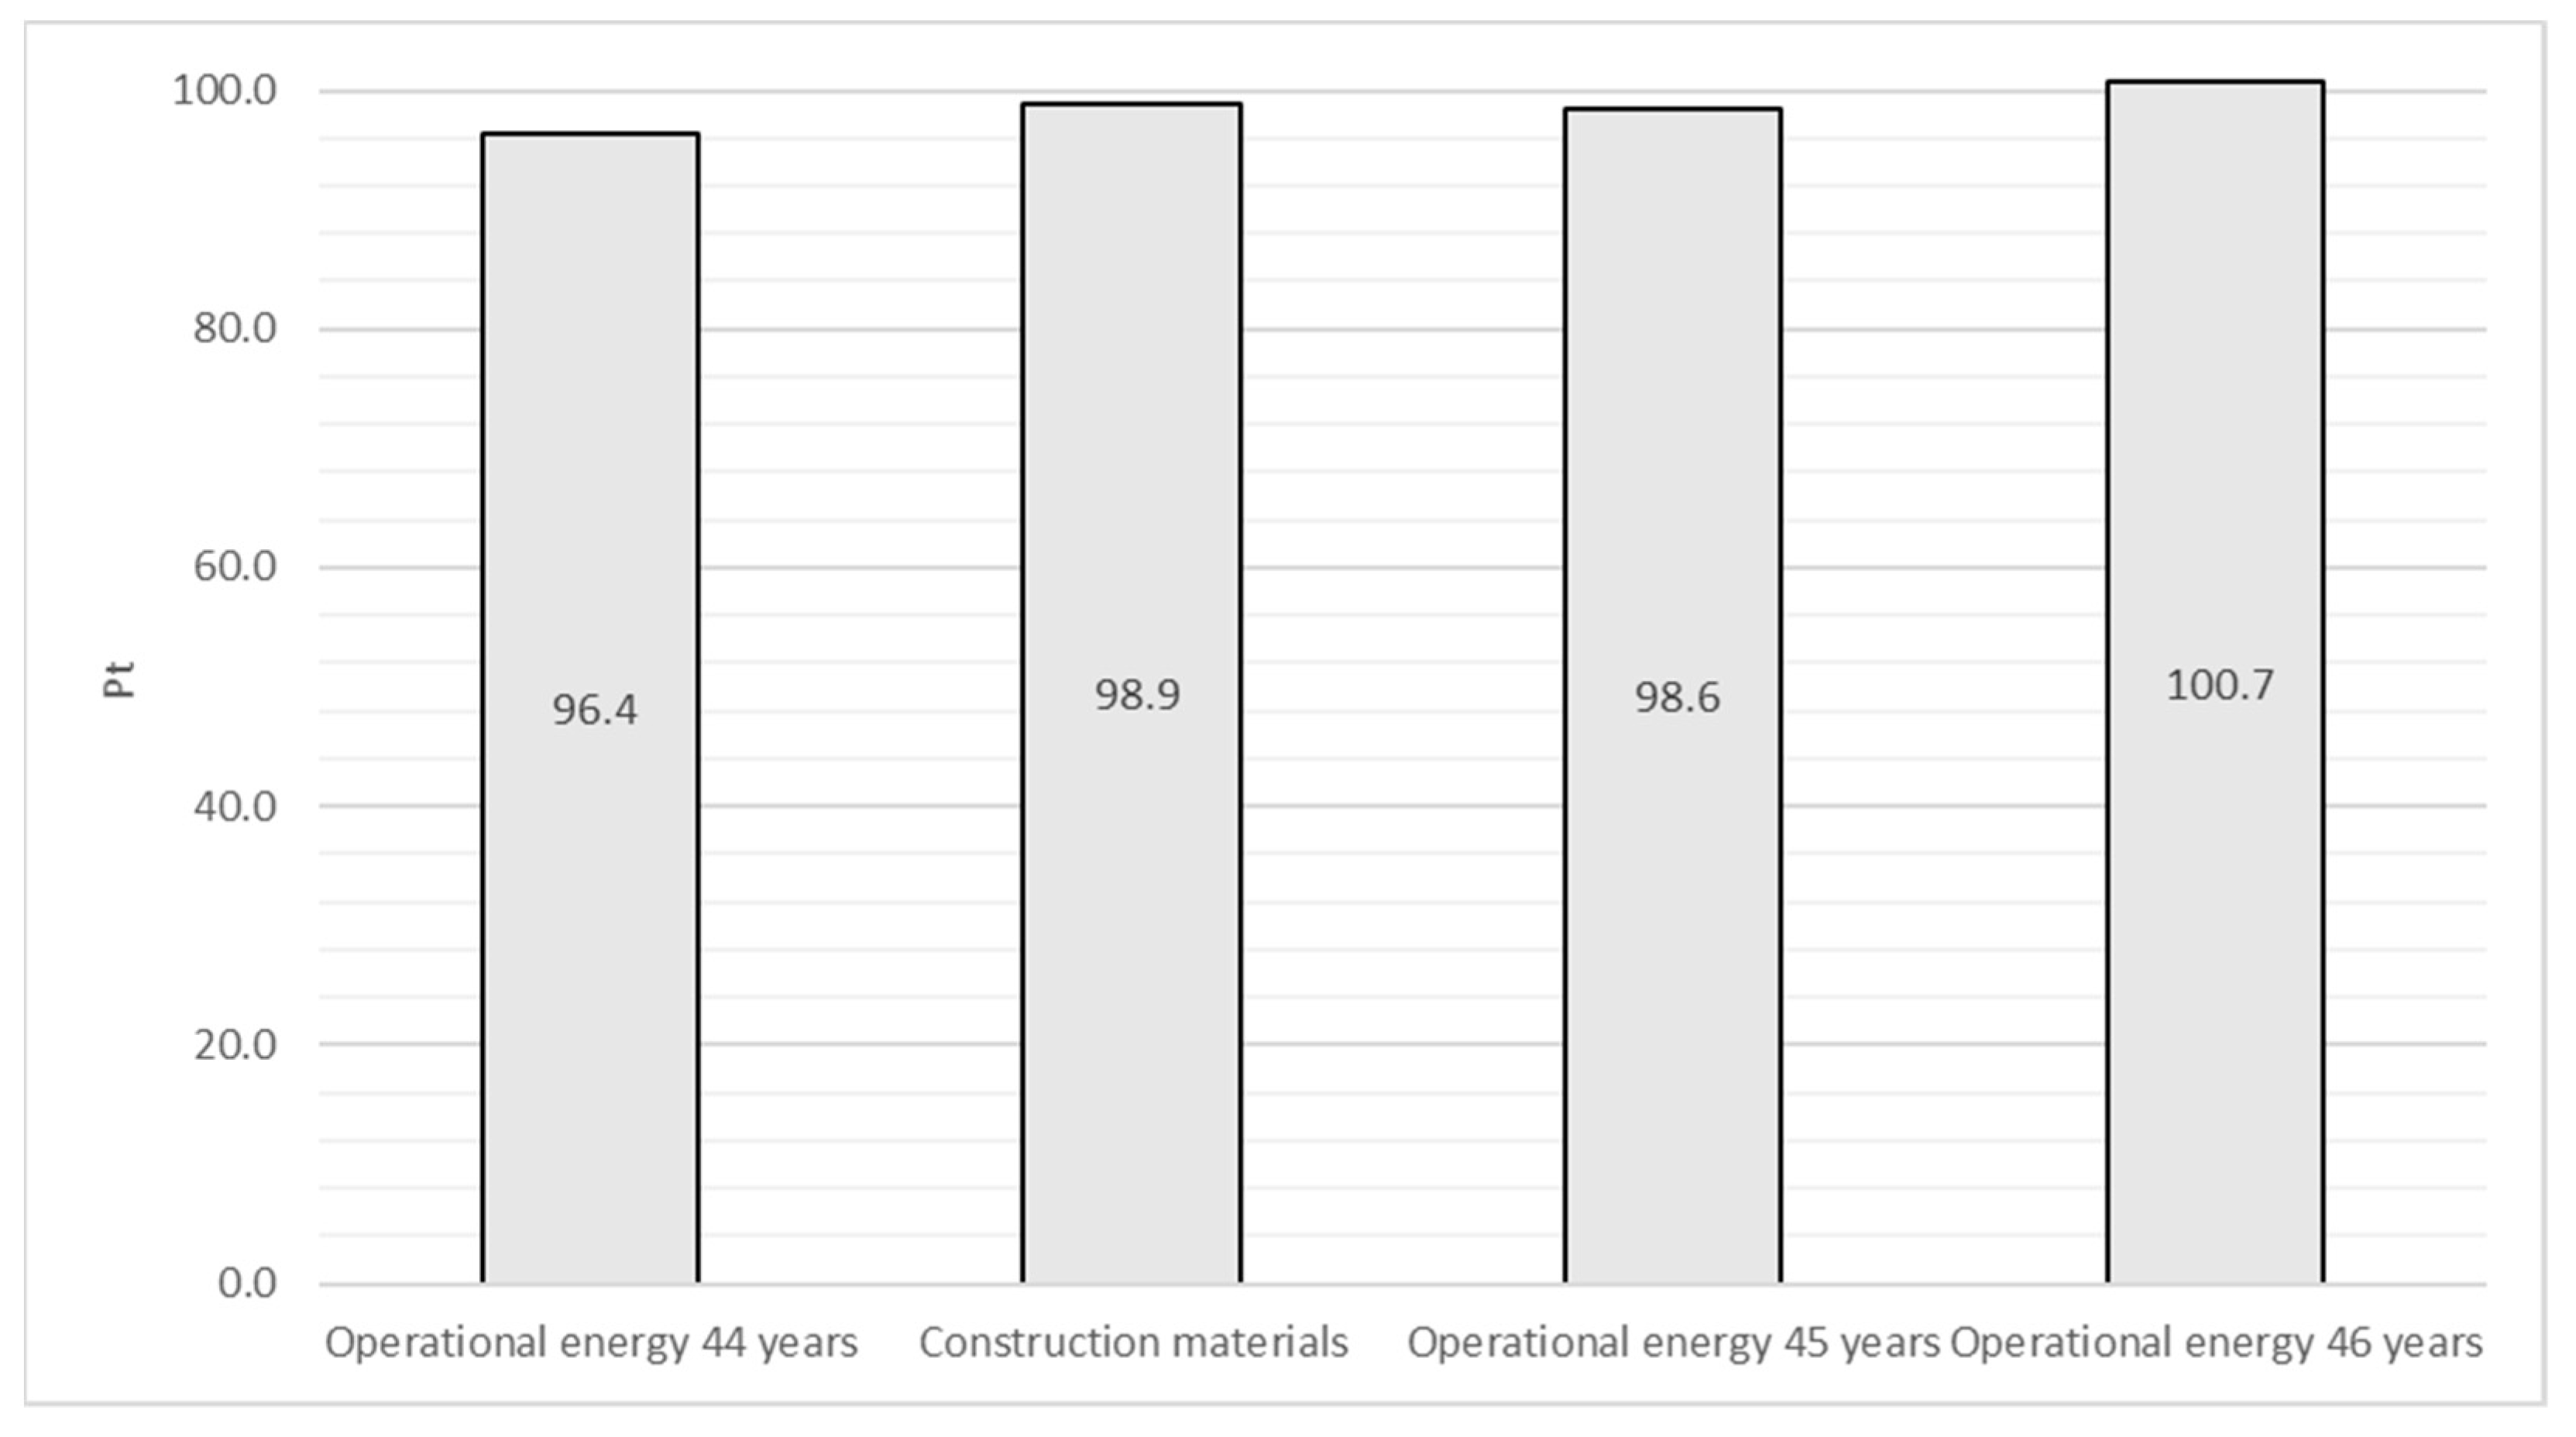
3.3. Lifespan of Building

According to Mequignon et al. [54], the lifespan of buildings has a significant impact on the environment. Safari and AzariJafari [55] state that most studies have shown that by focusing on the operational phase, which is the longest phase of a building’s life cycle, the greatest environmental impact reduction can be achieved and the lifetime of case studies in the literature ranges from 30 to 100 years. Our study further agrees with studies that declare that building materials contribute significantly to the environmental impacts of low-energy buildings [25,26], and a clear definition of the lifetime of buildings and materials should be an important upcoming topic for LCA in the field of buildings [56]. In relation to the above-mentioned information and in order to balance the environmental damage of construction materials and the energy performance of buildings, we propose that the building lifetime (BL) should be limited by the number of years “n” when the environmental damage of the construction materials (EDM) is approximately equal to the environmental damage of the energy needs of the building (EDE) for “n” years: BL = EDM ≈ n × EDE

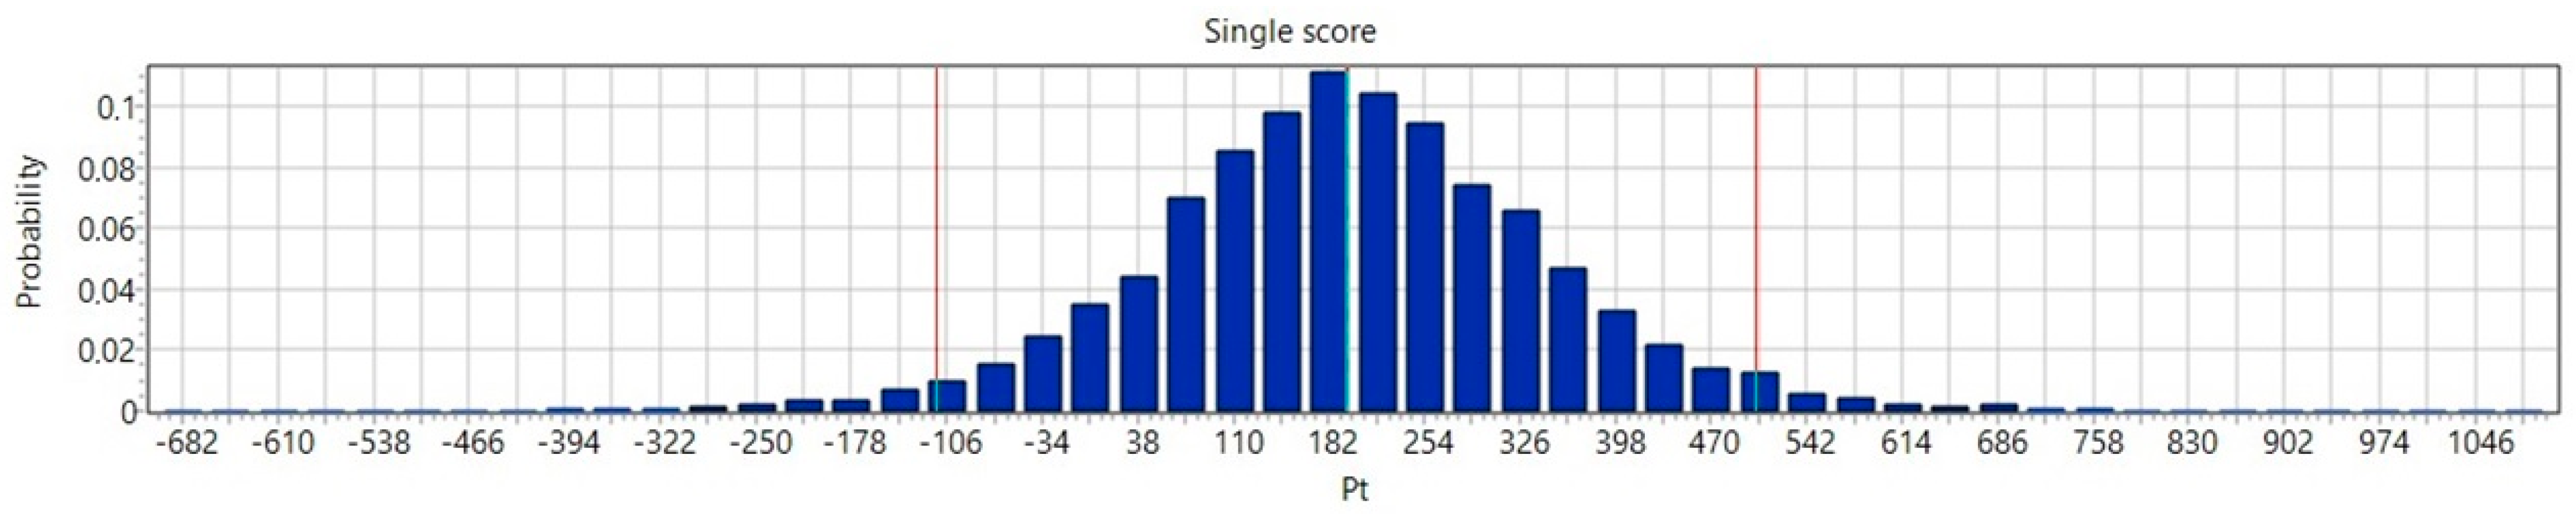
3.4. Uncertainty Analysis

Uncertainty analysis with a Monte Carlo simulation of the NZEB-W is presented in Figure 5 and Table 6. The results (10,000 simulation runs and 95% confidence intervals) show the details of all the interval variations including the mean, median values, standard error of mean (SEM), standard deviation (SD), and the coefficient of variability (CV).
A Monte Carlo simulation on a single score of whole NZEB-W showed a mean of 196.22, median of 193.70, SEM of 1.52, and CV of 77.66%. The major negative impacts were presented in a small CV by respiratory inorganics (CV 6.59%), followed by global warming (CV 2.05%), and non-renewable energy (CV 12.2%). These first three impacts on the environment accounted for 88% of the total environmental impact. Less significant impact categories with a high CV were caused by the uncertainties in the database for the energy country mix, or in the case of materials due to their uncertainty by acting primarily on aquatic ecotoxicity, terrestrial ecotoxicity, non-carcinogens, and ionizing radiation. Similar results were found, for example, by de Souza et al. [57], Robati et al. [58], and Hasan et al. [59].

3.5. Research Limitations

To compare the results of this work with others, it is important to be aware of the parameters that affect the results of the study, in particular, the different types of buildings and their location, functional units, system boundaries, depth of inventory analysis, type of databases used, chosen LCIA test method, and software used. There are many works, however, for example, Safari and AzariJafari [43] also reached these findings after a thorough study of the articles, where 50 articles were included for a comprehensive analysis and classification of the BIM-LCA integration methodology. Owsianiak et al. [60] and Stavropoulos et al. [61] showed that the single score resulting from each LCIA method cannot be directly compared with the other due to differences in characterization, normalization, and weighting factors used in each method. Alyaseri and Zhou [62] preferred to evaluate outcomes from different methods, where the impact or damage categories were used for comparison instead of a comparison based on single scores. From the article by Mitterpach et al. [63], there were also clearly different values of the results in the different methods used for LICA, although the trends of environmental damage were similar. Concerning the databases, the material sensitivity originated from the background data [56]. Sensitivity results found due to database variation are very much in line with the findings from Modahl et al. [64], which showed that using two datasets with different degrees of specificity implies substantial differences. The importance of sensitivity depending on the evaluation method was also confirmed by Röder et al. [65].
The results of this study are bound to a specific structure and region (central Slovakia). Hence, comparison with other buildings should be carried out with care, especially when comparing operational energy needs vastly bound to the energy consumption mix of a specific country. The system boundaries of this LCIA study considered only some phases of the life cycle according to Table 1. It is therefore necessary to take this fact into consideration when comparing the results with other works, with a recommendation to take into account the lifetime of buildings in future works in order to also point out reliable results within extended system boundaries.

4. Conclusions

The paper focused on and compared the environmental performance of an almost zero energy wood-based educational building (NZEB-W) through a life cycle impact assessment (LCIA). It identifies the environmental impacts of building materials and the operational energy intensity of NZEB-W.
Based on this analysis and the deeply studied research cited in this study, it was confirmed that each LCA study is unique in terms of functional unit, system boundaries, inventory analysis, and the content of the impact assessment method. The results of this LCA study assessing the environmental impacts of building materials and the energy performance of a building for wood-based teaching show that it is important to compare the environmental properties of the building materials used and the energy mix consumption. A comparison of the environmental damage of building materials with the energy intensity needs of the NZEB-W operation showed a different impact on individual categories of impacts, depending on the material composition and energy mix. The biggest negative impacts of this NZEB-W were respiratory inorganics, global warming, and non-renewable energy of the building materials and energy consumption. Environmental damage by building materials as well as “n” annual energy consumption represents a significant part of NZEB’s environmental impact and therefore the minimum lifetime of a building should be limited to a number of years when the environmental damage to building materials is approximately equal to the environmental damage caused by operational energy needs. Particular attention should be paid to the amount of cement, ceramic, and glass materials, the type of insulation and wood materials, and the amount and type of energy.
A comparison of the environmental damage of building materials with the energy intensity needs also indicated the environmental suitability of building materials as well as the energy efficiency of NZEB-W.
Regarding environmental damage and the above information, the material composition of building materials compared to energy consumption in the use phase is an essential element for understanding the complex life cycle impact of buildings.

Author Contributions

J.M.: Conceptualization, Methodology, Software, Validation, Formal Analysis, Resources, Data curation, Writing, Visualization; P.Š.: Project Administration, Funding Acquisition, Visualization; R.V.: Conceptualization, Validation, Investigation, Resources, Data curation, Writing; J.Š.: Supervision, Resources, Data curation, Project Administration, Funding Acquisition. All authors have read and agreed to the published version of the manuscript.

Funding

This research was funded by APVV-17-0206, Ultra-low-energy green buildings using wood as renewable raw material and EVA 4.0, Advanced research supporting the forestry and wood-processing sector’s adaptation to global change and the 4th industrial revolution (grant no. CZ.02.1.01/0.0/0.0/16_019/0000803) financed by OP RDE.

Data Availability Statement

Not applicable.

Conflicts of Interest

The authors declare no conflict of interest.

References

  1. European Commission. Energy Efficiency in Buildings. 2020. Available online: https://ec.europa.eu/info/news/focus-energy-efficiency-buildings-2020-feb-17_en (accessed on 1 January 2022).
  2. European Parliament, Council of the European Union. Directive 2010/31/EU of the European Parliament and of the Council of 19 May 2010 on the Energy Performance of Buildings. Available online: https://eur-lex.europa.eu/legal-content/EN/TXT/PDF/?uri=CELEX:32010L0031&from=EN (accessed on 1 January 2022).
  3. ISO 14040:2006; Environmental Management, Life Cycle Assessment-Principles and Framework; ISO: Geneva, Switzerland, 2006.
  4. ISO 14044:2006; Environmental Management, Life Cycle Assessment-Requirements and Guidelines; ISO: Geneva, Switzerland, 2006.
  5. CEN. EN 15978:2011; Sustainability of Construction Works—Assessment of Environmental Performance of Buildings—Calculation method; CEN: Brussels, Belgium, 2011. [Google Scholar]
  6. CEN. EN 15643:2021; Sustainability of Construction Works-Assessment of Buildings-General Framework; CEN: Brussels, Belgium, 2021. [Google Scholar]
  7. EN 15804+A2; Sustainability of Construction works-Environmental Product Declarations-Core Rules for the Product Category of Construction Products; CEN: Bruxelles, Belgium, 2013.
  8. ISO 15392; Sustainability in Building Construction-General Principles; ISO: Geneva, Switzerland, 2012.
  9. ISO 21929-1; Sustainability in Building Construction-Sustainability Indicators-Part 1: Framework for the Development of Indicators and a Core Set of Indicators for Buildings; ISO: Geneva, Switzerland, 2015.
  10. ISO 21930; Sustainability in Buildings and Civil Engineering Works-Core Rules for Environmental Product Declarations of Construction Products and Services; ISO: Geneva, Switzerland, 2018.
  11. ISO 21931-1; Sustainability in Building Construction-Framework for Methods of Assessment of the Environmental Performance of Construction Works-Part 1: Buildings; ISO: Geneva, Switzerland, 2015.
  12. Adalberth, K. Energy Use and Environmental Impact of New Residential Buildings; Byggnadsfysik LTH, Lunds Tekniska Högskola: Lund, Sweden, 2000; ISBN 91-88722-20-1. Available online: https://lucris.lub.lu.se/ws/files/4541413/8227876.pdf (accessed on 1 January 2022).
  13. Karimpour, M.; Belusko, M.; Xing, K.; Bruno, F. Minimising the life cycle energy of buildings: Review and analysis. Build. Environ. 2014, 73, 106–114. [Google Scholar] [CrossRef]
  14. Pajchrowski, G.; Noskowiak, A.; Lewandowska, A.; Strykowski, W. Materials composition or energy characteristic–What is more important in environmental life cycle of buildings? Build. Environ. 2014, 72, 15–27. [Google Scholar] [CrossRef]
  15. Goggins, J.; Moran, P.; Armstrong, A.; Hajdukiewicz, M. Life cycle environmental and economic performance of nearly zero energy buildings (NZEB) in Ireland. Energy Build. 2016, 116, 622–637. [Google Scholar] [CrossRef] [Green Version]
  16. Abergel, T.; Dean, B.; Dulac, J.; Hamilton, I.; Wheeler, T. Global Status Report-Towards a Zero-Emission, Efficient and Resilient Buildings and Construction Sector. Global Alliance for Buildings and Construction. 2018. Available online: https://www.worldgbc.org/sites/default/files/2018%20GlobalABC%20Global%20Status%20Report (accessed on 1 January 2022).
  17. Andrić, I.; Gomes, N.; Pina, A.; Ferrão, P.; Fournier, J.; Lacarrière, B.; Le Corre, O. Modeling the long-term effect of climate change on building heat demand: Case study on a district level. Energy Build. 2016, 126, 77–93. [Google Scholar] [CrossRef]
  18. Roux, C.; Schalbart, P.; Assoumou, E.; Peuportier, B. Integrating climate change and energy mix scenarios in LCA of buildings and districts. Appl. Energy 2016, 184, 619–629. [Google Scholar] [CrossRef]
  19. García-Gusano, D.; Garraín, D.; Dufour, J. Prospective life cycle assessment of the Spanish electricity production. Renew. Sustain. Energy Rev. 2017, 75, 21–34. [Google Scholar] [CrossRef]
  20. Kiss, B.; Kácsor, E.; Szalay, Z. Environmental assessment of future electricity mix–Linking an hourly economic model with LCA. J. Clean. Prod. 2020, 264, 121536. [Google Scholar] [CrossRef]
  21. Marszal, A.J.; Heiselberg, P. Life cycle cost analysis of a multi-storey residential Net Zero Energy Building in Denmark. Energy 2011, 36, 5600–5609. [Google Scholar] [CrossRef]
  22. Harkouss, F.; Fardoun, F.; Biwole, P.H. Multi-objective optimization methodology for net zero energy buildings. J. Build. Eng. 2018, 16, 57–71. [Google Scholar] [CrossRef]
  23. Hernandez, P.; Kenny, P. From net energy to zero energy buildings: Defining life cycle zero energy buildings (LC-ZEB). Energy Build. 2010, 42, 815–821. [Google Scholar] [CrossRef]
  24. D’Agostino, D.; Cuniberti, B.; Bertoldi, P. Energy consumption and efficiency technology measures in European non-residential buildings. Energy Build. 2017, 153, 72–86. [Google Scholar] [CrossRef]
  25. Fouquet, M.; Levasseur, A.; Margni, M.; Lebert, A.; Lasvaux, S.; Souyri, B.; Buhé, C.; Woloszyn, M. Methodological challenges and developments in LCA of low energy buildings: Application to biogenic carbon and global warming assessment. Build. Environ. 2015, 90, 51–59. [Google Scholar] [CrossRef]
  26. Bribián, I.Z.; Usón, A.A.; Scarpellini, S. Life cycle assessment in buildings: State-of-the-art and simplified LCA methodology as a complement for building certification. Build. Environ. 2009, 44, 2510–2520. [Google Scholar] [CrossRef]
  27. Mao-Qing, C.; Ting-Ting, L.; Yu-Hang, Z.; Jin-Cheng, S.; Mao-Sheng, C. Developing electromagnetic functional materials for green building. J. Build. Eng. 2022, 45, 103496. [Google Scholar] [CrossRef]
  28. Terzopoulou, P.; Kamperidou, V. Utilization of wooden biomass chemical components in bio-plastics production. Pro Ligno 2019, 15, 306–313. Available online: https://www.cabdirect.org/cabdirect/abstract/20203177421 (accessed on 1 January 2022).
  29. Tudor, E.M.; Dettendorfer, A.; Kain, G.; Barbu, M.C.; Réh, R.; Krišťák, Ľ. Sound-Absorption Coefficient of Bark-Based Insulation Panels. Polymers 2020, 12, 1012. [Google Scholar] [CrossRef]
  30. Jianjun, Z.; Shuang, L. Life cycle cost assessment and multi-criteria decision analysis of environment-friendly building insulation materials-A review. Energy Build. 2022, 254, 111582. [Google Scholar] [CrossRef]
  31. Rabbat, C.; Awad, S.; Villot, A.; Rollet, D.; Andrès, Y. Sustainability of biomass-based insulation materials in buildings: Current status in France, end-of-life projections and energy recovery potentials. Renew. Sustain. Energy Rev. 2022, 156, 111962. [Google Scholar] [CrossRef]
  32. Takano, A.; Hughes, M.; Winter, S. A multidisciplinary approach to sustainable building material selection: A case study in a Finnish context. Build. Environ. 2014, 82, 526–535. [Google Scholar] [CrossRef]
  33. Cole, R.J.; Kernan, P.C. Life-cycle energy use in office buildings. Build. Environ. 1996, 31, 307–317. [Google Scholar] [CrossRef]
  34. Finnveden, G.; Hauschild, M.Z.; Ekvall, T.; Guinée, J.; Heijungs, R.; Hellweg, S.; Koehler, A.; Pennington, D.; Suh, S. Recent developments in Life Cycle Assessment. J. Environ. Manag. 2009, 91, 1–21. [Google Scholar] [CrossRef] [PubMed]
  35. Safi, B.; Sebki, G.; Chahour, K. Recycling of Foundry Sand Wastes in Self-Compacting Mortars: Use as Cementitious Materials and Fine Aggregates. J. App. Eng. Sci. 2019, 9, 195–200. [Google Scholar] [CrossRef] [Green Version]
  36. Ondova, M.; Estokova, A. Environmental impact assessment of building foundation in masonry family houses related to the total used building materials. Environ. Prog. Sustain. Energy 2016, 35, 1113–1120. [Google Scholar] [CrossRef]
  37. STN EN 73 0540-2+Z1+Z2; Thermal Protection of Buildings. Thermal Performance of Buildings and Components. Part 2: Functional Requirements; Slovak Office of Standards: Bratislava, Slovakia, 2019.
  38. Ministry of Transport, Construction and Regional Development of the Slovak Republic. Ministerial Decree No. 364/2012 Coll. of 12th November 2012, Which Implements the Act No. 555/2005 Coll. on the Energy Performance of Buildings and on the Amendments to Certain Laws, as Amended. Available online: https://www.slov-lex.sk/pravne-predpisy/SK/ZZ/2012/364/ (accessed on 1 January 2022).
  39. Mitterpach, J.; Ileckova, R.; Stefko, J. Life cycle impact assessment of construction materials of a wood-based building in an environmental context. Acta Fac. Xylologiae Zvolen 2018, 60, 147–157. [Google Scholar] [CrossRef]
  40. PRé Consultants, SimaPro. Sustainability Software for Fact-Based Decisions, Introduction to LCA with SimaPro 2019. Available online: https://pre-sustainability.com/solutions/tools/simapro/ (accessed on 1 June 2021).
  41. Jolliet, O.; Margni, M.; Charles, R.; Humbert, S.; Payet, J.; Rebitzer, G.; Rosenbaum, R. IMPACT 2002+: A new life cycle assessment methodology. Int. J. Life Cycle Assess. 2003, 8, 324–330. [Google Scholar] [CrossRef] [Green Version]
  42. Ecoinvent.org. Available online: https://www.ecoinvent.org/database/database.html (accessed on 1 June 2021).
  43. Najjar, M.; Figueiredo, K.; Hammad, A.W.A.; Haddad, A. Integrated optimization with building information modeling and life cycle assessment for generating energy efficient buildings. Appl. Energy 2019, 250, 1366–1382. [Google Scholar] [CrossRef]
  44. Estokova, A.; Vilcekova, S.; Porhincak, M. Analyzing Embodied Energy, Global Warming and Acidification Potentials of Materials in Residential Buildings. Procedia Eng. 2017, 180, 1675–1683. [Google Scholar] [CrossRef]
  45. Cabeza, L.F.; Barreneche, C.; Miró, L.; Morera, J.M.; Bartolí, E.; Fernández, I.A. Low carbon and low embodied energy materials in buildings: A review. Renew. Sustain. Energy Rev. 2013, 23, 536–542. [Google Scholar] [CrossRef]
  46. Hafner, A.; Schäfer, S. Comparative LCA study of different timber and mineral buildings and calculation method for substitution factors on building level. J. Clean. Prod. 2017, 167, 630–642. [Google Scholar] [CrossRef]
  47. Petrovic, B.; Myhren, J.A.; Zhang, X.; Wallhagen, M.; Eriksson, O. Life cycle assessment of a wooden single-family house in Sweden. Appl. Energy 2019, 251, 113253. [Google Scholar] [CrossRef]
  48. Vilčeková, S.; Harčárová, K.; Moňoková, A.; Burdová, E.K. Life Cycle Assessment and Indoor Environmental Quality of Wooden Family Houses. Sustainability 2020, 12, 10557. [Google Scholar] [CrossRef]
  49. Carla Rodrigues, C.; Freire, F. Environmental impacts and costs of residential building retrofits—What matters? Sustain. Cities Soc. 2021, 67, 102733. [Google Scholar] [CrossRef]
  50. Luo, L.; Chen, Y. Carbon emission energy management analysis of LCA-Based fabricated building construction. Sustain. Comput. Inform. Syst. 2020, 27, 100405. [Google Scholar] [CrossRef]
  51. Röck, M.; Saade, M.R.M.; Balouktsi, M.; Rasmussen, F.N.; Birgisdottir, H.; Frischknecht, R.; Habert, G.; Lützkendorf, T.; Passer, A. Embodied GHG emissions of buildings–The hidden challenge for effective climate change mitigation. Appl. Energy 2020, 258, 114107. [Google Scholar] [CrossRef]
  52. Belucio, M.; Rodrigues, C.; Antunes, C.H.; Freire, F.; Dias, L.C. Eco-efficiency in early design decisions: A multimethodology approach. J. Clean. Prod. 2021, 283, 124630. [Google Scholar] [CrossRef]
  53. Saade, M.R.M.; Guest, G.; Amor, B. Comparative whole building LCAs: How far are our expectations from the documented evidence? Build. Environ. 2020, 167, 106449. [Google Scholar] [CrossRef]
  54. Mequignon, M.; Ait Haddou, H.; Thellier, F.; Bonhomme, M. Greenhouse gases and building lifetimes. Build. Environ. 2013, 68, 77–86. [Google Scholar] [CrossRef]
  55. Safari, K.; AzariJafari, H. Challenges and opportunities for integrating BIM and LCA: Methodological choices and framework development. Sustain. Cities Soc. 2021, 67, 102728. [Google Scholar] [CrossRef]
  56. Häfliger, I.F.; John, V.; Passer, A.; Lasvaux, S.; Hoxha, E.; Saade, R.M.R.; Habert, G. Buildings environmental impacts’ sensitivity related to LCA modelling choices of construction materials. J. Clean. Prod. 2017, 156, 805–816. [Google Scholar] [CrossRef] [Green Version]
  57. de Souza, D.M.; Lafontaine, M.; Charron-Doucet, F.; Bengoa, X.; Chappert, B.; Duarte, F.; Lima, L. Comparative Life Cycle Assessment of ceramic versus concrete roof tiles in the Brazilian context. J. Clean. Prod. 2015, 89, 165–173. [Google Scholar] [CrossRef]
  58. Robati, M.; Daly, D.; Kokogiannakis, G. A method of uncertainty analysis for whole-life embodied carbon emissions (CO2-e) of building materials of a net-zero energy building in Australia. J. Clean. Prod. 2019, 225, 541–553. [Google Scholar] [CrossRef]
  59. Hasan, U.; Whyte, A.; Al Jassmi, H. Life cycle assessment of roadworks in United Arab Emirates: Recycled construction waste, reclaimed asphalt pavement, warm-mix asphalt and blast furnace slag use against traditional approach. J. Clean. Prod. 2020, 257, 120531. [Google Scholar] [CrossRef]
  60. Owsianiak, M.; Laurent, A.; Bjørn, A.; Hauschild, M.Z. IMPACT 2002+, ReCiPe 2008 and ILCD’s recommended practice for characterization modelling in life cycle impact assessment: A case study-based comparison. Int. J. Life Cycle Assess. 2014, 19, 1007–1021. [Google Scholar] [CrossRef]
  61. Stavropoulos, P.; Giannoulis, C.; Papacharalampopoulos, A.; Foteinopoulos, P.; Chryssolouris, G. Life cycle analysis: Comparison between different methods and optimization challenges. Procedia CIRP 2016, 41, 626–631. [Google Scholar] [CrossRef] [Green Version]
  62. Alyaseri, I.; Zhou, J. Handling uncertainties inherited in life cycle inventory and life cycle impact assessment method for improved life cycle assessment of wastewater sludge treatment. Heliyon 2015, 5, e02793. [Google Scholar] [CrossRef]
  63. Mitterpach, J.; Hroncová, E.; Ladomerský, J.; Štefko, J. Quantification of Improvement in Environmental Quality for Old Residential Buildings Using Life Cycle Assessment. Sustainability 2016, 8, 1303. [Google Scholar] [CrossRef] [Green Version]
  64. Modahl, I.S.; Askham, C.; Lyng, K.A.; Skjerve-Nielssen, C.; Nereng, G. Comparison of two versions of an EPD, using generic and specific data for the foreground system, and some methodological implications. Int. J. Life Cycle Assess. 2013, 18, 241–251. [Google Scholar] [CrossRef]
  65. Röder, M.; Whittaker, C.; Thornley, P. How certain are greenhouse gas reductions from bioenergy? Life cycle assessment and uncertainty analysis of wood pellet-to-electricity supply chains from forest residues. Biomass Bioenergy 2014, 79, 50–63. [Google Scholar] [CrossRef]
Figure 1. Visualization of the NZEB-W: (a) exterior, (b) interior, (c) classroom, and (d) relaxation area.
Forests 13 00220 g001
Figure 2. Environmental impact comparison of the construction materials and operational energy demands for 44, 45, and 46 years of the NZEB-W; IMPACT2002+ method; single score Pt (Eco-indicator point).
Forests 13 00220 g002
Figure 3. Environmental impact comparison of construction materials and operational energy demands for 45 years of the NZEB-W; IMPACT2002+ method; midpoints single score Pt (Eco-indicator point).
Forests 13 00220 g003
Figure 4. Environmental impact comparison of the construction materials and operational energy demands for 45 years (lightning, heat energy, technical equipment, domestic hot water) of the NZEB-W in structural unit; IMPACT2002+ method; single score Pt (Eco-indicator point).
Forests 13 00220 g004
Figure 5. Uncertainty analysis of NZEB-W, method IMPACT 2002+, single score, confidence interval: 95%.
Forests 13 00220 g005
Table 1. NZEB-W life cycle system boundaries.
Product stageRaw material supplyA1included
Transport to manufacturerA2included
ManufacturingA3included
Construction stageTransport to construction site and transport on siteA4excluded
Construction and installation processA5excluded
Use stageUseB1excluded
MaintenanceB2excluded
RepairB3excluded
ReplacementB4excluded
RefurbishmentB5excluded
Operational energy useB6included
Operational water useB7excluded
End of life stageDeconstruction and demolitionC1excluded
TransportC2excluded
Waste processing for reuse, recovery or recyclingC3excluded
Waste disposalC4excluded
Benefits and loads beyond the system boundariesReuse, Recovery, Recycling potentialDexcluded
Table 2. Characteristics of the NZEB-W.
Built-up area572.16 m2
Heated area528.72 m2
Heated volume1679.05 m3
Floor area 550.23 m2
Load-bearing walls122.5 m2
Partitions267.4 m2
Window area121.15 m2
Door area23 m2
Lightning area544.4 m2
Electricity consumption for lightning9.05 kWh /m2/year
Lightning *4926.82 kWh/year *
Electricity consumption for technical equipment1478.05 kWh/year
Energy consumption for hot water preparation8.60 kWh/m2/year
Energy consumption for heating21.59 kWh/m2/year
* 114 × LED tube 16 W, 38 × LED tube 8 W.
Table 3. List of construction materials and their distribution into structural units of NZEB-W, OSB—oriented strand board, HDF—high-density fiberboard, CLT—cross-laminated timber, GLT—glued-laminated timber, PU—polyurethane.
Structural UnitsSubtitlem3kg/m3kg
FoundationConcrete C 20/2530225067,500
Rolled steel 4 mm thick0.19278501507.2
Solid wood Spruce C2415.1744206373.08
Flooring—1st floorHDF fiberboard7.776004662
Box beam Spruce short1.55420650.64
Box beam OSB short1.15550631.14
Box beam Spruce long2.09420876.19
Box beam OSB long1.55550849.92
Straw insulation108.98909808.56
Grate Spruce0.84420354.06
Isover DOMO28.981203477.60
Flex glue4.6416007418.88
Ceramic paving6.96200013,910.40
Exterior stairs0.35420145.15
Flooring—2nd floorCLT board104.3347049,034.16
Epoxy resin1.1617502028.60
Ceramic paving0.342000686.88
Paving BK2.16380821.94
Peripheral walls—1st floorFacade cladding Larch3.065501684.38
Grate Spruce1.18420493.92
HDF fiberboard1.846001102.50
Box beam Spruce2.574201079.57
Box beam OSB1.90420799.68
Straw insulation49904410
CLT board12.254705757.50
PU lacquer0.0695058.19
Inner walls—1st floorCLT board14.424706777.40
Glazed walls0.342600891.80
GLT columns7.874203306.24
Ceiling beamsGLT5.034202112.08
Inner walls—2nd floorCLT board12.324705790.45
Glazed walls0.7826002022.12
GLT columns6.744202830.46
RoofRoof beams GLT15.984206713.28
Cement board4.1213005359.58
Isover plus19.241302501.14
Box beam Spruce5.244202199.96
Box beam OSB3.885502134
Straw insulation109.94909894.60
HDF fiberboard8.966005374.56
Grate Spruce4.594201923.37
OSB III board14.285507856.4
Folded sheet metal roofing0.3271402308.53
Table 4. Environmental impact comparison of the construction materials and operational energy demands for 45 years of the NZEB-W; IMPACT2002+ method; midpoints characterization.
Impact CategoryUnitTotalConstruction MaterialsOperational Energy 45 Years
Respiratory inorganicskg PM2.5 eq6.90 × 1024.19 × 1022.71 × 102
Global warmingkg CO2 eq6.21 × 1051.98 × 1054.23 × 105
Non-renewable energyMJ primary6.55 × 1062.82 × 1063.73 × 106
Land occupationm2org.arable1.06 × 1059.78 × 1048.03 × 103
Terrestrial ecotoxicitykg TEG soil1.26 × 1079.75 × 1062.89 × 106
Non-carcinogenskg C2H3Cl eq9.05 × 1036.94 × 1032.11 × 103
Carcinogenskg C2H3Cl eq6.59 × 1035.07 × 1031.52 × 103
Terrestrial acid/nutrikg SO2 eq9.67 × 1035.35 × 1034.32 × 103
Mineral extractionMJ surplus3.97 × 1043.38 × 1045.97 × 103
Aquatic ecotoxicitykg TEG water3.93 × 1072.97 × 1079.63 × 106
Ionizing radiationBq C-14 eq1.67 × 1071.94 × 1061.48 × 107
Respiratory organicskg C2H4 eq1.75 × 1021.13 × 1026.23 × 101
Ozone layer depletionkg CFC-11 eq4.16 × 10−21.52 × 10−22.64 × 10−2
Aquatic eutrophicationkg PO4 P-lim1.04 × 1024.00 × 1016.43 × 101
Aquatic acidificationkg SO2 eq2.62 × 1031.37 × 1031.26 × 103
Table 5. Environmental impact comparison of the construction materials and operational energy demands for 45 years of the NZEB-W; IMPACT2002+ method; midpoints characterization.
Impact CategoryUnitDomestic Hot WaterFlooring 1stFlooring 2ndFoundationsHeat EnergyInner Walls 1stInner Walls 2ndLightningPeripheral WallsRoofTechnical EquipmentWindows and Doors
Carcinogenskg C2H3Cl eq6.7 × 1017.8 × 1025.6 × 1022.6 × 1026.0 × 1024.3 × 1028.1 × 1026.5 × 1024.0 × 1026.9 × 1022.0 × 1021.1 × 103
Non-carcinogenskg C2H3Cl eq1.4 × 1026.5 × 1027.6 × 1023.1 × 1029.4 × 1026.7 × 1021.2 × 1038.0 × 1025.2 × 1021.7 × 1032.4 × 1021.1 × 103
Respiratory inorganicskg PM2.5 eq8.31.4 × 10264157831531.4 × 10226424343
Ionizing radiationBq C-14 eq9.3 × 1031.8 × 1052.3 × 1058.5 × 1042.9 × 1052.1 × 1053.8 × 1051.1 × 1072.5 × 1053.5 × 1053.3 × 1062.6 × 105
Ozone layer depletionkg CFC-11 eq2.7 × 10−31.6 × 10−32.1 × 10−39.4 × 10−42.7 × 10−31.5 × 10−32.6 × 10−31.6 × 10−21.7 × 10−33.0 × 10−34.8 × 10−31.8 × 10⁻³
Respiratory organicskg C2H4 eq3.69.4206.5417.412147.8174.134
Aquatic ecotoxicitykg TEG water1.2 × 1052.5 × 1064.8 × 1061.1 × 1061.3 × 1053.9 × 1066.3 × 1067.2 × 1062.2 × 1065.8 × 1062.2 × 1063.0 × 106
Terrestrial ecotoxicitykg TEG soil1.7 × 1057.6 × 1051.8 × 1064.4 × 1055.2 × 1059.6 × 1051.3 × 1061.7 × 1066.0 × 1052.4 × 1065.1 × 1051.5 × 106
Terrestrial acid/nutrikg SO2 eq3.1 × 1024.3 × 1021.0 × 1032.6 × 1021.8 × 1034.5 × 1027.8 × 1021.7 × 1034.5 × 1028.3 × 1025.2 × 1021.1 × 103
Land occupationm2org.arable6.2 × 1034.7 × 1033.4 × 1044.8 × 1030.01.1 × 1041.4 × 1041.4 × 1031.4 × 1041.4 × 1044.2 × 1021.2 × 103
Aquatic acidificationkg SO2 eq421.3 × 1022.1 × 102592.8 × 1021.3 × 1022.5 × 1027.2 × 1021.3 × 1021.9 × 1022.2 × 1022.6 × 102
Aquatic eutrophicationkg PO4 P-lim5.3 × 10−14.06.41.61.23.97.1483.64.7148.7
Global warmingkg CO2 eq1.2 × 1031.9 × 1042.8 × 1041.3 × 1042.8 × 1051.7 × 1043.2 × 1041.1 × 1051.8 × 1043.5 × 1043.3 × 1043.6 × 104
Non-renewable energyMJ primary1.6 × 1042.5 × 1055.1 × 1051.2 × 1054.4 × 1052.3 × 1054.2 × 1052.5 × 1062.5 × 1053.3 × 1057.6 × 1057.1 × 105
Mineral extractionMJ surplus1.3 × 1022.6 × 1031.0 × 1037.1 × 1022.4 × 1022.8 × 1035.9 × 1034.3 × 1032.3 × 1037.1 × 1031.3 × 1031.1 × 104
Table 6. Uncertainty analysis of NZEB-W, method IMPACT 2002+, characterization, confidence interval: 95%, standard deviation (SD), coefficient of variability (CV), and standard error of mean (SEM).
Impact CategoryUnitMeanMedianSDCV2.5%97.5%SEM
Global warmingkg CO2 eq6.21 × 1056.20 × 1051.27 × 1042.055.99 × 1056.49 × 1051.27 × 102
Aquatic acidificationkg SO2 eq2.62 × 1032.61 × 1031.39 × 1025.312.37 × 1032.92 × 1031.39
Respiratory inorganicskg PM2.5 eq6.89 × 1026.86 × 1024.54 × 1016.596.11 × 1027.88 × 1024.54 × 10−1
Terrestrial acid/nutrikg SO2 eq9.66 × 1039.62 × 1036.84 × 1027.088.42 × 1031.11 × 1046.84
Mineral extractionMJ surplus3.94 × 1043.90 × 1044.42 × 1031.12 × 1013.19 × 1044.91 × 1044.42 × 101
Respiratory organicskg C2H4 eq1.75 × 1021.72 × 1022.00 × 1011.14 × 1011.50 × 1022.25 × 1022.00 × 10−1
Non-renewable energyMJ primary6.55 × 1066.43 × 1068.02 × 1051.22 × 1015.32 × 1068.48 × 1068.02 × 103
Carcinogenskg C2H3Cl eq6.61 × 1036.41 × 1031.17 × 1031.77 × 1014.94 × 1039.42 × 1031.17 × 101
Ozone layer depletionkg CFC-11 eq4.16 × 10−24.12 × 10−21.58 × 10−23.79 × 1011.16 × 10−27.41 × 10−21.58 × 10−4
Land occupationm2org.arable1.07 × 1059.40 × 1045.03 × 1044.72 × 1014.79 × 1042.36 × 1055.03 × 102
Aquatic eutrophicationkg PO4 P-lim1.05 × 1028.58 × 1017.10 × 1016.77 × 1013.76 × 1012.86 × 1027.10 × 10−1
Ionizing radiationBq C-14 eq1.67 × 1071.06 × 1072.21 × 1071.33 × 1024.51 × 1066.50 × 1072.21 × 105
Non-carcinogenskg C2H3Cl eq8.32 × 1038.44 × 1037.56 × 1049.09 × 1021.44 × 1051.58 × 1057.56 × 102
Aquatic ecotoxicitykg TEG water3.90 × 1073.58 × 1074.97 × 1081.27 × 103−9.54 × 1081.03 × 1094.97 × 106
Terrestrial ecotoxicitykg TEG soil1.10 × 1078.71 × 1062.24 × 1082.04 × 103−4.43 × 1084.68 × 1082.24 × 106
Publisher’s Note: MDPI stays neutral with regard to jurisdictional claims in published maps and institutional affiliations.

