Abstract
In southern Xinjiang province, northwest China, farmland is undergoing rapid conversion to orchards or agroforestry. This has improved land-use efficiency but has also caused drastic ecological changes in this region. This study investigated the effects of farmland conversion to orchard or agroforestry on soil total organic carbon (TOC) and several soil labile fractions: readily oxidizable carbon (ROC), light fraction organic carbon (LFOC), and dissolved organic carbon (DOC). Soil samples were collected from seven cropping treatments: a monocultured wheat field (Mono), a 5-year-old jujube orchard (5 J), a 5-year-old jujube/wheat alley cropping system (5 JW), a 10-year-old jujube orchard (10 J), a 10-year-old jujube/wheat alley cropping system (10 JW), a 15-year-old jujube orchard (15 J), and a 15-year-old jujube/wheat alley cropping system (15 JW). The results show that the ROC concentrations varied from 0.17 ± 0.09 g/kg to 2.35 ± 0.05 g/kg across all land-use types and soil depths studied. It was higher in the 0–10 cm and 10–20 cm layers of treatment 10 JW than in other treatments and significantly greater than in the Mono treatment. The highest value of DOC was reached at 593.04 mg/kg in the 15 JW treatment at 0–10 cm. Labile organic carbon decreased with increasing depth in all treatments. The proportion of ROC and LFOC to TOC decreased with increasing soil depth. In all treatments, the ratio of DOC to TOC generally decreased initially and then increased again with increasing depth. Correlation analysis showed that ROC, LFOC, and DOC were closely correlated with TOC (p < 0.01). The ROC, LFOC, and DOC concentrations were significantly correlated with each other (p < 0.01). Following conversion of farmland to jujube orchard or agroforestry, the content and activity of soil organic carbon tended to increase due to augmentation of plant residues. Thus, jujube orchards and agroforestry systems are effective methods to restore soil organic carbon.
1. Introduction
The soil carbon pool is the largest pool of actively cycling C in terrestrial ecosystems and plays a key role in the global carbon cycle and soil microbial activities [1,2]. To a depth of 1 m, it contains about 1500–2000 Pg C in various organic forms, from recent plant litter to charcoal to very old, humified compounds [3,4]. Total soil organic carbon (TOC) and its several labile fractions are crucial for soil quality because they have far-reaching effects on soil chemical, physical, and biological properties [5,6]. Labile organic carbon (LOC) fractions in the soil are characterized by fast movement, instability, easy oxidation, and decomposition. These fractions can serve as excellent indicators of soil quality as influenced by land-use/cover changes and human activities and can therefore be used to characterize short-term changes in soil organic carbon [7,8,9,10,11].
Land-use conversion can rapidly affect the labile organic carbon fractions of soil and also affects the nutrient cycling and biomass production [12,13,14,15,16,17]. The readily oxidizable organic carbon fraction (ROC) responds most rapidly to changes in tillage and stubble treatments and is an indicator of soil quality due to its ease of measurement [18,19,20,21]. The light fraction organic carbon (LFOC) plays an important role in determining the structure and function of the soil ecosystem by acting as an energy source for heterotrophic organisms [9]; it is essential in the short-term turnover of nutrients in soils [5,22] and is used as an early indicator of changes in soil quality [23]. Dissolved organic carbon (DOC) represents only a small proportion of SOC, but it is the primary energy source for soil microorganisms and affects their activity and abundance in the soil [23,24]; it is involved in the transformation of soil organic matter and in the transformation and transportation of inorganic material in soils. It is considered to be a key indicator of soil quality due to its rapid response to land-use and management practices [23]. Many studies have reported responses of labile SOC pools to forest conversion, afforestation, and the natural wetland conversion into agricultural land [5,9,10]. Haynes [25] concluded that individual labile organic fractions are sensitive to changes in soil management and have effects on soil function (i.e., nutrient cycling). Thus, measuring and studying these smaller, more-active, and representative fractions of soil organic carbon is essential in identifying changes in soil quality and the soil organic carbon pool responses to land-use and management practices.
Over the last 20 years, with the development of the forestry and fruit industries in southern Xinjiang, the agricultural structure of the Nanjiang Basin has changed: most farmland has been converted to orchards or agroforestry in order to improve the local ecological landscape and economy [26,27]. This land-use or management-practice change would inevitably disrupt dynamic SOC equilibrium and affect soil microbial activities, further influencing SOC fractions [28]. During this process, however, soil quality has not been a focus of many farmers. Only few studies have addressed the impact of land-use change on labile organic carbon in soils here. This calls for a better understanding of the distribution of LOC fractions in soil under different land uses and of how these are affected by conversion of farmland to orchards or agroforestry. This is crucial for evaluating soil quality, sustainability, and productivity.
In this study, we investigated how a conversion of farmland to orchards or agroforestry affects the different SOC fractions. This study aimed: (1) to measure the concentrations and vertical distribution of TOC and LOC fractions (ROC, LFOC, and DOC) and their quantitative relationships between soil LOC and TOC and (2) to reveal the impacts of farmland conversion to orchard or agroforestry on soil LOC and TOC pools. We tested the following hypotheses: (1) the conversion of farmland to jujube orchards or agroforestry alters the size of SOC pools in this region and (2) that labile SOC is a more-sensitive indicator of soil quality than total SOC after a land-use change.
2. Materials and Methods
2.1. Study Area
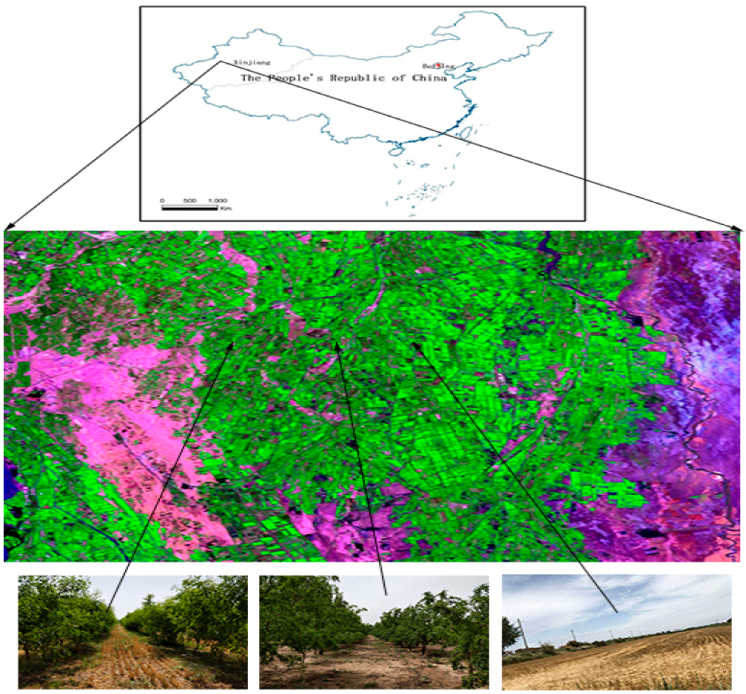
This study was carried out in Wensu county, Xinjiang province, northwest China (79°28′–81°30′ E, 40°52′–42°21′ N). Wensu county is located in the middle of the Tian Shan Mountains in western Xinjiang and at the northwest edge of the Tarim basin. It has a typical warm–temperate continental arid climate. The mean annual temperature is 10.1 °C; the extreme maximum temperature is 40.9 °C; and the extreme minimum temperature is −27.4 °C. The average annual precipitation is 65.4 mm, with a maximum of 123.4 mm and a minimum of 25.5 mm. The average annual evaporation is 1883.6 mm. The annual frost-free period is 185 d (Figure 1).

Figure 1.
Locations of soil-sampling sites in Wensu county, Xinjiang, China.
The following seven land-use management practices (hereafter, referred to as treatments) were studied with three replications each: (1) A monocultured wheat field (Mono), (2) a 5-year-old jujube orchard (5 J), (3) a 5-year-old jujube/wheat alley cropping system (5 JW), (4) a 10-year-old jujube orchard (10 J), (5) a 10-year-old jujube/wheat alley cropping system (10 JW), (6) a 15-year-old jujube orchard (15 J), and (7) a 15-year-old jujube/wheat alley cropping system (15 JW). All of the 18 selected jujube orchards and agroforestry systems, as converted from farmland, had the same planting background and similar management practices. In the present study, the 18 selected jujube orchards and agroforestry systems were associated initially, all being similar in their physical, chemical, and biological properties. In the three control farmlands, winter wheat was cultivated and managed by conventional agricultural practices.
2.2. Soil Sampling and Analyses
From July to August 2018, a standard method was used to set up sample plots in the town of Kezile, Wensu county, Xinjiang province. Soil samples were collected from jujube orchards, jujube/wheat alley cropping systems, and a wheat monoculture field. The soil was classified mainly as silty loam in all study sites.
For each land-use type, three test sites were selected as replicates. At each sampling point, soil cores were collected at seven depths (0–10 cm, 10–20 cm, 20–30 cm, 30–40 cm, 40–60 cm, 60–80 cm, and 80–100 cm) using a 5 cm bulk density corer and then pooled by depth. In each jujube orchard, six jujube trees were chosen randomly, and sampling points were established within a 1 m distance of the tree crown projections. Samples were collected from the same soil layer in each orchard to pool into a composite soil sample. In all, 63 soil samples were collected at 54 sample points in 9 jujube orchards (6 points per jujube orchard). In each jujube/wheat alley cropping system, six jujube trees were chosen randomly, and sampling points were established within a 1 m distance of the tree crown projections. In addition, six sampling points were established in an S-type pattern within the crop line of intercropping sites. Samples were collected from the same soil layer within one agroforestry system to pool into a composite soil sample. In all, 63 soil samples were collected at 108 sample points in 9 agroforestry systems (12 points per agroforestry system). In each wheat field, six sampling points were arranged in an S-type pattern, and soil samples were collected in wheat field. In all, 21 soil samples were collected at 18 sample points in 3 wheat-field areas (6 points per wheat field). The field-moist soil samples were passed through a 2 mm sieve to remove rocks and plant roots and were divided into two subsamples. One subsample was put into cloth bags and stored in a refrigerator at 4 °C for later determination of DOC. The other was air-dried and stored at room temperature for TOC and other organic carbon fractions (LFOC and ROC).
DOC was extracted with distilled water (25 °C) (1:4 soil/water) and shaken for 1 h, and the extract was filtered through a 0.45 μm glass-fiber filter [29].
LFOC was extracted by the density-fractionation method [30]. The LFOC was separated by flotation on a NaI solution with a density of 1.70 g cm−3, using a modification of the method described by Gregorich and Janzen [31].
ROC was estimated using 0.333 mmol·L−1 KMnO4 oxidation, following the method of Lefroy et al. [32] and Blair et al. [33]. The amount of KMnO4-oxidizable carbon in the soil was calculated by assuming that 1 mmol KMnO4 is consumed in the oxidation of 9 mg of carbon [33].
TOC, LFOC, ROC, and DOC contents were measured using dry combustion with an elemental analyzer and expressed as an organic C mass in the whole soil or fractions relative to the whole soil mass.
2.3. Statistical Analyses
Analysis of variance (ANOVA) was used to test the differences in labile fractions among the different land uses and soil depths and to assess the significance of the impacts of land use, soil depth, and their interaction on soil labile fractions. The least-significant difference (LSD, p < 0.05) was used to separate the means when differences were significant. Regression analysis was performed to explore relationships among the different soil labile fractions. All analyses were performed using IBM SPSS Statistics version 25 (IBM SPSS Inc., Chicago, CA, USA) and SigmaPlot version 10 (Systat Software Inc., SAN Jose, CA, USA) software.
3. Results
3.1. Responses of SOC Fractions to Conversion of Farmland to Orchard or Agroforestry
The different quantity and quality of soil exogenous carbon input led to a different distribution of TOC under different land-use patterns. After farmland conversion, the TOC content increased in the entire 0–100 cm soil profile (Figure 2). The TOC content in the soil of the different land-use types rapidly decreased with greater soil depth, and the effects of land use on TOC were most pronounced in the topsoil (0–30 cm) (Figure 2). With increasing age of the jujube orchard, TOC content increased through the entire 0–100 cm soil profile. Among the three differently aged jujube orchards, the 15 J treatment had a significantly higher TOC content than Mono at the topsoil (0–30 cm) (p < 0.05; Figure 2). After the transition from farmland to agroforestry, the amount of TOC generally increased at first and then decreased later with increasing age of the jujube. The TOC concentration was higher in the 10 JW treatments than the other agroforestry sites (Figure 2).
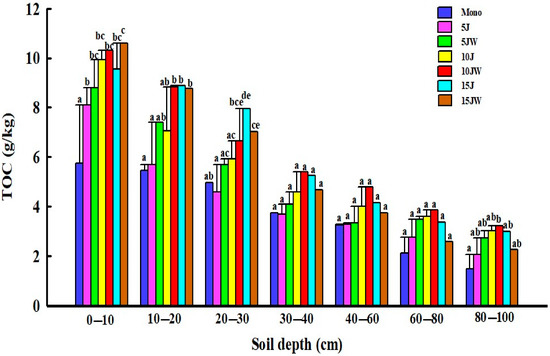
Figure 2.
Distribution characteristics of total soil organic carbon content under different land-use types. Note that the data are mean ± standard error. Different lowercase letters: significant difference in different land-use types at the same soil depth (p < 0.05). Mono (monocultured wheat field), 5 J (5-year-old jujube orchard), 5 JW (5-year-old jujube/wheat alley cropping system), 10 J (10-year-old jujube orchard), 10 JW (10-year-old jujube/wheat alley cropping system), 15 J (15-year-old jujube orchard), and 15 JW (15-year-old jujube/wheat alley cropping system).
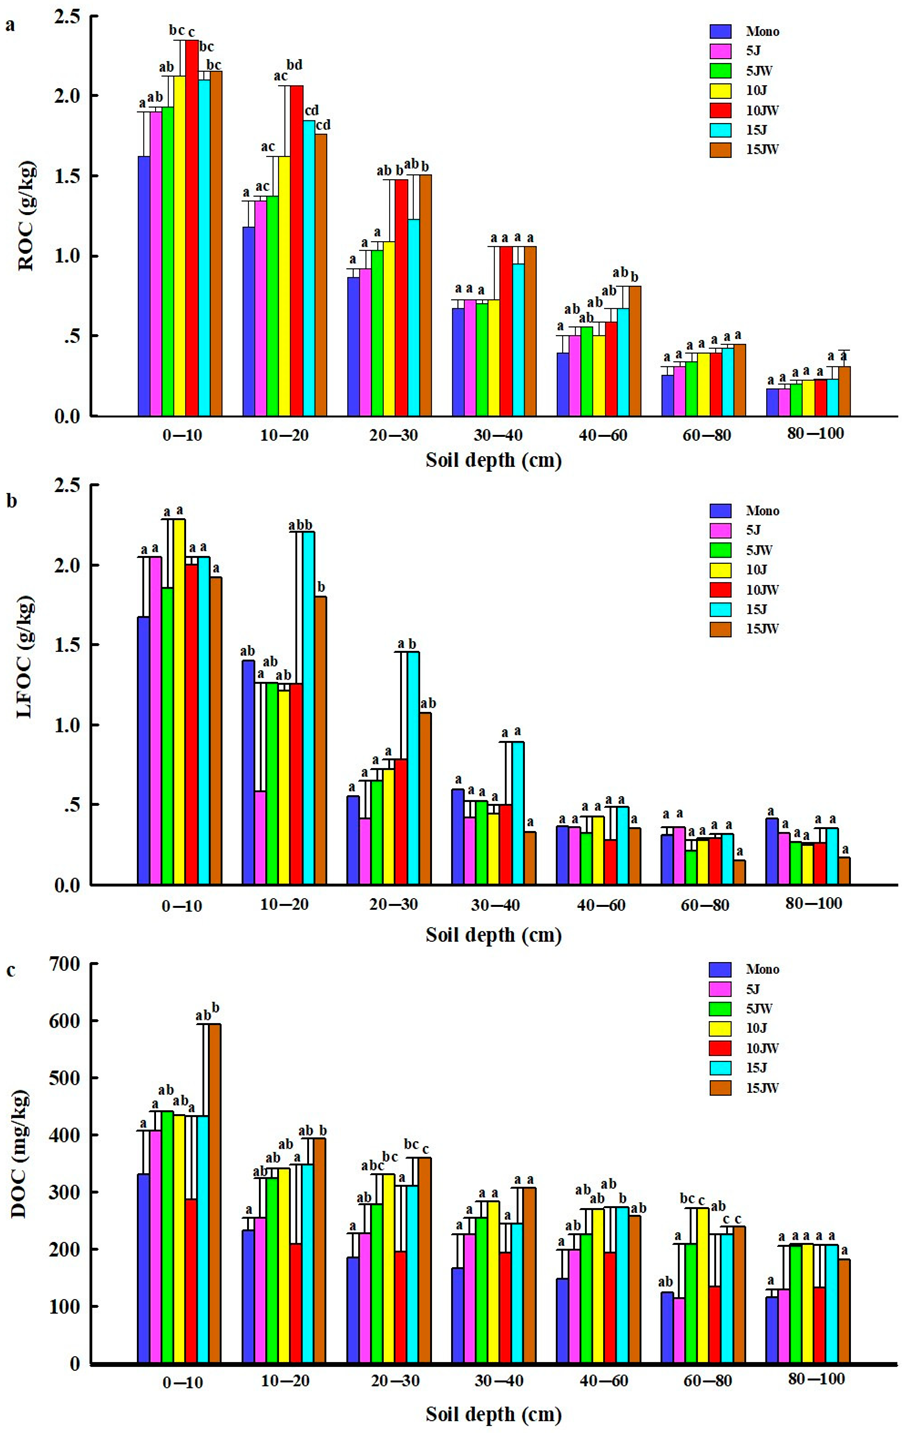
All the average contents of ROC, LFOC, and DOC decreased with increasing soil depth. For all seven land-use patterns, ROC and LFOC contents were significantly higher at 0–10 cm and 10–20 cm compared with deeper soil depths (Figure 3). Nonetheless, the DOC concentration in the 0–10 cm soil layer was much higher than that in the other soil layers under the different land-use types (Figure 3).
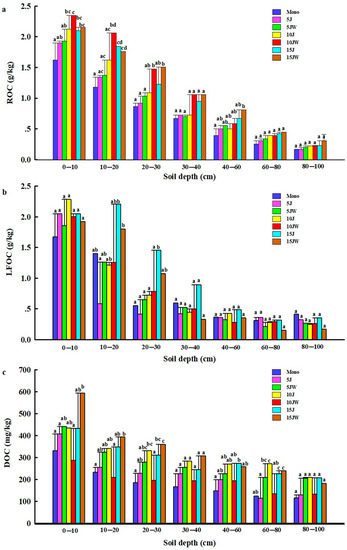
Figure 3.
Distribution of the labile fraction organic carbon content under different land-use types. (a) Readily oxidizable organic carbon; (b) light fraction organic carbon; and (c) dissolved organic carbon. Note that the data are mean ± standard error. Different lowercase letters: significant difference in different land-use types under the same soil depth (p < 0.05). Mono (monocultured wheat field), 5 J (5-year-old jujube orchard), 5 JW (5-year-old jujube/wheat alley cropping system), 10 J (10-year-old jujube orchard), 10 JW (10-year-old jujube/wheat alley cropping system), 15 J (15-year-old jujube orchard), and 15 JW (15-year-old jujube/wheat alley cropping system).
The effects of different land-use types and soil depths on the TOC, ROC, and DOC concentrations were significant at p < 0.0001. LFOC, ROC/TOC, LFOC/TOC, and DOC/TOC were strongly influenced by the soil depth (p < 0.0001), but no significant land-use–soil-depth interaction was observed for ROC, LFOC, or DOC (Table 1).

Table 1.
ANOVA table of F-values on the effect of land-use type and soil depth on soil carbon fractions.
Across all land-use types and soil depths studied, ROC concentrations varied from 0.17 ± 0.09 g/kg to 2.35 ± 0.05 g/kg (Figure 3a). The 10 JW treatment had more ROC in the 0–10 cm and 10–20 cm layers than other treatments and significantly more than the Mono treatment (p < 0.05) (Figure 3a). After the conversion of farmland to jujube orchards, the changes in ROC were similar to the TOC pattern. All increased with the increasing age of the jujube orchard in the entire 0–100 cm profile (Figure 3a). In contrast, after the transition from farmland to agroforestry, the amount of ROC generally increased at first and then decreased in the 0–10 cm and 10–20 cm layers with the increasing age of the jujube but continued to increase with the increasing jujube age in the other soil layers (Figure 3a).
There were significant effects of the soil depth on LFOC (p < 0.0001, Table 1), with higher LFOC in the 15 J treatment relative to the other treatments for the depths of 10–20 cm, 20–30 cm, 30–40 cm, and 40–60 cm (Figure 3b). After the conversion from farmland to jujube orchard or jujube-wheat intercropping, the soil LFOC content in the 0–30 cm layer increased but not significantly (Figure 3b).
The concentration of DOC varied widely among all the treatments, and an increase was recorded at 0–10 cm, 10–20 cm, and 20–30 cm under the 5 J, 5 JW, 10 J, 15 J, and 15 JW treatments, compared with farmland; the highest values were registered in the 15 JW treatment at those soil depths (Figure 3c). They reached 593.04 mg/kg in the 15 JW treatment at 0–10 cm, and the upper 10 cm soil layer had more DOC than the lower layers in all land-use types (Figure 3c).
3.2. Responses of the Soil LOC-to-TOC Ratio to Conversion of Farmland to Orchard or Agroforestry
The ratio of soil LOC to TOC reflects the turnover efficiency of soil organic matter. As a general trend, the proportions of ROC, LFOC, and DOC to TOC were different in the entire 0–100 cm soil profile (Table 2). The proportion of ROC and LFOC to TOC decreased with increasing soil depth, and the ratio of DOC to TOC generally decreased and then increased again with increasing soil depth at all treatments (Table 2). In the 0–10 cm soil layer, all the ratios of ROC to TOC, LFOC to TOC, and DOC to TOC were high in farmland. They decreased when farmland was changed to jujube orchards or agroforestry.
Table 2.
Proportion of labile fraction organic carbon to total organic carbon through the soil profile in different land-use types.
Comparing all the treatments at the seven soil layers, ROC proportions ranged from 7.78% to 28.23%, and the average proportions of LFOC to soil TOC were between 3.89% and 29.37% (Table 2). At the 0–10 cm depth, ROC/TOC and LFOC/TOC significantly varied between farmland and the three age groups of jujube orchards (p < 0.05). The orders were: Mono < 5 J < 15 J < 10 J (ROC/TOC); Mono < 5 J < 10 J < 15 J (LFOC/TOC) (Table 2); ROC/TOC and LFOC/TOC also significantly varied between farmland and the three age groups of agroforestry (p < 0.05). The orders were: Mono < 10 JW < 5 JW < 15 JW (ROC/TOC); Mono < 5 JW < 10 JW < 15 JW (LFOC/TOC) (Table 2).
3.3. Correlations between Soil LOC and TOC
Correlation analysis showed that ROC, LFOC, and DOC were closely correlated with TOC (p < 0.01). The ROC, LFOC, and DOC concentrations were significantly correlated with each other (p < 0.01) (Table 3).
Table 3.
Pearson correlations among soil carbon fractions.
The sensitivity of the various indicators to land-use type ((highest-lowest)/lowest) was 14.35 for TOC, 29.38 for ROC, 62.20 for LFOC, and 11.00 for DOC in the entire 0–100 cm soil profile and 1.04 for TOC, 0.61 for ROC, 2.43 for LFOC, and 2.98 for DOC in the upper 10 cm soil layer (Table 4).
Table 4.
Sensitivity index of soil carbon fractions under different land-use types.
4. Discussion
The equilibrium TOC content in the soil is a result of the balance between organic-material input and organic-material decomposition [33,34,35]. Relative sizes of LOC pools in different ecosystems and their responses to disturbance potentially have important implications in understanding TOC stability. Because the agroecosystem was converted to orchards and agroforestry systems, changes in soil SOC fractions and the proportions of each fraction varied with land use. In this study, we hypothesized that the conversion of farmland to jujube orchards or agroforestry would alter the size of soil SOC fractions. As hypothesized, the levels of SOC, ROC, LFOC, and DOC in the 0–100 cm soil profile increased after the land-use conversion (Figure 3). These results are in accordance with the findings of others [9,19]. They probably reflect factors such as microclimate conditions, vegetation cover, and the quantity and quality of organic matter inputs to soils. Trees in orchards or agroforestry systems could maintain or increase soil organic matter and promote nutrient cycling by continuous addition of litter and root turnover [36].
The ROC is the component that is easily oxidized and highly available for plants and microorganisms [19,33]. Our results showed that the jujube orchards and agroforestry systems contained more ROC than farmland; the values increased with the increasing age of the jujube orchard and significantly increased in treatments 10 J, 10 JW, 15 J, and 15 JW in the upper 10 cm soil layer (Figure 3a); the ROC content clearly declined with soil depth, which we attribute to the correlations of ROC with plant root distribution and root carbon inputs (more plant debris and exudates in the orchard and agroforestry soils) as well as to litter quantities and qualities [37,38]. In addition, the litter cover and tree canopy provide shade, resulting in differences in soil temperature and moisture between the orchard or agroforestry and the farmland. This, in turn, reduces the decomposition rate of soil organic carbon, thereby promoting the accumulation of soil organic carbon [39]. The ROC content in soil is generated mainly from the TOC content. Skopp et al. [40] also reported that the ROC content is positively correlated with soil moisture. High humidity in soil promotes microbial activity and the decomposition rate of soil organic carbon and is therefore conducive to the accumulation of ROC.
Plant residue and humus are regarded as the most-significant sources of DOC in soil. DOC is the main energy source for soil microorganisms, while microbial metabolites also greatly contribute to soil DOC [6,19,41,42]. After the transition from farmland to jujube orchards or agroforestry, the amount of DOC increased. However, the DOC content in 0–10 cm increased significantly only in 15 JW (Figure 3c). The 593.04 mg/kg in the 15 JW treatment was an increase of 79.9% compared to that of farmland. The lower DOC concentrations found in this study for farmland relative to jujube orchards or agroforestry systems probably reflects a lower input by wheat residues in the latter two and higher microbial consumption of DOC in the farmland [19]. Moreover, a reduction in photosynthate and damage to the grass roots after crops are harvested each year may sharply reduce the amount of plant material returned to the soil [6]. Kalbitz et al. [43] also concluded that litter and humus were important sources of DOC. The composition of the leaf litter and decaying roots may also contribute considerably to determining the DOC concentration in soils. The upper 10 cm soil layer had more DOC than lower layers, and the DOC content following different soil uses was considerably smaller with increasing depth (Figure 3c). This result agrees with the finding of Zhang et al. [43] that upland forest, abandoned cultivated fields and cultivated soils, showed a much smaller decrease in DOC concentrations with increasing depth. Adsorption of DOC in the upper layer determines DOC release from topsoil and contributes to a decrease in its concentration at a lower depth [9].
The ROC, LFOC, and DOC have been suggested as indicators of the effects of different soil-management practices on soil quality because these fractions are more sensitive to changes in management than TOC [35,44]. In this study, significant differences in ROC, LFOC, and DOC were observed after the conversion of farmland to jujube orchards or agroforestry systems. The concentration values of ROC, LFOC, and DOC in the entire profile (0–100 cm) ranged from 0.17 to 2.35 g/kg (a 13.8-fold difference), 0.15 to 2.28 g/kg (a 15.2-fold difference), and 113.31 to 593.04 mg/kg (a 5.2-fold difference), respectively, among the different land uses soils (Figure 3), while the concentration values of TOC ranged from 1.47 to 10.59 g/kg (a 7.2-fold difference) (Figure 2). Additionally, the sensitivity index of carbon fractions was calculated using ((highest-lowest)/lowest) [45]. The results indicate that all LOC pools are sensitive to land-use changes (Table 4). Similar results were reported by Dou et al. [46]. Therefore, LOC is a more-sensitive indicator of soil carbon response to soil-management and land-use changes than TOC [30,47,48,49]. Correlation analysis showed that ROC, LFOC, and DOC were closely correlated with TOC (p < 0.01). The ROC, LFOC, and DOC concentrations were significantly correlated with each other (p < 0.01) (Table 3). This demonstrates that it is desirable to understand the impacts of labile C pools on soil quality under different land uses or management practices.
5. Conclusions
The conversion of farmland to jujube orchards or agroforestry systems led to an increase in soil TOC and LOC content. The effects of different land-use types and different soil depths on TOC and LOC concentrations were significant at p < 0.05. The effect was strongest in topsoil (0–30 cm). The results of this study indicate that LOC is a more-sensitive indicator of the soil carbon response to soil-management and land-use changes than TOC.
By introducing orchard or agroforestry practices on farmlands, significant amounts of carbon can be sequestered not only in the aboveground biomass but also in the belowground biomass and in the soil as well. Orchards and agroforestry systems are an integrated approach to sustainable land use, but they also contribute to climate-change adaptation and mitigation in this region.
Author Contributions
Conceived and designed the experiments: W.W. and Z.W.; performed the experiments: W.W., G.Y. and A.A.; analyzed the data: W.W. and Z.W.; wrote the manuscript: W.W. Critical revision of the manuscript for important intellectual content: J.I. All authors have read and agreed to the published version of the manuscript.
Funding
This research was financially supported by the National Natural Science Foundation of China (No. 31760199).
Institutional Review Board Statement
Not applicable.
Informed Consent Statement
Not applicable.
Data Availability Statement
Not applicable.
Acknowledgments
We thank Hong Chen, Hao Deng, and Feng Lin for their help with the field experiments and thank Honglong Hao, Tuliganayi, and Musa for their help with the field and laboratory experiments. We also thank Michael Stachowitsch who kindly improved our English.
Conflicts of Interest
The authors declare no conflict of interest.
References
- Bargali, K.; Manral, V.; Padalia, K.; Bargali, S.S.; Upadhyay, V.P. Effect of vegetation type and season on microbial biomass carbon in Central Himalayan forest soils, India. Catena 2018, 171, 125–135. [Google Scholar] [CrossRef]
- Bargali, S.S.; Padalia, K.; Bargali, K. Effects of tree fostering on soil health and microbial biomass under different land use systems in central Himalaya. Land Degrad. Dev. 2019, 30, 1984–1998. [Google Scholar] [CrossRef]
- Amundson, R. The carbon budget in soils. Annu. Rev. Earth. Planet. Sci. 2001, 29, 535–562. [Google Scholar] [CrossRef]
- Janzen, F.H. Carbon cycling in earth systems-a soil science perspective. Agric. Ecosyst. Environ. 2004, 104, 399–417. [Google Scholar] [CrossRef]
- Zhang, G.L. Changes of Soil Labile Organic Carbon in Different Land Uses in Sanjiang Plain, Heilongjiang Province, China. Geogr. Sci. 2010, 20, 139–143. [Google Scholar] [CrossRef]
- He, X.X.; Huang, Y.Z.; Zhang, Q.C.; Ye, S.M.; Wang, S.Q. Distribution of organic carbon fractions in soil aggregates in Chinese fir plantations with different stand ages. Ecol. Process. 2021, 10, 49–61. [Google Scholar] [CrossRef]
- Ramírez, P.B.; Fuentes-Alburquenque, S.; Díez, B.; Vargas, I.; Bonilla, C.A. Soil microbial community responses to labile organic carbon fractions in relation to soil type and land use along a climate gradient. Soil Biol. Biochem. 2020, 141, 107692. [Google Scholar] [CrossRef]
- Sun, X.D.; Wang, G.; Ma, Q.X.; Liao, J.H.; Wang, D.; Qingwei Guan, Q.W.; Jones, D.L. Organic mulching promotes soil organic carbon accumulation to deep soil layer in an urban plantation forest. For. Ecosyst. 2021, 8, 2. [Google Scholar] [CrossRef]
- Laik, R.; Kumar, K.; Das, D.K.; Chaturvedi, O.P. Labile soil organic matter pools in a calciorthent after 18 years of afforestation by different plantations. Appl. Soil Ecol. 2009, 42, 71–78. [Google Scholar] [CrossRef]
- Wang, Q.K.; Xiao, F.M.; He, T.X.; Wang, S.L. Responses of labile soil organic carbon and enzyme activity in mineral soils to forest conversion in the subtropics. Ann. For. Sci. 2013, 70, 579–587. [Google Scholar] [CrossRef] [Green Version]
- Bai, Y.; Zhou, Y.; He, H. Effects of rehabilitation through afforestation on soil aggregate stability and aggregate -associated carbon after forest fires in subtropical China. Geoderma 2020, 376, 114–548. [Google Scholar] [CrossRef]
- Padalia, K.; Bargali, S.S.; Bargali, K.; Khulbe, K. Assessment of the microbial biomass carbon and nitrogen in relation to cropping system in Central Himalaya. India Curr. Sci. 2018, 115, 1741–1750. [Google Scholar] [CrossRef]
- Padalia, K.; Bargali, S.S.; Bargali, K.; Manral, V. Soil microbial biomass phosphorus under different land use systems of Central Himalaya. Trop. Ecol. 2021, 1–19. [Google Scholar] [CrossRef]
- Manral, V.; Bargali, K.; Bargali, S.S.; Shahi, C. Changes in soil biochemical properties following replacement of Banjoak forest with Chirpine in Central Himalaya, India. Ecol. Processes 2020, 9, 30. [Google Scholar] [CrossRef]
- Vibhuti, K.B.; Bargali, S.S. Effect of size and altitude on soil organic carbon stock in homegarden agroforestry system in Central Himalaya, India. Acta Ecol. Sin. 2020, 40, 483–491. [Google Scholar] [CrossRef]
- Himani, K.; Bargali, K.; Bargali, S.S. Spatial and Temporal Trends in Soil N-Mineralization Rates under the Agroforestry Systems in Bhabhar belt of Kumaun Himalaya, India. Agrofor. Syst. 2021, 95, 1603–1617. [Google Scholar] [CrossRef]
- Chen, Y.; Cao, J.; Zhao, J.; Wu, J.; Zou, X.; Fu, S.; Zhang, W. Labile C dynamics reflect soil organic carbon sequestration capacity: Understory plants drive topsoil C process in subtropical forests. Ecosphere 2019, 10, e02784. [Google Scholar] [CrossRef]
- Chan, K.Y.; Heenan, D.P.; Oates, A. Soil carbon fractions and relationship to soil quality under different tillage and stubble management. Soil Tillage Res. 2002, 63, 133–139. [Google Scholar] [CrossRef]
- Wang, Y.; Ruan, H.H.; Huang, L.L.; Feng, Y.Q.; Qi, Y.; Zhou, J.Z.; Shen, Y.L. Soil Labile Organic Carbon With Different Land Uses in Reclaimed Land Area From Taihu Lake. Soil Sci. 2010, 175, 624–630. [Google Scholar] [CrossRef]
- Melero, S.; Lopez-Garrido, R.; Murillo, J.M.; Moreno, F. Conservation tillage: Short- and long-term effects on soil carbon fractions and enzymatic activities under Mediterranean conditions. Soil Tillage Res. 2009, 104, 292–298. [Google Scholar] [CrossRef] [Green Version]
- Zhang, M.; Zhang, X.K.; Liang, W.J.; Jiang, Y.; Dai, G.H.; Wang, X.G.; Han, S.J. Distribution of Soil Organic Carbon Fractions Along the Altitudinal Gradient in Changbai Mountain, China. Pedosphere 2011, 21, 615–620. [Google Scholar] [CrossRef]
- Alvarez, C.R.; Alvarez, R.; Grigera, M.S.; Lavado, R.S. Associations between organic matter fractions and the active soil microbial biomass. Soil Biol. Biochem. 1998, 30, 767–773. [Google Scholar] [CrossRef]
- Haynes, R.J. Labile organic matter as an indicator of organic matter quality in arable and pastoral soils in New Zealand. Soil Biol. Biochem. 2000, 32, 211–219. [Google Scholar] [CrossRef]
- Tian, J.; Fan, M.S.; Guo, J.H.; Marschner, P.; Li, X.L.; Kuzyakov, Y. Effects of land use intensity on dissolved organic carbon properties and microbial community structure. Eur. J. Soil Biol. 2012, 52, 67–72. [Google Scholar] [CrossRef]
- Haynes, R.J. Labile organic matter fractions as central components of the quality of agricultural soils: An overview. Adv. Agron. 2005, 85, 221–268. [Google Scholar] [CrossRef]
- Zhang, W.; Wang, B.J.; Gan, Y.W.; Duan, Z.P.; Hao, X.D.; Xu, W.L.; Lv, X.; Li, L.H. Competitive interaction in a jujube tree/wheat agroforestry system in northwest China’s Xinjiang Province. Agrofor. Syst. 2017, 91, 881–893. [Google Scholar] [CrossRef]
- Zhang, W.; Xu, W.L.; Ahanbieke, P.; Wang, B.J.; Hao, X.D.; Zhu, Y.; Li, L.H. Competition for 15N-labeled nitrogen in a jujube tree (Zizyphus jujuba Mill.)/wheat (Triticum aestivum L.) agroforestry system in northwestern China. Agrofor. Syst. 2019, 93, 2097–2110. [Google Scholar] [CrossRef]
- Shi, Z.L.; Li, X.Y.; Zhang, L.; Wang, Y.Q. Impacts of farmland conversion to apple (Malus domestica) orchard on soil organic carbon stocks and enzyme activities in a semiarid loess region. J. Plant Nutr. Soil Sci. 2015, 178, 440–451. [Google Scholar] [CrossRef]
- Wright, A.L.; Provin, T.L.; Hons, F.M.; Zuberer, D.A.; White, R.H. Dissolved organic C in soil from compost- amended bermudagrass turf. HortScience 2005, 40, 830–835. [Google Scholar] [CrossRef] [Green Version]
- Janzen, F.H.; Campbell, C.A.; Brandt, S.A.; Lafond, G.P.; Townley-Smith, L. Light-fraction organic matter in soils from long-term crop rotations. Soil Sci. Soc. Am. J. 1992, 56, 1799–1806. [Google Scholar] [CrossRef] [Green Version]
- Gregorich, E.G.; Janzen, H.H. Storage of soil carbon in the light fraction and macroorganic matter. In Structure and Organic Matter Storage in Agricultural Soils; Carter, M.R., Stewart, B.A., Eds.; Lewis Publishers, CRC Press: Boca Raton, FL, USA, 1996; pp. 167–190. [Google Scholar]
- Lefroy, R.D.B.; Blair, G.J.; Strong, W.M. Changes in soil organic matter with cropping as measured by organic carbon fractions and 13C natural isotope abundance. Plant Soil 1993, 155–156, 399–402. [Google Scholar] [CrossRef]
- Blair, G.J.; Lefroy, R.D.B.; Lisle, L. Soil carbon fractions based on their degree of oxidation, and the development of a carbon management index for agricultural systems. Aust. J. Agric. Res. 1995, 46, 1459–1466. [Google Scholar] [CrossRef]
- Post, W.M.; Kwon, K.C. Soil carbon sequestration and land-use change: Processes and potential. Glob. Change Biol. 2000, 6, 317–327. [Google Scholar] [CrossRef] [Green Version]
- Yang, Y.S.; Guo, J.F.; Chen, G.S.; Yin, Y.F.; Ren, G.; Lin, C.F. Effects of forest conversion on soil labile organic carbon fractions and aggregate stability in subtropical China. Plant Soil 2009, 323, 153–162. [Google Scholar] [CrossRef]
- Laganière, J.; Angers, D.A.; Paré, D. Carbon accumulation in agricultural soils after afforestation: A meta-analysis. Glob. Change Biol. 2010, 16, 439–453. [Google Scholar] [CrossRef]
- Gale, W.J.; Cambardella, C.A.; Bailey, T.B. Root-derived carbon and the formation and stabilization of aggregates. Soil Sci. Soc. Am. J. 2000, 64, 201–207. [Google Scholar] [CrossRef]
- Jobbágy, E.G.; Jackson, R.B. The vertical distribution of soil organic carbon and its relation to climate and vegetation. Ecol. Appl. 2000, 10, 423–436. [Google Scholar] [CrossRef]
- Lee, K.H.; Jose, S. Soil respiration and microbial biomass in a pecan-cotton alley cropping system in Southern USA. Agrofor. Syst. 2003, 58, 45–54. [Google Scholar] [CrossRef]
- Skopp, F.; Jawson, M.D.; Doran, J.W. Steady-state aerobic microbial activity as a function of soil water content. Soil Sci. Soc. Am. J. 2000, 54, 1619–1625. [Google Scholar] [CrossRef] [Green Version]
- Barbara, S.; Fabrizio, A. Biodegradability of soil water soluble organic carbon extracted from seven different soils. J. Environ. Sci. 2009, 21, 641–646. [Google Scholar] [CrossRef]
- Zhang, F.B.; Song, C.C.; Yang, W.Y. Land Use Effects on the Distribution of Labile Organic Carbon Fractions through Soil Profiles. Soil Sci. Soc. Am. J. 2006, 70, 660–667. [Google Scholar] [CrossRef]
- Kalbitz, K.; Solinger, S.; Park, J.H.; Michalzik, B.; Matzner, E. Controls on the dynamics of dissolved organic matter in soils: A review. Soil Sci. 2000, 165, 277–304. [Google Scholar] [CrossRef]
- He, Y.; Xu, Z.H.; Chen, C.R.; Burton, J.; Ma, Q.; Ge, Y.; Xu, J.M. Using light fraction and macroaggregate associated organic matters as early indicators for management-induced changes in soil chemical and biological properties in adjacent native and plantation forests of subtropical Australia. Geoderma 2008, 147, 116–125. [Google Scholar] [CrossRef]
- Bremer, E.; Janzen, H.H.; Johnston, A.M. Sensitivity of total, light fraction and mineralizable organic matter to management practices in a Lethbridge soil. Can. J. Soil Sci. 1994, 74, 131–138. [Google Scholar] [CrossRef]
- Dou, F.; Wright, A.L.; Hons, F.M. Sensitivity of Labile Soil Organic Carbon to Tillage in Wheat-Based Cropping Systems. Soil Sci. Soc. Am. J. 2008, 72, 1445–1453. [Google Scholar] [CrossRef]
- Malhi, R.S.; Brandt, S.; Gill, K.S. Cultivation and grassland type effects on light fraction and total organic C and N in a Dark Brown Chernozemic soil. Can. J. Soil Sci. 2003, 83, 145–153. [Google Scholar] [CrossRef]
- Christensen, B.T. Physical fractionation of soil and organic matter in primary particle size and density separates. Adv. Soil Sci. 1992, 20, 1–90. [Google Scholar] [CrossRef]
- Gregorich, E.G.; Carter, M.R.; Angers, D.A.; Monreal, C.M.; Ellert, B.H. Towards a minimum data set to assess soil organic matter quality in agricultural soils. Can. J. Soil Sci. 1994, 74, 367–385. [Google Scholar] [CrossRef] [Green Version]

Publisher’s Note: MDPI stays neutral with regard to jurisdictional claims in published maps and institutional affiliations. |
© 2022 by the authors. Licensee MDPI, Basel, Switzerland. This article is an open access article distributed under the terms and conditions of the Creative Commons Attribution (CC BY) license (https://creativecommons.org/licenses/by/4.0/).