Abstract
The achievement of goals in forest landscape restoration strongly relies on successful plantation establishment, which is challenging in drylands, especially under climate change. Improvement of field performance through stock quality has been used for decades. Here, we use machine learning (ML) techniques to identify key stock traits involved in successful survival and to refine previous specifications that were developed under more conventional stock quality assessments carried out at the lifting–shipping phases in the nursery. Two differentiated stocklots in each species were used, both fitting in the regional quality standard. ML was used to infer a set of attributes for planted seedlings that were subsequently related to survival at the short-term (two years) and mid-term (ten years) in six different species planted in a harsh site with shallow soil that suffered the driest year on record during this study. Whilst stocklot quality, as measured in the lifting–shipping stage, had very poor importance to the survival response, individual plant traits presented a moderate to high diagnostic ability for seedling survival (area under the receiver operating characteristic (ROC) curve between 0.59 and 0.99). Early growth traits catch most of the importance in these models (≈40%), followed by individual morphology traits (≈28%) and site variation (≈2%), with overall means varying across species. Aleppo pine and Phoenician juniper stocklots presented survival rates of 66–78% after ten years, and these rates were below 27% for the remaining species that suffered during the historical drought. In Aleppo pine, the plant attributes related to early field performance (growth in the first growing season) were more important in the drought-mediated mid-term performance than stock quality at the nursery stage. Within the technical framework of this study, our results allow for both testing and refining the regional quality standard specifications for harsh conditions such as those found in our study.
1. Introduction
Forest landscape restoration (FLR) is widely recognized as a universal key tool to cope with environmental and socioeconomic challenges posed by land degradation and climate change [1,2,3], UN sustainable development goal 15. However, achievement of goals in FLR strongly relies on successful plantation establishment, which is usually measured in terms of survival rate [4,5]. The importance of this critical stage goes beyond the biophysical environment of the plantation, affecting the society involved [6], i.e., stakeholders and organizations that support the costs of reforestation and, in the long-run, regional and national policies encouraging ecosystem restoration [7]. Plantation failure is especially critical in drylands such as Mediterranean type ecosystems, where the survival of planted seedlings can be jeopardized, not just by the expected seasonal droughts these regions suffer, but also by extreme drought events that expand beyond the dry season into the growing season and even interannually. To make matters worse, the frequency of these extreme disturbances is foreseen to increase as do their magnitude and severity [8]. Thus, technically, optimizing FLR programs would improve not just successful plantation establishment and its future climatic resilience, but also engagement from stakeholders that would otherwise be disappointed with plantation failures and poor feasibility of ecosystem restoration [1].
Stock quality has been a cornerstone for improving plantation establishment for decades and previous work has demonstrated its important effect in reforestation success (reviewed in [9,10]). In operational FLR programs, the common approach to match stock quality with site constraints is the assessment of different stock types being produced in the nursery and then defining/refining target seedling or quality standards according to the best performing stock types [11,12,13,14,15,16]. However, a drawback of this approach is that it considers the stock type as a whole set of traits ascribed to all individual plants tested in the field, which makes it difficult to identify the most relevant plant traits involved in successful field performance. In addition, the interactions and correlations between traits may dilute the relative importance of single key traits. Assigning a stocklot-averaged trait (e.g., dry weight) to all individuals being tested runs into the inherent variability of the stock [17,18]. Thus, height and diameter are often the only plant traits considered, as measuring most seedlings’ traits requires destructive sampling. Allometric equations can also be deployed to expand the number of individual plant-specific traits.
Forecasting key attributes in individual plants and modeling their relationships with the field response can be alternatively addressed through machine learning techniques (ML). The size of datasets and the computational power easily available nowadays allow for a more fruitful insight into complex ecological interactions and processes through nonlinear models than traditional linear methods, which can hinder reliable identification of relevant variables and interactions [19]. The potential of ML in forest ecology as an alternative to conventional statistical modeling has raised interest in recent years, as it may improve estimations of tree growth [20,21,22] and other complex variables [23]. In this sense, models such as the boosted regression tree (BRT) have provided clear evidence of strong predictive performance [19] and, to the authors’ knowledge, they have not been used in plantation establishment and stock quality improvement so far.
The use of ML for both better identification of relevant attributes and fitting nonlinear functions that relate them with successful field performance might lead to improved and refined stock specifications in programs where previous research has already established coarse seedling quality standards. This might be especially important with regard to updating standards in a framework of climate change, with increasing aridity and warming scenarios [24,25,26]. Here, we address these issues in six species, commonly used in FLR in Mediterranean type ecosystems, planted in a harsh dryland affected by the driest year on record. The main objective of the present work is to assess the influence of plant traits on field performance in both the short- and mid-term after an extreme drought and harsh conditions. By means of this assessment, we aim to answer the following questions: (i) Is the early field response related to the mid-term response after the occurrence of severe meteorological events (drought)? (ii) Related to that, were the stock quality traits involved in the early field performance still involved in successful drought response in the mid-term? (iii) If not, which stock specifications are more advisable to cope with extreme drought events and what relative importance do they have on the drought-affected mid-term response? The answers to these questions allow to know whether current stock quality standards are broad/specific enough to promote successful plantation establishment over time in the face of extreme droughts or if there is rather a need to refine current specifications. Additionally, the role of ML techniques in this regard is addressed.
2. Materials and Methods
2.1. Site Characterization
The field experiment was conducted within a reforestation program carried out in 2008 at “La Muela de Cortes” site, in the province of Valencia, Spain (39°13′ N; 0°53′ W; 794 m a.s.l.). The geomorphology corresponds to a flat-topped mountain (butte) where parent material is a consolidated cretaceous limestone with a haplic calcisol developed over it. The soil is shallow (<30 cm), very rocky, and with substantial accumulation of lime, pH is 8.04, and the texture is clay-loam to silty-clay-loam. The climate is dry sub-humid Mediterranean with annual precipitation of 510 mm (10% in summer, 1999–2019, Cortes de Pallás-Casa del Barón station, from the CHJ-SAIH weather network) and an average temperature of 13.8 °C (2005–2019, SIAR network). More details about the site and natural vegetation can be found in [27].
2.2. Experimental Design: Species, Stocklots, and Layout
A total of six species were considered in this study (Table 1). All the species are native to the area and regenerate naturally. For this work, two stocklots per species from different forest nurseries were used (Table 1). According to [16], we use the term stocklot as the stock type is the same. Stocklots were grown under different growing regimes according to the nursery, and differences in the application of culture variables resulted in different stock quality, although in all cases it was within acceptable ranges (see below), according to stock quality. Stock quality standards for the most important species in FLR in the Valencia region have been developed [28]. Additionally, the stocklots were considered suitable to encompass broad variation in seedling traits and to assess potential differential responses.

Table 1.
Species and stocklots’ distribution in the experimental plot.
An experimental plot was established between late January and early February 2008 within the boundary of the reforestation consisting of a complete randomized block array with three blocks of 150 × 50 m each, containing replications of 50 plants per stocklot (150 seedlings per stocklot, Supplementary Table S1). Site preparation was performed by removing pre-existing natural vegetation and opening up 40 × 50 × 50 cm (depth, width, length) pits by means of a backhoe excavator. The oaks and the Strawberry tree were planted with tree-shelter (ventilated, 60 cm-tall) following this common practice in hardwood plantations in the region. Each plant was individually labeled so that the species, stocklot, block, and plant number within the block were identified. Environmental conditions were also monitored during the study period, including precipitation (P), temperature (T), relative humidity (RH), and soil moisture (SM) (further details in [27]).
2.3. Traits Selected and Post-Planting Monitoring
In this study, we use the term trait synonymously with the term attribute. Different traits were selected and categorized as stock quality traits and individual plant traits (Table 2). Traits have been grouped into root, shoot, nutrient, and performance traits (Table 2).
Table 2.
Stock quality attributes and plant traits used in this work and the abbreviations used in both the stock quality assessment and the individual plant assessment. In the latter case, the relative error, R2, and sample size are presented for the estimated traits with artificial neural networks (SLA was also estimated as the ratio FAp/DW_f).
Stock quality traits were measured on a sample of plants randomly selected (representative) from each participating stocklot between December 2007 and January 2008 (i.e., for a given trait, there can be slight variations between this sample’s mean and that of the planted seedlings). The stocklots were received at the reforesting site and kept in a sheltered area to supply the planting gangs. This assessment was carried out following the usual way stock quality is assessed in operational programs. Previous work has established target seedling quality standards for the main species used in the region of Valencia [13,14,15,28,29]. Following the methodology described therein (especially in [15]), morphological, physiological, and performance traits were considered in the 12 stocklots (Table 2). These values are presented in Table 3 together with the species’ target specifications (when they exist) or the grand average for the species in the Valencia region gathered from the authors’ database (values corresponding to surveyed stocklots produced and planted since 2002, unpublished data).
Table 3.
Mean values and standard deviation (omitted in some variables for simplicity) for the morphological, physiological, and performance seedling quality attributes measured on the 12 stocklots of the six participating species (between December 2007 and January 2008). Shaded area and italic font correspond to the values established for the target seedling obtained from several years of improvement across the region of Valencia. For Lusitanian oak (QUFA), this standard is not established, and the values correspond to the historical average of surveyed stocklots produced and planted since 2002. The number of stocklots out of which the average is computed is presented in parentheses besides the species’ code. Abbreviations are presented in Table 1 and Table 2.
Individual plant traits were directly measured or estimated for each planted seedling and include morphological and early field-growth traits. Height (Hp, cm; vertical distance from ground to terminal leader tip) and diameter (Dp, mm; on main stem at approximately 1 cm aboveground) were directly measured on each seedling right after out-planting in February 2008. The sturdiness index (Hp/Dp) was computed directly from both traits. Seedling stem volume (Vol, cm3) was calculated as an integrated metric of seedling’s size from Hp and Dp measurements, by using the formula for an elliptical cone: V = (πD2/4) H/3. By using Hp and Dp together with the stock quality traits, additional plant traits were estimated for each seedling by means of artificial neural networks (this method yielded a better fit than linear allometric equations), as detailed in [27] (Table 2). By this means, besides dry weights, foliar area (FAp, cm2), and root area (RAp, cm2), we calculated for each planted seedling the Dickson index (QI), the specific leaf area (SLAp, cm2/g), and an estimator of wood density (Vol divided by the estimated stem dry weight) (Table 2).
Growth-related traits derive from field assessment campaigns (Figure 1) carried out during the first two years after out-planting (June 2008, November 2008, November 2009) and in the tenth year (July 2018), by repeated measurements of height, diameter, and survival on all planted seedlings. The growth was expressed as monthly absolute increments in height (cm/month), diameter (mm/month), or volume (cm3/month) and noted as: IncH1, IncH2, IncD1, IncD2, IncVol1, and IncVol2, where 1 and 2 refer to the first growing season (February/March to June 2008) and the first summer period (June to November 2008), respectively. Both the first growing season and first summer period were considered as early plant-growth traits.
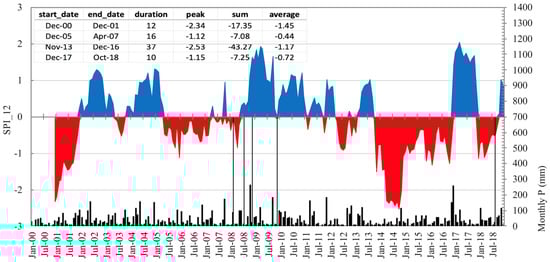
Figure 1.
Evolution of the drought index (SPI) [30] at 12 months’ time scales in the study area for the period 2000 to 2018. Red and blue areas correspond to drought and wet spells, respectively. The five thin black vertical lines refer to dates of field assessment in this study, where the first three lines encompass the two early growth periods considered (first spring and first summer). Black vertical bars refer to monthly precipitation. The inset table represents the values of duration, intensity, and magnitude of the four most important drought spells in the series in units of SPI-12.
2.4. Data Analysis
Factorial analysis was used to assess the similarity/dissimilarity between both stocklots with regard to the species’ standard (Table 3) in a reduced number of variables. The principal component analysis extraction method was used. Artificial neural networks (ANN) were performed by means of the MLP (Multilayer Perceptron Network) in SPSS 22.0 [31] in order to estimate plant-based traits using empirical data from the authors’ database, as previously mentioned.
Differences in field performance (survival and early growth) between both stocklots in a species were tested by using a Student’s t-test, assuring that the conditions were met (gaussian distribution, variance homogeneity, and independence of the data). The importance of the different traits on plantation establishment was analyzed for both survival rate (November 2008, 2009, and 2018) and early growth rate in the first spring and first summer (i.e., IncH1 and 2, IncD1 and 2, and IncVol1 and 2). In the survival analysis in 2009 and 2018, the early growth rates from both seasons were included as predictor traits, whereas in the survival analysis in November 2008, only the spring’s early growth rate (suffix 1) was considered (as summer growth was computed only on alive plants in November 2008). The relative importance or contribution of predictors was assessed through boosted regression trees models (BRT) performed in R software (R Foundation for Statistical Computing, Vienna, Austria) [32] using the “gbm” package [33,34]. Stock quality traits were included as binomial variables (two values, one per stocklot). The inclusion of potentially irrelevant predictors is not of concern because these are unlikely to be selected during tree fitting, thus causing minimal effect on prediction [19]. BRT were set considering Bernoulli (survival) or Gaussian (growth) distribution families, learning rates of 0.001–0.0001, tree complexity of 4–15, and bag fractions of 0.5–0.75. The minimum number of trees was in most cases held above 1500. In the survival models, the area under the ROC curve was used as an indicator of goodness of fit, while in the growth models the correlation coefficient was used. The results of this analysis provide the relative influence (RI, %) of the predictors (traits) on the response variable (survival and growth). The higher the RI, the stronger the influence of the predictor on the response variable. For those predictors with higher RI, partial dependency plots (PDP) were produced by using the same package in R.
3. Results
3.1. Meteorological Conditions in the 10-Year Period after Out-Planting
The planting year (2008) was the wettest on record (730 mm), and 2009 was slightly above the average (558 mm). In 2009, there was a short but acute dry spell spanning from 9 April to 9 August, with cumulated rainfall of 64 mm, about 35% of the 2000–2019 expected value in the same months (not detected in the SPI-12). Years 2012 and 2014 were 75% below the average, and the spell between September 2013 and August 2014 registered only 183 mm (less than 40% of the average). This drought led to a 12-month SPI peak value of −2.53 (Figure 1), magnitude of −43 (SPI units), and duration of 37 months, underpinning the considerable anomaly of this drought. Mean annual temperature ranged between 12.9 (2008) and 15.2 °C (2015) [27]. Soil moisture during the critical first year after planting was above the wilting point (assuming a bulk density of 1.27 g/cm3) in the undisturbed soil, except for the expected dry summer months (Supplementary Figure S1).
3.2. Stock Quality Influence in Out-Planting Performance
The principal component analysis extracted four factors with a total explained variance of 86% (Supplementary Table S2) and showed that both stocklots in each species were markedly different to each other, with the value of the standard being closer or farther apart from one stocklot depending on the factor being considered (Figure 2). The four factors grouped stock quality attributes according to shoot (F1), root (F2), performance (F3), and nutrients (F4, Supplementary Table S3). For example, PIHA-HU was closer to the recommended standard in F1, F2, and F4, but PIHA-TM showed F3 (root growth potential) closer to the target (Figure 2). In Maritime pine, both stocklots differed, mostly in root growth potential and nutrient concentration (Figure 2). Oaks from the Madrid Nursery (-TM)were larger and had higher nutrient concentrations that the stocklots produced in the other nurseries (Figure 2).
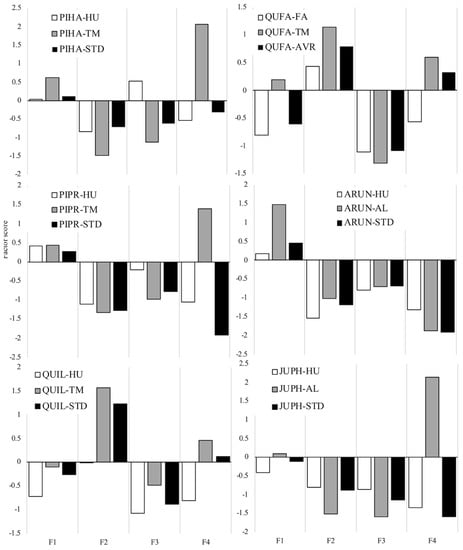
Figure 2.
Values of the four components (F1, F2, F3, F4) extracted from the factor analysis for the two stocklots in each species used in this study and that of the species’ standard (STD) for the Valencia region. In the case of Lusitanian oak (QUFA), the average is used as the reference (AVR). See Table 1 for abbreviations of the species and stocklots. The correlations between the initial variables and the components are shown in Supplementary Table S3.
Seedling survival was higher in Aleppo pine and Phoenician juniper (Figure 3), especially at the end of the study, when the remaining species showed very low rates (<27%). For a given species, in spite of the marked differences in stock quality between both stocklots, their temporal trend of survival showed similar patterns over time (Figure 3), with only marginal differences in Aleppo pine (early survival 2008 and 2009) and Phoenicean juniper (mid-term survival, 2018), and very significant differences (p < 0.01) only in the first assessment in Holm oak (survival 2008) (Figure 3, Supplementary Table S4). Regarding growth performance, the evolution of the total cumulated growth in height and diameter throughout the 10-year period shows two distinct patterns (Figure 4): the hardwoods, which readjusted their morphology under the constraining environmental conditions (especially height: in some cases, the 10-year height was lower than at planting time), and the conifers (pines and juniper), which presented increasing values for the 10-year period in all cases. In Holm oak and Strawberry tree, a differentiated growth pattern can be observed: the initial differences in size persisted during the first establishment phase (2008–2009), but after 10 years, both series converged to the same height and similar diameter, so that the larger stocklots strongly decreased in height. Statistical tests were performed on the monthly increments of height, diameter, and volume during the first year, and revealed different early growth performance between both stocklots in the six species studied (Supplementary Table S4), thus pointing out that stocklot-based differences in early growth did not translate entirely into final size and/or survival values in the mid-term, when mediated by a severe drought.
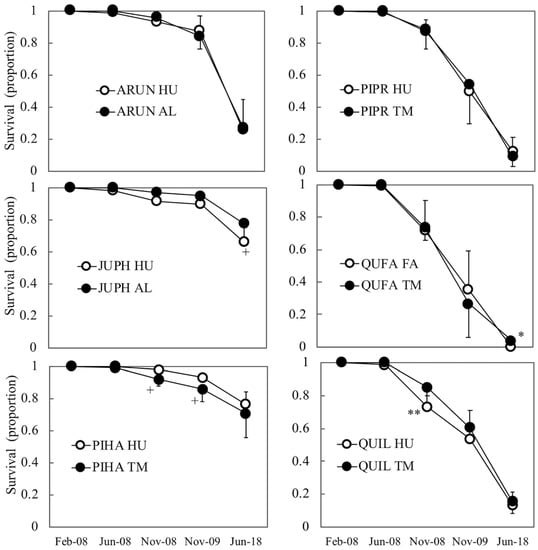
Figure 3.
Mean values of field survival for both stocklots in a species throughout the 10-year period studied. In 2008 (planting year), both the spring (June) and the post-summer (November) values are shown. In a species, asterisks (or + sign) mean significant differences between both stocklots in that assessment (+: p ≤ 0.1, *: p ≤ 0.05, **: p ≤ 0.01). Bars correspond to standard deviations. See Table 1 for abbreviations.
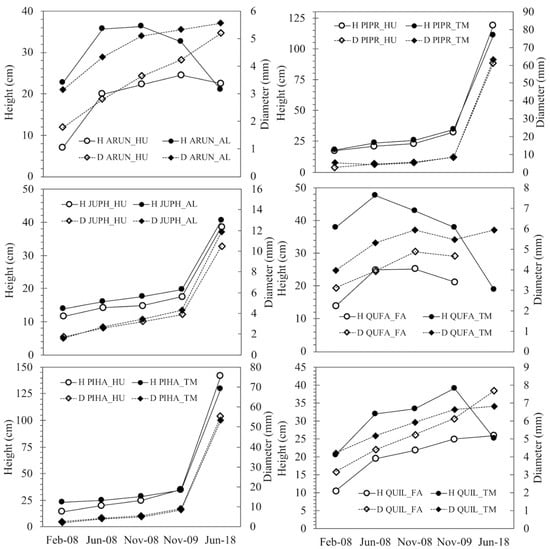
Figure 4.
Evolution of the mean values of plant height and basal diameter for both stocklots in a species throughout the 10-year period studied. In 2008 (planting year), planting (February), spring (June), and post-summer (November) values are shown. Bars correspond to standard deviations. See Table 1 for abbreviations.
3.3. Relative Influence of Traits in Out-Planting Performance
3.3.1. Survival Performance
The analyses performed through BRT for survival yielded models with cross-validation (cv) ROC scores that ranged between 0.59 and 0.87 for the juniper and Maritime pine (Supplementary Table S5). The area under the ROC curve in the training dataset was above 0.70 in any case (Supplementary Table S5). The study of RI of the predictor variables (traits and block) on seedling survival showed that individual plant traits (morphological and early growth performance) presented an overwhelming importance over stock quality traits on this response regardless of the time elapsed since planting (1–10 years), with RI between 58% and 77% (Figure 5; Supplementary Table S6). Site variation (experimental block) and especially stock quality had very low RI in all cases (less than 2% in the latter). These RI values were weighted by the corresponding cv ROC score from Supplementary Table S5 and indicate how much the predictors contributed to the distinction between alive and dead plants.
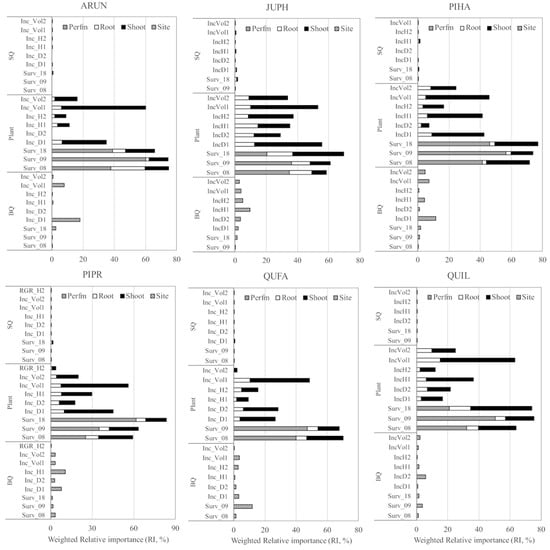
Figure 5.
Relative importance (RI, %, obtained from BRT models) for the different sets of traits and independent variables on both plantation survival (2008, 2009, and 2018) and early growth traits (increments in diameter, D, height, H, and volume, Vol, in the first growing season, 1, and in the first summer, 2). The sets of predictors for survival are site (or experimental block, BQ), the quality attributes of the stocklot (SQ), and the individual plant traits (grouped in shoot, root, and early growth performance). For the early growth response, the sets are BQ, SQ, and individual plant traits grouped in shoot and root. RI was weighted by the cv ROC score (survival) or the cv correlation (early growth traits). Partial dependence plots for the most influential independent variables are presented in Figure 6 and Figure 7, and Supplementary Figures S2 and S3. Codes of the species are shown in Table 1. In PIPR, the monthly relative growth rate (RGR) for height growth in summer was used instead of the net increment as no model could fit in the latter. In QUFA, no model was fit for survival at the mid-term due to total mortality in one stocklot (coefficient estimates were inflated).
It is remarkable that early growth rate traits were more important than morphological plant traits (root and shoot) (Figure 5; Supplementary Table S6), pointing out the importance of the former on plantation success. Partial dependence plots (PDP) of the four highest-ranked predictors (Figure 6 and Supplementary Figure S2) reveal which early growth rates contributed more and when (spring and summer) in each species’ survival. Additionally, SLA, QI, slenderness, wood density, total dry weight, stem volume, and stem diameter were traits showing high RI on survival across species (Figure 6 and Supplementary Figure S2).
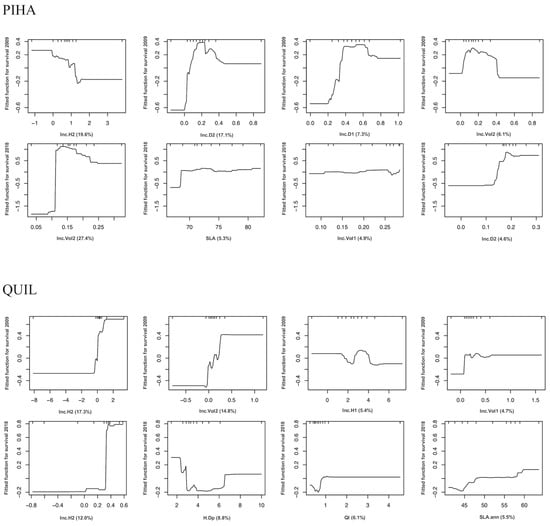
Figure 6.
Partial dependence plots (PDP) of boosted regression tree (BRT) models showing the fitted functions of the 4 highest-ranked predictors (higher relative importance in the BRT models) on plantation survival performance (2009 and 2018) of Aleppo pine and Holm oak. Full sets of PDP for 2008, 2009, and 2018 in all species are presented in Supplementary Figure S2. The y-axis is centered to have zero mean over the data distribution and spans the same range (in units of logit (p) from the mean predicted response value) across all plots to make the magnitude of the effects comparable among predictors. X-axes show rug plots that visualize the distribution of the respective data space in deciles, in order to avoid overinterpreting regions with almost no data. Full names and units of the predictors (x-axis) are provided in Table 2.
3.3.2. Early Growth Performance
The BRT models fitted for early growth performance (spring, 1, and summer, 2, both in 2008) yielded low cv correlations that were always below 0.70, although training data correlations rose up to a range between 0.5 and 0.85 (Supplementary Table S7). On average, between 6% [45%] (Strawberry tree) and 20% [58%] (Phoenician juniper) of the early growth performance was predicted (explained) by the BRT models, where the text between brackets refers to RI values weighted by the training data correlation. In any case, spring’s growth rates were much better explained than summer’s rates (Supplementary Table S7, Figure 5).
Regarding the predictor sets, the impact of individual plants’ shoot and root traits on their early growth rates was noticeable (Figure 5, Supplementary Table S8), while the stock quality presented, also in this case, very poor importance in the fitted models. Shoot plant traits were more important (RI ≈ 22% (49%) on average) than root traits (RI ≈ 6% (15%) on average) in the early growth performance of planted seedling. Figure 7 and Supplementary Figure S3 show the PDP of the four highest-ranked individual traits or predictors.
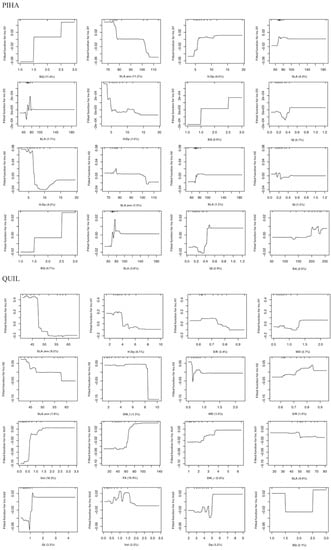
Figure 7.
Partial dependence plots (PDP) of boosted regression tree (BRT) models showing the fitted functions of the 4 highest-ranked predictors (higher RI in the BRT models) on the early growth performance (monthly lapse) of Aleppo pine and Holm oak: diameter growth (IncD), height growth (IncH), and volume increment (IncVol), computed either in the first spring or in the first summer after planting (suffixes 1 and 2, respectively). Full sets of PDP for all species are presented in Supplementary Figure S3. The y-axis is centered to have zero mean over the data distribution and spans the same range (in units of standard deviation from the mean predicted response value) across all plots to make the magnitude of the effects comparable among predictors. X-axes show rug plots that visualize the distribution of the respective data space in deciles, in order to avoid overinterpreting regions with almost no data. Full names and units of the predictors (x-axis) are provided in Table 2.
4. Discussion
The results presented here show that the performance of the six species used in this plantation was little affected by stock quality traits as operationally assessed, whilst the role of individual plant traits (particularly early growth rate) proved to have way more potential to explain seedling survival both in the short-term and 10 years after planting. According to a literature review performed in our previous work ([27], summarized in Table 4), the field performance observed in 2008–2009 (short-term) for all the species can be considered as higher than or similar to that reported in similar works, except for the Lusitanian oak. In the mid-term, however, growth performance in this trial was poor for all species but the juniper, and 10-year survival was only high for the juniper and Aleppo pine. These results are not surprising, as meteorological conditions at our site during the first year were very favorable, but very dry in the mid-term analysis.
Table 4.
General assessment of field performance in survival and growth in both the early (first two years) and the mid-term (10 years) for the six species assayed in this work within the framework of previously published works (see text for references). ↑ and ↓ arrows stand for higher or lower performance in this work, whilst ≈ stands for similar performance. Mid-term studies were not found for some species.
4.1. Limited Role of Stock Quality Traits in Plantation Establishment
The influence of stock quality was absent or weak on survival for most species: marginally significant in PIHA (2008 and 2009) and JUPH (2018) and significantly different in QUIL (2008) and QUFA (2018). One key question arising about stock quality is, given the ample differences between both stocklots tested in the six species, but the relatively low differences in survival regardless of time, is there further room for stock quality improvement? Favorable out-planting conditions (in our case meteorology during the first year) are known to dilute the effect of stock quality on plantation establishment [4,14,16,35], but there was, on the other hand, the driest year on record 5–6 years after planting, an environmental filter that should have had the opposite effect. Two options might be considered here: One is that the current specifications of stock quality (Table 3) are broad enough that both stocklots fit in it and hence their response is very similar. This would mean there is little margin to gain higher establishment rates from stock quality improvement. The second possibility is that, after the first two years (with low impact of stock quality on field performance because of the meteorology), the response becomes mostly conditioned by environmental conditions in the site [36], and hence, two stocklots with similar field performance after two years will continue showing similar patterns despite their initial differences in quality. That is to say, the difference at year two between different stock qualities would maintain a parallel trend across time. However, this latter possibility does not agree with previous studies in similar climatic conditions and the same species [37,38], hence the first option is more likely.
The added value of the present work is that we indeed demonstrated that there can be further improvement in plantation establishment through phenotypical seedling quality in cases such as the one studied here, with a robust and tested standard. Morphological traits are robust and reliable indicators of seedling quality [39]. Quality standards are usually defined sensu [11], focusing on the stock being produced in operating nurseries and tested for field performance [28]. By operating in this way, the standard may be somewhat stilted and difficult to match as a whole for nurserymen (both material and performance traits). This was indeed corroborated in our stocklots, with shoot, root, performance, and nutrient traits (Factors 1–4, Figure 2) being more or less close to the standard depending on the stocklot. Our fitted models underpinned that individual plant traits were way more important than the stocklot-based traits when jointly assessed. In the conventional approach (e.g., [14,15], but see [10,40] for a full list of references), the inherent variability of stock-based traits in the samples used [17,18] hampers further insight on the role of a particular trait on field performance. Individual seedling traits capture the features of the evaluated plant much better, whilst stock quality traits are coarse averages. This lack of direct evidence may lead to specifying imprecise or wide ranges for important attributes, or just the opposite [16], which was likely the case in our stocklots and standards shown in Table 3.
Another issue to consider is the time elapsed between stock quality assessment and planting, that in some cases can be separated by some months. Both factors (time elapsed and representativeness of the sample) may counteract and/or dilute the predictive ability of stock quality traits, especially if the stocklot is heterogeneous and culling was not accomplished in the nursery as a cultural treatment [11,41]. In our case, some stocklots with irregular nursery germination and morphology (JUPH, PIPR-TM, QUFA-TM, and ARUN-AL) presented significant differences between the mean height measured in the nursery-based quality assessment and that measured at the planting date in the field (February–March 2008, data not shown).
4.2. Individual Plant Traits and Plantation Establishment
In this section, we elaborate on how our results can be useful to further improve target seedling specifications. Although the survival models presented good fit, the growth models have performed very differently depending on the season (spring vs. summer). Hence, we recommend caution when considering our summer-based growth modeling. Given the ability of BRT to handle complex relationships and interactions among predictors, these results point to a strong influence from other factors affecting seedling performance during summer that are missing in our models, such as physiological traits, soil moisture, pit depth, and other microsite-operating factors [29,42]. However, within the technical framework of this study and the scope of action for improving stock quality, our results could still be useful for both testing and improving the regional quality standard specifications for the harsh conditions found in our study. Notwithstanding the importance of such an outcome, we consider it more fruitful to the broad audience to put the emphasis on the usefulness and potentiality of our modeling approach, rather than just addressing a locally tuned standard for six species. For this reason, we take Aleppo pine and Holm oak as examples, both thoroughly used in reforestation programs [43] and with unequal performance in this study.
The role of stock quality on Aleppo pine plantation establishment has been profusely studied for decades and has been confirmed in this species and for similar sites [13,14,15,29,38]. In this study, PIHA-HU agreed well with the standard in shoot, root, and nutrient traits. Indeed, this stocklot presented better early performance than PIHA-TM in survival (6% more, p-value < 0.1), growth rates (H1, H2, and Vol2, p-value < 0.05), and final absolute height and diameter, so it would be recommendable to keep the current morphological standard and even revise its RGP upwards, given the higher values of PIHA-HU (Factor 3, Figure 2). However, it would be highly arguable to rule out PIHA-TM according to this study’s results (only 5% of difference in 10-year survival after the driest year on record), so it seems more practical to look at the role of traits in individual plants. In this case, the largest influence on survival was exerted by the early growth rates (Figure 6), pointing out the fundamental role of this process [4,36]. PDP allow for a visualization of the effect of a single predictor on the fitted function (response) after accounting for the average effects of remaining predictor variables in the model [19]. The fitted functions in gbm.plot (Figure 6 and Figure 7) are centered by subtracting their mean and the units correspond to one standard deviation, i.e., 34.1%. The survival models for 2009 and 2018 (Figure 6) showed that seedlings with IncH2 < 1 cm/month, IncD2 between 0 and 0.4 mm/month, and IncVol2 > 0.11 cm3/month exhibited greater survival. As no morphological traits were selected here (only early growth), these must be researched in the PDP of Figure 7, which show the corresponding fitted functions between growth and morphological traits. Here, some traits have been found to hold higher importance than others: SLA, slenderness, and QI. SLA is related to the cost of deploying new leaves and indicative of an acquisitive vs. conservative resource-use strategy [44]. QI and slenderness are in turn indicative of a balance between shoot and root parts [10]. In this species, the mid-term assessment after the severe drought still maintains similar traits and functions, and accordingly, they could be used regardless of the climatic uncertainty.
In Holm oak, the short-term assessment indicated a superior performance of the larger stock QUIL-TM (13% more survival than QUIL-HU and higher IncH1 and IncVol1, but less IncD1). The current standard for the species is indeed closer to QUIL-TM in morphology and nutrients than to QUIL-HU (Figure 2). However, a close-up examination of the individual traits in the standard (Table 3, see, for instance, SQ.H, SQ.D, SQ.SW, and SQ.RW) reveals that many of them present such a wide variation (standard deviations) that it hinders practical decision making in operational programs and poses many doubts about the existence of threshold values for stock culling. Looking at the PDP, the fitted function for survival 2009 assigned about one half of the importance to IncH and IncVol, highlighting the negative influence of growth decrements (negative) on survival. Following a similar rationale to that in Aleppo pine, positive increments of H1, Vol1, H2, and Vol2 are related to SLA, total dry weight, wood density, stem volume, QI, and stem diameter (Figure 7). However, it must be said that these considerations apply up to 2009 (harsh sites in the absence of severe climatic filters), but not for the mid-term assessment (2018), when the survival difference between QUIL-HU and QUIL-TM was negligible and the former (the smaller one farther apart from the standard) even presented a better growth response (steady increment across time, Figure 4), an indicator of successful establishment [4]. Consistent with these results (10-year survival was just 14%), this species should be avoided in future reforestations in similar sites, but in any case, the BRT models would indicate that some traits now have a different interpretation than in 2009 (e.g., sturdiness, QI, and SLA, Figure 7), whereas others remain similar (wood density and dry weights). “U”-shaped PDP such as that of the sturdiness were common in our study and suggest a dual-resource use strategy, where small seedlings may benefit from higher relative growth rates that produce new tissues more efficiently coupled to soil and site conditions, and functionally and anatomically adapted to water availability, whilst larger seedlings would benefit from higher gross growth rates that in turn allow for a more efficient and fast exploration of the soil profile, especially given the favorable weather during 2008 in our case [10,36,45]. On the other hand, moderately sized seedlings would be farther apart from both strategies, as they need to cope with both acclimatization [6] and the development of enough root tissue to reach safe spots in the soil profile (deep cracks in the limestone).
Such a dual pattern would be very difficult to detect with conventional mathematical equations. In contrast, ML techniques based on nonlinear modeling (BRT) are flexible and allow for a better representation and fit of the cause–effect relationships, improving the understanding of the field response. However, it must be stressed that, although PDP provide a useful tool for interpretation, they are not a perfect representation of the relationship between the predictor and the response, especially if there are interactions or the predictors are strongly correlated [19]. Additionally, collinearity among predictor variables might have biased the relative importance in some of them.
Finally, evaluating stock according to the specifications retrieved from the PDP is not straightforward, as these thresholds are obtained for individual plants in the field and must be re-scaled to nursery stock. For instance, the stem diameter was underestimated by 18% in our planted trees, likely due to the different ground level reference after planting, sample variability, etc. This mismatch has consequences on the remaining variables being computed out of plant height and diameter, that must be re-scaled accordingly.
5. Conclusions
According to our results, early field response cannot be considered a reliable indicator of mid-term performance when an extreme drought has impacted the plantation: some species (Holm oak, Maritime pine, and Strawberry tree) were almost completely filtered out after a good/acceptable early field response. On the other hand, the juniper and Aleppo pine presented acceptable establishment rates after the historic drought recorded in this site. In these species, the plant traits related to early field performance were maintained in the drought-mediated mid-term performance, whereas in drought-sensitive species, the traits involved in successful early performance might not hold, or might even present the opposite effect in successful drought response in the mid-term. Similarly, stock quality standards obtained on the basis of coarse averages (and standard deviations) rather than on individual plant traits might not be specific enough to warrant successful plantation establishment over time in the face of extreme climate disturbances. In this sense, nonlinear modeling has proven to be way more useful in revealing the impact of specific morphological traits on successful field performance.
Supplementary Materials
The following are available online at https://www.mdpi.com/article/10.3390/f13020168/s1, Figure S1: Volumetric soil water content during the first year of plantation 2008 at two different points: undisturbed soil and stirred soil in the planting spot. Soil moisture content at the permanent wilting point was computed by introducing sand and clay contents in Saxton’s Equations, which provided a bulk density of 1.27 g/cm3 (https://hrsl.ba.ars.usda.gov/soilwater/Index.htm, accessed on 8 December 2021). Figure S2: Partial dependence plots (PDP) of the four most influential variables or predictors (higher relative importance in the BRT models) on plantation survival performance (2008, 2009 and 2018). Y axis centered to have zero mean over the data distribution, Figure S3: Partial dependence plots (PDP) of the four most influential variables or predictors (higher relative importance in the BRT models) on early growth performance: diameter growth (IncD), height growth (IncH) and volume increment (IncVol), all of them computed for the first spring and first summer after planting (suffixes 1 and 2 respectively) and at monthly interval. Y axis centered to have zero mean over the data distribution, Table S1: Distribution of species and stocklots in the experimental plot. Each cell corresponds to a planting row of 150 m long with 50 seedlings. The layout of the blocks in the experimental plot is fit to 36 parallel rows of 150 m long each (i.e. the table does not reflect the layout on the terrain), Table S2: Summary of the principal component analysis showing the total variance explained in for four components extracted, Table S3: Rotated Component Matrix indicating the correlations between initial variables and the rotated components. Extraction Method: Principal Component Analysis. Rotation Method: Varimax with Kaiser Normalization. Rotation converged in 5 iterations, Table S4: Early growth (2008) rates for diameter (mm/month), height (cm/month) and volume (cm3/month); and survival (2008, 2009 and 2019) for both stocklots in each species. In the growth rates, suffix 1 relates to spring and 2 to summer. In a species, asterisks (or + sign) mean significant differences according to the t-test between both stocklots (+: p ≤ 0.1, *: p ≤ 0.05, **: p ≤ 0.01, ***: p ≤ 0.001), Table S5: Summary of the Boosted Regression Trees (BTR) models fitted for survival in the first (2008), second (2009) and tenth (2018) year after out-planting. In BRT, the measure of model fit is the total % deviance explained and model predictive performance (the mean CV correlation coefficient of observed vs predicted values derived from 10 folds). Cross-validation correlation coefficients were used to weight the relative importance of the predictors. se: standard error of the coefficients. ROC: area under the ROC curve (0.5–1), Table S6: Relative importance (RI, %, obtained from BRT models) on plantation survival ( 2008, 2009 and 2018) of the different sets of traits or independent variables: site (experimental block, BQ), plant traits (shoot, root and early growth performance) and stock quality traits (shoot, root, RGP and nutrients). RI was weighted by the cv ROC score. Partial dependence plots of the 4 highest-ranked predictors are presented in Figure 6 and S2, Table S7: Summary of the Boosted Regression Trees (BTR) models fitted for traits of early growth performance: monthly increment in diameter (Inc.D), height (Inc.H) and stem volume (Inc.Vol) either in the spring after planting (1) or in the first summer (2). Cross-validation correlation coefficients were used to weight the relative importance of the predictors except Inc. H1 in ARUN where training data correlation was used. se: standard error of the coefficients. In PIPR, the monthly relative growth rate (RGR) for height growth in summer was used instead the net monthly increment as no model could be fitted in the latter, Table S8: Relative importance (RI, %, obtained from BRT models) of the different sets of traits and independent variables: site (experimental block, BQ), plant traits (shoot and root) and stock quality attributes (shoot, root, RGP and nutrients) on plantation early-growth performance (increment in diameter, D; height, H; and volume, Vol; in the first growing season, 1; and in the first summer, 2). RI was weighted by the cv correlation. In PIPR, the monthly relative growth rate (RGR) for height growth in summer was used instead the net monthly increment as no model could be fitted in the latter. Partial dependence plots of the 4 highest-ranked predictors are presented in Figure 7 and S3.
Author Contributions
A.D.d.C. is the lead of the research program, who has been involved in all phases of the work, from its development and design objectives, to the final version of the work (including field campaigns and lab work, data analyses, elaboration of the draft, and writing of the article). G.S.-O. has been actively co-working with A.D.d.C. from the beginning (2007) as a PhD student and his contribution to the work includes data acquisition and validation, formal analysis, data curation, and writing the manuscript. C.J.C. has been involved in the manuscript writing stage, both the original and final drafts, the creation, analyses, and presentation of the published work, as well as review and editing. M.G.-S., A.J.M. and S.R. have collaborated with the writing, review, and editing of the manuscript, providing insights and helpful critical reviews and commentaries. They have also contributed to the creation of the published work, specifically visualization. J.H. has been involved in funding acquisition, management, and coordination responsibility for the research activity, as well as planning and execution, including mentorship external to the core team. All authors have read and agreed to the published version of the manuscript.
Funding
This study is part of research projects: “Comprehensive quality control of the reforestation works in the public forest of Cortes de Pallás, Valencia” signed between UPV-ReForeST and the state-owned company TRAGSA, and “Monitoring and evaluation of the reforestation in the forest V-143 Muela de Cortes, in the municipality of Cortes de Pallás (Valencia), 10 years after its execution” (contract number CNMY18/0301/26), signed between UPV-ReForeST and Valencia Regional Government (CMAAUV, Generalitat Valenciana).
Institutional Review Board Statement
Not applicable.
Informed Consent Statement
Not applicable.
Data Availability Statement
The datasets generated and/or analyzed during the current study are available from the corresponding author upon reasonable request.
Acknowledgments
The authors are grateful to CYGSA staff (María Amparo Barber and Héctor Cantos), Tragsa (Juan Ramón Torres), Vaersa (Pedro Lázaro), and Ana Isabel Aparicio (UPV) for their assistance in the fieldwork during the installation of the plot and early growth measurements. Projects Cehyrfo-Med (CGL2017-86839-C3-2-R) funded by MCIN/AEI /10.13039/501100011033/ and FEDER, SilvAdapt.net (RED2018-102719-T) funded by MCIN/AEI /10.13039/501100011033, and RESILIENT-FORESTS (LIFE17 CCA/ES/000063).
Conflicts of Interest
The authors declare no conflict of interest.
References
- Stanturf, J.A.; Palik, B.J.; Dumroese, R.K. Contemporary Forest Restoration: A Review Emphasizing Function. For. Ecol. Manag. 2014, 331, 292–323. [Google Scholar] [CrossRef]
- Jørgensen, D. Ecological Restoration as Objective, Target, and Tool in International Biodiversity Policy. Ecol. Soc. 2015, 20, 43. [Google Scholar] [CrossRef] [Green Version]
- Jacobs, D.F.; Oliet, J.A.; Aronson, J.; Bolte, A.; Bullock, J.M.; Donoso, P.J.; Landhäusser, S.M.; Madsen, P.; Peng, S.; Rey-Benayas, J.M.; et al. Restoring Forests: What Constitutes Success in the Twenty-First Century? New For. 2015, 46, 601–614. [Google Scholar] [CrossRef]
- Burdett, A.N. Physiological Processes in Plantation Establishment and the Development of Specifications for Forest Planting Stock. Can. J. For. Res. 1990, 20, 415–427. [Google Scholar] [CrossRef]
- Le, H.D.; Smith, C.; Herbohn, J.; Harrison, S. More than Just Trees: Assessing Reforestation Success in Tropical Developing Countries. J. Rural. Stud. 2012, 28, 5–19. [Google Scholar] [CrossRef] [Green Version]
- Margolis, H.A.; Brand, D.G. An Ecophysiological Basis for Understanding Plantation Establishment. Can. J. For. Res. 1990, 20, 375–390. [Google Scholar] [CrossRef]
- UNEP Decision Adopted by the Conference of the Parties to the Convention on Biological Diversity XIII/5 Ecosystem Restoration: Short-Term Action Plan; UNEP: Cancun, Mexico, 2016.
- Seidl, R.; Thom, D.; Kautz, M.; Martin-Benito, D.; Peltoniemi, M.; Vacchiano, G.; Wild, J.; Ascoli, D.; Petr, M.; Honkaniemi, J. Forest Disturbances under Climate Change. Nat. Clim. Chang. 2017, 7, 395–402. [Google Scholar] [CrossRef] [Green Version]
- Grossnickle, S.C. Why Seedlings Survive: Influence of Plant Attributes. New For. 2012, 43, 711–738. [Google Scholar] [CrossRef]
- Grossnickle, S.C.; MacDonald, J.E. Why Seedlings Grow: Influence of Plant Attributes. New For. 2018, 49, 1–34. [Google Scholar] [CrossRef]
- Burdett, A.N. Quality Control in the Production of Forest Planting Stock. For. Chron. 1983, 59, 132–138. [Google Scholar] [CrossRef] [Green Version]
- Rose, R.; Campbell, S.J.; Landis, T.D. Target Seedling Symposium: Proceedings, Combined Meeting of the Western Forest Nursery Associations; Gen. Tech. Rep. RM-GTR-200; US Department of Agriculture, Forest Service, Rocky Mountain Forest and Range Experiment Station: Fort Collins, CO, USA, 1990; 286p.
- Del Campo, A.D.; Navarro-Cerrillo, R.M.; Hermoso, J.; Ibáñez, A.J. Relationship between Root Growth Potential and Field Performance in Aleppo Pine. Ann.For. Sci. 2007, 64, 541–548. [Google Scholar] [CrossRef]
- Del Campo, A.D.; Cerrillo, R.M.N.; Hermoso, J.; Ibáñez, A.J. Relationships between Site and Stock Quality in Pinus Halepensis Mill. Reforestation on Semiarid Landscapes in Eastern Spain. Ann.For. Sci. 2007, 64, 719–731. [Google Scholar] [CrossRef] [Green Version]
- Del Campo, A.D.; Navarro, R.M.; Ceacero, C.J. Seedling Quality and Field Performance of Commercial Stocklots of Containerized Holm Oak (Quercus Ilex) in Mediterranean Spain: An Approach for Establishing a Quality Standard. New For. 2010, 39, 19. [Google Scholar] [CrossRef]
- Pinto, J.R.; Dumroese, R.K.; Davis, A.S.; Landis, T.D. Conducting Seedling Stocktype Trials: A New Approach to an Old Question. J. For. 2011, 109, 293–299. [Google Scholar]
- Folk, R.S.; Grossnickle, S.C. Stock Quality Assessment: Still an Important Component of Operational Reforestation Programs. In National Proceedings, Forest and Conservation Nursery Association; Landis, T.D., Thompson, J.D., Eds.; USDA For. Serv. Gen. Tech Rep. PNW-GTR-419; US Department of Agriculture, Forest Service, Pacific Northwest Research Station: Corvallis, OR, USA, 1997; pp. 109–119. [Google Scholar]
- Kooistra, C.; Brazier, D. Seedling Standards and Need for Them. In National Proceedings: Forest and Conservation Nursery Associations; USDA, Forest Service, Southern Research Station: Asheville, NC, USA, 1999. [Google Scholar]
- Elith, J.; Leathwick, J.R.; Hastie, T. A Working Guide to Boosted Regression Trees. J. Anim. Ecol. 2008, 77, 802–813. [Google Scholar] [CrossRef] [PubMed]
- Ashraf, M.I.; Zhao, Z.; Bourque, C.P.-A.; MacLean, D.A.; Meng, F.-R. Integrating Biophysical Controls in Forest Growth and Yield Predictions with Artificial Intelligence Technology. Can. J. For. Res. 2013, 43, 1162–1171. [Google Scholar] [CrossRef]
- Vieira, G.C.; de Mendonça, A.R.; da Silva, G.F.; Zanetti, S.S.; da Silva, M.M.; Dos Santos, A.R. Prognoses of Diameter and Height of Trees of Eucalyptus Using Artificial Intelligence. Sci. Total Environ. 2018, 619, 1473–1481. [Google Scholar] [CrossRef]
- Ou, Q.; Lei, X.; Shen, C. Individual Tree Diameter Growth Models of Larch–Spruce–Fir Mixed Forests Based on Machine Learning Algorithms. Forests 2019, 10, 187. [Google Scholar] [CrossRef] [Green Version]
- Fernandes, T.J.; Campo, A.D.D.; Garcia-Bartual, R.; Gonzalez-Sanchis, M. Coupling Daily Transpiration Modelling with Forest Management in a Semiarid Pine Plantation. iForest-Biogeosci. For. 2015, 9, 38. [Google Scholar] [CrossRef] [Green Version]
- Vallejo, V.R.; Smanis, A.; Chirino, E.; Fuentes, D.; Valdecantos, A.; Vilagrosa, A. Perspectives in Dryland Restoration: Approaches for Climate Change Adaptation. New For. 2012, 43, 561–579. [Google Scholar] [CrossRef] [Green Version]
- Coello, J.; Cortina, J.; Valdecantos, A.; Varela, E. Forest Landscape Restoration Experiences in Southern Europe: Sustainable Techniques for Enhancing Early Tree Performance. Unasylva 2015, 66, 82–90. [Google Scholar]
- Pedro, V.S. Restoration of Spanish Pine Plantations: A Main Challenge for the 21st Century. Reforesta 2016, 1, 53–66. [Google Scholar]
- del Campo, A.D.; Segura-Orenga, G.; Ceacero, C.J.; González-Sanchis, M.; Molina, A.J.; Reyna, S.; Hermoso, J. Reforesting Drylands under Novel Climates with Extreme Drought Filters: The Importance of Trait-Based Species Selection. For. Ecol. Manag. 2020, 467, 118156. [Google Scholar] [CrossRef]
- de Mena, J.H. Calidad de Planta de Pinus Halepensis Mill. En Repoblaciones Forestales En La Provincia de Valencia. Definición y Contraste de Los Estándares de Calidad de Planta. Ph.D. Thesis, Universidad de Córdoba, Córdoba, Spain, 2017. [Google Scholar]
- Navarro-Cerrillo, R.M.; del Campo, A.D.; Ceacero, C.J.; Quero, J.L.; de Mena, J.H. On the Importance of Topography, Site Quality, Stock Quality and Planting Date in a Semiarid Plantation: Feasibility of Using Low-Density LiDAR. Ecol. Eng. 2014, 67, 25–38. [Google Scholar] [CrossRef]
- World Meteorological Organization. Standardized Precipitation Index User Guide; Svoboda, M., Hayes, M., Wood, D., Eds.; WMO-No. 1090; World Meteorological Organization: Geneva, Switzerland, 2012. [Google Scholar]
- IBM Corp. IBM SPSS Statistics for Windows; Version 22.0; IBM Corp: Armonk, NY, USA, 2013. [Google Scholar]
- R Core-Team. R: A Language a Nd Environment for Statistical Computing; R Foundation for Statistical Computing: Vienna, Austria, 2015. [Google Scholar]
- Ridgeway, G. Gbm: Generalized Boosted Regression Models. 2017. Available online: https://CRAN.R-project.org/package=gbm (accessed on 10 May 2019).
- Elith, J.; Leathwick, J. Boosted Regression Trees for Ecological Modeling; R Documentation: Vienna, Austria, 2017; Available online: https://cran.r-project.org/web/packages/dismo/vignettes/brt.pdf (accessed on 10 May 2019).
- Simpson, D.G.; Ritchie, G.A. Does RGP Predict Field Performance? A Debate. New For. 1997, 13, 253–277. [Google Scholar] [CrossRef]
- Hobbs, S.D. The Influence of Species and Stocktype Selection on Stand Establishment: An Ecophysiological Perspective. In Seedling Physiology and Reforestation Success; Springer: Berlin/Heidelberg, Germany, 1984; pp. 179–224. [Google Scholar]
- Oliet, J.A.; Planelles, R.; Artero, F.; Jacobs, D.F. Nursery Fertilization and Tree Shelters Affect Long-Term Field Response of Acacia Salicina Lindl. Planted in Mediterranean Semiarid Conditions. For. Ecol. Manag. 2005, 215, 339–351. [Google Scholar] [CrossRef]
- Oliet, J.A.; Planelles, R.; Artero, F.; Valverde, R.; Jacobs, D.F.; Segura, M.L. Field Performance of Pinus Halepensis Planted in Mediterranean Arid Conditions: Relative Influence of Seedling Morphology and Mineral Nutrition. New For. 2009, 37, 313–331. [Google Scholar] [CrossRef]
- Puttonen, P. Criteria for Using Seedling Performance Potential Tests. New For. 1989, 3, 67–87. [Google Scholar] [CrossRef]
- Grossnickle, S.C.; MacDonald, J.E. Seedling Quality: History, Application, and Plant Attributes. Forests 2018, 9, 283. [Google Scholar] [CrossRef] [Green Version]
- Mattsson, A. Predicting Field Performance Using Seedling Quality Assessment. New For. 1997, 13, 227–252. [Google Scholar] [CrossRef]
- Ceacero, C.J.; Díaz-Hernández, J.L.; del Campo, A.D.; Navarro-Cerrillo, R.M. Interactions between Soil Gravel Content and Neighboring Vegetation Control Management in Oak Seedling Establishment Success in Mediterranean Environments. For. Ecol. Manag. 2012, 271, 10–18. [Google Scholar] [CrossRef]
- Vadell, E.; de-Miguel, S.; Pemán, J. Large-Scale Reforestation and Afforestation Policy in Spain: A Historical Review of Its Underlying Ecological, Socioeconomic and Political Dynamics. Land Use Policy 2016, 55, 37–48. [Google Scholar] [CrossRef]
- Stahl, U.; Reu, B.; Wirth, C. Predicting Species’ Range Limits from Functional Traits for the Tree Flora of North America. Proc. Natl. Acad. Sci. USA 2014, 111, 13739–13744. [Google Scholar] [CrossRef] [PubMed] [Green Version]
- Villar-Salvador, P.; Puértolas, J.; Cuesta, B.; Penuelas, J.L.; Uscola, M.; Heredia-Guerrero, N.; Benayas, J.M.R. Increase in Size and Nitrogen Concentration Enhances Seedling Survival in Mediterranean Plantations. Insights from an Ecophysiological Conceptual Model of Plant Survival. New For. 2012, 43, 755–770. [Google Scholar] [CrossRef]
Publisher’s Note: MDPI stays neutral with regard to jurisdictional claims in published maps and institutional affiliations. |
© 2022 by the authors. Licensee MDPI, Basel, Switzerland. This article is an open access article distributed under the terms and conditions of the Creative Commons Attribution (CC BY) license (https://creativecommons.org/licenses/by/4.0/).