Article

Comparison of Seasonally Adaptive Metabolic Response Strategies of Two Acer Species

1
School of Forestry, Northeast Forestry University, Harbin 150040, China
2
School of Life Sciences, Heilongjiang University, Harbin 150080, China
3
Key Laboratory of Soybean Molecular Design Breeding, Northeast Institute of Geography and Agroecology, Chinese Academy of Sciences, Harbin 150081, China
4
Key Laboratory of Plant Ecology, Northeast Forestry University, Harbin 150040, China
5
Botany and Microbiology Department, Faculty of Science, Menoufia University, Shebin Elkoom 32511, Egypt
*
Author to whom correspondence should be addressed.
These authors contribute equally to this work.
Forests 2022, 13(12), 2141; https://doi.org/10.3390/f13122141
Submission received: 6 October 2022 / Revised: 9 December 2022 / Accepted: 12 December 2022 / Published: 14 December 2022
(This article belongs to the Section Forest Ecophysiology and Biology)

Abstract

:
Acer L. species are well known as ornamental trees due to their colourful leaves in autumn season. Acer pictum subsp. mono (Maxim.) H. Ohashi (APM) and Acer tataricum subsp. ginnala (Maximowicz) Wesmael (ATG) form leaves with completely different colours in autumn, yellow and red, respectively. In response to this phenomenon, we investigated the metabolic regulation of APM and ATG in different seasons by combining metabolomics, ionomics, the antioxidant system and pigment content. The results showed that the process of senescence and discolouration exists in leaves of different Acer species, and the regulatory strategy shows species specificity. Compared with green leaves, the accumulation of primary metabolites in autumn leaves of APM was extensively depleted, chlorophyll content was decreased, and antioxidant enzymes and C6C3C6 type phenolic compounds synergistically enhanced the antioxidant capacity of plants to cope with senescence. Carotenoid content was raised, which together with phenolic compounds (chlorogenic acid, rutin) provides the leaves with a yellow colour. The response of chlorophyll and the antioxidant system in autumn leaves of ATG is consistent with that of APM, while sugar content increases. The increased anthocyanin content in autumn leaves of ATG explains the transition of leaves from green to the red colour, which may be accompanied by the combined effect of elements (Fe, Zn, Mn) and isoflavones. This study provides a reference for the study of colouration mechanism and seasonal adaptation in Acer L. species.

1. Introduction

Yellow and red autumn leaves are typical of many of the woody plants that dominate large areas of the world’s temperate/frigid zones [1]. Beginning in the 21st century, the phenomenon of autumn leaf colour change has received a great deal of attention from physiological and ecological researchers. At first, it was believed that chlorophyll pigment overshadows the rest of the existing pigments, and that the degradation of chlorophyll in the fall allows red, yellow, and other pigments to appear [2]. As study progressed, the results showed that this phenomenon is accompanied by complex life activities.
Pigmentation in many plants is controlled by the relative concentrations of chlorophylls anthocyanins, carotenoids, and anthocyanins, such as Lolla Rosso and Beta vulgaris L. [3,4,5]. In addition, the composition and content of phenolic compounds can affect growth and coloration. Phenolic compounds belong to one of the most widespread secondary metabolites in plants, originating from the metabolic pathways of shikimate and phenylpropanoic acid [6]. They are an important class of plant protective agents. The functions of these compounds include cell wall support, protection of plants from herbivores and insects, acting as phytoalexins and signaling compounds, and antioxidant effect [7]. Phenolic compounds exhibit a wide variety of structures in nature, and can be classified into three types based on the number of transformable hydroxyl groups and binding positions on the aromatic chain: C6C1 type (such as phenolic acids); C6C3 type (such as hydroxycinnamic acid derivatives); and C6C3C6 type (such as flavonoids) [8]. Studies have shown that the colour of leaves is not determined only by pigments; usually chromogenic compounds such as flavonoids are involved as well [9]. Chromogenic compounds are widely involved in colour control, and both flavonoids and carotenoids can often be detected in leaves and flowers [10]. In addition, the flavonoid metabolic pathway is the upstream pathway of anthocyanin synthesis, and the metabolic regulation process of flavonoids directly affects anthocyanin synthesis [11]. It is clear that a more comprehensive understanding of the whole-plant metabolome would help in understanding pigment chemistry and its associated biosynthetic pathways in plants with different leaf colours [12].
In addition to this, pH values, their binding to auxiliary pigments (e.g., organic acids), and molecular stacking with metals all influence plant colour [13]. Lower iron levels inhibit chlorophyll synthesis, limit the activity of antioxidant enzymes, and reduce resistance to environmental stresses [14].
Autumn leaf colouration usually predates leaf fall by days or weeks [15]. Plants undergo natural senescence during this period, a long developmental process that is critical to plant physiology and metabolism [16]. Leaf senescence is not a passive and chaotic degradation process; the systematic degradation of cellular components starts at the chloroplast level and undergoes significant coordinated changes at the plant physiological, metabolic and molecular levels through the chloroplast decomposition, protein degradation, and recirculation processes [17]. The numerous genes that are up- or downregulated during leaf senescence are indeed closely related to primary and secondary metabolism, aiming to recycle and remobilize mineral nutrients as efficiently as possible [18]. This allows the redistribution of nutrients within the branches and the trunks or transfer to the seeds and the fruits to provide the necessary energy for seed germination and early growth [19]. This process has been reported in Arabidopsis [20], tobacco [21], Hordeum vulgare [16], Ginkgo biloba [22], and other species over the years. It has been analyzed that during leaf senescence, cellular mechanisms involved in the protection against free radicals and reactive oxygen species (ROS) are overexpressed [23]. Increased accumulation of ROS in leaf blades leads to oxidative stress and organelle damage [24].
The genus Acer L. (Aceraceae), known as maples, contains about 200 species and is widely distributed in Asia, North America and Europe, being one of the most widespread trees in deciduous broad-leaved forests in the Northern Hemisphere [25]. They are often key species in maintaining essential ecosystem processes and community biodiversity [26]. When the temperature drops sharply in autumn, maple leaves turn from green to yellow or red, and they are highly appreciated as ornamental species [27]. In addition to excellent landscape applications, maple species are valued as primary raw materials for wood, maple sugars and syrups, and medicinal or bioactive compounds [28,29,30]. The ecological role [31,32] of Acer L. plants and the physiological functions [33,34] of particular species are now widely studied. However, the comparison of the life processes of different species of plants within the same genus has not been studied in detail.
In China, Acer pictum subsp. mono (Maxim.) H. Ohashi (APM) is mainly distributed in northeastern China, especially in the Xiaoxingan Mountains and Changbai Mountains, with a small distribution in northern China and the middle and lower reaches of the Yangtze River. It is an important companion species in temperate Pinus koraiensis (Siebold & Zucc.) and broad-leaved forests in northeast China. Autumn leaves are yellow and ornamental [35]. APM is often used in Korean folk medicine to stop bleeding and for the treatment of arthralgia and gout [36]. Acer tataricum subsp. ginnala (Maximowicz) Wesmael (ATG) is a shrub or small tree with a wide distribution, growing in large populations in northeast China, as well as in parts of northwest and north China [37]. ATG has bright red autumn leaves; it can be used as an ornamental tree in gardens and planted as hedges and small roadside trees. In addition to its timber, medicinal, and ornamental values, it is worth mentioning that a tea called Ku-jin tea is made from the leaves of ATG [38,39]. As a caffeine-free natural product with high polyphenols and significant antioxidant activity, it has a long history of consumption in China and is popular among the people [40].
Metabolomics is a powerful tool for studying the kinetics of small molecule metabolites. With advances in mass spectrometry, high-throughput methods for analyzing metabolic composition and levels are increasingly being used in plants. Metabolomics has been used for ecological investigations and to measure the effects of factors such as environmental changes, diseases, and plant resistance [7].In summary, in this study, we performed physiological and metabolomic analyses of two species of maple leaves in different seasons in order to determine: (1) the effect of seasonal changes on the accumulation of metabolites in Acer L. leaves and (2) the differences in colour presentation mechanisms and seasonal adaptation strategies in different species of Acer L. Thus, this paper provides a reference for future colour regulation and application of foliage species.

2. Materials and Methods

2.1. Plant Materials

In this study, the leaves of APM and ATG were used as experimental materials. Samples were collected from the Heilongjiang Grand Canyon National Nature Reserve (130°58′ E, 44°52′ N), China. The leaves were collected in summer and autumn from the same area and at the same growth period. The leaves were identified by Prof. Liqiang Mu at Northeast Forestry University, Harbin, China.
The fresh leaves were rapidly frozen in liquid nitrogen and stored at −80 °C for metabolomics and physiological experiments. The fresh leaves were prevented from enzymatic reaction at 105 °C for 15 min and then dried to constant weight at 60 °C for ionomics experiments. The experiment was carried out with three biological replicates.

2.2. Leaf Colour and Pigment Content Determination

Leaf color visualization through the determination of pigment and leaf color parameters.
Leaf colour measurements: The L*a*b* values of five well-exposed mature leaves from the middle part of the branches of three plants of each species in season were measured with a portable colourimeter (CS-500, Caipu, Zhejiang, China). L* indicates lightness, a* corresponds to red/green chromaticity, and b* corresponds to yellow/blue chromaticity [41].
Chlorophyll and carotenoid content measurement: 0.2 g of fresh leaves was added to 10 mL of acetone ethanol solution (v/v = 2:1) and left in the dark for 48 h, centrifuged at 6000 rpm for 10 min, and the supernatant was aspirated. The absorbance at 663, 645, and 470 nm was measured using an ultraviolet spectrophotometer (UV-2102c, Unico Instrument C, Shanghai, China) and its content was calculated.
Measurement of anthocyanin content: 0.1 g of fresh leaves was added to 10 mL of 1% HCL methanol solution, placed in darkness for 24 h, centrifuged at 6000 rpm for 10 min, and the supernatant was aspirated. The absorbance at 530 and 600 nm was measured using a UV spectrophotometer and the content was calculated.

2.3. Antioxidant Enzyme Measurement

The antioxidant capacity of the leaves was determined by measuring the antioxidant enzyme activity; 0.5 g of fresh leaves was extracted in 10 mL of 50 mM phosphate buffer (7.8 pH) containing 1 mM 2-mercaptoethanol, 2 % polyvinylpyrrolidone and 1 mM EDTA. The supernatant was retained after centrifugal at 12,000 rpm for 10 min at 4 °C for superoxide dismutase (SOD), peroxidase (POD), and catalase (CAT) activity testing [42].

2.4. Element Analysis

Mineral element content was determined by ICP-OES; 0.25 g of dried plant samples was placed in an ablation tube containing 6 mL of a nitric acid and perchloric acid mixture (v/v = 5:1) and heated at 180 °C for about 3 h until complete dissolution. The concentrations of K, Ca, Mg, Na, Fe, Cu, Zn, Mn, Mo, and B were determined using an inductively coupled plasma emission spectrometer (ICP-OES Optima 8000, PerkinElmer, America). The content of each element was calculated from the standard curve [43].

2.5. GC–MS Analysis

Primary metabolite content was determined using untargeted metabolomics techniques; 90 mg of fresh plant samples was added to 540 μL of cold methanol and 60 μL of internal standard (L-2-chloro-phenylalanine-methanol, 0.3 mg/mL), ground uniformly, and extracted with ultrasound for 30 min. Then, 300 μL chloroform and 600 μL water were added and vortexed uniformly for 30 min, centrifuged at low temperature for 10 min (14,000 rpm, 4 °C), and 700 μL of the supernatant was taken and concentrated under vacuum until dried. Next, 400 μL of methoxylamine hydrochloride-pyridine solution (15 mg/mL) was added, vortexed uniformly, and oxim the reaction for 90 min at 37 °C. Then, 400 μL of BSTFA (with 1% TMCS) derivatization reagent and 60 μL of hexane were added, vortexed uniformly, and reacted at 70 °C for 60 min. The extracts were filtered through 0.22 μm membrane and then analyzed by GC-MS [44].
Primary metabolite analysis was performed using an Agilent 7890B-5977B gas chromatograph-mass spectrometer (Agilent Technologies, Santa Clara, CA, USA). An Agilent capillary column (HP-5MS, 30 m × 250 µm) was used for the experiments. High-purity helium was used as the carrier gas at a flow rate of 1.0 mL/min. The program was run at an initial temperature of 60 °C, then ramped up to 125 °C at 8 °C min−1, 270 °C at 5 °C min−1, and 310 °C at 10 °C min−1 and held for 3 min. The scan range was set from 50 to 500 m/z. The electron impact (EI) ion source was kept at 70 eV.

2.6. LC–MS Analysis

Determination of secondary metabolite content using targeted metabolomics techniques. First, 1.0 g of fresh plant material was extracted twice using 10 mL of 70% methanol by sonication for 45 min. The two extracts were combined and centrifuged at 14,000 rpm for 10 min. The supernatant was concentrated under vacuum until dried, then 1 mL of 70% methanol was added to the extract to dissolve it again. The extract was filtered through a 0.22 μm filter membrane and analyzed by LC-MS.
The phenolic compounds were targeted for analysis using a Waters Xevo G2 QTOF mass spectrometer (Waters Technologies, Shanghai, China). The mass spectrometry conditions were set as follows: positive ion mode, capillary voltage of 3000 V, cone voltage of 45 V, source temperature of 400 °C, fragmentation voltage of 135 V, curtain gas pressure of 40 psi, and scan range of 50–1000 m/z. The separation was performed on an Acquity UPLC BEH C18 (1.7 μm, 2.1 mm × 5 mm) column at 25 °C with a flow rate of 0.25 mL/min. The mobile phases required for the experiment were: 0.05% acetic acid-water (A) and 0.05% acetic acid-acetonitrile (B). The gradient elution program was: 5–95% B at 0–23 min, 95–5% B at 23–25 min, 5% B at 25–31 min [45].

2.7. Statistical Analysis

The data obtained after GC-MS analysis were processed by software (Agilent GC-MS 5977B, Santa Clara, CA, USA) and the compounds were displayed as normalized peak areas. The data obtained after LC-MS analysis were processed by software (MassLynx software v 4.1, Waters, Milford, MA, USA) to obtain a normalized peak area data matrix.
Principal components analysis (PCA) and partial least squares discriminant analysis (PLS-DA) were performed using SIMCA-P version 14.1 software. Tukey’s test was performed using SPSS 22.0 software (SPSS, Inc., Chicago, IL, USA), and Pearson’s correlation coefficient was calculated as well.

3. Results

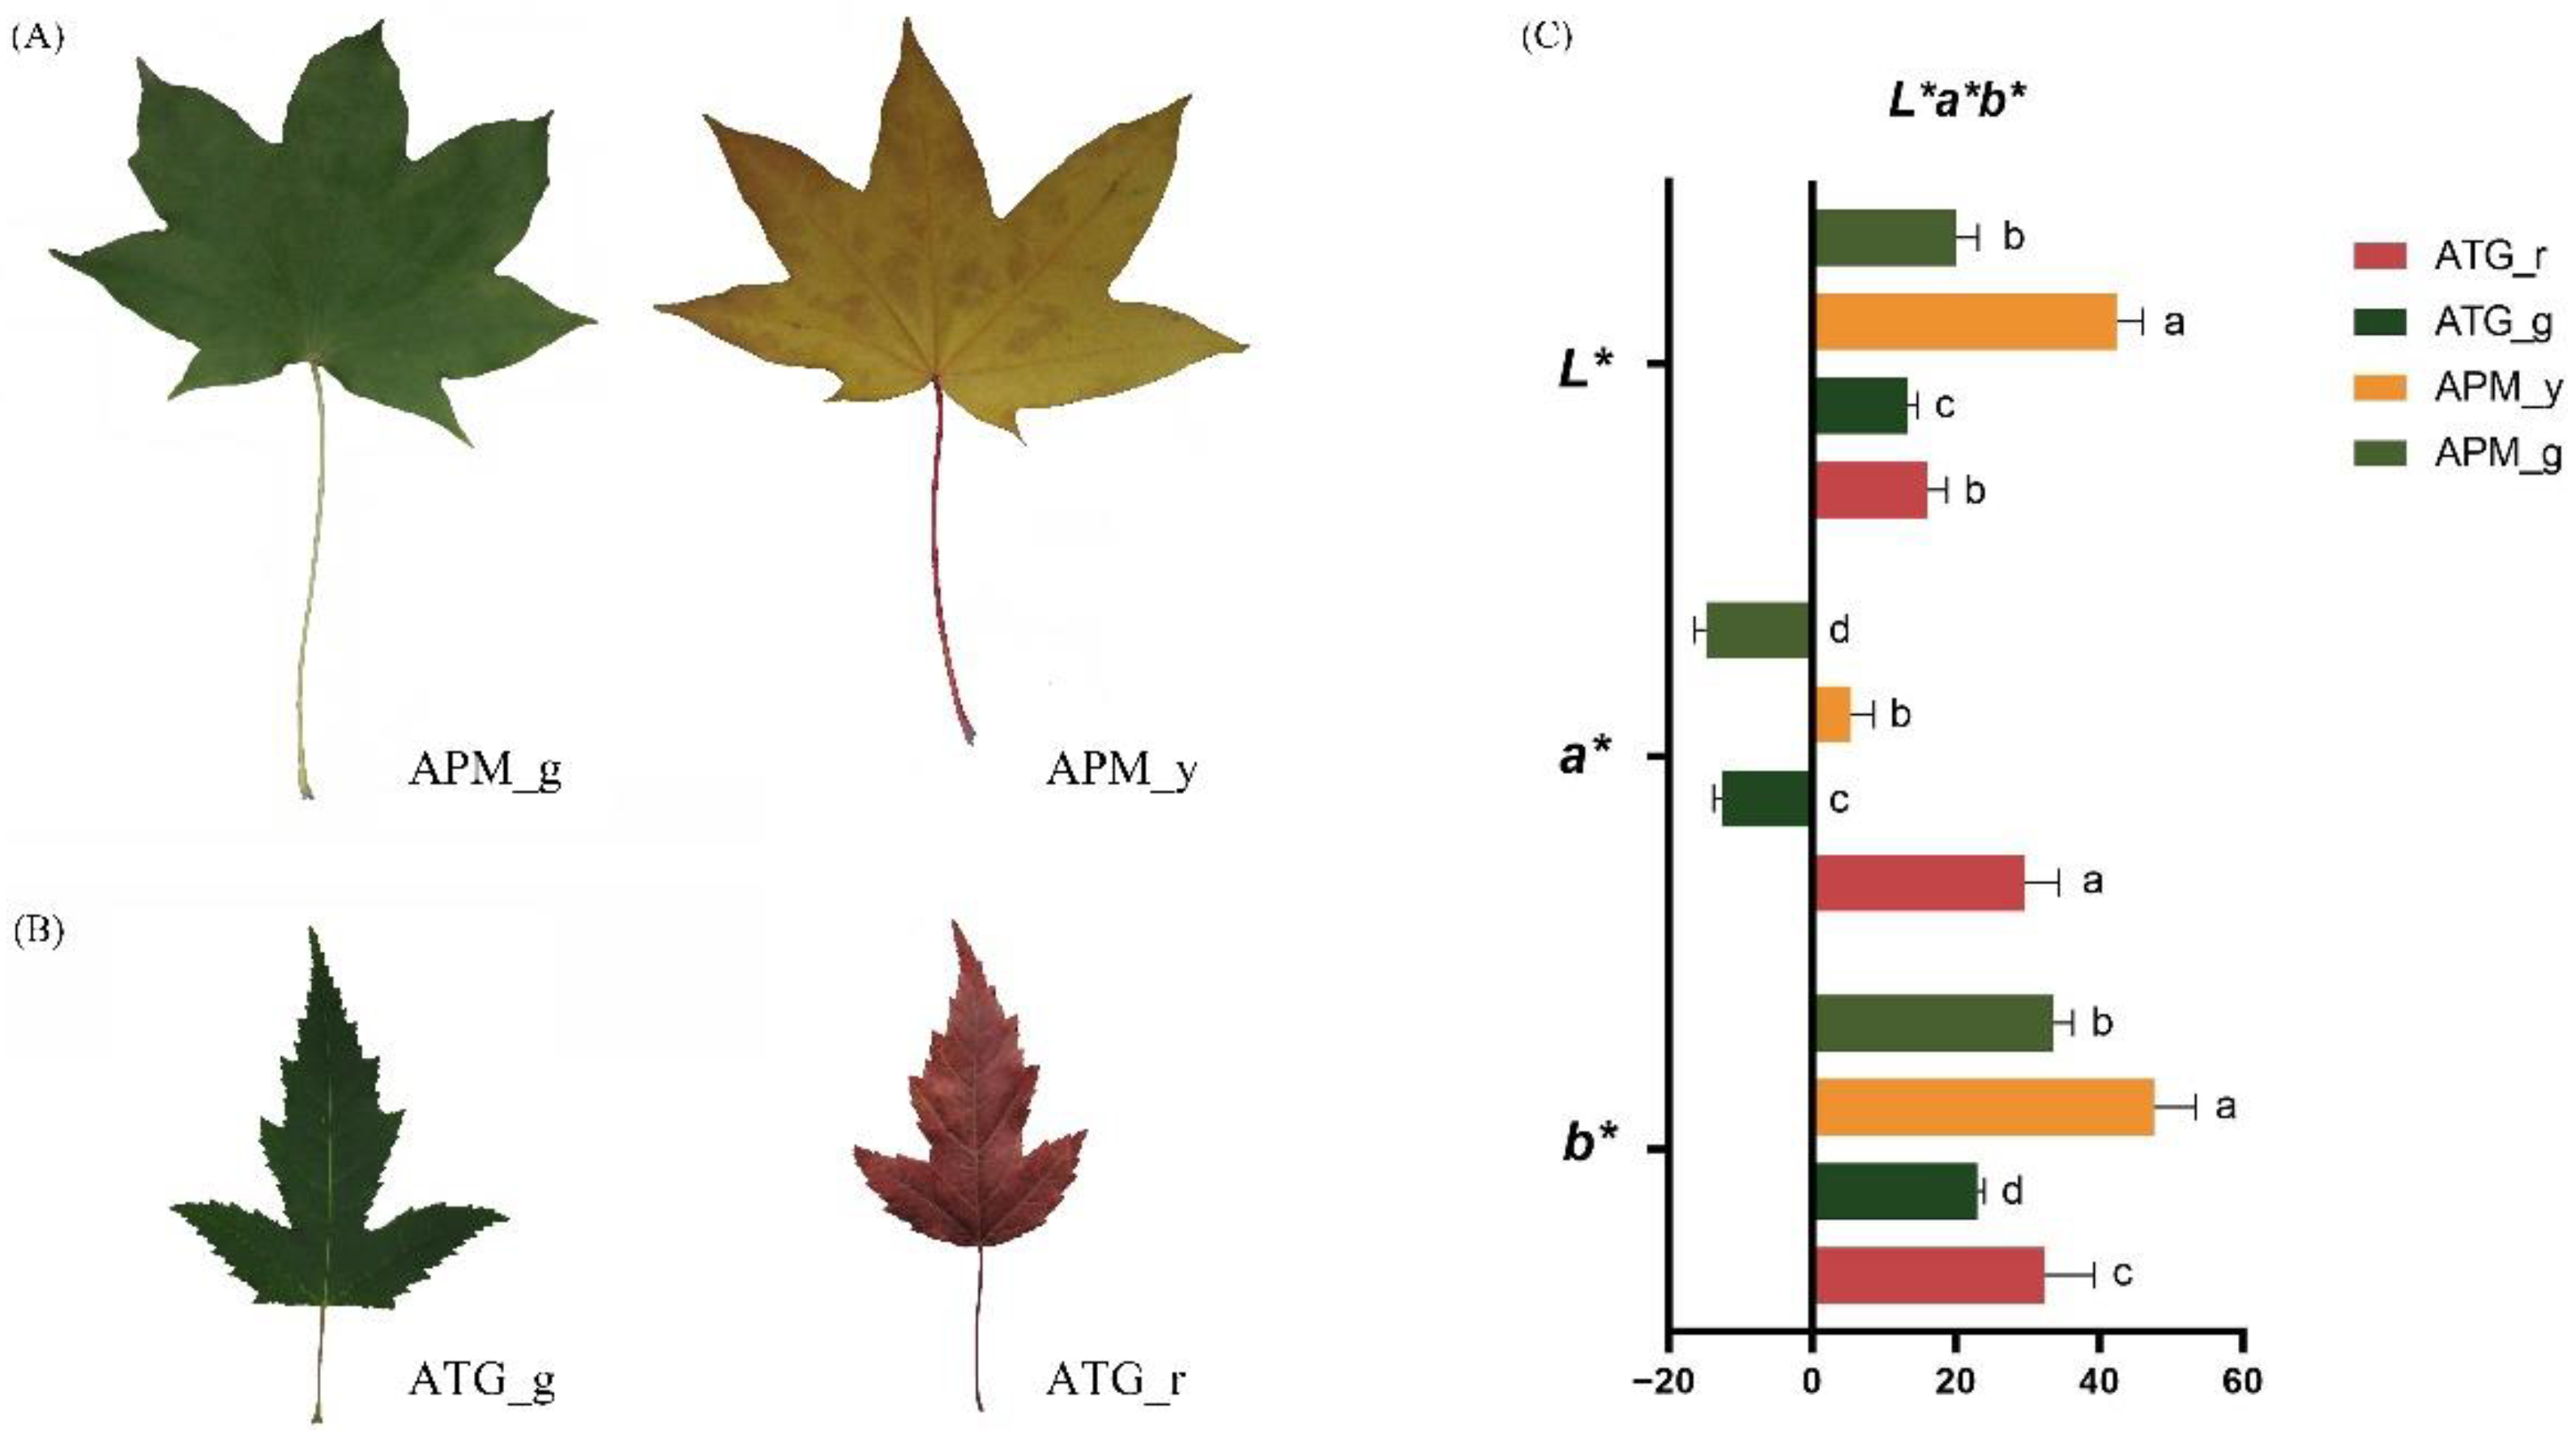
3.1. Comparison of Colour Parameters and Pigments of APM and ATP Leaves

Different species of Acer L. species show different colours in autumn leaves; in order to better study leaf colour differences, leaf colour parameters were visualized in this study. The leaves of both Acer L. species, shown in Figure 1A,B, were green in summer, while they showed different colours in autumn. Visualization of the colour parameters (Figure 1C) shows that both species have higher lightness (L*) in autumn leaves than in summer leaves, with ATG autumn leaves showing much higher red chromaticity (a*) than the other components and APM autumn leaves showing the same trend in yellow chromaticity (b*).
The diversity of pigments is the main reason that affects the colour of plant leaves. The chlorophylls, carotenoids, and anthocyanins of the two species were compared (Figure 2A). The results show that the chlorophyll content of APM and ATG leaves in summer was much higher than that in autumn 12.78-fold and 14.74-fold, respectively, and there was no significant difference between leaves chlorophyll content of different species in autumn. Autumn leaves of APM had the highest carotenoid content (0.57 mg/g), while autumn leaves of ATG had the highest anthocyanin content (3.45 mg/g). The ratio of chlorophyll to carotenoids in autumn was 0.28-fold and 1.20-fold for APM and ATG, respectively, while the ratios of chlorophyll to anthocyanin were 0.18-fold and 0.06-fold, respectively.

3.2. Comparison of Antioxidant Enzymes of APM and ATP Leaves

With seasonal changes, the decrease in chlorophyll content is often accompanied by the production of reactive oxygen species. In this study, antioxidant enzyme activities were measured to investigate the level of oxidative stress in different plants. In terms of antioxidant systems, CAT activity showed a 0.60-fold decrease in APM autumn leaves; whereas it showed 0.35-fold increase in ATG autumn leaves compared with summer leaves. While SOD activity in autumn leaves increased 0.78-fold in APM compared with summer leaves, no significant differences were found in ATG leaves between seasons. Summer leaves of APM and ATG showed similar POD activities, and the enzyme activity increased in both species by 2.13-fold and 2.4-fold, respectively, in autumn leaves (Figure 2B).

3.3. Comparison of Elements of APM and ATP Leaves

Mineral elements affect both plant cell building and photosynthesis. For a more comprehensive understanding of the plant response to the season, ten mineral elements were quantified based on ICP-OES technology, including three macroelements (K, Ca, Mg) and seven microelements (Na, Fe, Cu, Zn, Mn, Mo, B). The results are shown in Table 1. The contents of both Ca and Mg showed a distribution characteristic of increasing in APM autumn leaves (1.11-fold, 1.10-fold) and decreasing in ATG (0.49-fold, 0.38-fold). Both Fe and B contents showed a decrease in APM autumn leaves (0.67-fold, 0.41-fold) and an increase in ATG (2.67-fold, 1.60-fold). The contents of Zn and Mn increased, K and Cu decreased, and Na and Mo did not change significantly in the autumn leaves of both studied maple species.
According to the PCA analysis (Figure 3), both species are clearly separated in the first principal component. The elements that mainly contribute to the differentiation in APM are mostly microelements (Mn, Zn, Fe), while in ATG these microelements are involved in differentiation along with other macroelements (K, Ca, Mg).

3.4. Comparison of Primary Metabolic of APM and ATP Leaves

In order to understand metabolite changes within the two studied maple species with different coloured leaves during two different seasons (summer and autumn), the non-targeted metabolomic technology of the GC-MS platform was used. A total of 95 distinct annotated metabolites were identified based on GC-MS in leaves, including 27 acids, 23 sugars, 13 alcohols, 7 amino acids, 5 esters, 4 anthraquinones, 4 glycosides, 3 amines, and 9 additional compounds that did not fit into these seven main classes (Figure 4, Table S1). The PLS-DA model was used to distinguish between green and red or yellow leaves of the two maple species (Figure 5A,C).
All the differential metabolites in the studied groups were matched to the KEGG database to obtain information on the metabolic pathways involved. Enrichment analysis was performed on the annotated results to obtain the pathways with high enrichment of differential metabolites. The differential metabolites of discolouration in leaves of both maple species were annotated and enriched in the galactose metabolism and lactose degradation pathways. In addition, differential metabolites were enriched in the glycerolipid metabolism pathway in APM and enriched in the gluconeogenesis pathway in ATG (Figure 5B,D).
Based on the criteria of VIP ≥ 1 and p ≤ 0.05, differentially expressed compounds were screened. The results showed that in the comparison between green and yellow leaves of APM, differential compounds can be clearly grouped into three main clusters based on their seasonally specific accumulation patterns. Clusters 2 and 3 aggregate more compounds and have higher accumulation in the green leaf stage (Figure 6A). In ATG, the differential compounds were divided into four main clusters. Clusters 1 and 2 had higher accumulation mainly in red leaves and Clusters 3 and 4 had higher content mainly in green leaves. It is noteworthy that acids are more present in these two clusters (Figure 6B).

3.5. Comparison of Phenolic Compound Metabolism in APM and ATP Leaves

Phenolic compounds are important phytoprotective agents for plants, and the chromogenic compounds, flavonoids, belong to this category as well. Therefore, in this study, twenty phenolic compounds tentatively identified in the leaves of the two studied Acer species were comprehensively analyzed using targeted metabolomics of the LC-MS platform for the first time. We divided these into three types according to their molecular structure: C6C1 type (protocatechuic acid, benzoic acid, syringic acid, vanillic acid, 2,5-Dihydroxybenzoic acid), C6C3 type (p-hydroxycinnamic acid, chlorogenic acid, cinnamic acid, ferulic acid, caffeic acid, sinapic acid), and C6C3C6 type (rutin, genistein, genistin, apigenin, naringenin, quercetin-3-O-rhamnoside, kaempferol, hesperetin, taxifolin). In addition, L-phenylalanine as a synthetic precursor of phenolic compounds was identified as a target compound.
Differences in the accumulation patterns of phenolic compounds in the two studied species are visualized by a clustering heat map (Figure 7). The cluster heat map shows that there were significant differences in metabolites among the different groups under study. It can be observed that the clustering analysis of phenolic compounds of both species was divided into three clusters. After leaf discolouration, whether red or yellow, the metabolites in Cluster 2 were generally higher than in green leaves. This cluster consisted mainly of C6C3C6-type compounds. Most C6C3-type compounds in APM were in Cluster 1, and were more abundant in green leaves. In contrast, this was not the case for ATG. The C6C1-type compounds showed no clear pattern in the clustering analysis of both species. Different biological replicates clustered equally among themselves, indicating good homogeneity among biological replicates and high reliability of the data.
The results of the quantitative analysis of phenolic compounds are shown in Figure 8. In our study, the variability of C6C1-type compounds between the two studied species was greater than their seasonal variability within the same species, and most of these compounds accumulated more in APM, such as benzoic acid, syringic acid, and vanillic acid, which all accumulated three-fold more than ATG. C6C3-type compounds varied significantly with different species and different seasons, with the highest accumulation of cinnamic acid (0.42 μg/g), p-hydroxycinnamic acid (1.33 μg/g), and ferulic acid (0.68 μg/g) in ATG red leaves; in APM, yellow leaves showed caffeic acid (0.50 μg/g), sinapic acid (0.33 μg/g), and chlorogenic acid (16.2 μg/g) in the highest accumulations. The content of the C6C3C6 class of compounds was generally elevated in autumn leaves of different plants. Most of these compounds accumulated in large amounts in the yellow leaves of APM. Notably, the content of apigenin (0.37 μg/g) and genistein (0.48 μg/g) in ATG red leaves was more than ten-fold higher than the other components.

3.6. Metabolic Network and Correlation Analysis of APM and ATP Leaves

Based on the results of metabolomics analysis, the metabolic network was mapped; the relationship between primary metabolism and phenolic compounds is shown in Figure 9. Galactose metabolism and pentose phosphate are in the same branch with pentose phosphate further downstream. Fatty acid metabolism as well as alanine, aspartate, and glutamate metabolism are in the other branch and are all related to the TCA cycle. In addition, different types of phenolic compounds are located in different metabolic pathways.
Our results show that seasonal variability in metabolites, elementals, and antioxidant enzymes levels exists in both species. To elucidate whether these changes are correlated, a correlation analysis of the above-mentioned indicators was performed for both maple species; the results are shown in Figure S1. In the seasonal variation of APM, L*a*b* values were positively correlated with carotenoid content, POD, and SOD enzyme activities, a large number of C6C3C6-type compounds, and elements (Ca, Mg, Zn, Mn), while being negatively correlated with almost all primary metabolites. Chlorophyll content, elements (Fe, Cu, B) and most C6C3-type compounds were significantly positively correlated with primary metabolites. In ATG, most of the sugars were positively correlated with C6C3-type and C6C3C6-type compounds, elements (Fe, Zn, Mn), and L*a*b* values. Antioxidant enzymes and C6C1-type compounds were not significantly correlated with leaf colour changes.

4. Discussion

4.1. Analysis of Pigments and Antioxidant Enzymes in APM and ATP Leaves

Maples are recognized worldwide as ecologically, ornamentally, and therapeutically important plants [27]. In particular, the ornamental value is of great interest because of red or yellow autumn leaves; however, the reasons for the formation of leaf colour differences have been less studied. Therefore, in this study, the leaves of two maple species, APM and ATG, which have been widely exploited and different fall leaf colours have been selected as experimental materials in different seasons in order to explore their species metabolic diversity and seasonal response patterns.
Leaf colour is influenced by the type, content, and proportion of pigments in the leaves [46]. Summer is the peak of plant growth, and chlorophyll synthesis rate is much higher than the rate of decomposition; as seen in both studied maple species, summer leaf chlorophyll content is much higher than in autumn. In the fall, the pigment content in leaves fluctuates due to falling temperatures, decreased light, and leaf aging, which lead to degradation of highly structured cysts and a decrease in chlorophyll accumulation along with changes in chloroplast structure [47]. In our results, carotenoid and anthocyanin contents increased in APM and ATG autumn leaves, respectively. This was the main reason for the different colour of the leaves of the two studied maple species. This result was similarly demonstrated in a previous study [41].
The degradation of chlorophyll can cause a large amount of reactive oxygen species (ROS) production, resulting in an imbalance of ROS metabolism, and different response mechanisms exist in the plant antioxidant system. During leaf senescence, antioxidant enzyme activity usually increases first to balance ROS metabolism, then decreases until it loses its function as chlorophyll is further degraded [48]. In our study, POD enzymes in the two studied maple species had a stable spatiotemporal accumulation feature, with elevated activity in autumn to delay senescence, whereas CAT and SOD showed different patterns (Figure 2B), suggesting that the rate and timing of senescence may be different for the two maple species. This result may be due to the different phenological periods of the plants [49].

4.2. Analysis of Elements in APM and ATP Leaves

Essential plant mineral nutrients play an irreplaceable role in cell building and metabolic functions [50]. These nutrients are directly or indirectly involved in photosynthesis, including photosynthetic mechanism construction, electron transfer, energy conversion, carbon fixation metabolism, and photosynthetic product transport; thus, they play an important role in the formation and maintenance of photosynthetic capacity [51].
In this study, we found that the changes in photosynthetic capacity of leaves in different seasons were accompanied by changes in mineral elements and that the patterns of elemental changes were different between the two studied maple species (Figure 3, Table 1). This result was similarly found in previous studies with different crop species [52]. This suggests that element uptake may vary depending on the genetic and physiological characteristics of different plants; the soil context of the test site is relevant as well [53]. In addition, it may be related to the complex type of elemental functions; for example, Mg is mainly distributed in the free state in different plant tissues, and is a major constituent component of the polyribosomes. Studies have shown that Mg mainly has an important role in the synthesis and transport of amino acids, in addition to intervening in the synthesis of chlorophyll in plants [54]. Ca can improve cell membrane selective uptake, reducing the damage caused to plants by toxic substances such as malondialdehyde, and additionally regulates cell polarity growth [55].

4.3. Analysis of Metabolites in APM and ATP Leaves

With seasonal changes plants, undergo a complex and physiologically coordinated process in which metabolites produce migration, completing the vital nutrient cycle from old leaves to growing organs [56]. In this study, we performed metabolic profiling of two maple species during two different seasons (summer and autumn). Our findings indicate that the accumulation of metabolic compounds in maple occurs in a species-specific manner.
The role of sugars in plant seasonal changes has been widely discussed, and sugars are important in the process of plant growth and photosynthesis; however, their specific function in different species is controversial [21]. Generalized research suggests that photosynthetic rates are semi-accompanied by a reduction in sugar content. This is consistent with the level of metabolite changes in APM fall leaves (Figure S2). However, a significant up-regulation of rhamnose, fructose, and glucose content can be seen in ATG (Figure S3). It has been shown in Arabidopsis that increased sugar content allows for degradation of chlorophyll and protein following carbohydrate accumulation [20]. ATG may have similar physiological processes.
GABA is a downstream compound produced by glutamate following decarboxylase mediation, and its accumulation has been shown to be associated with plant development and defense [57]. Under greenhouse conditions, GABA content is highly increased in leaves of senescing sunflower [56]. In APM, the GABA content decreases, which may be related to the compounding effect formed by the consequent changes in environmental factors such as temperature and light with seasonal changes under natural conditions.
Phenolic compounds are important natural plant secondary metabolites that have been well studied for their protective effects on plant growth and development, biotic or abiotic stress, and other mechanical damage [7]. The environmental factors of solar radiation, temperature, moisture, and soil conditions all affect their content, which is apparent in maple leaves, and by seasonal collection, which is an important factor in colour variation [58,59].
The C6C1-type compounds of different species have similar accumulation patterns on the benzoic acid branch, while the opposite is true for 2,5-Dihydroxybenzoic acid (Figures S2 and S3). C6C1-type compounds do not act as coloured components, although they have other important physiological functions. Studies have shown that syringic acid enhances the antioxidant capacity of plants and alleviates cesium-induced growth defects in Arabidopsis [60]. The C6C3-type compounds are hydroxycinnamic acid derivatives, and accumulate in significantly different amounts in different maples (Figures S2 and S3). In particular, chlorogenic acid, which has been shown to be an important compound for yellow colouration, is significantly elevated in APM fall leaves and decreased in ATG [61]. Similar results have been found in different colored leaves of Ipomoea batatas L [62]. The C6C3C6-type compound rutin, which has the same function, has a similar accumulation pattern [61]. Naringenin is a precursor substance for anthocyanin synthesis. In our study, it was found that with Naringenin as a node, the content of related compounds in the isoflavone synthesis pathway was increased in ATG and decreased in ATM (Figures S2 and S3). In legume studies, the metabolic flow can be altered by inhibiting isoflavone production, thereby increasing anthocyanin synthesis [63]. In contrast, the interrelationship between isoflavones and anthocyanins in maple needs further study.

4.4. Integrative Analysis of the Difference in Leaf Discolouration between APM and ATP

This study systematically assesses and integrates the regulation and response of metabolites and other components in the complex physiological processes (e.g., colour presentation, leaf senescence) of maple adaptation to seasonal changes. The senescence process is the final stage of leaf development, and chlorophyll decline can be is considered a hallmark indicator of leaf senescence. It is accompanied by substantial degradation of cellular components, and is highly regulated [64]. It causes a switch between primary and secondary metabolism as well as a complex response related to oxidative stress [65]. In our study, it was likewise seen that the primary metabolites were consumed in large quantities, especially in APM.
Phenolic compounds are involved in the regulation of oxidative stress in plants by serving as electron donors for guaiacol-type POD, which converts H2O2 to water to reduce ROS [66]. This function was widely demonstrated, especially in phenolic acids (C6C1) and flavonoids (C6C3C6). Our results showed that whether APM or ATG, it was the flavonoids that had a more significant positive correlation with POD activity, while there was no significant pattern for phenolic acids (Figure S1). These findings suggest that antioxidant enzymes and flavonoids are involved in synergistic oxidative stress regulation in both studied maple species during the two different seasons, while phenolic acids are less involved [45].
Co-colouration refers to intra- or intermolecular interactions in plants to stabilize anthocyanins. Intramolecular interactions exist mainly due to self-association of anthocyanins. Intermolecular interactions refer to the formation of hydrogen bonds, hydrophobic forces, van der Waals forces and ionic interactions between anthocyanins and non-anthocyanin co-pigments, including phenolic acids, proteins, ions and polysaccharides [67,68]. The involvement of Fe in the regulatory process in tulips gives the underside of the perianth a different colour from the rest of the perianth [69]. In the present study, the increased red colour in autumn leaves of ATG was accompanied by an increase in the content of Fe that showed a significant positive correlation with anthocyanin pigment, and the same pattern existed for B, Zn, and Mn (Figure S1). This indicates that these elements may form a co-colour interaction with anthocyanins in ATG, although their unique complexation mechanism needs further investigation. In contrast, the yellowing in autumn leaves of APM was accompanied by a decrease in Fe content, which could be due to Fe deficiency resulting in yellowing of leaves [70,71]. Excluding B from mineral nutrient has been shown to enhance the accumulation of carotenoids and phenolic acids in carrots [72]. This is consistent with our results, which show a decrease in boron in the yellow leaves of APM; this result leads us to expect that B may have an indirect effect on the appearance of the yellow colour.

4.5. Limitations and Future

As mentioned earlier, the changes in plants caused by the change of seasons are very complex. The timing of leaf senescence, nutrient reactivation and reconversion is critical to the survival of perennial plants. Premature senescence causes deficiencies in potential photosynthetic products and growth requirements in the spring, while late senescence can lead to frost damage and loss of nitrogen and other valuable nutrients [73]. In a study comparing the synchrony of defoliation in A. barbatum, Quercus lyrata, and Fagus grandifolia, it was found that although chlorophyll was heavily defoliated in autumn in different species, there were significant differences in the onset and rate of defoliation. This suggests that the time of initiation of senescence and the rate of senescence are different in different species. In the study of Fagus sylvatica L., it was found that its antioxidant capacity and protein content during aging did not exactly show a consistent trend [49]; the same certainly affects plant-related physiological metabolic changes [74]. These results suggest that the senescence process is dynamic and may be related to the different phenological periods of the plants [49,75].
In our study, a comparison of the states of two maple species before and after the onset of senescence clarified the physiological and metabolic differences exhibited by the different species in response to seasonal changes. This provides a fundamental insight into interspecific differences in seasonal adaptations of Acer L. plants. However, it is essential to study the changes during plant senescence. Using the results of this study as a basis for understanding their dynamics could provide a clearer description of their seasonal adaptations and help to clarify the synergistic mechanisms among compounds.
In recent years, the study of red and yellow leaves has been gaining attention again due to the new ideas of the herbivory resistance hypothesis [76]. Scholars argue that red is more resistant to herbivory than other colours of leaves. This is because of animals that lack red receptors or consider red to be toxic and inedible [77,78]. In a comparison of horticultural and green-leaved varieties of ten common woody plants, it was found that those with red-tinged foliage were less susceptible to insect feeding and had lower numbers of caterpillars [79]. Others suggest that plant leaf colour and herbivores have synergistic evolution [80]. Changes in the content of phenolic compounds, as important stimulus products in response to biotic and abiotic stresses on plants, are necessary in understanding the resistance of plants to herbivory [7]. In this study, the changes in phenolic chemosynthetic accumulation were analyzed to provide a basis for future studies related to Acer L. plants.

5. Conclusions

In summary, the seasonal adaptation and metabolic regulation patterns of two maple species were investigated based on metabolomics and ionomics. The results showed that APM leaves senesce in autumn with a broad decline in primary metabolites shifting to secondary metabolites. The process of senescence in ATG and APM did not coincide, showing an increase in sugar content in ATG autumn leaves. The antioxidant system of different species of maple was synergistic between POD enzymes and C6C3C6-type phenolic compounds, rather than C6C1-type. The enhanced carotenoid level accompanied by upregulation of chlorogenic acid and rutin gives APM leaves their characteristic yellow colour in autumn. In contrast, the red colour of ATG leaves in autumn is due to the co-regulation of anthocyanins and possibly to accompanying elements (Fe, Zn, Mn) and isoflavones.

Supplementary Materials

The following supporting information can be downloaded at: https://www.mdpi.com/article/10.3390/f13122141/s1, Figure S1. Integrated correlation analysis of APM and ATG leaves in different seasons. (A) APM; (B) ATG. Red: positive correlation, blue: negative correlation. Large circles indicate high correlation. Figure S2. Metabolic network of APM leaves in different seasons. Red: up-regulation, green: down-regulation. Figure S3. Metabolic network of ATG leaves in different seasons. Red: up-regulation, green: down-regulation. Table S1. Metabolites were identified by GC-MS.

Author Contributions

K.W. and Y.L. (Yang Liu), writing—original draft. J.L., methodology. Y.R., Y.L. (Yuli Liu) and F.S., data curation. A.A., Z.T. and L.M. Writing—review and editing. All authors have read and agreed to the published version of the manuscript.

Funding

This study was financially supported by the Science and Technology Basic Resources Investigation Program of China (grant number 2019FY100505).

Conflicts of Interest

The authors declare no conflict of interest. We declare that we do not have any commercial or associative interest that represents a conflict of interest in connection with the work submitted.

References

  1. Lev-Yadun, S. The phenomenon of red and yellow autumn leaves: Hypotheses, agreements and disagreements. J. Evol. Biol. 2022, 35, 1245–1282. [Google Scholar] [CrossRef] [PubMed]
  2. Matile, P. Biochemistry of Indian summer: Physiology of autumnal leaf coloration. Exp. Gerontol. 2000, 35, 145–158. [Google Scholar] [CrossRef] [PubMed]
  3. Marin, A.; Ferreres, F.; Barbera, G.G.; Gil, M.I. Weather Variability Influences Color and Phenolic Content of Pigmented Baby Leaf Lettuces throughout the Season. J. Agric. Food Chem. 2015, 63, 1673–1681. [Google Scholar] [CrossRef] [PubMed]
  4. Garcia-Macias, P.; Ordidge, M.; Vysini, E.; Waroonphan, S.; Battey, N.H.; Gordon, M.H.; Hadley, P.; John, P.; Lovegrove, J.A.; Wagstaffe, A. Changes in the flavonoid and phenolic acid contents and antioxidant activity of red leaf lettuce (Lollo Rosso) due to cultivation under plastic films varying in ultraviolet transparency. J. Agric. Food Chem. 2007, 55, 10168–10172. [Google Scholar] [CrossRef] [PubMed]
  5. Koubaier, H.B.; Snoussi, A.; Essaidi, I.; Chaabouni, M.M.; Thonart, P.; Bouzouita, N. Betalain and Phenolic Compositions, Antioxidant Activity of Tunisian Red Beet (Beta vulgaris, L. Conditiva) Roots and Stems Extracts. Int. J. Food Prop. 2014, 17, 1934–1945. [Google Scholar] [CrossRef] [Green Version]
  6. Liu, J.; Liu, Y.; Wang, Y.; Abozeid, A.; Zu, Y.G.; Tang, Z.H. The integration of GC-MS and LC-MS to assay the metabolomics profiling in Panax ginseng and Panax quinquefolius reveals a tissue- and species-specific connectivity of primary metabolites and ginsenosides accumulation. J. Pharm. Biomed. Anal. 2017, 135, 176–185. [Google Scholar] [CrossRef]
  7. Wu, K.-X.; Liu, J.; Liu, Y.; Guo, X.-R.; Mu, L.-Q.; Hu, X.-H.; Tang, Z.-H. A Comparative Metabolomics Analysis Reveals the Tissue-Specific Phenolic Profiling in Two Acanthopanax Species. Molecules 2018, 23, 2078. [Google Scholar] [CrossRef] [Green Version]
  8. Liu, Y.; Liu, J.; Wang, Y.; Abozeid, A.; Tian, D.M.; Zhang, X.N.; Tang, Z.-H. The Different Resistance of Two Astragalus Plants to UV-B Stress is Tightly Associated with the Organ-specific Isoflavone Metabolism. Photochem. Photobiol. 2018, 94, 115–125. [Google Scholar] [CrossRef]
  9. Miller, R.; Owens, S.J.; Rorslett, B. Plants and colour: Flowers and pollination. Opt. Laser Technol. 2011, 43, 282–294. [Google Scholar] [CrossRef]
  10. Ferreres, F.; Pereira, D.M.; Valentao, P.; Andrade, P.B.; Seabra, R.M.; Sottomayor, M. New Phenolic Compounds and Antioxidant Potential of Catharanthus roseus. J. Agric. Food Chem. 2008, 56, 9967–9974. [Google Scholar] [CrossRef]
  11. Pan, Q.F.; Dai, Y.T.; Nuringtyas, T.R.; Mustafa, N.R.; Schulte, A.E.; Verpoorte, R.; Choi, Y.H. Investigation of the Chemomarkers Correlated with Flower Colour in Different Organs of Catharanthus roseus Using NMR-based Metabolomics. Phytochem. Anal. 2014, 25, 66–74. [Google Scholar] [CrossRef] [PubMed]
  12. Yang, Y.; Chen, M.J.; Liu, Y.X.; Ding, H.H.; Du, H.Y.; Sun, Z.Q.; Zhu, J. Metabolome and Transcriptome Analyses Reveal Different Flavonoid Biosynthesis and Chlorophyll Metabolism Profiles between Red Leaf and Green Leaf of Eucommia ulmoides. Forests 2021, 12, 1260. [Google Scholar] [CrossRef]
  13. Malien-Aubert, C.; Dangles, O.; Amiot, M.J. Color stability of commercial anthocyanin-based extracts in relation to the phenolic composition. Protective effects by intra- and intermolecular copigmentation. J. Agric. Food Chem. 2001, 49, 170–176. [Google Scholar] [CrossRef] [PubMed]
  14. Shi, R.L.; Melzer, M.; Zheng, S.J.; Benke, A.; Stich, B.; von Wiren, N. Iron Retention in Root Hemicelluloses Causes Genotypic Variability in the Tolerance to Iron Deficiency-Induced Chlorosis in Maize. Front. Plant Sci. 2018, 9, 557. [Google Scholar] [CrossRef] [PubMed] [Green Version]
  15. Lev-Yadun, S.; Yamazaki, K.; Holopainen, J.K.; Sinkkonen, A. Spring versus autumn leaf colours: Evidence for different selective agents and evolution in various species and floras. Flora 2012, 207, 80–85. [Google Scholar] [CrossRef]
  16. Avila-Ospina, L.; Clement, G.; Masclaux-Daubresse, C. Metabolite Profiling for Leaf Senescence in Barley Reveals Decreases in Amino Acids and Glycolysis Intermediates. Agronomy 2017, 7, 15. [Google Scholar] [CrossRef] [Green Version]
  17. Podzimska-Sroka, D.; O’Shea, C.; Gregersen, P.L.; Skriver, K. NAC Transcription Factors in Senescence: From Molecular Structure to Function in Crops. Plants 2015, 4, 412–448. [Google Scholar] [CrossRef] [Green Version]
  18. Avila-Ospina, L.; Moison, M.; Yoshimoto, K.; Masclaux-Daubresse, C. Autophagy, plant senescence, and nutrient recycling. J. Exp. Bot. 2014, 65, 3799–3811. [Google Scholar] [CrossRef] [Green Version]
  19. Hollmann, J.; Gregersen, P.L.; Krupinska, K. Identification of predominant genes involved in regulation and execution of senescence-associated nitrogen remobilization in flag leaves of field grown barley. J. Exp. Bot. 2014, 65, 3963–3973. [Google Scholar] [CrossRef] [Green Version]
  20. Watanabe, M.; Balazadeh, S.; Tohge, T.; Erban, A.; Giavalisco, P.; Kopka, J.; Mueller-Roeber, B.; Fernie, A.R.; Hoefgen, R. Comprehensive Dissection of Spatiotemporal Metabolic Shifts in Primary, Secondary, and Lipid Metabolism during Developmental Senescence in Arabidopsis. Plant Physiol. 2013, 162, 1290–1310. [Google Scholar] [CrossRef]
  21. Li, W.; Zhang, H.L.; Li, X.X.; Zhang, F.X.; Liu, C.; Du, Y.M.; Gao, X.; Zhang, Z.; Zhang, X.; Hou, Z.; et al. Intergrative metabolomic and transcriptomic analyses unveil nutrient remobilization events in leaf senescence of tobacco. Sci. Rep. 2017, 7, 12126. [Google Scholar] [CrossRef] [PubMed] [Green Version]
  22. Horbowicz, M.; Szablinska-Piernik, J.; Goraj-Koniarska, J.; Miyamoto, K.; Ueda, J.; Saniewski, M. Changes in Polar Metabolites Content during Natural and Methyl-Jasmonate-Promoted Senescence of Ginkgo biloba Leaves. Int. J. Mol. Sci. 2021, 23, 266. [Google Scholar] [CrossRef] [PubMed]
  23. Paaso, U.; Keski-Saari, S.; Keinanen, M.; Karvinen, H.; Silfver, T.; Rousi, M.; Mikola, J. Intrapopulation Genotypic Variation of Foliar Secondary Chemistry during Leaf Senescence and Litter Decomposition in Silver Birch (Betula pendula). Front. Plant Sci. 2017, 8, 1074. [Google Scholar] [CrossRef] [PubMed] [Green Version]
  24. Apel, K.; Hirt, H. Reactive oxygen species: Metabolism, oxidative stress, and signal transduction. Annu. Rev. Plant Biol. 2004, 55, 373–399. [Google Scholar] [CrossRef] [PubMed] [Green Version]
  25. Areces-Berazain, F.; Hinsinger, D.D.; Strijk, J.S. Genome-wide supermatrix analyses of maples (Acer, Sapindaceae) reveal recurring inter-continental migration, mass extinction, and rapid lineage divergence. Genomics 2021, 113, 681–692. [Google Scholar] [CrossRef] [PubMed]
  26. Yang, J.; Wariss, H.M.; Tao, L.; Zhang, R.; Yun, Q.; Hollingsworth, P.; Dao, Z.; Luo, G.; Guo, H.; Ma, Y.; et al. De novo genome assembly of the endangered Acer yangbiense, a plant species with extremely small populations endemic to Yunnan Province, China. Gigascience 2019, 8, giz085. [Google Scholar] [CrossRef] [Green Version]
  27. Bi, W.; Gao, Y.; Shen, J.; He, C.N.; Liu, H.B.; Peng, Y.; Zhang, C.; Xiao, P. Traditional uses, phytochemistry, and pharmacology of the genus Acer (maple): A review. J. Ethnopharmacol. 2016, 189, 31–60. [Google Scholar] [CrossRef]
  28. Gonzalez-Sarrias, A.; Li, L.; Seeram, N.P. Effects of maple (Acer) plant part extracts on proliferation, apoptosis and cell cycle arrest of human tumorigenic and non-tumorigenic colon cells. Phytother. Res. 2012, 26, 995–1002. [Google Scholar] [CrossRef]
  29. Liu, Y.Q.; Rose, K.N.; DaSilva, N.A.; Johnson, S.L.; Seeram, N.P. Isolation, Identification, and Biological Evaluation of Phenolic Compounds from a Traditional North American Confectionery, Maple Sugar. J. Agric. Food Chem. 2017, 65, 4289–4295. [Google Scholar] [CrossRef]
  30. Lu, X.Y.; Chen, Z.; Deng, X.Y.; Gu, M.Y.; Zhu, Z.Y.; Ren, J.; Fu, S. Transcriptomic and metabolomic analyses of non-structural carbohydrates in red maple leaves. Funct. Integr. Genomic 2021, 21, 265–281. [Google Scholar] [CrossRef]
  31. Harris, A.J.; Chen, Y.; Olsen, R.T.; Lutz, S.; Wen, J. On merging Acer sections Rubra and Hyptiocarpa: Molecular and morphological evidence. PhytoKeys 2017, 86, 9–42. [Google Scholar] [CrossRef] [PubMed] [Green Version]
  32. Vargas-Rodriguez, Y.L.; Urbatsch, L.E.; Karaman-Castro, V. Taxonomy and phylogenetic insights for Mexican and Central American species of Acer (Sapindaceae). J. Torrey Bot. Soc. 2020, 147, 49–86. [Google Scholar] [CrossRef]
  33. Liu, W.; Ouyang, Y.; Wan, C.P. Flavonoids of the Genus of Acer. Asian J. Chem. 2013, 25, 7075–7078. [Google Scholar] [CrossRef]
  34. Ren, H.J.; Feng, Z. Comparison and correlation analysis of flavonoids and chlorogenic acid contents in different strains of Acer truncatum. Food Sci. Technol. 2018, 38, 319–326. [Google Scholar] [CrossRef] [Green Version]
  35. Liu, C.; Tsuda, Y.; Shen, H.; Hu, L.; Saito, Y.; Ide, Y. Genetic structure and hierarchical population divergence history of Acer mono var. mono in South and Northeast China. PLoS ONE 2014, 9, e87187. [Google Scholar] [CrossRef] [Green Version]
  36. Yang, H.; Sung, S.H.; Kim, Y.C. Two new hepatoprotective stilbene glycosides from Acer mono leaves. J. Nat. Prod. 2005, 68, 101–103. [Google Scholar] [CrossRef]
  37. Jin, Y.J.; Ji, Y.; Jang, Y.P.; Choung, S.Y. Acer tataricum subsp. ginnala Inhibits Skin Photoaging via Regulating MAPK/AP-1, NF-kappaB, and TGFbeta/Smad Signaling in UVB-Irradiated Human Dermal Fibroblasts. Molecules 2021, 26, 662. [Google Scholar]
  38. Bi, W.; He, C.N.; Li, X.X.; Zhou, L.Y.; Liu, R.J.; Zhang, S.; Li, G.Q.; Chen, Z.C.; Zhang, P.F. Ginnalin A from Kujin tea (Acer tataricum subsp. ginnala) exhibits a colorectal cancer chemoprevention effect via activation of the Nrf2/HO-1 signaling pathway. Food Funct. 2018, 9, 2809–2819. [Google Scholar]
  39. Bi, W.; Shen, J.; Gao, Y.; He, C.N.; Peng, Y.; Xiao, P.G. Ku-jin tea (Acer tataricum subsp ginnala or A. tataricum subsp theiferum), an underestimated functional beverage rich in antioxidant phenolics. J. Funct. Foods 2016, 24, 75–84. [Google Scholar] [CrossRef]
  40. Bi, W.; Liu, H.; Shen, J.; Zhang, L.H.; Li, P.; Peng, B.; Cao, L.; Zhang, P.; He, C.; Xiao, P. Chemopreventive effects of Ku-jin tea against AOM-induced precancerous colorectal lesions in rats and metabolomic analysis. Sci. Rep. 2017, 7, 15893. [Google Scholar] [CrossRef] [Green Version]
  41. Liu, R.Y.; Dong, X.C.; Zhang, M.M.; Qu, Y.; Jin, W.J.; Li, X.; Zhou, L.; Yu, L.; Li, W. Comparative transcriptome analysis reveals candidate genes for leaf color formation in a thermo-sensitive leaf-color mutant generated by carbon-ion beam in green wandering Jew (Tradescantia fluminensis). Sci. Hortic. 2021, 288, 110300. [Google Scholar] [CrossRef]
  42. Kohler, H.; Contreras, R.A.; Pizarro, M.; Cortes-Antiquera, R.; Zuniga, G.E. Antioxidant Responses Induced by UVB Radiation in Deschampsia antarctica Desv. Front. Plant Sci. 2017, 8, 921. [Google Scholar] [CrossRef]
  43. Yang, N.; Song, X.Q.; Lu, X.Y.; Chen, Q.; Liu, J.; Liu, Y.; Wang, H.; Zhang, Z.; Tang, Z. Comparative study on metabolites and elements of two dominant plant communities in saline-alkali grassland. Environ. Exp. Bot. 2021, 190, 104587. [Google Scholar] [CrossRef]
  44. Liu, J.; Kang, R.; Liu, Y.; Wu, K.X.; Yan, X.; Song, Y.; Pan, L.B.; Tang, Z.H. Differential Metabolite Accumulation in Different Tissues of Gleditsia sinensis under Water Stress and Rehydration Conditions. Forests 2020, 11, 542. [Google Scholar] [CrossRef]
  45. Liu, Y.; Liu, J.; Wang, H.Z.; Wu, K.X.; Tang, Z.H. Comparison of the global metabolic responses to UV-B radiation between two medicinal Astragalus species: An integrated metabolomics strategy. Environ. Exp. Bot. 2020, 176, 104094. [Google Scholar] [CrossRef]
  46. Luo, J.R.; Shi, Q.Q.; Niu, L.X.; Zhang, Y.L. Transcriptomic Analysis of Leaf in Tree Peony Reveals Differentially Expressed Pigments Genes. Molecules 2017, 22, 324. [Google Scholar] [CrossRef] [PubMed] [Green Version]
  47. Ma, X.Z.; Sun, X.Q.; Li, C.M.; Huan, R.; Sun, C.H.; Wang, Y.; Xiao, F.; Wang, Q.; Chen, P.; Ma, F.; et al. Map-based cloning and characterization of the novel yellow-green leaf gene ys83 in rice (Oryza sativa). Plant Physiol. Biochem. 2017, 111, 1–9. [Google Scholar] [CrossRef]
  48. Shi, X.Y.; Xu, S.S.; Mu, D.; Sadeghnezhad, E.; Li, Q.; Ma, Z.H.; Zhao, L.; Zhang, Q.; Wang, L. Exogenous Melatonin Delays Dark-Induced Grape Leaf Senescence by Regulation of Antioxidant System and Senescence Associated Genes (SAGs). Plants 2019, 8, 366. [Google Scholar] [CrossRef] [Green Version]
  49. Kraj, W. Antioxidative enzyme activity as the factor causing differential autumn senescence in phenological forms of beech (Fagus sylvatica L.). Acta Physiol. Plant 2017, 39, 1–16. [Google Scholar] [CrossRef]
  50. Watanabe, T.; Broadley, M.R.; Jansen, S.; White, P.J.; Takada, J.; Satake, K.; Takamatsu, T.; Tuah, S.J.; Osaki, M. Evolutionary control of leaf element composition in plants. New Phytol. 2007, 174, 516–523. [Google Scholar] [CrossRef]
  51. Wang, L.L.; Xiong, F.; Yang, L.C.; Xiao, Y.M.; Zhou, G.Y. A Seasonal Change of Active Ingredients and Mineral Elements in Root of Astragalus membranaceus in the Qinghai-Tibet Plateau. Biol. Trace Element Res. 2021, 199, 3950–3959. [Google Scholar] [CrossRef] [PubMed]
  52. Zhao, H.Y.; Tang, J.; Yang, Q.L. Effects of geographical origin, variety, harvest season, and their interactions on multi-elements in cereal, tuber, and legume crops for authenticity. J. Food Compos. Anal. 2021, 100, 103900. [Google Scholar] [CrossRef]
  53. Zhang, W.W.Q.; Ouyang, Z.; Zhao, M.; Wei, Y.; Peng, H.S.; Wang, Q.; Guo, L.; Zhang, W. The influences of inorganic elements in soil on the development of famous—region Atractylodes lancea (Thunb.) DC. Pharmacogn. Mag. 2015, 11, 337–344. [Google Scholar] [PubMed] [Green Version]
  54. Ning, L.H.; Kan, G.Z.; Shao, H.B.; Yu, D.Y. Physiological and transcriptional responses to salt stress in salt-tolerant and salt-sensitive soybean (Glycine max [L.] Merr.) seedlings. Land Degrad. Dev. 2018, 29, 2707–2719. [Google Scholar] [CrossRef]
  55. Medveckiene, B.; Kulaitiene, J.; Vaitkeviciene, N.; Levickiene, D.; Buneviciene, K. Effect of Harvesting in Different Ripening Stages on the Content of the Mineral Elements of Rosehip (Rosa spp.) Fruit Flesh. Horticulturae 2022, 8, 467. [Google Scholar] [CrossRef]
  56. Moschen, S.; Bengoa Luoni, S.; Di Rienzo, J.A.; Caro, M.D.; Tohge, T.; Watanabe, M.; Hollmann, J.; González, S.; Rivarola, M.; García-García, F.; et al. Integrating transcriptomic and metabolomic analysis to understand natural leaf senescence in sunflower. Plant Biotechnol. J. 2016, 14, 719–734. [Google Scholar] [CrossRef] [PubMed] [Green Version]
  57. Obata, T.; Fernie, A.R. The use of metabolomics to dissect plant responses to abiotic stresses. Cell. Mol. Life Sci. 2012, 69, 3225–3243. [Google Scholar] [CrossRef] [PubMed] [Green Version]
  58. Fan, M.C.; Fan, Y.H.; Rao, Z.M.; Li, Y.; Qian, H.F.; Zhang, H.; Wu, G.; Qi, X.; Wang, L. Comparative investigation on metabolite changes in ‘wu mi’ production by Vaccinium bracteatum Thunb. leaves based on multivariate data analysis using UPLC-QToF-MS. Food Chem. 2019, 286, 146–153. [Google Scholar] [CrossRef]
  59. Fan, M.C.; Lian, W.J.; Li, T.T.; Fan, Y.H.; Rao, Z.M.; Li, Y.; Qian, H.; Zhang, H.; Wu, G.; Qi, X.; et al. Metabolomics approach reveals discriminatory metabolites associating with the blue pigments from Vaccinium bracteatum thunb. leaves at different growth stages. Ind. Crops Prod. 2020, 147, 112252. [Google Scholar] [CrossRef]
  60. Adams, E.; Miyazaki, T.; Moon, J.Y.; Sawada, Y.; Sato, M.; Toyooka, K.; Hirai, M.; Shin, R. Syringic Acid Alleviates Cesium-Induced Growth Defect in Arabidopsis. Int. J. Mol. Sci. 2020, 21, 9116. [Google Scholar] [CrossRef]
  61. Luo, J.; Butelli, E.; Hill, L.; Parr, A.; Niggeweg, R.; Bailey, P.; Weisshaar, B.; Martin, C. AtMYB12 regulates caffeoyl quinic acid and flavonol synthesis in tomato: Expression in fruit results in very high levels of both types of polyphenol. Plant J. 2008, 56, 316–326. [Google Scholar] [CrossRef] [PubMed]
  62. Chiu, C.H.; Lin, K.H.; Lin, H.H.; Chu, W.X.; Lai, Y.C.; Chao, P.Y. Analysis of Chlorogenic Acid in Sweet Potato Leaf Extracts. Plants 2022, 11, 2063. [Google Scholar] [CrossRef] [PubMed]
  63. Li, P.H.; Dong, Q.; Ge, S.J.; He, X.Z.; Verdier, J.; Li, D.Q.; Zhao, J. Metabolic engineering of proanthocyanidin production by repressing the isoflavone pathways and redirecting anthocyanidin precursor flux in legume. Plant Biotechnol. J. 2016, 14, 1604–1618. [Google Scholar] [CrossRef] [PubMed] [Green Version]
  64. Lim, P.O.; Kim, H.J.; Nam, H.G. Leaf senescence. Annu. Rev. Plant Biol. 2007, 58, 115–136. [Google Scholar] [CrossRef] [PubMed] [Green Version]
  65. Shayganfar, A.; Azizi, M.; Rasouli, M. Various strategies elicited and modulated by elevated UV-B radiation and protectant compounds in Thymus species: Differences in response over treatments, acclimation and interaction. Ind. Crops Prod. 2018, 113, 298–307. [Google Scholar] [CrossRef]
  66. Sgherri, C.; Cosi, E.; Navari-Izzo, F. Phenols and antioxidative status of Raphanus sativus grown in copper excess. Physiol. Plant. 2003, 118, 21–28. [Google Scholar] [CrossRef]
  67. Goto, T.; Kondo, T. Structure and Molecular Stacking of Anthocyanins—Flower Color Variation. Angew. Chem. Int. Ed. 1991, 30, 17–33. [Google Scholar] [CrossRef]
  68. Lv, X.; Li, L.; Lu, X.; Wang, W.; Sun, J.; Liu, Y.; Mu, J.; Ma, Q.; Wang, J. Effects of organic acids on color intensification, thermodynamics, and copigmentation interactions with anthocyanins. Food Chem. 2022, 396, 133691. [Google Scholar] [CrossRef]
  69. Shoji, K.; Miki, N.; Nakajima, N.; Momonoi, K.; Kato, C.; Yoshida, K. Perianth bottom-specific blue color development in Tulip cv. Murasakizuisho requires ferric ions. Plant Cell Physiol. 2007, 48, 243–251. [Google Scholar] [CrossRef] [Green Version]
  70. Ben Abdallah, H.; Mai, H.J.; Slatni, T.; Fink-Straube, C.; Abdelly, C.; Bauer, P. Natural Variation in Physiological Responses of Tunisian Hedysarum carnosum under Iron Deficiency. Front. Plant Sci. 2018, 9, 1383. [Google Scholar] [CrossRef] [Green Version]
  71. Ren, L.J.; Eller, F.; Lambertini, C.; Guo, W.Y.; Sorrell, B.K.; Brix, H. Minimum Fe requirement and toxic tissue concentration of Fe in Phragmites australis: A tool for alleviating Fe-deficiency in constructed wetlands. Ecol. Eng. 2018, 118, 152–160. [Google Scholar] [CrossRef]
  72. Singh, D.P.; Beloy, J.; McInerney, J.K.; Day, L. Impact of boron, calcium and genetic factors on vitamin C, carotenoids, phenolic acids, anthocyanins and antioxidant capacity of carrots (Daucus carota). Food Chem. 2012, 132, 1161–1170. [Google Scholar] [CrossRef] [PubMed]
  73. Fracheboud, Y.; Luquez, V.; Bjorken, L.; Sjodin, A.; Tuominen, H.; Jansson, S. The Control of Autumn Senescence in European Aspen. Plant Physiol. 2009, 149, 1982–1991. [Google Scholar] [CrossRef] [PubMed] [Green Version]
  74. Kumar, A.; Abrol, E.; Koul, S.; Vyas, D. Seasonal low temperature plays an important role in increasing metabolic content of secondary metabolites in Withania somnifera (L.) Dunal and affects the time of harvesting. Acta Physiol. Plant 2012, 34, 2027–2031. [Google Scholar] [CrossRef]
  75. Vitasse, Y.; Porte, A.J.; Kremer, A.; Michalet, R.; Delzon, S. Responses of canopy duration to temperature changes in four temperate tree species: Relative contributions of spring and autumn leaf phenology. Oecologia 2009, 161, 187–198. [Google Scholar] [CrossRef] [PubMed]
  76. Lev-Yadun, S. Avoiding rather than resisting herbivore attacks is often the first line of plant defence. Biol. J. Linn. Soc. 2021, 134, 775–802. [Google Scholar] [CrossRef]
  77. Doring, T.F.; Archetti, M.; Hardie, J. Autumn leaves seen through herbivore eyes. Proc. R. Soc. B Biol. Sci. 2009, 276, 121–127. [Google Scholar] [CrossRef] [Green Version]
  78. Hughes, N.M.; Lev-Yadun, S. Red/purple leaf margin coloration: Potential ecological and physiological functions. Environ. Exp. Bot. 2015, 119, 27–39. [Google Scholar] [CrossRef]
  79. Baisden, E.C.; Tallamy, D.W.; Narango, D.L.; Boyle, E. Do Cultivars of Native Plants Support Insect Herbivores? HortTechnology 2018, 28, 596. [Google Scholar] [CrossRef] [Green Version]
  80. Sinkkonen, A.; Somerkoski, E.; Paaso, U.; Holopainen, J.K.; Rousi, M.; Mikola, J. Genotypic variation in yellow autumn leaf colours explains aphid load in silver birch. New Phytol. 2012, 195, 461–469. [Google Scholar] [CrossRef]
Figure 1. Leaves of two Acer L. species in different seasons and leaf colour parameters: (A) APM (green, summer; yellow, autumn); (B) ATG (green, summer; red, autumn); (C) leaf colour parameters. Different letters indicate significant differences in different tissues (p < 0.05).
Forests 13 02141 g001
Figure 2. Pigment and antioxidant enzyme of APM and ATG leaves in different seasons: (A) pigment content and (B) antioxidant enzyme activity. Different letters indicate significant differences in different tissues (p < 0.05).
Forests 13 02141 g002
Figure 3. PCA analysis of mineral elements in APM and ATG leaves in different seasons: (A) APM and (B) ATG. APM_g: APM with green leaves; APM_y: APM with yellow leaves; ATG_g: ATG with green leaves; ATG_r: ATG with red leaves.
Forests 13 02141 g003
Figure 4. Identification results of non-targeted metabolomics: (A) classification of compounds and (B) Venn diagram description of differential compounds.
Forests 13 02141 g004
Figure 5. PLS-DA and metabolic pathway enrichment analysis in APM and ATG leaves in different seasons: (A,B) APM; (C,D) ATG.
Forests 13 02141 g005
Figure 6. Cluster analysis of differential metabolites in leaves during different seasons: (A) APM and (B) ATG. Three biological replicates per group; blue indicates low compound accumulation, while red indicates high compound accumulation.
Forests 13 02141 g006
Figure 7. Cluster analysis of phenolic compounds in leaves during different seasons: (A) APM and (B) ATG. Three biological replicates per group; blue indicates low compound accumulation, while red indicates high compound accumulation.
Forests 13 02141 g007
Figure 8. Content of different types of phenolic compounds in APM and ATG leaves in different seasons. Different letters indicate significant differences in different tissues (p < 0.05).
Forests 13 02141 g008
Figure 9. Major metabolic networks of APM and ATG leaves in different seasons.
Forests 13 02141 g009
Table 1. Mineral element contents of APM and ATG leaves in different seasons (mg/g DW).
KCaMgNaFeCuZnMnMoB
APM_g13.456 ± 0.328 a37.117 ± 0.695 b4.733 ± 0.130 b0.281 ± 0.024 a0.190 ± 0.006 b0.010 ± 0.000 a0.009 ± 0.000 c0.141 ± 0.003 c0.001 ± 0.000 a0.061 ± 0.002 a
APM_y9.425 ± 0.147 b41.228 ± 0.758 a5.233 ± 0.074 a0.275 ± 0.040 a0.128 ± 0.002 c0.008 ± 0.000 b0.016 ± 0.000 b2.304 ± 0.025 a0.001 ± 0.000 a0.025 ± 0.001 c
ATG_g13.361 ± 0.035 a23.367 ± 0.121 c4.767 ± 0.029 b0.283 ± 0.026 a0.176 ± 0.004 b0.008 ± 0.000 b0.014 ± 0.000 b0.081 ± 0.001 d0.001 ± 0.000 a0.024 ± 0.011 c
ATG_r7.847 ± 0.108 c11.483 ± 0.107 d1.833 ± 0.012 c0.239 ± 0.008 a0.471 ± 0.003 a0.006 ± 0.000 c0.027 ± 0.000 a0.322 ± 0.002 b0.001 ± 0.000 a0.039 ± 0.000 b
Note: Data are presented as the means ± SEs (n = 3). Means followed by the same letter in the same column are not significantly different (p < 0.05).
Publisher’s Note: MDPI stays neutral with regard to jurisdictional claims in published maps and institutional affiliations.

