Article

Planning Restoration of Connectivity and Design of Corridors for Biodiversity Conservation

1
Department of Environment and Agroforestry, Faculty of Sciences and Arts, Catholic University of Ávila, 05005 Ávila, Spain
2
Department of Landscape Architecture, Faculty of Agriculture, Aydın Adnan Menderes University, Aydın 09010, Turkey
3
European Commission, Joint Research Centre, Via E. Fermi 2749, I-21027 Ispra, VA, Italy
4
Departamento de Farmacología, Farmacognosia y Botánica, Facultad de Farmacia, Universidad Complutense de Madrid, Plaza de Ramón y Cajal, 28040 Madrid, Spain
5
Silvanet Research Group, ETSI Montes, Universidad Politécnica de Madrid, Ciudad Universitaria s/n, 28040 Madrid, Spain
6
Junta de Castilla y León, C. Cruz Roja, 2, 05001 Ávila, Spain
7
Department of Landscape Architecture, Faculty of Forestry, Çankırı Karatekin University, Çankırı 18200, Turkey
8
Section of Zoology, Department of Biology, Faculty of Science, Ege University, Izmir 35100, Turkey
9
Natural History Application and Research Centre, Ege University, Izmir 35100, Turkey
*
Author to whom correspondence should be addressed.
Forests 2022, 13(12), 2132; https://doi.org/10.3390/f13122132
Submission received: 3 November 2022 / Revised: 2 December 2022 / Accepted: 9 December 2022 / Published: 12 December 2022
(This article belongs to the Section Forest Biodiversity)

Abstract

:
Habitats have been undergoing significant changes due to environmental processes and human impact that lead into habitat fragmentation and connectivity loss. To improve quality habitats and maintain ecological connectivity, elements that improve the connectivity of habitats need to be identified. To meet this goal, finding optimal pathways locations plays a key role for designing corridors for biodiversity conservation. Conducted in the Castilla y León region of Spain, this paper aims to determine optimal pathways and to enhance the connectivity of protected areas. To this end, three different scenarios were developed including the Natura 2000 network and their surroundings (Natura 2000, Level 0, and Level 1). We used Restoration Planner (RP) available in GuidosToolbox to analyze the network and detect pairwise optimum restoration pathways between the five largest network objects. Our results demonstrate that connector density varies across the region for each scenario. There was also a large variability in the length of connectors. Connectors were found mainly distributed around the center and northwestern part of Castilla y León. This paper also suggests that proposed new restoration pathways should increase in the study area. Thus, the findings can be used effectively for extensive planning and interpretation in biodiversity conservation.

1. Introduction

Ecological connectivity has a key role to play in maintaining the biological diversity of a territory. The patches of habitat that make up a territory allow the movement of species and ecological flows. This capacity of a given territory is known as ecological connectivity [1] and allow different populations to exchange genes. It also favours their strength in the face of disturbances, thus guaranteeing success against possible local extinctions [2]. Ecological connectivity was defined as the “variability among living organisms of all kinds, including terrestrial and aquatic” [3], being affected but several processes that limit ecological connectivity in a territory [4]. The continuity of vegetation patches is reduced, thus increasing isolated and disconnected areas [5], so the amount of territory that organisms can use for their activity is reduced [6]. Other negative effects of habitat fragmentation are species compositional changes, alteration of community structure and population dynamics, or modification of ethology, reproductive success, and individual fitness [7]. Furthermore, Pearce et al. (2022) [8] consider that global climate change causes a considerable intensification of habitat fragmentation, but maintenance of biodiversity would help to mitigate these negative effects [2].
In this sense, there are many studies that are focused on connectivity, highlighting the case of systematic conservation assessment to improve connectivity [2,9,10,11,12,13]. When creating a connectivity network, it is necessary to elaborate a configuration of habitat patches capable of generating linkages that enable the movement of species of interest [14,15]. In the case of connectivity planning that favors the movement of multiple species, as is the case in this study, it is particularly interesting to take into account the permeability of corridors to favour connectivity at a global level [16].
At the European Union (EU), the Natura 2000 Network is one of the largest coordinated actions at the international level. Its objective is to ensure the long-term continuity of Europe’s most valuable species and habitats. The Birds Directive [3] and the Habitats Directive [17] constitute the legislation protecting these species and habitats. In addition, the European protected areas, especially those with permanent vegetation and forest/woodland communities, are considered extremely important to ensuring the connectivity of the Natura 2000 Network [18]. These types of habitats provide a pathway for species movement between patches without the influence of the degree of fragmentation of surrounding habitats [19]. The Natura 2000 Network of protected areas is made up of more than 27,000 sites that account for 18% of the territory of the EU [20]. In Spain, the Natura 2000 Network occupies approximately 210,000 km2, and is composed of 1467 Sites of Community Importance (SCI) and 644 Special Protection Areas for Birds (SPA) [21]. Member states must provide themselves with clear criteria by which it is possible to identify and define protected areas at the European level to improve the conservation and protection of nature [22]. In recent years, this has led to the proliferation of a wide variety of connectivity studies with the aim of biodiversity conservation planning [23]. It is essential that decisions made for nature conservation are based on an optimal selection of sites to be protected [24,25]. In this way, there are interesting examples of works which present ecological networks that deal with the long term and included to real physical planning by legislation [26].
All of these negative effects of fragmentation that have been mentioned can be mitigated by establishing ecological corridors [27]. Ecological corridors have a higher intensity of ecological flows than the rest of the territory [28]. Corridors can ensure the migratory movements and dispersal of species necessary for the conservation of biological diversity and ecological and evolutionary processes [29]. Structurally, a corridor would be a linear or elongated landscape element that is qualitatively distinct from adjacent units. Although there has been growing interest in identifying corridors, a limited number of studies have focused on restoration modelling in the context of ecological connectivity. For instance, Dondina et al. (2018) [30] demonstrate that implementing new pathways could be more effective than restoration efforts on existing corridors. Their study provides an insight into the enhancement of connectivity and shows the significance of modelling restoration pathways. It can be concluded here that establishing these pathways can decrease the adverse impacts of fragmentation. Additionally, these pathways can support the continuity of vegetation patches, and green networks might be strengthened [31]. Furthermore, they can support the exchange of genes in different populations, ease the movement of species among the patches, and promote species richness. Velázquez et al. [32] found that species richness and landscape diversity are correlated with ecological corridors.
To summarize, at the EU, there is concern about conflicts between biodiversity conservation and other human activities [13], as they often have important political, economic, and environmental repercussions [33]. The greatest threats to habitat fragmentation are motivated by agricultural activity [34] and especially urbanization, as this activity has a persistence in the landscape and leads to the destruction of vegetation cover [35]. Therefore, to improve habitat quality and functional connectivity it is necessary to identify those elements in the landscape that represent barriers, worsen habitat quality, or restrict the movement of species [13]. In this regard, the objective of this work is to identify the optimal pathways to improve the connectivity of protected areas for biodiversity conservation. These pathways are connectors that will be calculated using connectivity analyses (Restoration Planner).

2. Material and Methods

2.1. Study Area

The study area for this work is the Castilla y León region located in northwest Spain. It is one of the regions with the lowest population density in Spain and with a wide variety of agricultural and forest ecosystems. It is a vast plateau (94.222 km2) surrounded by mountains and varies greatly in altitude between 200 and 2600 m. This leads to huge differences in precipitation, about 1500 mm per year in the mountains and 400 mm in the centre of the study area.

2.2. Methodology

Based on the work of Rincón et al. (2021) [19], a methodology was developed to test the improvement of connectivity including new proposed areas for inclusion in the Natura 2000 Network. The aim of the Natura 2000 Network is to protect habitats and species in their natural areas of distribution, and in order to protect these habitats and species, a value map of importance for biodiversity (VIB) was generated to propose 2 levels of protection of the territory for biodiversity conservation which overlapped with the Natura 2000 network. In this way, this study will present three different input areas for the improvement of connectivity for biodiversity conservation:
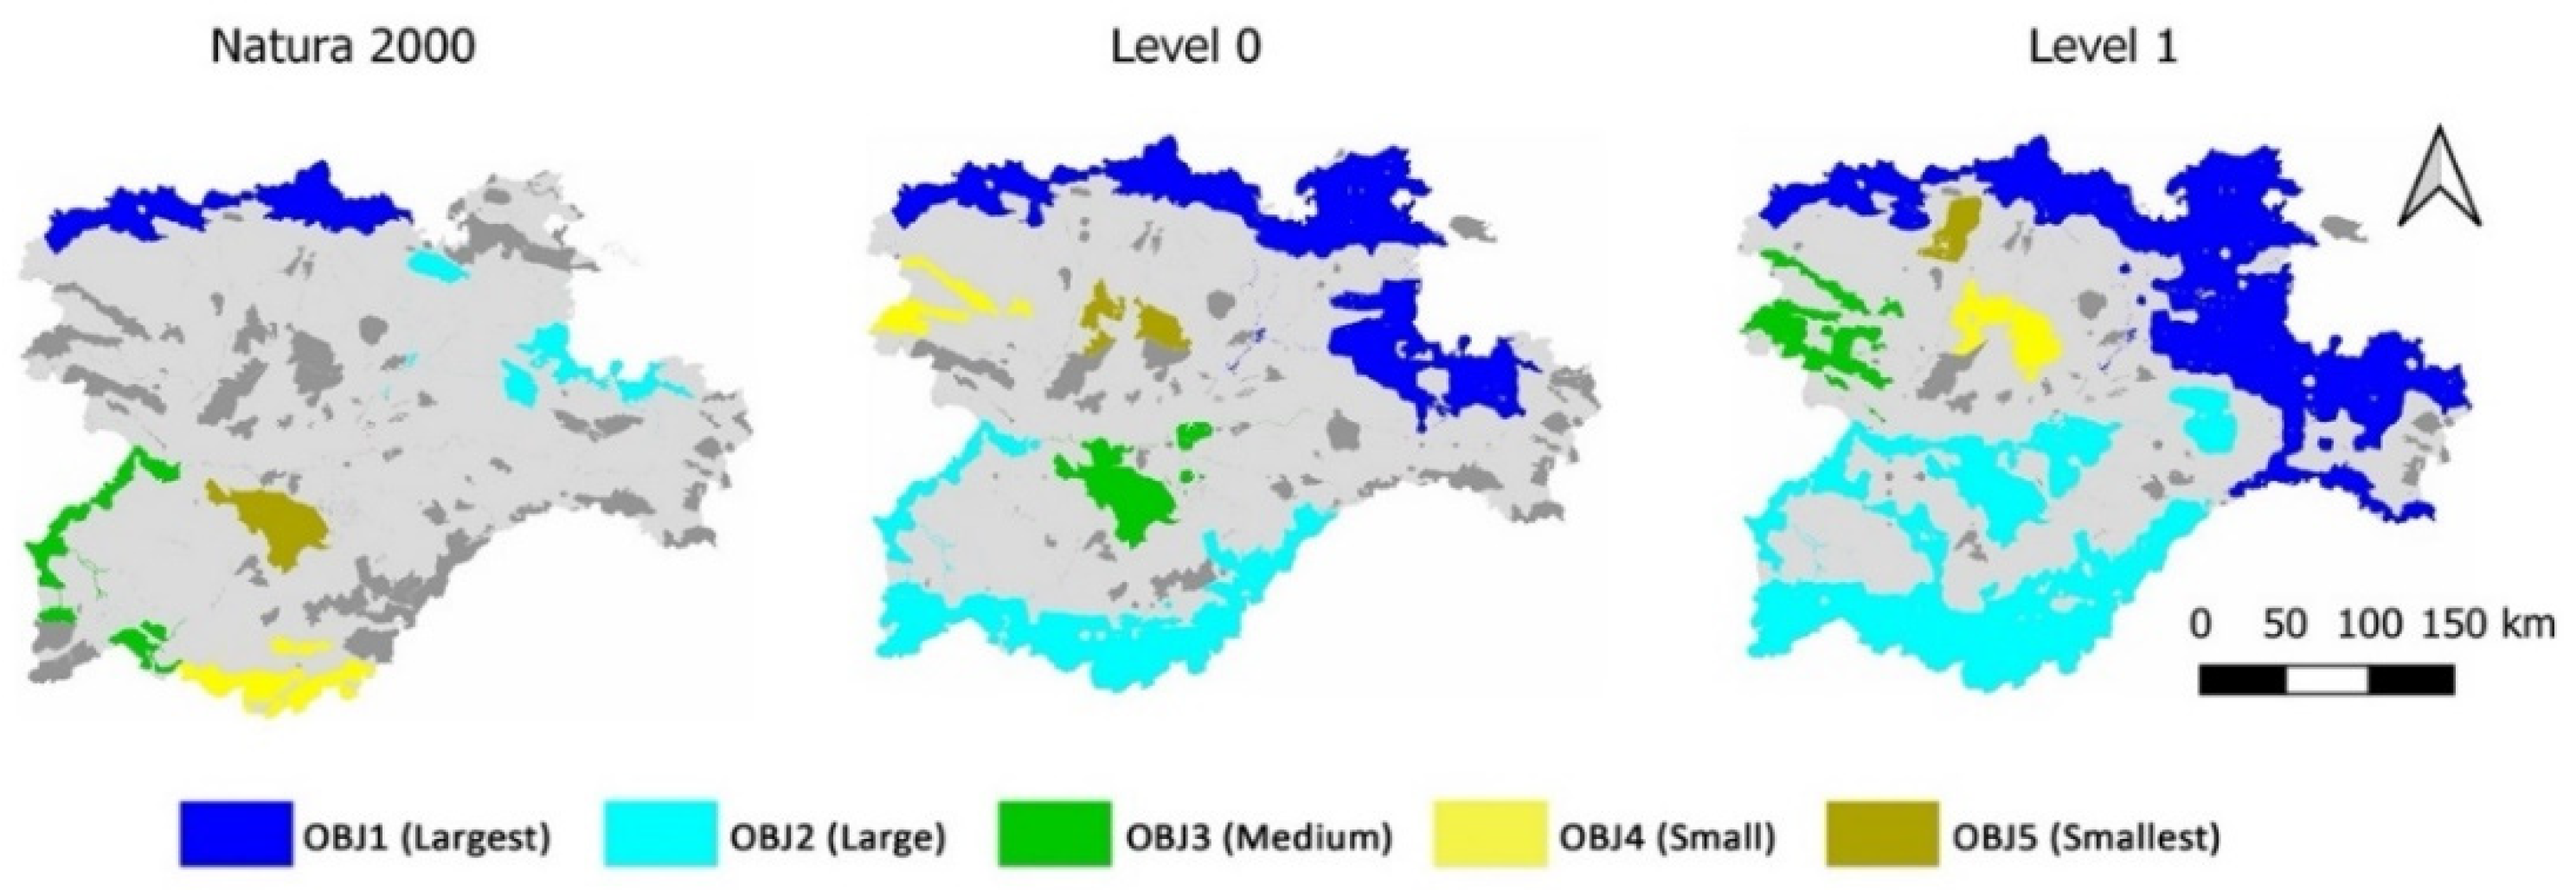
  • Natura 2000 scenario: current Natura 2000 areas in Castilla y León region,
  • Level 0 scenario: extension of Natura 2000 areas in Castilla y León region based on the first quartile of VIB values and land use classes well-adapted for biodiversity conservation.
  • Level 1 scenario: extension of Natura 2000 areas in Castilla y León based on the second quartile of VIB values and land use classes well-adapted for biodiversity conservation (Figure 1).

2.3. Resistance Layer

A raster resistance layer was calculated following De La Fuente (2018) [18] and Gurrutxaga (2010) [36], and was used to calculate the suitability of future connectors. This resistance expresses a “friction” value, i.e., the opposition of a territory to being traversed by a terrestrial species. For this reason, the existence of roads, railways or urban centres has been taken into account. The resistance layer was generated combining Corine Land Cover (CLC) 2018’s land use and average traffic of infrastructures (rail and road networks, average daily traffic intensity, and viaducts and tunnels in highways) with a cell resolution of 20 m and maps at a scale of 1:25,000 (Figure 2).
To calculate the layer, the different resistance values were added together and then reclassified as a percentage. This conversion is necessary because Restoration Planner works with percentage values of resistance. Values above 1000 are used as background due to their high resistance to movement and dispersal. If the land use involved forest areas, we assigned the smallest factor (value 1) to native forest. The value was higher for plantations with intermediate harvests of exotic species, such as spruce, and even higher for plantations of short-term harvests, such as radiata pine. In cases where the land use contained more than one forest species, the total resistance value was calculated by weight averaging using the percentage coverage [36]. All values of CLC codes are in Appendix A. cost map analysis (Table A1, Table A2 and Table A3). The foreground is assigned a value of 2 in RP, which implies the minimum resistance or that we are inside this foreground.

2.4. Identification of Areas of Special Importance for the Restoration of Connectivity of the Natura 2000 Network

In implementing this study, we identifed the level of protection to which the Natura 2000 Network should be extended and the best locations for improving connectivity in the three analyzed scenarios. The analysis was carried out through the Restoration Planner [37] available in the GuidosToolbox [38]. The RP provides a variety of tools to quantify key network attributes, and design and evaluate the efficiency of restoration measures. A network is defined as a set of individual objects of any type, for example patches of a forest network, or species habitat, or any other homogeneous area outline. RP addresses the following two levels:
(a)
Status: this level analyzes and summarizes the current status of the network, attributing a higher importance to larger objects. There are two key status indicators areas: the equivalent connected area (ECA) [2], and Coherence. ECA, equivalent connected area, is defined as the size that a single forest habitat patch (maximally connected) should have to provide the same value (of IIC or PC) than the actual forest habitat pattern in the landscape. ECA is in general preferable to define overall connectivity because it has area units, and it is easier to interpret [2]. Coherence is the normalization of ECA, COH = ECA/ECAmax, which reports the degree of network connectivity within (0, 100) %. When Coherence = 100%, all network objects are fully interconnected. Changes in percent points of coherence serve as an intuitive way to report on temporal network changes or to quantify the impact of restoration measures by measuring coherence before and after the restoration event.
(b)
Planning: this level allows to either interactively insert and evaluate custom restoration measures, detect a single optimum pathway for restoration, or provide an overview of ten efficient restoration pathways for further evaluation. The difference in coherence quantifies the impact of any given restoration measure.
Once we set up the resistance layer based on De la Fuente et al. (2018) [18] and Gurrutxaga et al. (2010) [36], we used this map as a required input for RP within GuidosToolbox to analyse different restoration scenarios. In this study, we used the RP assessment planning (option “Show Optimum Big 5”) to analyze the network and detect pairwise optimum restoration pathways between the five largest network objects. For each pair, RP conducts a least cost path analysis designed to minimize the number of restoration pixels and maximize the inclusion of existing network objects to increase network coherence. The result shows the ten optimal pathways, as well as a tabular summary, listing key network indicators and the efficiency for each detected restoration pathway. More details and examples are summarized in the RP product sheet (https://ies-ows.jrc.ec.europa.eu/gtb/GTB/psheets/GTB-RestorationPlanner.pdf (accessed on 1 November 2022)).

3. Results

Restoration Connectors for Each Scenario
As a first overview, Figure 3 shows all network objects for the three scenarios, with the five largest objects color-coded in decreasing size from the largest object in blue to cyan, green, yellow, and the fifth largest network object in brown. Here, we focus on large network objects because they provide the highest contribution to ECA.
Please note that many small objects are not visible in Figure 3, but they will become visible when looking at the full resolution image (see Appendix A for information to access the full dataset).
Table 1 shows the status summary providing network information on:
  • REP_UNIT: name of reporting unit
  • AREA: total network area in the reporting unit
  • RAC: Reference Area Coverage (51.54% of Castilla Lyon is network area in Level 1)
  • NR_OBJ: number of all network objects
  • LARG_OBJ: size of the largest network object
  • APS: average patch size over all network objects
  • CNOA: Critical New Object Area (academic, see RP product sheet)
  • ECA: Equivalent Connected Area
  • COH: Coherence
  • REST_POT: restoration potential for the current network (100-COH)
Table 1 shows that the area added to the original Natura2000 network leads to an increase in ECA in the scenario Level 0 and Level 1. For Level 1, Coherence has increased from 25.64% to 59.71%. Furthermore, the restoration potential is much higher for the Natura2000 network than for Level 1. Next, we used the RP assessment planning (option “Show Optimum Big 5”) to analyze the network and detect pairwise optimum restoration pathways between the five largest network objects for the three scenarios. In Figure 4, the numbers at the bottom right of each subpanel (RX) indicate the restoration scenario, for example R15 is the situation connecting the largest (1) with the fifth largest (5) network object.
Figure 5 shows the respective cost map analysis for each situation illustrated in Figure 4, where the startand target object are displayed in gray color. The cost map shows the travel time between them, color-coded from minimum (black) to maximum (pink). Areas of the same color indicate locations of equal travel time, hence isochrones between the start and target object. Finally, the restoration path is the skeleton of the minimum travel time (black), which is indicated by a gray line.
The actual restoration pathway is not easily visible at the full extent of the assessment region in Figure 4 and Figure 5. We showed a zoom-in for R15 of the Natura2000 scenario. In Figure 6 The top-left panel in Figure 6 shows the overview with the start object in dark blue, the fifth largest object in lilac and all intermediate encountered network objects in beige. The respective travel-time map (IS15) is shown at the bottom left panel. The actual restoration pathway is composed of interconnecting the existing intermediate network objects with restoration pixels (red colored) to establish a link from the start to the target object. The remaining panels in Figure 6 show three subsections: (a), (b), (c) where the existing landcover must be converted (restoration pixels) to become part of the network, in order to establish the pathway R15.
To minimize restoration expense, or maximize efficiency, the number of restoration pixels is minimized, which is achieved by extracting their location from the travel time analysis (least cost path, see bottom left panel in Figure 7). In addition to the geospatial location of the optimum path, RP provides tabular summary statistics for each of the ten situations (see Table 2).
Continuing with the example R15 of the Natura 2000 scenario, equivalent to line 4 of the top panel of Table 2, we can see that R15, indicated as 1<->5, has the following attributes:
  • SIZEA: the size of the start object,
  • SIZEA: the size of the target object,
  • RESTPIX: number of pixels needed to be converted to establish the pathway,
  • AVDISTRP: average distance from all restoration pixels to neighboring network objects,
  • EXP: Expense of restoration pixels (∑(RPRESIST))
  • EFFIC: Efficiency = ECA gained/Expense
  • ECAORIG: ECA equivalent connected area before the restoration measure
  • ECANEW: ECA equivalent connected area after the restoration measure
  • DELTAECA: difference ECANEW–ECAORIG
  • COHORIG: Coherence before the restoration measure
  • COHNEW: Coherence after the restoration measure
  • DELTACOH: difference COHNEW–COHORIG
R15 connects the largest object (10,400,331 pixels) with the fifth largest object (4,530,553 pixels) and requires 2064 pixels to be converted to establish the restoration pathway. Note that the restoration pathway may include bifurcations to choose from, so the minimum number of restoration pixels may be less than the ones indicated in the table. AVDIST provides an indication of the average “remoteness” of all restoration pixels. Low values are obtained for restoration scenarios between existing network objects, which are close to each other or by following a chain of network stepping stones. Higher AVDIST values indicate a restoration scenario reconnecting network objects that are far apart. EXP is a proxy for the overall expense of the restoration scenario, equivalent to the sum of resistances of all restoration pixels, where RPRESIST is the resistance of a given restore pixel. The suffix “var” indicates that the resistance map used had variable resistance values outside of the network.
In cases of constant resistance, for example 30%, the indicator would read EXP30. After inserting the restoration pixels, they will be part of the network objects and will lead to a larger equivalent connected area (ECA) of the network. The ratio of the increase in ECA to the expense (ΔECA/EXP) is a measure for the efficiency (EFFIC) of the restoration scenario. EFFIC allows comparing and measuring the efficiency of restoration scenarios by quantifying how much ΔECA is gained per unit of expense. Finally, the last six columns specify ECA and Coherence before and after the restoration measure and the absolute difference quantifying their impact.
Several questions can be answered regarding the attributes; for example, the end-user may be interested in the question of which of the 10 scenarios is the most efficient (sort for highest value in column EFFIC). They may be interested in which of the 10 scenarios has the highest impact (sort for highest value in column DELTA_COH). They may also be interested in which of the 10 scenarios has the highest overall connectivity after restoration (sort for highest value in column DELTA_ECA). The least expensive option of the 10 scenarios might also be of interest (sort for lowest value in column EXP_var). The EXP_var column may also be of interest if I have limited resources available and want to find out, with my limited resources, which of the 10 scenarios can I afford. Or one may be interested in sort column REST_PIX to find out how many pixels they need to convert in order to establish each one of the 10 scenarios.
For example, and in the Natura 2000 scenario, this scenario shows that it is the most efficient restoration measure (R34 because it requires only 2 restore pixels), and which restoration measure provides the highest gain in Coherence (R15). One may opt for R14, which provides an equally high gain in Coherence as R15 but at a lower price, because R14 has a higher efficiency due to requiring less restore pixels (1.679 vs 2.064) and traversing areas with less accumulated resistance (14,298 vs 21,970). Similar observations can then be conducted for Level 0 and Level 1. There were noticeable differences in the spatial distribution of objects (OBJ) for each scenario (Figure 2). For instance, the top left panel (first restoration map of Natura 2000 scenario) displays that the largest object was distributed along the northwestern border of the region, while the smallest object was found in the southern part.
As RP suggested, we identified potential connectors between the Natura 2000 sites, and Level 0 and Level 1 sites in Castilla y León, as shown in Figure 7. The connectors were distributed mainly around the center and northwestern part of the Natura 2000 sites and Level 0 sites, while a remarkable connector density was found northwest of the study area. On the other hand, none or very few connectors were seen in the northeastern part of the region. The number of connectors were higher for Level 0 (n = 34) than Natura 2000 (n = 29) and Level 1 scenarios (n = 17). Furthermore, there was a large variability in the length of these connectors. The longest connector was found in the southeastern part of the Natura 2000 scenario (22,336 m), the western part in the Level 0 scenario (17,046 m), and the northwestern part of the Level 1 scenario maps (14,675 m). On the other hand, the length of the shortest connector was 84, 180, and 76 m, respectively.

4. Discussion

Enhancing landscape connectivity is one of the most recommended climate-adaptation strategies for protecting biodiversity as the global climate changes [39]. The impacts of climate change on species have been increasingly well documented in recent decades; however, there is limited knowledge on the effects propagating through ecological communities [40] and how it will it affect habitat connectivity. One of the vitally important benefits of retaining connectivity by reducing the impact of habitat fragmentation is that it increases the ability of species to spread to new regions, thus reducing the likelihood of extinction [41]. A strategy often suggested to reduce the negative impacts of climate change on biodiversity is to increase ecological connectivity [42] creating opportunities for organisms to flow across landscapes [29]. The effectiveness of connectivity enhancement for species persistence in a changing climate will raise after increasing the size, quality, and number of protected areas along climatic gradients [41,43].
Located between the Cantabrian, Iberian, and Central Sierra mountains in central Spain, the Castilla y León region is sensitive to landscape degradation due to its climatic characteristics. In the study area, the largest core areas that provided the highest connections were those lying north on the foothills of the Cantabria mountains. This area is under the influence of the oceanic climate. Bioclimatic trends and future climate scenarios predict that broad-leaved forests (Fagus sylvatica L., Quercus petraea (Mattuschka) Libl. and Betula pubescens Ehrh subsp. celtiberica (Roth. & Vasc.) that make up 5% of the area in the north will expand and replace coniferous species [44,45]. The second important areas and connections were the wedge-shaped part with the riparian zone from the Sierra Mountains in the south towards the city of Valladolid in the centre. Rincón et al. (2021) [19] stated that with climate change, the precipitation regime would decrease in the future and, accordingly, a very patchy habitat will be formed. In this context, restoration should be considered in these areas, especially in the southern part of the state, with a higher priority than the northern part. This is because the conservation strategy is primarily increasing the amount of optimal or permeable habitats [30]. One of our objectives in this study was not only to create new movement paths and to reveal restoration areas for landscape management, but also to reveal areas where the quality of existing ecological corridors should be strengthened.
On the contrary of the five largest objects in different scenarios acquired from RP, the patches in the centre of Castilla y León were smaller and less connected. The resistance values of these areas were very high depending on the density of agricultural areas. Agricultural policies may be one of the most important issues that landscape management needs to find plausible solutions in the region. That is because the agricultural areas in the region predominantly affect Spain’s agricultural sector [46]. Although the common agricultural policies in Europe have a new vision of agriculture as a multifunctional activity, its main focus is on food security and the increase in agricultural incomes [47]. In order to achieve that, it is very important to integrate the connections and restorations into spatial planning at local upper scales. If this integration is achieved, it will ensure that landscape connectivity is taken into account through the Strategic Environmental Assessment (SEA) [48]. In this respect, the region of Castilla y León has been very experienced and advantageous since SEA has been mandatory for investments for many years. However, what should be focused on in the restoration to ensure the ecological and economic balance in agricultural areas.
Our method primarily focuses on identifying optimum restoration pathways for different scenarios. These pathways can make a significant contribution to conservation efforts. This is because conservation efforts are often associated with maintaining or increasing connectivity by restoring existing minimal resistance pathways between habitat patches [49]. Thus, connectors can pass through agricultural areas at a minimum level. In the case of our application to the Castilla y León region, the studied scenario has revealed that it is necessary to increase the protected area so that the results obtained in these studies can be adapted for future real planning processes in the region. This study can serve as a guide to different countries or different regions to improve the connectivity of biodiversity throughout Europe.
In addition, this can provide clues for the type of agricultural application that can be used for restoration in the connections. For instance, in agro-ecosystems, windbreaks or bush-grown vegetables can be a target designed for wildlife movement in heterogeneous landscapes. The planting of new hedgerows in the agro-ecosystems of the European Union has already been encouraged by the Common Agricultural Policy (CAP) [30].
Another important feature of our methodological approach was to integrate the restoration planning concept into the design of corridors. This integration may influence the morphological pattern of ecological networks. In this regard, establishing new priority pathways can increase the gain of ecological connectivity. Restoration pathways presented in this paper can contribute to the biodiversity of Castilla y León, and our findings can be relevant to prevent them from possible local extinctions.
The CORINE (https://land.copernicus.eu/pan-european/corine-land-cover (accessed on 1 November 2022)) Land Use/Land Cover maps of European Union countries are updated every six years. Based on these datasets, resistance maps can be produced and temporal changes can be monitored. Our findings can be useful and may be considered as a base for environmental monitoring and assessment. The most challenging task here is assigning the resistance values. Many studies on ecological corridors focus on a certain wild animal species, especially mammals, as target species and therefore certain resistance values can be easily found from the literature [50]. Although we did not specify a target species in this study, we borrowed resistance values from previous studies that examined the functional connectivity of the largest mammals of Spain, roe deer [51] and lynx [36]. As our study intends to design corridors for biodiversity conservation of several species that inhabit those areas, landscape connectivity has been evaluated in terms of global functional connectivity, focusing on the study of landscape metrics that provide useful information that can support the planning of the landscape for connectivity.

5. Conclusions

The assessment of connectivity plays a vital role for management and conservation of the Natura 2000 Network. Restoration planning efforts can suppress the challenges against biodiversity conservation, creating new connections between habitats.
For identifying the optimal locations to improve the connectivity, we analyzed three scenarios in Castilla y León: current Natura 2000 protected sites, and two new proposals for conservation sites inspired by Habitats Directive criteria (Level 0 and Level 1).
When the connectors of three levels are compared, it is interesting that although restoration measures for Natura 2000 sites have been guaranteed by the European Union, the number of connectors is quite high. This indicates that there are areas within the Natura 2000 network that do not have conservation status but are worth protecting.
The length of connectors was found to be very variable across the study area. The connectors distributed mainly around the center and northwestern part of Castilla y León, while none or very few connectors were seen in the northeastern part of the region. On a more specific level, it has been shown that the efficiency of the proposed connectivity restoration is higher the more area is included for protection (Level 0 and 1). This is why it is necessary to properly study which areas can be added to the current conservation network in order to favor its integrity.
Overall, we proposed new restoration pathways that favor the increase of connectivity of the Natura 2000 areas in Castilla y León. We achieved promising results that are relevant to developing connectivity which can be effectively used for optimizing the conservation of the Natura 2000 Network. If the new pathways are transferred from theory to practice, the new areas may cover more areas of interest for biodiversity and have more connected habitats.
The approach presented in this study could be used in other regional jurisdictions to obtain essential information on restoration planning in support of regional landscape governance, planning, and management.

Author Contributions

Conceptualization, J.V. and D.G.; methodology, J.V.; software, P.V.; validation, P.V., V.R. and K.Ç.; formal analysis, J.V., P.V. and V.R.; investigation, J.V. and D.G.; data curation, P.V., D.G. and A.U.Ö.; writing—original draft preparation, J.V., D.G., P.V., J.G., V.R., A.U.Ö. and K.Ç.; writing—review and editing, A.H.; visualization, D.G.; supervision, K.Ç.; project administration, J.V. All authors have read and agreed to the published version of the manuscript.

Funding

This research received no external funding.

Data Availability Statement

The data presented in this study are available on request from the corresponding author.

Conflicts of Interest

The authors declare no conflict of interest.

Appendix A. Values Used to Obtain the Resistance Layer for CLC and Infrastructures

Table A1. Resistance values for Corine Land Cover 2018’s land use classes.
CLC CODEResistance Value
1111000
1121000
1211000
1221000
1241000
1311000
1321000
1331000
1411000
1421000
21160
21260
21360
22160
22260
22360
23140
24160
24260
24360
24460
3111
3121
3131
32130
3225
3235
3245
33240
33340
33440
411100
511100
512100
Table A2. Resistance values for average daily traffic of infrastructures of the study area.
Average Daily TrafficResistance Value
<100080
1000–5000100
5000–10,000300
>10,000 Not fenced700
>10,000 Fenced900
>20,000 Not fenced800
>20,000 Fenced1000
Table A3. Restoration planner (RP) input values for resistance values derived from Corine Land Cover 2018’s land use classes and average daily traffic of infrastructures of the study area.
Range of ValuesReclass Resistance %RP Resistance Values
0–10003
100–2001010
200–3002020
300–4003030
400–5004040
500–6005050
600–7006060
700–8007070
800–9008080
900–10009090
>10001000
Background0
Foreground2

References

  1. Mony, C.; Uroy, L.; Khalfallah, F.; Haddad, N.; Vandenkoornhuyse, P. Landscape connectivity for the invisibles. Ecography 2022, 2022, e06041. [Google Scholar] [CrossRef]
  2. Saura, S.; Vogt, P.; Velázquez, J.; Hernando, A.; Tejera, R. Key structural forest connectors can be identified by combining landscape spatial pattern and network analyses. For. Ecol. Manag. 2011, 262, 150–160. [Google Scholar] [CrossRef]
  3. Council of the European Communities. Council Directive 92/43/EEC of 21 May 1992 on the Conservation of Natural Habitats and of Wild Fauna and Flora; Council of the European Communities: Brussels, Belgium, 1992. [Google Scholar]
  4. An, Y.; Liu, S.; Sun, Y.; Shi, F.; Beazley, R. Construction and optimization of an ecological network based on morphological spatial pattern analysis and circuit theory. Landsc. Ecol. 2021, 36, 2059–2076. [Google Scholar] [CrossRef]
  5. Hopley, T.; Byrne, M. Connectivity in riparian plants: Influence of vegetation type and habitat fragmentation overrides water flow. Oecologia 2018, 188, 465–478. [Google Scholar] [CrossRef] [PubMed]
  6. Fahrig, L. Effects of Habitat Fragmentation on Biodiversity. Annu. Rev. Ecol. Evol. Syst. 2003, 34, 487–515. [Google Scholar] [CrossRef] [Green Version]
  7. Opdam, P.; Wascher, D. Climate change meets habitat fragmentation: Linking landscape and biogeographical scale levels in research and conservation. Biol. Conserv. 2004, 117, 285–297. [Google Scholar] [CrossRef]
  8. Pearce-Higgins, J.; Antão, L.; Bates, R.; Bowgen, K.; Bradshaw, C.; Duffield, S.; Ffoulkes, C.; Franco, A.; Geschke, J.; Gregory, R.; et al. A framework for climate change adaptation indicators for the natural environment. Ecol. Indic. 2022, 136, 108690. [Google Scholar] [CrossRef]
  9. Beger, M.; Grantham, H.S.; Pressey, R.L.; Wilson, K.A.; Peterson, E.L.; Dorfman, D.; Mumby, P.J.; Lourival, R.; Brumbaugh, D.R.; Possingham, H.P. Conservation planning for connectivity across marine, freshwater, and terrestrial realms. Biol. Conserv. 2010, 143, 565–575. [Google Scholar] [CrossRef]
  10. Opermanis, O.; MacSharry, B.; Aunins, A.; Sipkova, Z. Connectedness and connectivity of the Natura 2000 network of protected areas across country borders in the European Union. Biol. Conserv. 2012, 153, 227–238. [Google Scholar] [CrossRef]
  11. Tian, Y.; Liu, Y.; Jim, C.Y.; Song, H. Assessing Structural Connectivity of Urban Green Spaces in Metropolitan Hong Kong. Sustainability 2017, 9, 1653. [Google Scholar] [CrossRef]
  12. Velázquez, J.; Gutiérrez, J.; Hernando, A.; García-Abril, A. Evaluating landscape connectivity in fragmented habitats: Cantabrian capercaillie (Tetrao urogallus cantabricus) in northern Spain. For. Ecol. Manag. 2017, 389, 59–67. [Google Scholar] [CrossRef]
  13. Gutiérrez, J.; Velázquez, J.; García-Abril, A.; Hernando, A.; Sánchez, B.; Gómez, I. Impact model of urban development on steppic birds in natura 2000 spaces. Land Use Policy 2020, 90, 104256. [Google Scholar] [CrossRef]
  14. Opdam, P. Assessing the conservation potential of habitat networks. In Applying Landscape Ecology in Biological Conservation; Gutzwiller, K.J., Ed.; Springer: New York, NY, USA, 2002. [Google Scholar]
  15. Saura, S.; Rubio, L. A common currency for the different ways in which patches and links can contribute to habitat availability and connectivity in the landscape. Ecography 2010, 33, 523–537. [Google Scholar] [CrossRef]
  16. Jordán, F. A reliability-theory approach to corridor design. Ecol. Model. 2000, 128, 211–220. [Google Scholar] [CrossRef]
  17. Council of the European Communities. Council Directive 79/409/EEC of 2 April 1979 on the Conservation of Wild Birds; Council of the European Communities: Brussels, Belgium, 1979. [Google Scholar]
  18. de la Fuente, B.; Mateo-Sánchez, M.C.; Rodríguez, G.; Gastón, A.; de Ayala, R.P.; Colomina-Pérez, D.; Melero, M.; Saura, S. Natura 2000 sites, public forests and riparian corridors: The connectivity backbone of forest green infrastructure. Land Use Policy 2018, 75, 429–441. [Google Scholar] [CrossRef]
  19. Rincón, V.; Velázquez, J.; Gutiérrez, J.; Hernando, A.; Khoroshev, A.; Gómez, I.; Herráez, F.; Sánchez, B.; Luque, J.P.; García-Abril, A.; et al. Proposal of new Natura 2000 network boundaries in Spain based on the value of importance for biodiversity and connectivity analysis for its improvement. Ecol. Indic. 2021, 129, 108024. [Google Scholar] [CrossRef]
  20. European Commission. Natura 2000 Barometer—Update December 2015. Nat. Biodivers. 2016 Newsl. 2016, 40, 8–9. [Google Scholar]
  21. Ministerio para la Transición Ecológica. Espacios Protegidos Red Natura. 2000. Available online: https://www.miteco.gob.es/es/biodiversidad/temas/espacios-protegidos/red-natura-2000/ (accessed on 15 February 2022).
  22. Förster, M.; Kleinschmit, B. Remote Sensing and GIS-Modelling for the Monitoring of Natura 2000 Habitats; Nature Protection GIS: Dresden, Germany, 2006. [Google Scholar]
  23. Hodgson, J.A.; Moilanen, A.; Thomas, C.D. Metapopulation responses to patch connectivity and quality are masked by successional habitat dynamics. Ecology 2016, 90, 1608–1619. [Google Scholar] [CrossRef] [Green Version]
  24. Teeffelen, A.; Atte, M. Where and how to manage: Optimal selection of conservation actions for multiple species. Biodivers. Inform. 2008, 3, 59–72. [Google Scholar] [CrossRef] [Green Version]
  25. Hernando, A.; Tejera, R.; Velázquez, J.; Núñez, M.V. Quantitatively defining the conservation status of Natura 2000 forest habitats improving management options for enhancing biodiversity. Biodivers. Conserv. 2010, 19, 2221–2233. [Google Scholar] [CrossRef]
  26. Liro, A.; Andrzejewski, R.; Różycka, W.; Tederko, Z. (Eds.) National Ecological Network EECONET-Poland; IUCN Office for Central & Eastern Europe: Warsaw, Poland, 1995. [Google Scholar]
  27. Garcia Quiroga, F.; Abad Soria, J. Los corredores ecológicos y su importancia ambiental: Propuestas de actuación para fomentar la permeabilidad y conectividad aplicadas al entorno del rio Cardena (Ávila y Segovia). Obs. Medioambient. 2014, 17, 253–298. [Google Scholar] [CrossRef]
  28. Simberloff, D. Conservation of pristine habitats and unintended effects of biological control. In Selection Criteria and Ecological Consequences of Importing Natural Enemies; Conference Paper; Entomological Society of America: Annapolis, MD, USA, 1992; pp. 103–117. [Google Scholar]
  29. Taylor, P.D.; Fahrig, L.; Henein, K.; Merriam, G. Connectivity is a vital element of landscape structure. Oikos 1993, 571–573. [Google Scholar] [CrossRef] [Green Version]
  30. Dondina, O.; Saura, S.; Bani, L.; Mateo-Sánchez, M.C. Enhancing connectivity in agroecosystems: Focus on the best existing corridors or on new pathways? Landsc. Ecol. 2018, 33, 1741–1756. [Google Scholar] [CrossRef]
  31. Arroyo-Rodríguez, V.; Melo, F.P.L.; Martínez-Ramos, M.; Bongers, F.; Chazdon, R.L.; Meave, J.A.; Norden, N.; Santos, B.A.; Leal, I.R.; Tabarelli, M. Multiple successional pathways in human-modified tropical landscapes: New insights from forest succession, forest fragmentation and landscape ecology research. Biol. Rev. 2017, 92, 326–340. [Google Scholar] [CrossRef] [PubMed]
  32. Velázquez, J.; Gutiérrez, J.; García-Abril, A.; Hernando, A.; Aparicio, M.; Sánchez, B. Structural connectivity as an indicator of species richness and landscape diversity in Castilla y León (Spain). For. Ecol. Manag. 2019, 432, 286–297. [Google Scholar] [CrossRef]
  33. Young, J.; Richards, C.; Fischer, A.; Halada, L.; Kull, T.; Kuzniar, A.; Tartes, U.; Uzunov, Y.; Watt, A. Conflicts between biodiversity conservation and human activities in the central and eastern european countries. Ambio A J. Hum. Environ. 2007, 36, 545–550. [Google Scholar] [CrossRef]
  34. Morales, M.B.; Suarez, F.; Garcia de la Morena, E.L. Reponses des oiseaux de steppe aux differents niveaux de mise en culture et d’intensification du paysage agricole: Une analyse comparative de leurs effets sur la densite de population et la selection de l’habitat chez l’outarde canepetiere Tetrax tetrax et l’outarde barbue Otis tarda. Rev. d’Ecologie Terre Vie 2006, 61, 261–270. [Google Scholar]
  35. Marzluff, J.M.; Kern, E. Restoration of fragmented landscapes for the conservation of birds: A general framework and specific recommendations for urbanizing landscapes. Restor. Ecol. 2001, 9, 280–282. [Google Scholar] [CrossRef]
  36. Gurrutxaga, M.; Lozano, P.J.; del Barrio, G. GIS-based approach for incorporating the connectivity of ecological networks into regional planning. J. Nat. Conserv. 2010, 18, 318–326. [Google Scholar] [CrossRef]
  37. Vogt, P. Restoration Planner. 2022. Available online: https://ies-ows.jrc.ec.europa.eu/gtb/GTB/psheets/GTB-RestorationPlanner.pdf (accessed on 1 November 2022).
  38. Vogt, P.; Riitters, K. GuidosToolbox: Universal digital image object analysis. Eur. J. Remote Sens. 2017, 50, 352–361. [Google Scholar] [CrossRef]
  39. Littlefield, C.E.; Krosby, M.; Michalak, J.L.; Lawler, J.J. Connectivity for species on the move: Supporting climate-driven range shifts. Front. Ecol. Environ. 2019, 17, 270–278. [Google Scholar] [CrossRef]
  40. Schleuning, M.; Fründ, J.; Schweiger, O.; Welk, E.; Albrecht, J.; Albrecht, M.; Beil, M.; Benadi, G.; Blüthgen, N.; Bruelheide, H.; et al. Ecological networks are more sensitive to plant than to animal extinction under climate change. Nat. Commun. 2016, 7, 13965. [Google Scholar] [CrossRef] [PubMed]
  41. Krosby, M.; Tewksbury, J.; Haddad, N.M.; Hoekstra, J. Ecological Connectivity for a Changing Climate. Conserv. Biol. 2010, 24, 1686–1689. [Google Scholar] [CrossRef] [PubMed]
  42. Heller, N.E.; Zavaleta, E.S. Biodiversity management in the face of climate change: A review of 22 years of recommendations. Biol. Conserv. 2009, 142, 14–32. [Google Scholar] [CrossRef]
  43. Hunter, M.L., Jr.; Jacobson, G.L., Jr.; WEBB, T., III. Paleoecology and the coarse-filter approach to maintaining biological diversity. Conserv. Biol. 1988, 2, 375–385. [Google Scholar] [CrossRef]
  44. Del Rio, S. El cambio climatico y su influencia en la vegetacion de Castilla y Leon (Espana). Itinera Geobot. 2005, 16, 5–34. [Google Scholar]
  45. Del Río, S.; Penas, A. Potential distribution of semi-deciduous forests in Castile and Leon (Spain) in relation to climatic variations. Plant Ecol. 2006, 185, 269–282. [Google Scholar] [CrossRef]
  46. Gallego-Ayala, J.; Gómez-Limón, J.A. Future scenarios and their implications for irrigated agriculture in the Spanish region of Castilla y León. New Medit Mediterr. J. Econ. Agric. Environ. Rev. Méditerranéenne DʹEconomie Agric. Environ. 2011, 10, 4. [Google Scholar]
  47. EC. High Prices on Agricultural Commodity Markets: Situation and Prospects; Agricultural Markets, Directorate General for Agriculture and Rural Development-European Commission: Brussels, Belgium, 2008. [Google Scholar]
  48. Mallarach, J.M.; Marull, J. Impact assessment of ecological connectivity at the regional level: Recent developments in the Barcelona Metropolitan Area. Impact Assess. Proj. Apprais. 2006, 24, 127–137. [Google Scholar] [CrossRef]
  49. Carranza, M.L.; D’Alessandro, E.; Saura, S.; Loy, A. Connectivity providers for semi-aquatic vertebrates: The case of the endangered otter in Italy. Landsc. Ecol. 2012, 27, 281–290. [Google Scholar] [CrossRef]
  50. Zeller, K.A.; McGarigal, K.; Whiteley, A.R. Estimating landscape resistance to movement: A review. Landsc. Ecol. 2012, 27, 777–797. [Google Scholar] [CrossRef]
  51. Loro, M.; Ortega, E.; Arce, R.M.; Geneletti, D.; Perez, E.O.; Ruiz, R.M.A. Assessing landscape resistance to roe deer dispersal using fuzzy set theory and multicriteria analysis: A case study in Central Spain. Landsc. Ecol. Eng. 2016, 12, 41–60. [Google Scholar] [CrossRef]
Figure 1. Scenarios considered as input data for the study of connectivity improvement for biodiversity conservation in Castilla y León region.
Forests 13 02132 g001aForests 13 02132 g001b
Figure 2. Schematic of Resistance Layer Calculation and reclassification into RP input values.
Forests 13 02132 g002
Figure 3. The five largest network objects in the three scenarios.
Forests 13 02132 g003
Figure 4. Restoration pathways between the five largest objects for the different scenarios. The starting object is color-coded in dark blue, the target object in lilac, the restoration pathway in red, and intermediate encountered network objects of any size in beige color, where Rxy represents the restoration scenario for the connection of x object with y object.
Forests 13 02132 g004
Figure 5. Cost maps between the five largest objects for the different scenarios. Startand target object are displayed in gray color. Color-coded from minimum (black) to maximum (pink) shows the travel time, where ISxy represents the restoration scenario for connection of x object with y object.
Forests 13 02132 g005
Figure 6. Zoom-in on restoration (R15) and cost map (IS15) for restoration pathway of the Natura2000 scenario. Sections (ac) show different pathways to connect the largest (1) with the fifth largest (5) network object in the R15 scenario.
Forests 13 02132 g006
Figure 7. Proposed pathways and their three scenarios (Natura 2000, Level 0 and Level 1) zones in Castilla y León.
Forests 13 02132 g007
Table 1. Network status summary for the three scenarios.
REP_UNITAREA
[pixels]
RAC
[%]
NR_OBJ
[-]
LARG_OBJ
[pixels]
APS
[pixels]
CNOA
[pixels]
ECA
[pixels]
COH
[%]
REST_POT
[%]
Natura2000.tif61,472,971 26.201114 10,400,331 55,182.20 8,650,228 15,760,731 25.6474.36
Level0.tif85,809,117 36.461055 34,393,092 81,335.66 56,202,021 42,619,979 49.6750.33
Level1.tif121,309,440 51.54945 54,366,560 128,369.77 134,402,408 72,429,448 59.7140.29
Table 2. Tabular summary statistics for the ten restoration pathways between the five largest network objects for Natura 2000 (top), Level 0 (center), and Level 1 (bottom).
SORTRESTORESIZE_A
[pixels]
SIZE_B
[pixels]
REST_PIX
[-]
AVDIST_RP
[pixels]
EXP_var
[-]
EFFIC
[pixels]
ECA_ORIG
[pixels]
ECA_NEW
[pixels]
DELTA_ECA
[pixels]
COH_ORIG
[%]
COH_NEW
[%]
DELTA_COH
[%]
11 <-> 210,400,3315,210,3611000180.168412375.8715,760,73118,922,540 3,161,809 25.6430.785.14
21 <-> 310,400,3314,999,5421671108.5814,222 461.9215,760,73122,330,219 6,569,488 25.6436.3210.69
31 <-> 410,400,3314,906,3221679108.0714,298739.2815,760,731 26,330,916 10,570,185 25.6442.8317.19
41 <-> 510,400,3314,530,553206494.8321,970481.6215,760,731 26,341,920 10,581,18925.6442.8517.21
52 <-> 35,210,3614,999,5422011124.3322,49278.7515,760,731 17,532,050 1,771,319 25.6428.522.88
62 <-> 45,210,3614,906,3223598165.6128,560171.14 15,760,731 20,648,502 4,887,771 25.6433.597.95
72 <-> 55,210,3614,530,5531860125.3418,032 89.96 15,760,731 17,382,962 1,622,231 25.6428.282.64
83 <-> 44,999,5424,906,32221.414037,157.0115,760,731 17,247,011 1,486,280 25.6428.062.42
93 <-> 54,999,5424,530,55343949.608140190.7715,760,731 17,313,596 1,552,865 25.6428.162.53
104 <-> 54,906,3224,530,5531152174.1015,270172.8515,760,731 18,400,118 2,639,387 25.6429.934.29
SORTRESTORESIZE_A
[pixels]
SIZE_B
[pixels]
REST_PIX
[-]
AVDIST_RP
[pixels]
EXP_var
[-]
EFFIC
[pixels]
ECA_ORIG
[pixels]
ECA_NEW
[pixels]
DELTA_ECA
[pixels]
COH_ORIG
[%]
COH_NEW
[%]
DELTA_COH
[%]
11 <-> 2 34,393,092 23,831,169 2566132.0419,524 851.07 42,619,979 59,236,327 16,616,348 49.6769.0319.36
21 <-> 334,393,092 6,146,606885 91.4210,786 507.41 42,619,979 48,092,870 5,472,891 49.6756.056.38
31 <-> 434,393,0922,864,889967 126.986640 342.31 42,619,979 44,892,911 2,272,932 49.6752.322.65
41 <-> 534,393,0922,705,3561529118.4413,764 216.96 42,619,979 45,606,172 2,986,19349.6753.153.48
52 <-> 323,831,169 6,146,606531 77.093230 1089.53 42,619,979 46,139,166 3,519,187 49.6753.774.10
62 <-> 423,831,1692,864,889563 103.205708 456.37 42,619,979 45,224,925 2,604,946 49.6752.703.04
72 <-> 523,831,169 2,705,356787 84.368498 402.85 42,619,979 46,043,397 3,423,418 49.6753.663.99
83 <-> 46,146,606 2,864,889849 85.4212,238 516.11 42,619,979 48,936,094 6,316,115 49.6757.037.36
93 <-> 56,146,6062,705,3561682 211.4024,962 30.61 42,619,979 43,384,159 764,180 49.6750.560.89
104 <-> 52,864,8892,705,356102 7.701600 233.25 42,619,979 42,993,181 373,202 49.6750.100.43
SORTRESTORESIZE_A
[pixels]
SIZE_B
[pixels]
REST_PIX
[-]
AVDIST_RP
[pixels]
EXP_var
[-]
EFFIC
[pixels]
ECA_ORIG
[pixels]
ECA_NEW
[pixels]
DELTA_ECA
[pixels]
COH_ORIG
[%]
COH_NEW
[%]
DELTA_COH
[%]
11 <-> 234,393,092 23,831,169 2566132.0419,524 851.07 42,619,979 59,236,327 16,616,348 49.6769.0319.36
21 <-> 334,393,092 6,146,606885 91.4210,786 507.41 42,619,979 48,092,870 5,472,891 49.6756.056.38
31 <-> 4 34,393,092 2,864,889967 126.986640 342.31 42,619,979 44,892,911 2,272,932 49.6752.322.65
41 <-> 5 34,393,092 2,705,356 1529 118.4413,764 216.96 42,619,97945,606,172 2,986,193 49.6753.153.48
52 <-> 3 23,831,169 6,146,606531 77.093230 1089.5342,619,979 46,139,166 3,519,187 49.6753.774.10
62 <-> 4 23,831,169 2,864,889563 103.205708 456.37 42,619,979 45,224,925 2,604,946 49.6752.703.04
72 <-> 5 23,831,169 2,705,35678784.368498 402.85 42,619,979 46,043,397 3,423,418 49.6753.663.99
83 <-> 46,146,6062,864,889849 85.4212,238 516.11 42,619,979 48,936,094 6,316,115 49.6757.037.36
93 <-> 56,146,606 2,705,3561682211.4024,962 30.61 42,619,979 43,384,159 764,180 49.6750.560.89
104 <-> 52,864,8892,705,356102 7.701600 233.25 42,619,979 42,993,181 373,202 49.6750.100.43
Publisher’s Note: MDPI stays neutral with regard to jurisdictional claims in published maps and institutional affiliations.

