Article

Assessing the Fragmentation, Canopy Loss and Spatial Distribution of Forest Cover in Kakamega National Forest Reserve, Western Kenya

by
Erick O. Osewe
1,*,
Mihai Daniel Niţă
2 and
Ioan Vasile Abrudan
1
1
Department of Silviculture, Transilvania University of Brasov, Sirul Beethoven, 1, 500123 Brasov, Romania
2
Department of Forest Engineering, Faculty of Silviculture and Forest Engineering, Transilvania University of Brasov, Sirul Beethoven, 1, 500123 Brasov, Romania
*
Author to whom correspondence should be addressed.
Forests 2022, 13(12), 2127; https://doi.org/10.3390/f13122127
Submission received: 24 October 2022 / Revised: 6 December 2022 / Accepted: 7 December 2022 / Published: 11 December 2022
(This article belongs to the Special Issue Monitoring, Assessment and Management of Forest Resource)

Abstract

:
Kakamega National Forest Reserve is a tropical forest ecosystem at high risk of irreplaceable biodiversity loss due to persistent human-induced pressures. The aim of this paper is to assess the effect of fragmentation and forest cover loss on forest ecosystems in Kakamega National Forest Reserve, with the objectives: (1) to quantify the forest cover loss and analyse fragmentation in the Kakamega forest ecosystem and (2) to analyse the effect of forest cover loss on the spatial distribution of the Kakamega forest ecosystem at different timescales. Hansen global forest change data was used as an input training dataset on the Google Earth Engine platform (GEE) to estimate the area of forest cover loss by aggregating the sum of pixel values, and to provide a time series visualization of forest change by the extent of cover loss using Sentinel-2 and Landsat 7 false colour composites (RBG) in QGIS software. Fragmentation analysis was performed using reclassified forest loss and distribution data from the Hansen product as binary raster input in Guidos software. Total forest cover loss over 20 years was estimated at 826.60 ha. The first decade (2000–2010) accounted for 146.31 ha of forest cover loss, and the second decade (2010–2020) accounted for 680.29 ha of forest cover loss. Forest area density (FAD) analysis depicted an increase in the dominant layer by 8.5% and a 2.5% decrease in the interior layer. Morphological spatial pattern analysis (MSPA) illustrated a change in the core layer of 96% and a 14% increase in the openings class layer. Therefore, this study demonstrates that forest cover loss and landscape pattern alteration changed the dynamics of species interaction within ecological communities. Fragmented habitats adversely affected the ecosystem’s ability to recover the loss of endemic species, which are at risk of extinction in the backdrop of climate change. Anthropogenic drivers i.e., the clearing of natural forest and conversion of forest land for non-forest use, have contributed significantly to the loss of forest cover in the study area.

1. Introduction

Tropical forest ecosystems are habitats for a diverse range of species that contribute to the overall provisional functions and ecosystem services of the forest through their interactions [1,2]. The interaction between biodiversity and forest ecosystem services has been extensively explored in the literature, covering tropical ecosystems in South America, Africa, and Southeast Asia. “Natural forests” provide better ecosystem services and are more resilient to disturbance than “planted forests” [1]. Therefore, in natural forests, increased tree stand growth in a certain mixture of species is explained as a functional response to environmental niches and as a biodiversity-facilitating resistance to disturbance (i.e., pests, diseases, fire) [1,3].
The assessment of global forest area dynamics through losses and gains identifies deforestation within tropical forests as a major concern [4]. One of the tropical forest’s roles is in climate change mitigation through carbon sequestration [5,6]. Most studies reveal that tropical forest ecosystems, if left intact, have a higher carbon accumulation rate than temperate and boreal forests in all the carbon pool i.e., above-ground biomass (AGB) and below-ground biomass because of their richness of plant communities [7,8].
Historical land-use change patterns such as the conversion of forest land to agricultural cropland, shift grazing systems for livestock and the establishment of temporary settlement structures within tropical forest ecosystems, particularly in Africa, contribute to the change in quality of the ecosystem services [4,9]. Similarly, a case study of six tropical countries, namely, Guyana, Brazil, the Republic of Congo, Belize, Bolivia and Indonesia identified a causative link between high carbon emissions accounting for 3%–15% of the biomass carbon stocks and land-use change through the conversion of forest land to crop land and infrastructure as opposed to logging activities [2,10].
Kakamega National Forest Reserve is the last remaining intact tropical forest in Kenya [9]. The government formally established the reserve by proclamation no. 14 of the 13 February 1933. The habitat’s rainforest canopy cover hosts a wide range of species listed as vulnerable by the International Union for Conservation of Nature (IUCN), such as the grey-chested babbler (Kakamega poliothorax) and endangered primates i.e., the blue monkey (Cercopithecus mitis) and the black-and-white colobus monkey (Colobus guereza).
Local communities derive multiple benefits from the ecosystem i.e., cultural benefits, tourism, and wood and non-wood products [11]. The forest cover ensures the continuity of quality in the ecosystem service provision and provides a suitable habitat for a wide range of endemic species. The forest ecosystem is the source of the Yala and Isiukhu rivers, which serve the Lake Victoria watershed, and is an important site for initiating carbon offset activities [11,12]. Over the years, the ecosystem has mainly been threatened by human-induced disturbances that jeopardize its ability to uninterruptedly provide quality ecosystem services [13].
The forest reserve has also been documented as an important avifauna habitat as well as a biodiversity hotspot, with existing tree species similar to those of the Guinean Congo rainforest belt [14]. In the western part of Kenya, this forest reserve serves as an important tourist attraction and is a key resource for nearby communities around the ecosystem [11]. Land-use change, however, is listed as a major threat to the forest ecosystem accounting for approximately 70% of the cleared forest that was converted to hardwood plantations through the “shamba system” [15].
The forest cover change in Kakamega National Forest Reserve has been linked by several studies to threats such as deforestation and land-use change [12,16,17]. Pressure from land-use change activities compromises the ability of the forest reserve to provide ecosystem services i.e., carbon sequestration, biodiversity habitat and climate regulation [4,16]. Researchers using artificial neural networks identified that land-use change activities, such as agricultural farming, pose a major threat to old-growth forest biodiversity in the Kakamega Forest Reserve [14]. Its current size of 19,792.4 ha is linked to excisions, management practices and historical degradation resulting from high demand for resource use from adjacent communities [17].
The interaction of disturbances with natural phenomena (i.e., climate change) affects the resilience of forest ecosystems by temporal interactions with frequency, severity, and the size of human-induced disturbances (i.e., deforestation and land-use change). Remote sensing approaches in forest monitoring by use of earth observation satellites enable us to improve mapping, estimate forest cover loss and carry out fragmentation analysis for large and isolated forested areas [18]. Therefore, GIS-based software such as QGIS and Guidos Toolbox used with satellite data are the optimal solution to characterize, identify and create output indicators to provide insights into habitat fragmentation [19,20].
Forest cover change and habitat loss negatively affect an ecosystem’s ability to recover the loss of endemic species [21]. Furthermore, landscape pattern alteration through fragmentation changes the dynamics of species’ interactions within their ecological communities, thus compromising the ability of ecosystems to regenerate and provide quality ecosystem services. Therefore, the aim of this study is to assess the effect of forest fragmentation and canopy loss on forest ecosystems in Kakamega National Forest Reserve.

2. Materials and Methods

2.1. Study Area

Kakamega National Forest Reserve is situated in the western part of Kenya (Figure 1). The ecosystem lies at longitudes 34°40′00″ and 35°9′30″ East and latitudes 0°29′30″ and 0°3′00″ North, and stretches across the two administrative regions of Kakamega county and Vihiga county. The forest ecosystem was officially gazetted in 1933 by proclamation no. 14 of the 13th of February, and the forest currently has 19,792.4 ha set as a protected area [11]. The study area consists of three national reserves (Kakamega Forest Reserve, Kakamega National Reserve and Kisere National Reserve) and two nature reserves (Isecheno and Yala) ([22] Appendix A Table A1). The key stakeholders of the Kakamega forest ecosystem are KFS, KWS and the surrounding community based organizations (CBOs).

2.2. Data and Processing

Mosaics used to create a region of interest (ROI) for Kakamega National Forest Reserve were sourced from the Hansen product [23]. The Hansen product is a free database, available online, that quantifies global forest change from 2000 to 2020. The data availability on Hansen is limited to the period of 2000 to 2020. i.e., Global Forest Change 2000–2020 Data Download: Hansen/UMD/Google/USGS/NASA. The repository link for the data used in this study is the following: https://storage.googleapis.com/earthenginepartners-hansen/GFC-2020-v1.8/download.html (accessed on 16 March 2022).

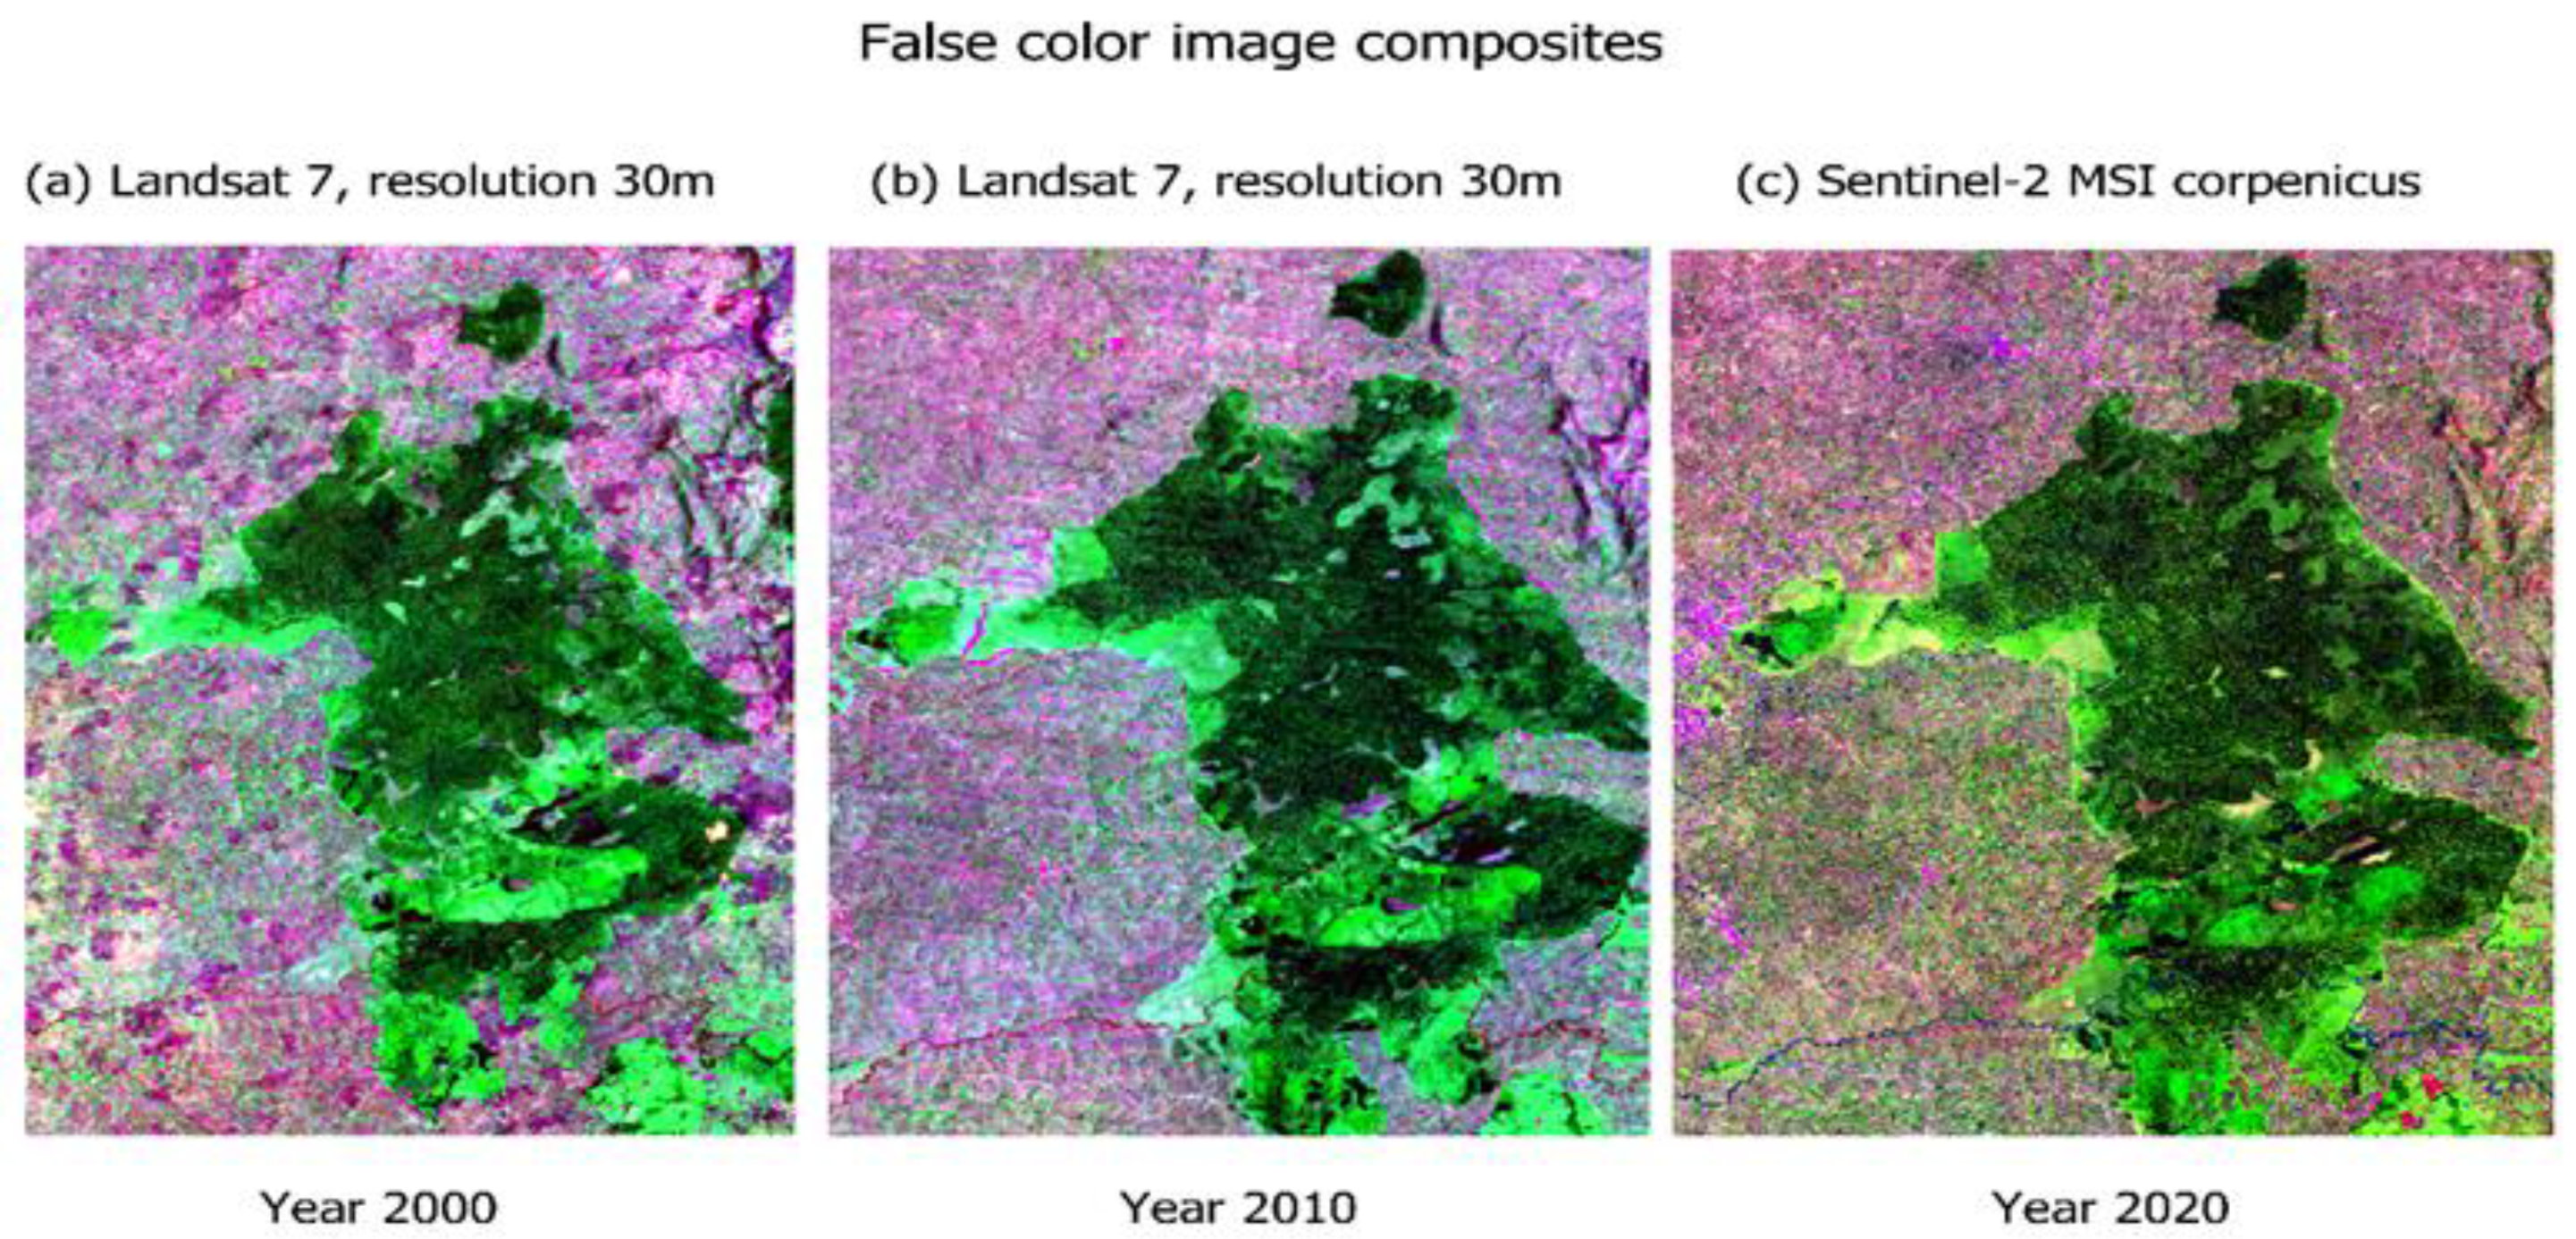
2.2.1. Image Composite Analysis Using Google Earth Engine and QGIS

Image composites were sourced from Sentinel-2, spatial resolution (10–60 m), and Landsat 7, spatial resolution 30 m, to cover the study timeline of 20 years. Landsat data was available on the GEE platform from 1999 to 2015 and was used to obtain image composites for the years 2000 and 2010. Sentinel-2 data was available on the Google Earth Engine platform from 2015 to 2020 and was used to obtain high-resolution multispectral imagery for the year 2020. The multispectral band images were analysed using the rendering tools in QGIS- 3.16 Hannover platform was used to produce false colour composites (RBG) for the years 2000, 2010 and 2020, respectively. For the Sentinel-2 composites, bands SWIR-1(B11), near-infrared (B08) and blue (B02) were used in the rendering process, and for the Landsat 7 composites, near infrared (red), green (blue), red (green) were used in the rendering process (SR_B3, SR_B4, SR_B5) (Table 1 and Table 2).

2.2.2. Quantifying Forest Cover Loss

To quantify the forest cover loss, the Hansen dataset was used as input data on the GEE platform for the ROI (Kakamega National Forest Reserve) [23]. Machine learning algorithms calculated pixels in bands as ” loss” and “gain”. A band with pixels equal to or below 0 (px0) was categorised as “loss” and a band with pixels that were equal to or above 0 (px0) was categorised as “gain.” The algorithm used vector data to reduce all the pixels in the ROI using the command function [ee. Reducer package] in GEE and to derive a statistic representation of the pixel data in the ROI [24]. Using the command function [ee. Image.pixelArea()] in GEE, the value of each pixel in the image of the area of interest was calculated in square meters. Therefore, the area of forest cover loss over the study period (2000–2020) was derived by multiplying the loss image within the area of interest and getting the sum.

2.3. Image Reclassification and Creation of Binary Raster Map

Forest loss and distribution data from the Hansen product was used as a raster input to perform forest area density (FAD) and morphological spatial pattern analysis (MSPA) using the Guidos Toolbox 3.0 (Graphical User Interface for the Description of image Objects and their Shapes-GTB) software [25]. The raster input data was reclassified into a binary raster map format in QGIS- 3.16 Hannover was used to create the values of 1 byte for background (non-forest) and 2 bytes for foreground (forest) i.e.,
  • For the “forest2000” raster, the threshold for reclassification used pixels over 50% as forest and under 50% as non-forest.
  • For the “forest2020” raster, the threshold for reclassification used in the forest loss was [0] to reference no loss and [1] to reference the other losses from [1 to 20] and a reclass of “forest2000” devoid of forest loss. Therefore, a reclassification of the results was obtained in the form of [0] for non-forest and [1] for forest.

2.3.1. Forest Area Density (FAD) Analysis

The FAD analysis used a per-pixel moving window assessment scheme to quantify the variable density distribution of forest cover (Table 3). This was achieved by assigning low density values to pixels along the patches to differentiate intact areas from less intact areas inside the study area. The reporting scheme used five colour-coded FAD class values within a range from 0 to 100% [25].

2.3.2. Morphological Spatial Pattern Analysis (MSPA)

MSPA analysis was performed using mathematical morphological sequences in the processing stage to describe the geometry and connectivity of the image components in the input binary raster map (Table 4). The output was a foreground MSPA segmentation class interpreted to match the nature of the input binary map. The distinguishable classes include: Core, Islet, Perforation, Edge, Loop, Bridge and Branch [20,26].

3. Results

3.1. Visualizing Forest Cover Change and Loss

The forest cover change and loss were visualized over the 20 years using false colour composites at different timeframes for comparison. In Figure 2, forest cover decreased in composite (c) for the year 2020, when compared to composite (a) for the year 2000. Fragments, patches, and gaps were visible in the interior and edge of the forest ecosystem composite and became visibly distinct as the timescale moved from the year 2000 to the year 2020. The true colour composite and satellite imagery in Figure 3 also showed clear-fell patches and roads transecting between the fragments, indicating an increase in the magnitude and intensity of clearings from 2000 to 2020. Change in forest cover was distinctly visible in the forest edge layer.

3.2. Forest Cover Loss

A gradual rising trend of forest cover loss was observed over the 20 years, as summarised in Table 5, with an increase in total forest cover loss from the first decade (2000–2010) accounting for 146.31 ha, compared to the second decade (2010–2020), which recorded a total forest cover loss of 698.41 ha. The estimated total area of forest cover loss observed for the study timeline (i.e., 2000–2020) was 826.60 ha. Table 6 shows a conversion matrix from previous studies on carbon storage in African tropical forests with a similar ecosystem type as our study area and summarises the carbon equivalent lost to the atmosphere [27,28].
Figure 4 details the rising trend of forest cover loss summarised in Table 5. The first decade under study (2000–2010) showed a gradual rise in forest cover loss from early 2002 (8.75 ha) to 2009 (44.31 ha). The second decade under study (2010–2020) exhibited a sharp increase in loss of forest cover observed from 2011 (5.28 ha) to 2017 (153.10 ha). A subsequent drop was observed from 2017 and onwards to 2018 and 2020.

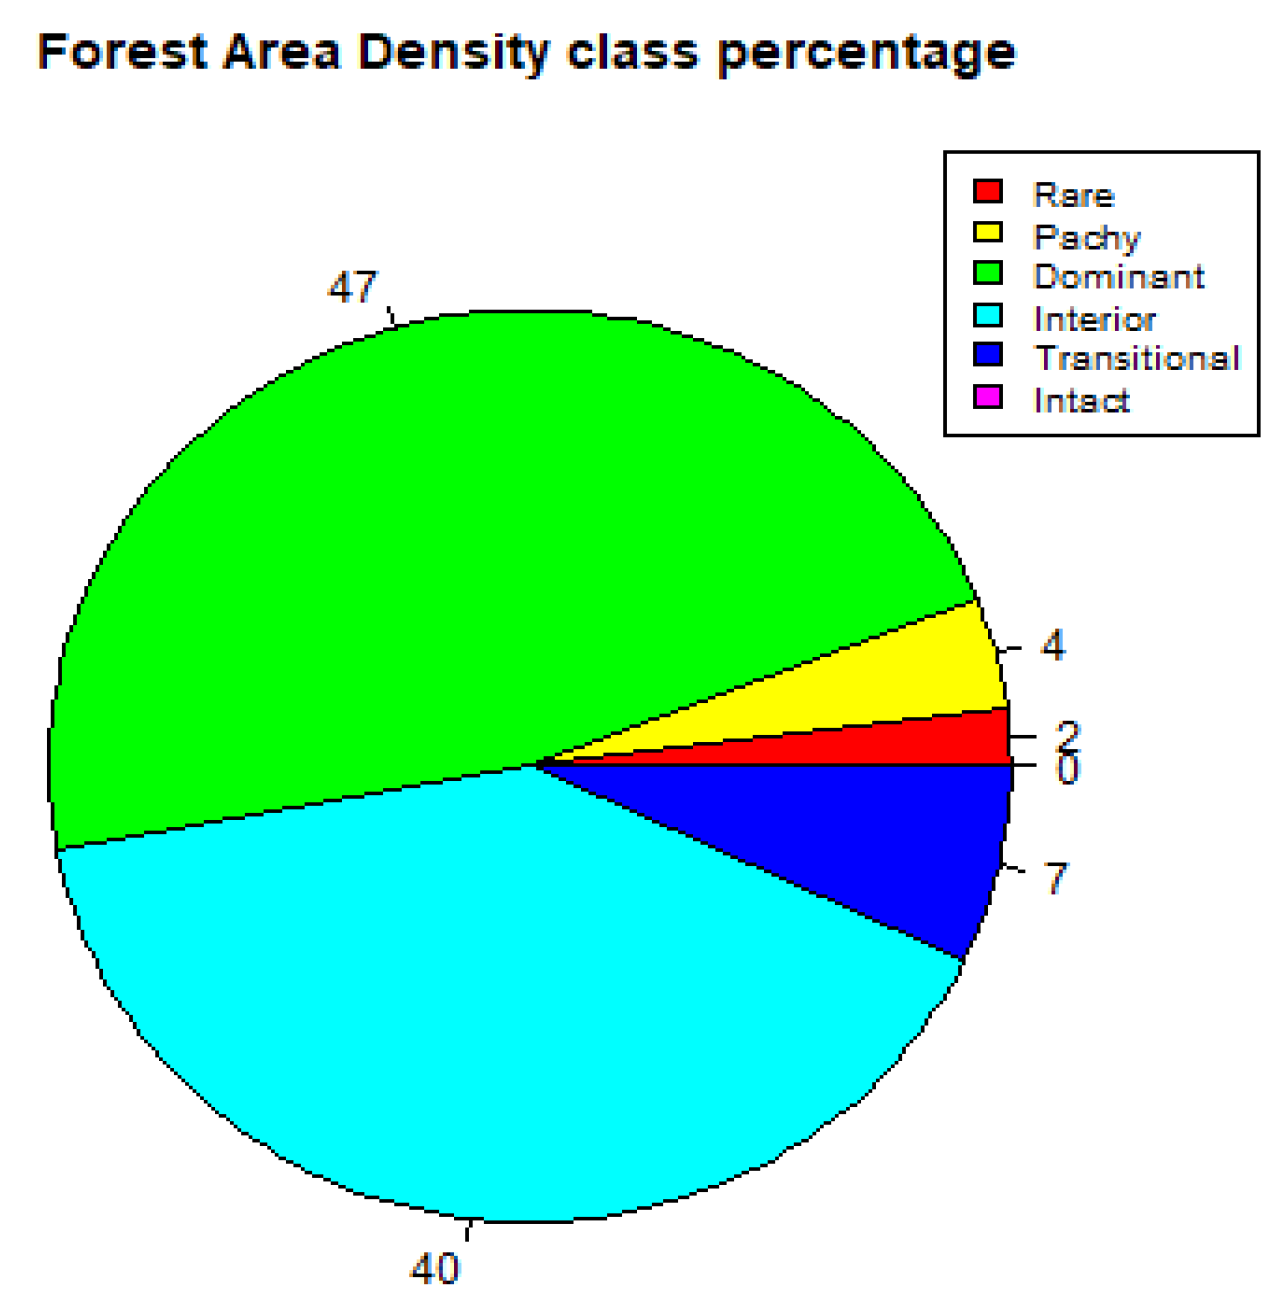
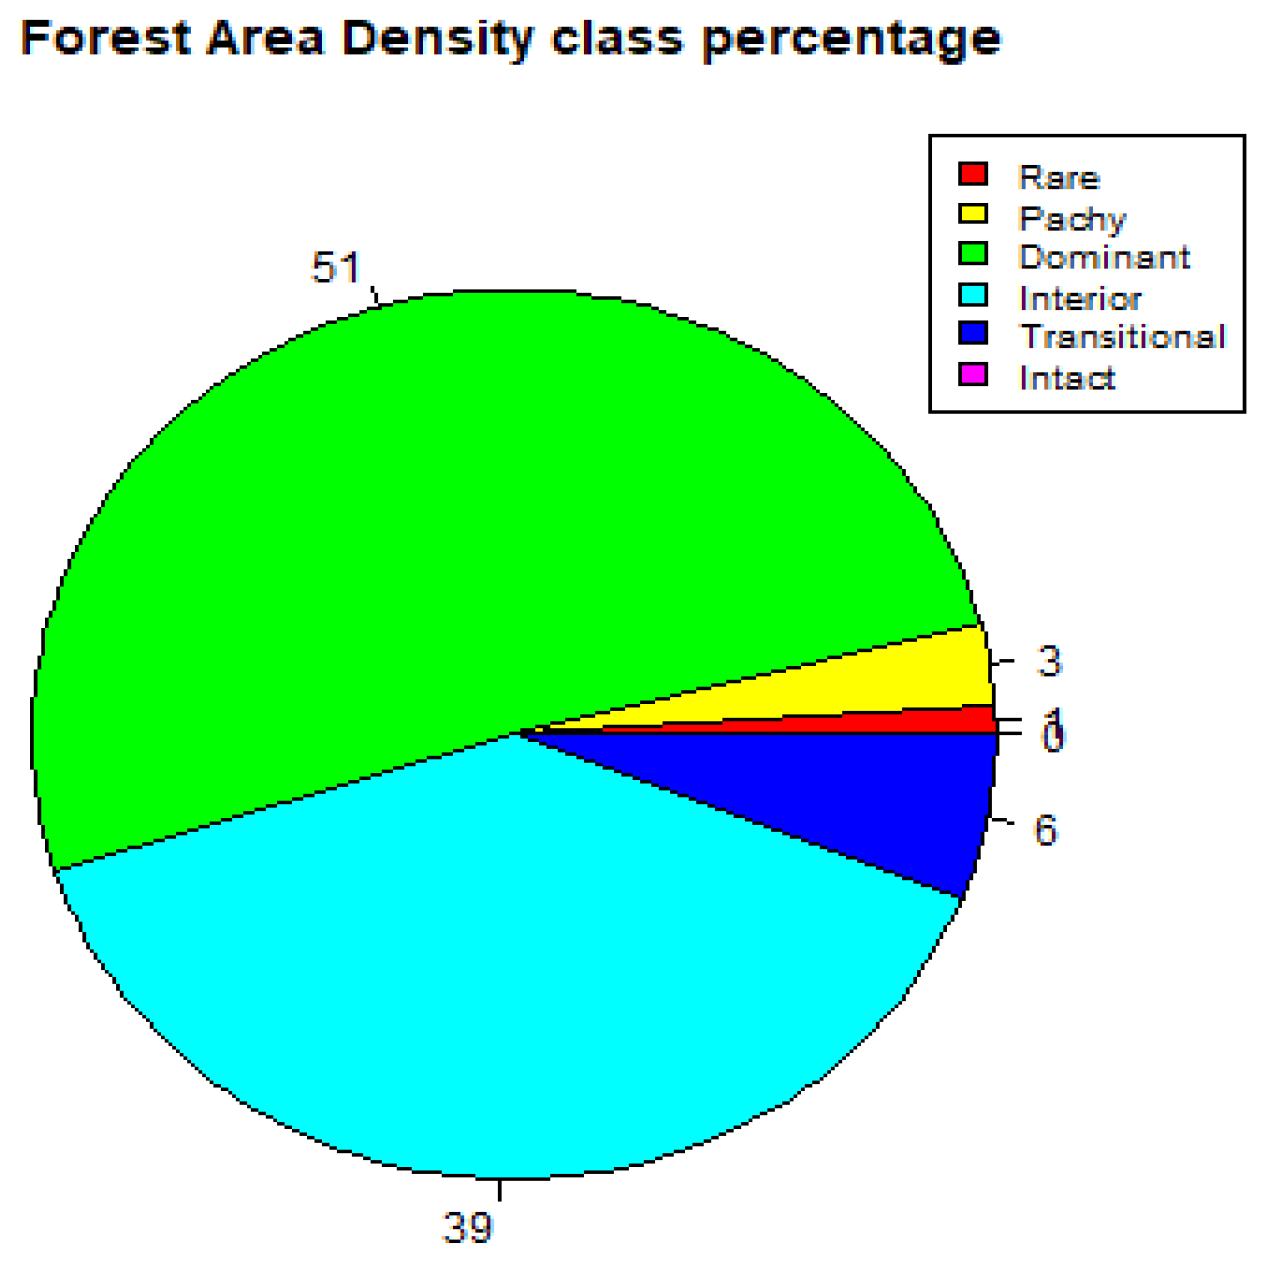
3.3. Forest Area Density (FAD)

3.3.1. FAD Fragmentation Classes for the Year 2000

The FAD analysis output depicts Kakamega Forest’s ecosystem to have 47% dominant layer, 40% interior, 7% transitional, 4% patchy, 2% rare and 0% intact layer for the year 2000, as shown in Figure 5 and Table 7. The dominant and interior layers, which have the highest percentages, respectively, correspond to the intactness of the interior part of the old-growth forest.

3.3.2. FAD Fragmentation Classes for the Year 2020

For the year 2020, the FAD analysis of the study area depicts a 51% dominant layer, 39% interior, 6% transitional, 3% patchy layer, 1% rare and 0% intact layer as seen in Figure 6 and summarised in Table 8. In comparison with the year 2000, there was an 8.5% increase in the dominant layer, a 2.5% decrease in the interior layer, a 14.3% decrease in the transitional layer, a 25% decrease in the patchy layer, a 50% decrease in the rare layer and no observable change in the intact layer 0%.

3.4. Morphological Spatial Pattern (MSPA) Changes

The MSPA analysis showed a change in the spatial pattern of landscape for Kakamega National Forest Reserve from the year 2000 to 2020. Observable change during the analysis was expressed as percentages of MSPA-class layers, as summarised in Table 9. The results depicted a 96% decrease in core layer, 25% decrease in islet layer, 19% increase in perforation layer, 13% increase in edge layer, 25% increase in loop layer, 33% increase in bridge layer, 4% decrease in branch layer and 14% increase in the openings layer. The decrease in core layer indicates a loss of intactness in the old-growth forest over time and is facilitated by the increase in perforation layer, which corresponds to the internal area perimeter between fragments. An increase in the edge and bridge layers suggests a loss of forest cover on the external perimeter of the ecosystem.

4. Discussion

Tropical forest cover loss accounts for more than 90% of the overall global forest loss estimated at 420 million hectares between 1990 and 2020 [29]. In a study of global forest cover change, the forest cover loss within tropical forest ecosystems in Africa and South America was majorly attributed to anthropogenic pressures [23]. Other studies have highlighted factors such as climate domains, ecosystem zones and tree cover density, indicating a correlation with loss and gains; however, land-use change practices and deforestation had a higher correlation with forest cover loss [4,21]. Deforestation dynamics and land-use change within tropical forests in Africa have negatively affected the forest edges and regeneration potential of species [30,31]. This rising trend of forest cover loss was also observed in our study area over the 20-year timeline and cumulatively accounted for an estimate of 826.60 hectares, equivalent to 123,494 megagrams of carbon emitted.
Carbon offset projections within the tropics are significant because of climate change and the potential of tropical forests to mitigate the effects of climate change [8]. A study by Glendai et al. highlights the potential for carbon sequestration in Kakamega National Forest Reserve to have an economically and ecologically significant impact on the environment at a national and regional scale, therefore making it relevant to climate mitigation programs in Kenya [28]. The rate of carbon storage and sequestration in tropical forests is linked to the state of indigenous forest areas within the core and intact layers [9]. Furthermore, other studies have concluded that tropical forests in Africa sequester large amounts of carbon, with increasing storage in old-growth forests transects [32,33].
The comparative FAD analysis at different time periods (i.e., 2000 and 2020) showed a 2.5% decrease in the interior layer, a 14.3% decrease in the transitional layer and a 25% decrease in the patchy layer. This is correlated with the observed spike in loss of forest cover from 2011 (accounting for 5.28 ha area loss) to 2017 (accounting for 153.10 ha area loss), because of the rise in demand for forest wood fuel in urban centres, which accounts for 26.9% woodstoves and 52% charcoal stoves, as identified by the Ministry of Energy in a national household survey [34]. In Kenya, 68% of households use wood fuel as their primary energy source which exerts pressure on forest resources and leads to deforestation [35]. Other factors that contributed significantly to the spike include the excision of forest land to small holder farmers, which negatively affected the natural succession and regeneration of the forest at the edge layer [36].
The subsequent drop in 2018, as seen in Figure 4, occurred because of the logging moratorium issued by the Kenyan government on the 24 February 2018 to limit timber harvesting in a natural forest and reduce forest degradation [37,38]. A decrease in the interior layer and the transitional layer, also displayed in Figure 6, was mainly attributed to deforestation and the expansion of agricultural activities by small holder farmers at the edge of the study area. This happened due to the immediate population pressure for resources for both subsistence and commercial reasons, attributed to factors such as an increase in the population density of Kakamega county, as recorded by the 2019 Kenya Population and Housing Census [39].
The MSPA analysis of the study area illustrated changes in the spatial pattern and landscape at different timescales from the year 2000 to 2020, showing a 96% decrease in the core layer, a 19% increase in the perforation layer, a 13% increase in the edge layer and a 14% increase in the openings layer. The rising spike of 2017 (Figure 4) appeared because of deforestation and land-use change corroborated with the observed increase in the edge layer, openings layer and perforation layer. The forest edge layer and perforation layer are more susceptible to anthropogenic disturbances compared to the interior and core layers, because of their proximity to human settlements. Similar studies on tropical forest ecosystems in Africa have identified land-use change patterns, specifically on the forest edge layer and perforation layer because of the conversion of forest land to agricultural cropland, shift grazing systems and illegal encroachments leading to a gradual decline of tropical forest cover [4,40].
The decrease in the core layer has altered the dynamics of the forest ecosystem functions and created fragmented landscape patterns such as isolated patches that separate habitats. The patterns allude to the nature of disturbance, intensity, and the position of disturbance relative to the protected forest area. These disturbances negatively impact the abundance of species [2]. The highest diversity of species is normally found in the interior, and the lowest diversity is present at the forest edge [41,42].
False colour composites in Figure 2 and true colour composite in Figure 3 illustrate the changes in plant density and vegetation health. Fragments, patches, and clear fell gaps are visible in the interior and at the edge of the forest ecosystem composite. The visualization of vegetation health and changes in plant density for the study area used Hansen GLAD map data because of the existing similarity of ecosystem types in the targeted study area to the tropical rainforest ecosystem in Central Africa, specifically the Democratic Republic of the Congo where similar probability-based statistical methods were leveraged in previous studies by Zhuravleva et al. and Turubanova et al. [21,30].
In both the FAD analysis and the MSPA analysis of the Kakamega Forest ecosystem, fragmentation has led to the loss and division of habitats, creating smaller isolated units that limit the movements and interaction of species [43]. The changes in forest cover have adversely influenced the survival of species and the ability of organisms to adapt because of their specific response to ecological pressure. Organisms with a higher tolerance to low canopy cover and direct sunlight are more likely to thrive at the forest edge, while shade tolerant species are more likely to thrive under conditions of canopy cover and shade [44,45]. Niche-specific species of birds i.e., grey parrot (Psittacus Erithacus) and lanner falcon (Falco biarmicus), are negatively affected because of old-growth forest loss. The blue monkey and black-and-white Colobus monkey endemic to the Kakamega Forest ecosystem are negatively affected by the fragmented landscape because of their role as seed dispersal species, which is crucial for natural forest regeneration. Moreover, fragmented forest ecosystems support fewer species when compared to intact forest ecosystems [46,47].

5. Conclusions

The conversion of forest land to non-forest use through practices such as the clearing of forest land for agricultural cropland, shift grazing systems for livestock and the establishment of temporary settlement structures, have significantly changed the landscape pattern of Kakamega National Forest Reserve. A time series analysis over 20 years has demonstrated a rising trend of forest cover loss in the study area despite its protected status. Fragmentation analysis, using parameters such as rare, patchy, transitional, dominant, and interior have allowed us to visualize the spatial patterns and quantify changes in the forest landscape. A decrease in the interior layer and transitional layer leading to an increase in forest patches alludes to the existing pressure on the intact layer, successive layer and the forest edge layer.
Habitat loss, as described by the fragmented landscape, has affected the forest biodiversity and the quality of forest ecosystem services by disrupting wildlife corridors and preventing the migration of seed dispersal species that are essential for ecosystem health and natural regeneration. Anthropogenic drivers were identified to contribute significantly to changes in the study area, adversely affecting the ability of the ecosystem to recover niche-specific endemic species of birds that thrive under conditions of canopy cover and shade, which are at risk of extinction in the backdrop of climate change. Therefore, further studies are recommended to provide quantitative data on forest ecosystem services to establish integrated forest management in Kakamega National Forest Reserve.

Author Contributions

Conceptualization; methodology, M.D.N. and E.O.O.; software, M.D.N. and E.O.O.; formal analysis.; writing—original draft preparation, E.O.O.; writing—review and editing, M.D.N. and E.O.O.; supervision, M.D.N. and I.V.A.; funding acquisition, I.V.A. All authors have read and agreed to the published version of the manuscript.

Funding

This research was funded by a grant from Transilvania University of Brasov, Interdisciplinary Doctoral School [Grant number DGRIAE-111284/IN1/1/EC/03.09.2021].

Data Availability Statement

The data presented in this study are available on request from the corresponding author.

Acknowledgments

We gratefully acknowledge the four anonymous reviewers who provided valuable assistance for our analysis, feedback for our results, and constructive comments which greatly helped improve this manuscript.

Conflicts of Interest

The authors declare no conflict of interest.

Appendix A

Table A1. Kakamega Forest Ecosystem (KFE) Management Zones.
Kfe ZoneDescriptionManagementSizeSource
Kakamega
Forest Reserve
Main block in Kakamega Forest EcosystemKFS, Kakamega Forest Station19,792.4 ha[48]. Retrieved 16 March 2022,
http://www.kenyaforestservice.org/
Isecheno
Nature
Reserve
Forest nature Reserve established by boundary Plan number 180/40-42KFS, Kakamega Forest Station138 ha[22]
Yala River
Nature
Reserve
Forest nature reserve via boundary
Plan number 180/40-42
KFS, Kakamega Forest Station538 ha[48]. Retrieved 16 March 2022,
http://www.kenyaforestservice.org/
Kakamega
National
Reserve
Established under Legal Notice No. 95 of May 1985 and boundary Plan No. 272 of 1986KWS, Buyangu
office
3984.9 ha[11]
Kisere National ReserveEstablished under Legal Notice No. 95KWS, Buyangu
office
471 ha[11]

References

  1. Brockerhoff, E.G.; Barbaro, L.; Castagneyrol, B.; Forrester, D.I.; Gardiner, B.; González-Olabarria, J.R.; Lyver, P.O.B.; Meurisse, N.; Oxbrough, A.; Taki, H.; et al. Forest Biodiversity, Ecosystem Functioning and the Provision of Ecosystem Services. Biodivers. Conserv. 2017, 26, 3005–3035. [Google Scholar] [CrossRef] [Green Version]
  2. Gibson, L.; Lee, T.M.; Koh, L.P.; Brook, B.W.; Gardner, T.A.; Barlow, J.; Peres, C.A.; Bradshaw, C.J.A.; Laurance, W.F.; Lovejoy, T.E.; et al. Primary Forests Are Irreplaceable for Sustaining Tropical Biodiversity. Nature 2011, 478, 378–381. [Google Scholar] [CrossRef] [PubMed]
  3. Corona, P.; Franceschi, S.; Pisani, C.; Portoghesi, L.; Mattioli, W.; Fattorini, L. Inference on Diversity from Forest Inventories: A Review. Biodivers. Conserv. 2017, 26, 3037–3049. [Google Scholar] [CrossRef]
  4. Keenan, R.J.; Reams, G.A.; Achard, F.; de Freitas, J.V.; Grainger, A.; Lindquist, E. Dynamics of Global Forest Area: Results from the FAO Global Forest Resources Assessment 2015. For. Ecol. Manag. 2015, 352, 9–20. [Google Scholar] [CrossRef]
  5. Baker, D.J.; Richards, G.; Grainger, A.; Gonzalez, P.; Brown, S.; DeFries, R.; Held, A.; Kellndorfer, J.; Ndunda, P.; Ojima, D.; et al. Achieving Forest Carbon Information with Higher Certainty: A Five-Part Plan. Environ. Sci. Policy 2010, 13, 249–260. [Google Scholar] [CrossRef]
  6. Locatelli, B. Ecosystem Services and Climate Change. In Routledge Handbook of Ecosystem Services; Routledge: London, UK, 2018; pp. 481–490. [Google Scholar] [CrossRef] [Green Version]
  7. Lange, M.; Eisenhauer, N.; Sierra, C.A.; Bessler, H.; Engels, C.; Griffiths, R.I.; Mellado-Vázquez, P.G.; Malik, A.A.; Roy, J.; Scheu, S.; et al. Plant Diversity Increases Soil Microbial Activity and Soil Carbon Storage. Nat. Commun. 2015, 6, 6707. [Google Scholar] [CrossRef] [PubMed] [Green Version]
  8. Gonzalez, P.; Kroll, B.; Vargas, C.R. Tropical Rainforest Biodiversity and Aboveground Carbon Changes and Uncertainties in the Selva Central, Peru. For. Ecol. Manage. 2014, 312, 78–91. [Google Scholar] [CrossRef]
  9. Glenday, J. Carbon Storage and Emissions Offset Potential in an East African Tropical Rainforest. For. Ecol. Manage. 2006, 235, 72–83. [Google Scholar] [CrossRef]
  10. Vuyiya, E.; Konje, M.; Tsingalia, H.; Obiet, L.; Kigen, C.; Wamalwa, S.; Nyongesa, H. The Impacts of Human Activities on Tree Species Richness and Diversity in Kakamega Forest, Western Kenya. Int. J. Biodivers. Conserv. 2014, 6, 428–435. [Google Scholar] [CrossRef]
  11. Kagombe, J.; Kimondo, J.; Kiama, S. Kakamega Forest Strategic Ecosystem Plan 2015. 2016. Available online: https://issuu.com/nature_kenya/docs/kakamega_strategic_plan_2015-2040 (accessed on 1 December 2016).
  12. Schleuning, M.; Farwig, N.; Peters, M.K.; Bergsdorf, T.; Bleher, B.; Brandl, R.; Dalitz, H.; Fischer, G.; Freund, W.; Gikungu, M.W.; et al. Forest Fragmentation and Selective Logging Have Inconsistent Effects on Multiple Animal-Mediated Ecosystem Processes in a Tropical Forest. PLoS ONE 2011, 6, e27785. [Google Scholar] [CrossRef]
  13. Bleher, B.; Uster, D.; Bergsdorf, T. Assessment of Threat Status and Management Effectiveness in Kakamega Forest, Kenya. Biodivers. Conserv. 2006, 15, 1159–1177. [Google Scholar] [CrossRef]
  14. Müller, D.; Mburu, J. Forecasting Hotspots of Forest Clearing in Kakamega Forest, Western Kenya. For. Ecol. Manage. 2009, 257, 968–977. [Google Scholar] [CrossRef]
  15. Mitchell, N.; Schaab, G. Developing a Disturbance Index for Five East African Forests Using GIS to Analyse Historical Forest Use as an Important Driver of Current Land Use/Cover. Afr. J. Ecol. 2008, 46, 572–584. [Google Scholar] [CrossRef]
  16. Oloo, F.; Murithi, G.; Jepkosgei, C. Quantifying Tree Cover Loss in Urban Forests within Nairobi City Metropolitan Area from Earth Observation Data. Environ. Sci. Proc. 2020, 3, 78. [Google Scholar] [CrossRef]
  17. Mitchell, N.; Lung, T.; Schaab, G. Tracing Significant Losses and Limited Gains in Forest Cover for the Kakamega-Nandi Complex in Western Kenya across 90 Years by Use of Satellite Imagery, Aerial Photography and Maps. In Proceedings of the ISPRS (TC7) Mid-Term Symposium Remote Sensing: From Pixels to Processes, Enschede, The Netherlands, 8–11 May 2006; pp. 8–11. [Google Scholar]
  18. Vauhkonen, J. Predicting the Provisioning Potential of Forest Ecosystem Services Using Airborne Laser Scanning Data and Forest Resource Maps. For. Ecosyst. 2018, 5, 24. [Google Scholar] [CrossRef] [Green Version]
  19. Congedo, L. Semi-Automatic Classification Plugin: A Python Tool for the Download and Processing of Remote Sensing Images in QGIS. J. Open Source Softw. 2021, 6, 3172. [Google Scholar] [CrossRef]
  20. Vogt, P.; Riitters, K.; Rambaud, P.; d’Annunzio, R.; Lindquist, E.; Pekkarinen, A. GuidosToolbox Workbench: Spatial Analysis of Raster Maps for Ecological Applications. Ecography 2022, 2022, e05864. [Google Scholar] [CrossRef]
  21. Zhuravleva, I.; Turubanova, S.; Potapov, P.; Hansen, M.; Tyukavina, A.; Minnemeyer, S.; Laporte, N.; Goetz, S.; Verbelen, F.; Thies, C. Satellite-Based Primary Forest Degradation Assessment in the Democratic Republic of the Congo, 2000-2010. Environ. Res. Lett. 2013, 8, 2000–2010. [Google Scholar] [CrossRef] [Green Version]
  22. Kakamega Forest Ecosystem Management Plan Kakamega Forest Ecosystem Management Plan. 2010. Available online: https://www.scribd.com/document/80335462/Kws-Strategic-Plan (accessed on 1 December 2016).
  23. Hansen, M.C.; Potapov, P.V.; Moore, R.; Hancher, M.; Turubanova, S.A.; Tyukavina, A.; Thau, D.; Stehman, S.V.; Goetz, S.J.; Loveland, T.R.; et al. High-resolution global maps of 21st-century forest cover change. Science 2013, 342, 850–853. [Google Scholar] [CrossRef]
  24. Introduction to Forest Change Analysis in Earth Engine | Google Earth Engine | Google Developers. Available online: https://developers.google.com/earth-engine/tutorials/tutorial_forest_01 (accessed on 22 February 2022).
  25. Vogt, P.; Riitters, K. GuidosToolbox: Universal Digital Image Object Analysis. Eur. J. Remote Sens. 2017, 50, 352–361. [Google Scholar] [CrossRef]
  26. Ye, H.; Yang, Z.; Xu, X. Ecological Corridors Analysis Based on MSPA and MCR Model-a Case Study of the Tomur World Natural Heritage Region. Sustain. 2020, 12, 959. [Google Scholar] [CrossRef] [Green Version]
  27. Network, R.O. High Aboveground Carbon Stock of African Tropical Montane Forests. Nature 2021, 596, 536–542. [Google Scholar]
  28. Glenday, J. A Preliminary Assessment of Carbon Storage and the Potential for Forestry Based Carbon Offset Projects in the Kakamega National Forest, Kenya. Ph.D. Thesis, Brown University, Providence, Rhode Island, 2004. [Google Scholar]
  29. Anshari, G.Z.; Chacón, N.; Farrell, A.; Halim, A.S.; Neufeldt, H.; Sukumar, R. IPCC, Cross Chapter Paper7: Tropical Forests. IPCC WGII Sixth Assess. Rep. 2021, 1, 1–63. [Google Scholar]
  30. Turubanova, S.; Potapov, P.V.; Tyukavina, A.; Hansen, M.C. Ongoing Primary Forest Loss in Brazil, Democratic Republic of the Congo, and Indonesia. Environ. Res. Lett. 2018, 13, 2000–2010. [Google Scholar] [CrossRef] [Green Version]
  31. Sayer, J.A.; Harcourt, C.S.; Collins, N.M. The Conservation Atlas of Tropical Forests: Africa; Springer: Berlin/Heidelberg, Germany, 1992. [Google Scholar] [CrossRef]
  32. Lewis, S.L.; Lopez-Gonzalez, G.; Sonké, B.; Affum-Baffoe, K.; Baker, T.R.; Ojo, L.O.; Phillips, O.L.; Reitsma, J.M.; White, L.; Comiskey, J.A.; et al. Increasing Carbon Storage in Intact African Tropical Forests. Nature 2009, 457, 1003–1006. [Google Scholar] [CrossRef]
  33. Brown, S.; Lugo, A.E. Trailblazing the Carbon Cycle of Tropical Forests from Puerto Rico. Forests 2017, 8, 101. [Google Scholar] [CrossRef]
  34. Ministry of Energy Republic of Kenya Ministry of Energy Kenya Household Cooking Sector Study Assessment of the Supply and Demand of Cooking Solutions at the Household Level. 2019. Available online: https://www.fao.org/forestry/energy/catalogue/search/detail/en/c/1306942/ (accessed on 13 November 2019).
  35. MoE. Sessional Paper No. 4 on Energy; Ministry of Energy, 2004; p. 68. Available online: https://repository.kippra.or.ke/handle/123456789/1371 (accessed on 1 May 2004).
  36. Benson Njora, H.Y. Effects of Deforestation on Humans and the Environment. Hum. Leag. 2022. Available online: https://eedadvisory.com/wp-content/uploads/2020/09/MoE-2019-Kenya-Cooking-Sector-Study-compressed.pdf (accessed on 16 March 2022).
  37. Kagombe, J.; Kiprop, J.; Langat, D.; Cheboiwo, J.; Wekesa, L.; Ongugo, P.; Mbuvi, M.T.; Leley, N. Socio-Economic Impact of Forest Harvesting Moratorium in Kenya; KEFRI: Nairobi, Kenya, 2015; Volume 9001, ISBN 2041200200. [Google Scholar]
  38. Ministry of Environment Statement of Moratorium Pdf. 2018. Available online: http://www.environment.go.ke (accessed on 16 November 2018).
  39. KNBS. Kenya Population and Housing Census Volume 1: Population by County and Sub-County; The Kenya National Bureau of Statistics (KNBS): Nairobi, Kenya, 2019; Volume I, ISBN 9789966102096.
  40. Rajpar, M.N. Tropical Forests Are An Ideal Habitat for Wide Array of Wildlife Species. In Tropical Forests: New Edition; IntechOpen: London, UK, 2018; pp. 38–46. [Google Scholar] [CrossRef] [Green Version]
  41. Habel, J.C.; Koc, E.; Gerstmeier, R.; Gruppe, A.; Seibold, S.; Ulrich, W. Insect Diversity across an Afro-Tropical Forest Biodiversity Hotspot. J. Insect Conserv. 2021, 25, 221–228. [Google Scholar] [CrossRef]
  42. Plotkin, J.B.; Potts, M.D.; Yu, D.W.; Bunyavejchewin, S.; Condit, R.; Foster, R.; Hubbell, S.; LaFrankie, J.; Manokaran, N.; Seng, L.H.; et al. Predicting Species Diversity in Tropical Forests. Proc. Natl. Acad. Sci. USA 2000, 97, 10850–10854. [Google Scholar] [CrossRef] [Green Version]
  43. Butchart, S.H.M.; Walpole, M.; Collen, B.; Van Strien, A.; Scharlemann, J.P.W.; Almond, R.E.A.; Baillie, J.E.M.; Bomhard, B.; Brown, C.; Bruno, J.; et al. Global Biodiversity: Indicators of Recent Declines. Science 2010, 328, 1164–1168. [Google Scholar] [CrossRef]
  44. Morrison, K.R.; Stacy, E.A. Intraspecific Divergence and Evolution of a Life-History Trade-off along a Successional Gradient in Hawaii’s Metrosideros Polymorpha. J. Evol. Biol. 2014, 27, 1192–1204. [Google Scholar] [CrossRef] [PubMed]
  45. Feng, J.; Zhao, K.; He, D.; Fang, S.; Lee, T.; Chu, C.; He, F. Comparing Shade Tolerance Measures of Woody Forest Species. PeerJ 2018, 2018, e5736. [Google Scholar] [CrossRef] [PubMed]
  46. Marshall, A.R. Disturbance in the Udzungwas: Responses of Monkeys and Trees to Forest Degradation. Ph.D. Thesis, University of York, York, UK, 2007. [Google Scholar]
  47. Nijman, V. Effects of behavioural changes due to habitat disturbance on density estimation of rain forest vertebrates, as illustrated by gibbons (primates: Hylobatidae). In Forest (and) Primates: Conservation and Ecology of the Endemic Primates of Java and Borneo, Tropenbos Foundation; Tropenbos International: Wageningen, The Netherlands, 2001; pp. 217–226. [Google Scholar]
  48. KFS Kenya Forest Service—Kakamega Forest. Available online: http://www.kenyaforestservice.org/index.php?option=com_content&view=article&id=687:kakamega-forest-station&catid=179&Itemid=686 (accessed on 28 May 2021).
Figure 1. Map of Kakamega National Forest Reserve Ecosystem.
Forests 13 02127 g001
Figure 2. False colour image composites showing forest change at different timescales (a) 2000, (b) 2010 and (c) 2020 of Kakamega Forest National Reserve.
Forests 13 02127 g002
Figure 3. True colour composite (a) showing forest patch (b) and fragments (c) in Kakamega Forest.
Forests 13 02127 g003
Figure 4. Trend of forest cover loss using Hansen Global Forest Change 2000–2020.
Forests 13 02127 g004
Figure 5. Forest Area Density (FAD) showing percentage of fragmentation class (2000).
Forests 13 02127 g005
Figure 6. Forest area density (FAD) showing percentage of fragmentation class (2020).
Forests 13 02127 g006
Table 1. Band combinations for monitoring plant density using Landsat 7 data.
BandWavelengthDescription
SR_B20.52–0.60 μmBand 2 (green) surface reflectance
SR_B30.63–0.69 μmBand 3 (red) surface reflectance
SR_B40.77–0.90 μmBand 4 (near infrared) surface reflectance
SR_B51.55–1.75 μmBand 5 (shortwave infrared 1) surface reflectance
Table 2. Band combinations for monitoring crop health using Sentinel-2 data.
BandWavelengthDescription
B111613.7 nm (S2A)/1610.4 nm (S2B)SWIR 1
B8835.1 nm (S2A)/833 nm (S2B)NIR
B2496.6 nm (S2A)/492.1 nm (S2B)Blue
Table 3. Fragmentation classes (FAD-APP 5-class).
FAD-APP 5-ClassColorRange
1-Rare FAD < 10%
2-Patchy 10% ≤ FAD < 40%
3-Transitional 40% ≤ FAD < 60%
4-Dominant 60% ≤ FAD < 90%
5-Interior 90% ≤ FAD ≤ 100%
Table 4. Foreground classes for morphological spatial pattern analysis.
(MSPA) Foreground ClassesDescriptionColor
Core: interior area excluding perimeter
Islet: disjoint and too small to have core
Loop: connected to the same core area
Bridge: connected to different core areas
Perforation: internal area perimeter
Edge: external area perimeter
Branch: connected at one end to Edge, Perforation. Bridge or Loop
Background:border-opening/along edge/core opening with perforation
Table 5. Summary of forest cover loss estimate from Hansen Global Forest Change.
Timescale1st Decade2nd DecadeTotal Cover Loss
Year2000–20102010–20202000–2020
Area (ha)146.31680.29826.60
Table 6. Summary of carbon equivalent lost to the atmosphere through forest cover loss.
Mean Aboveground Biomass Carbon (AGC) (MgC)
2000–20102010–20202000–2020
95% confidence interval
(137.1–164.2 MgC/ha)
---
149.4 MgC/ha [27,28]21,858.71101,633.8 123,494
Table 7. Summary of observable scale for fragmentation analysis in the year 2000.
Fragmentation Class\Observable Scale:12345 Summary
Rare:1.232.302.942.943.791.90
Patchy:2.982.793.206.8114.093.73
Transitional:3.654.576.8312.8926.436.62
Dominant:11.0817.6726.3540.9252.2047.50
Interior:8.9717.5228.7532.963.4740.22
Intact:72.0655.1231.913.4500
Table 8. Summary of observable scale for fragmentation analysis in the year 2020.
Fragmentation Class\Observable Scale:12345 Summary
Rare:0.741.371.701.743.071.15
Patchy:2.372.653.516.3011.843.47
Transitional:3.684.646.5112.8628.525.76
Dominant:11.9218.8227.8943.1653.3850.79
Interior:11.9522.6932.0732.663.1738.81
Intact:69.3049.8028.293.2500
Table 9. Change in MSPA-class layers (2000–2020) for Kakamega Forest Ecosystem.
MSPA-ClassColourFG/Data Pixels [%]
forest2000 Binary Raster
FG/Data Pixels [%]
forest2020 Binary Raster
MSPA [%] Change
Core(m): 78.9177.3696
Islet: 4.083.0525
Perforation: 5.66.6919
Edge: 8.069.1513
Loop: 0.921.1525
Bridge: 0.781.0433
Branch: 1.651.574
Opening: 5.276.0114
Publisher’s Note: MDPI stays neutral with regard to jurisdictional claims in published maps and institutional affiliations.

