Article

Modeling the Missing DBHs: Influence of Model Form on UAV DBH Characterization

1
Rocky Mountain Research Station, USDA Forest Service, Fort Collins, CO 80526, USA
2
Natural Resource Ecology Laboratory, Colorado State University, Fort Collins, CO 80523, USA
3
Department of Forest and Rangeland Stewardship, Colorado State University, Fort Collins, CO 80524, USA
*
Author to whom correspondence should be addressed.
Forests 2022, 13(12), 2077; https://doi.org/10.3390/f13122077
Submission received: 9 November 2022 / Revised: 30 November 2022 / Accepted: 1 December 2022 / Published: 6 December 2022
(This article belongs to the Special Issue Advanced Applications of UAV Remote Sensing in Forest Structure)

Abstract

:
The reliability of forest management decisions partly depends on the quality and extent of the data needed for the decision. However, the relatively high cost of traditional field sampling limits sampling intensity and data quality. One strategy to increase data quality and extent, while reducing the overall sample effort, is using remote sensing-based data from unmanned aerial vehicles (UAV). While these techniques reliably identify most tree locations and heights in open-canopied forests, their ability to characterize diameter at breast height (DBH) is limited to estimates of a fraction of trees within the area. This study used UAV-derived DBHs and explanatory variables to test five model forms in predicting the missing DBHs. The results showed that filtering UAV DBHs using regionally derived height to DBH allometries significantly improved model performance. The best predicting model was slightly biased, with a 5.6 cm mean error and a mean absolute error of 6.8 cm. When applied across the stand, the number of trees was underestimated by 26.7 (3.9%), while the basal area and quadratic mean diameter were overestimated by 3.3 m2 ha−1 (13.1%) and 1.8 cm (8.3%), respectively. This study proposes a pathway for remotely sensed DBHs to predict missing DBHs; however, challenges are highlighted in ensuring the model training dataset represents the population.

1. Introduction

The reliability of forest planning and management decisions depends on the quality and intensity of forest inventory data available to inform decision-making [1]. Traditionally, forest inventories of critical parameters such as a tree’s diameter at breast height (DBH; 1.37 m above ground in United States) and total height have involved the collection on fixed area or variable radius plot networks [2]. These plot networks attempt to capture a representative sample of the population, to summarize standard metrics used in silvicultural prescription development, such as trees ha−1, basal area (m2 ha−1), DBH distributions, and quadratic mean DBH (Dq [2]). Regional inventory strategies often use a sub-sample of attributes, such as tree total height, to maximize efficiency of the time and expense of a forest inventory. The missing observations of tree height are often subsequently estimated through tree-level allometric relationships [3]. The most common of these allometric relationships utilize non-linear relationships to predict dependent variables (i.e., total height) from one or more independent variables (i.e., DBH [4]).
The development and application of allometric relationships for describing forest structure require three things. First, training data that represents the range of conditions desired for model prediction [5]. Second, that explanatory variables correlated with the dependent variable of interest can be reliably collected. Finally, a model form that captures the generalized relationship between the dependent and independent variables [6]. When developed to fill sub-sampling data voids, allometric relationships typically draw on large, distributed samples (i.e., n ≥ 100) with explanatory variables that encompass abiotic (e.g., geographic location or Site Index) and biotic (e.g., trees ha−1, stand basal area, or basal area of larger DBH trees) conditions.
Since the 1990s, evaluation of three-dimensional remote sensing approaches (e.g., airborne light detection and ranging (LiDAR) and structure from motion (SfM)) have demonstrated their ability to characterize forest attributes, from individual trees to stands and watersheds [7,8,9]. At the tree level, these studies focused on identifying primary attributes such as tree location, height, and crown area [10]. Applications of airborne LiDAR [11,12] and SfM photogrammetry [13,14] to remotely sense tree heights in conifer forests have achieved average precisions within 0.1 to 1 m. By tailoring individual tree detection strategies to a study site’s forest structure, they can successfully identify more than 90% of trees in a stand [15,16], with most omitted trees occupying the lower canopy stratum. Secondary tree attributes can be reliably derived from detected tree heights and crown areas, such as stem volume [12] and crown base height [17], through parametric and non-parametric regression.
The application of tree-level remote sensing techniques has recently been extended within the unmanned aerial vehicle (UAV) SfM literature, to evaluate the extraction of individual tree DBH values from these point clouds [18]. By applying a least-squares circle fitting approach, Swayze et al. [14] estimated ~10% of DBHs in a ponderosa pine (Pinus ponderosa Lawson & C. Lawson var. scopulorum Engelm.) dominated stand, to a mean error of 0.6 cm. Successful DBH estimation from UAV point clouds relies on either an iterative parameter tuning strategy during DBH extraction [19] or a post-extraction data filtering strategy [14]. These techniques help to overcome known DBH extraction issues, where some unreliable values are identified and removed. These strategies can substantially improve the relationship of extracted to observed DBH values, with Swayze et al. [14] increasing their R2 by >0.3 after filtering. These strategies for improving DBH extraction have implications for the data processing intensity and potential transference of methods, as they either rely on site-specific tuning or access to outside data sources. However, when brought together, these advances in 3D remote sensing data collection and processing make it possible to remotely characterize the location and height of over 90% of trees while capturing a sample (e.g., 10 to 50%) of tree DBHs.
The potential in open-canopied forests for extensive and reliable UAV surveys of tree heights that are spatially tied to samples of DBH values demonstrates the possibility of adapting inventory allometry strategies to estimate missing DBH values. Various modeling approaches exist for filling in these missing values, based on how the DBH sample relates to the potential independent UAV-derived explanatory variables. Traditional linear and non-linear parametric modeling strategies [20] have been suggested to use UAV-derived tree height, crown area, and competition indices (i.e., trees ha−1 or relative tree height to neighbors) as predictors. Generally, the performance of allometric relationships is dependent on three criteria, the predictive stability of the relationship being modeled, the size of the model development sample, and the representativeness of the model development sample for the environment it will be used to predict.
This study evaluated how the extraction and filtering of UAV point cloud sample DBH data impact the model fit and subsequent prediction of tree and stand-level DBH-derived parameter accuracy. We used UAV-derived DBHs and explanatory variables to build models, before and after filtering the detected DBH values by a regional allometric equation’s prediction bounds of height to DBH. Specifically, we evaluated five models in the form of simple linear, multiple linear, and three non-linear model structures. The accuracy of the modeled DBH values was determined compared to a 4 hectare stem map in a ponderosa pine-dominated forest.

2. Materials and Methods

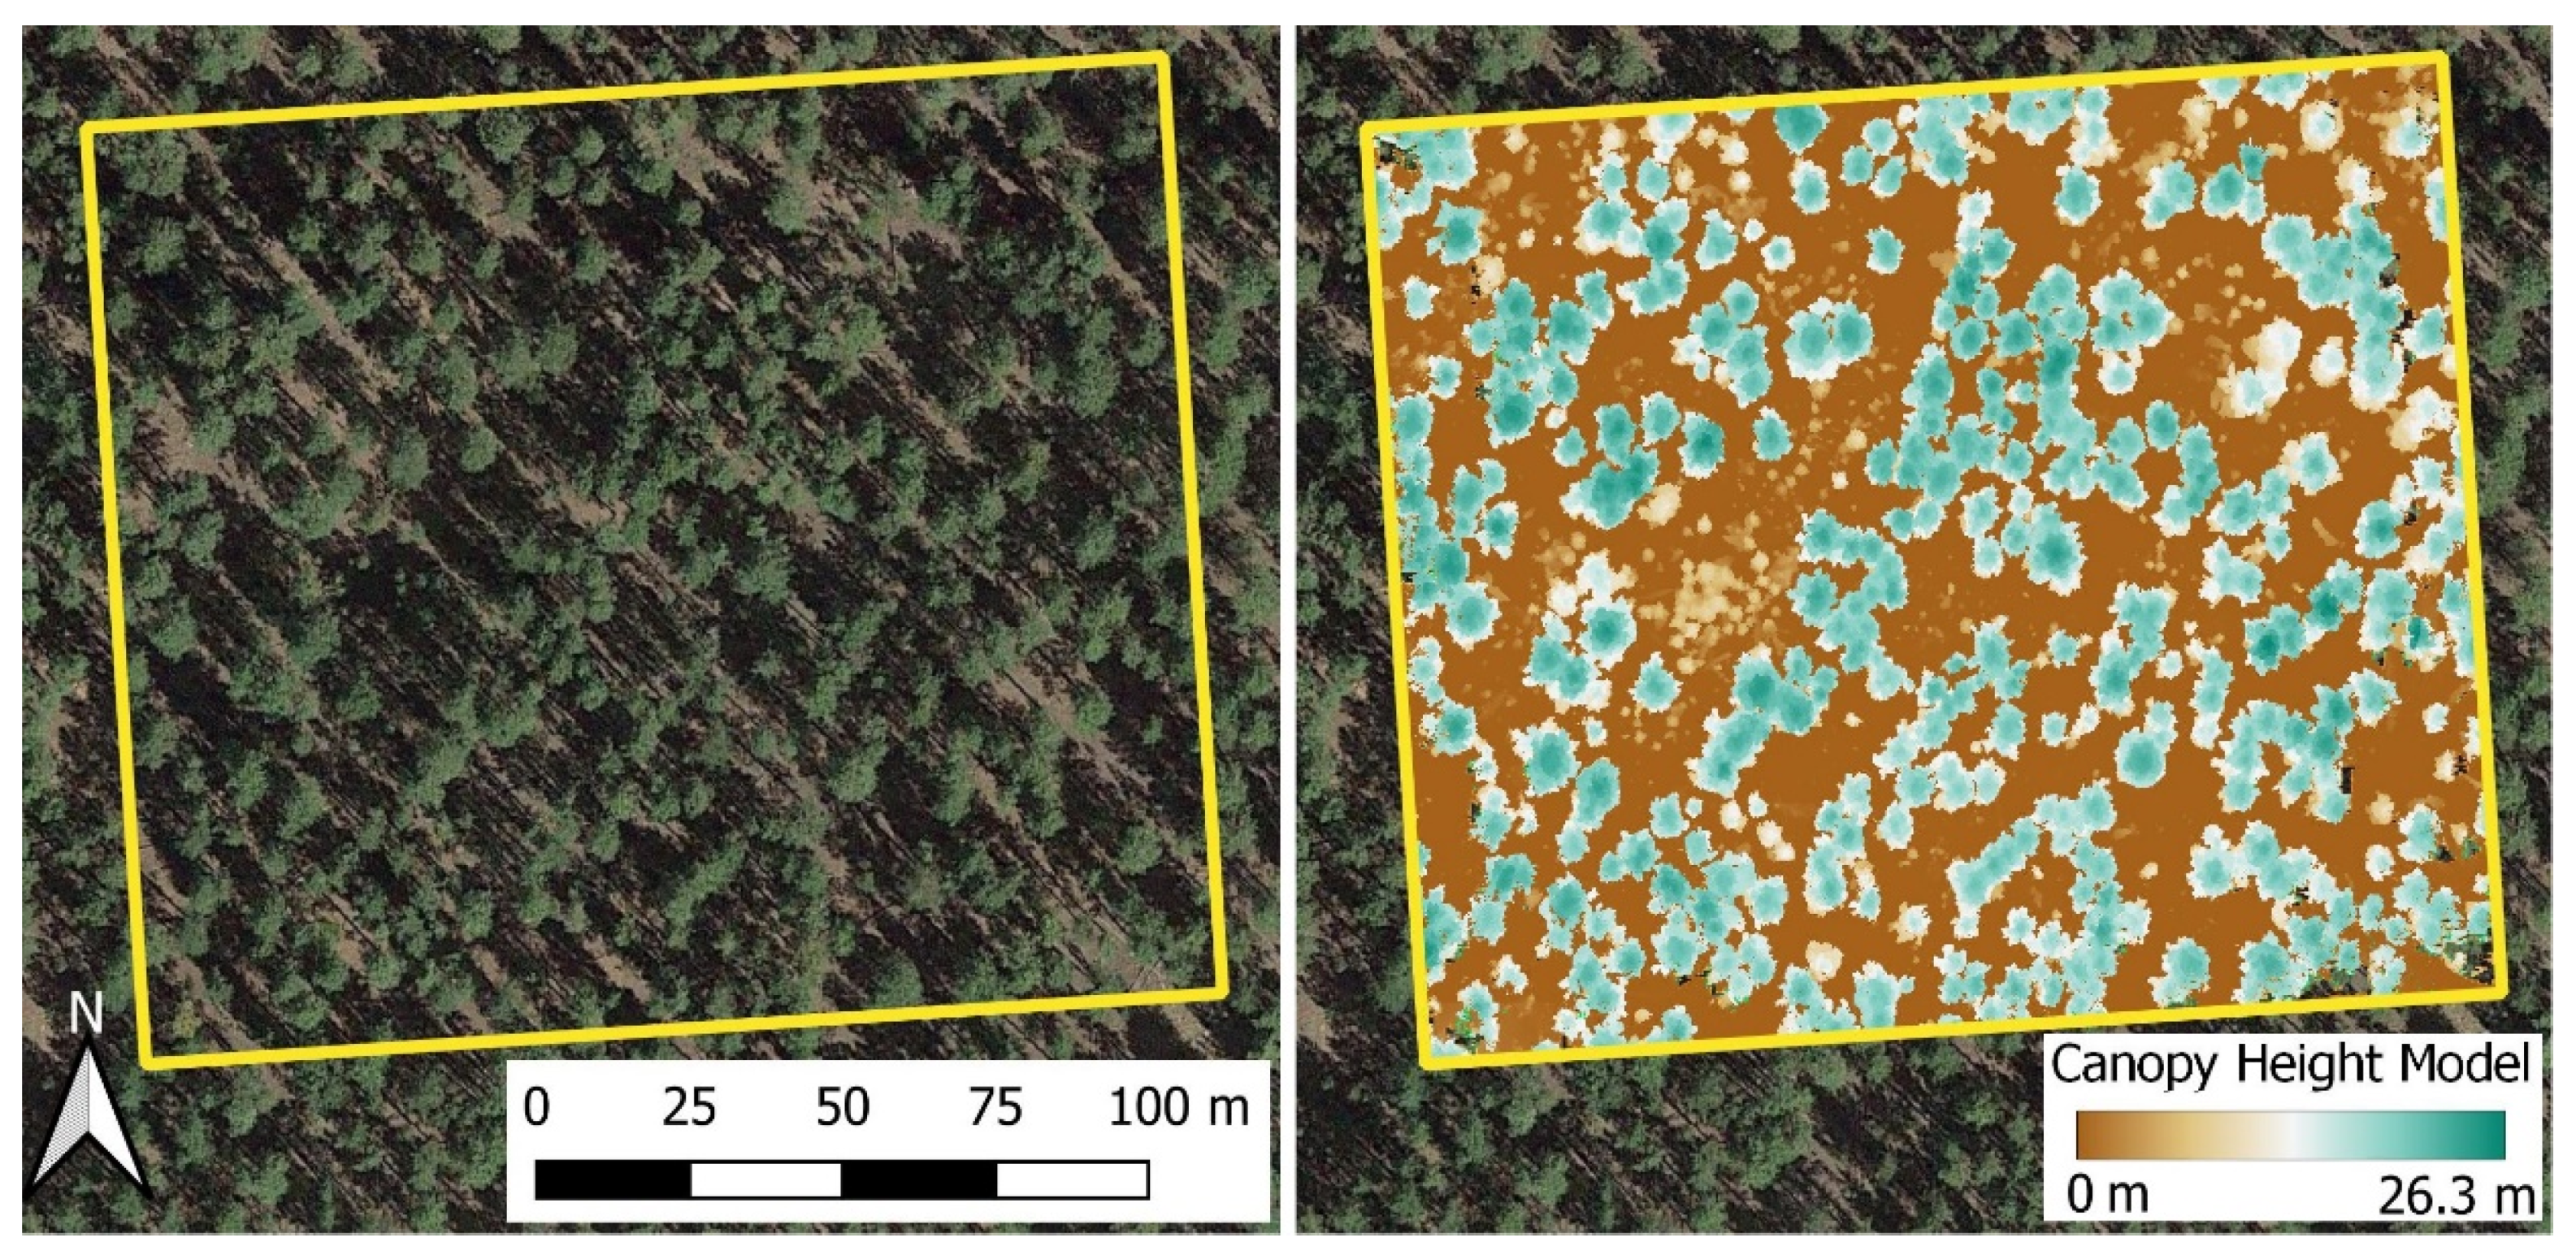
2.1. Study Area and Field Data

The study occurred at the Manitou Experimental Forest, part of the Pike-San Isabel National Forest in Colorado, United States. We collected data in a ponderosa pine-dominated stand that has not seen significant disturbance since selective logging in the 1880s (Figure 1). Stand development saw a minor mountain pine beetle (Dendroctonus ponderosae Hopkins) outbreak in the 1970s, resulting in a multi-aged stand structure. Subsequent regeneration and increases in canopy cover have allowed a minor component of Douglas-fir (Pseudotsuga menziesii (Mirb.) Franco var. glauca (Beissn.) Franco) and blue spruce (Picea pungens Engelm.) to become established in the understory. The 4 hectare study area was stem mapped to collect the location, DBH, and total height of all trees >1.37 m tall in July 2018. Tree locations were determined based on distance and azimuth to a previously established grid of monuments. The stand was 99.9% ponderosa pine by basal area with a Dq of 21.8 cm and a density of 457 trees ha−1 and 17 m2 ha−1. Tree sizes tended to center around an understory canopy stratum of 340 trees ha−1 with a Dq of 8.2 cm and an average height of 4.1 m, and an overstory canopy stratum of 117 trees ha−1 with a Dq of 40.6 cm and an average height of 19.6 m.

2.2. UAV Data Acquisition and Processing

UAV imagery was collected using a DJI Phantom 4 Pro (Dá-Jiang Innovations Science and Technology Co. Ltd., Shenzhen, China) equipped with a 20 megapixel metal oxide semiconductor red-green-blue camera at a fixed 8.8 mm focal length. Flight planning and control used Altizure version 4.6.8.193 (Everest Innovation Technology Limited, Shenzhen, China) for Apple IOS, to pre-program the UAV serpentine flight paths. The UAV acquisition happened in August 2019 at a speed of 4 m s−1 and an altitude of 90 m above ground level, using a nadir camera orientation, with 90% forward and side image overlap. The camera was set to infinite focus, 5.6 aperture, and 1/500 s shutter speed for image acquisition. Photos were captured and geotagged to a manufacturer-stated vertical and horizontal accuracy of ±0.5 m and ±1.5 m, respectively.
The UAV imagery was processed in Agisoft Metashape (Agisoft LLC, St. Petersburg, Russia) using the routine outlined by Tinkham and Swayze [21] to produce an SfM point cloud for optimized tree detection. The SfM-derived point cloud was filtered to identify ground points, to create a 0.1 m digital terrain model using the lidR package [22] in the R statistical programming language [23]. The digital terrain model was used to height normalize the point cloud and derive a canopy height model (CHM) at 0.1 m resolution (Figure 1). All Metashape processing parameters are available in Supplementary Material Table S1.

2.3. UAV Tree Parameter Extraction

Extraction of individual tree parameters from the UAV SfM dataset followed Swayze and Tinkham [24]. The CHM was scanned using a variable window filter from the R ForestTools package [25] to detect tree locations and heights by applying Equation (1):
Window Radius = CHM × 0.1
where Window Radius and CHM values are in meters. The function iteratively evaluates each pixel in the CHM, to determine if the pixel is the tallest location in the window radius. The pixel considered the tallest location in the search window is classified as a detected tree. The tree is assigned the pixel’s value and centroid as its height and location, respectively.
The detected location of each tree is passed to the marker-controlled watershed function of the R ForestTools package, to delineate individual tree crown extents. This function works from the assigned top-of-canopy locations down through lower CHM values, adding pixels to a tree’s crown extent until either a minimum pixel height value is reached (i.e., 1.37 m) or pixel values increase toward another identified tree location. This approach to crown delineation produces more natural-appearing crown shapes compared to other algorithms in ponderosa pine forests [15]. This processing results in a dataset linking unique tree identifiers with tree location, height, and polygons of crown extent.
Local competition metrics, including the distance to the nearest neighbor, trees ha−1 within a 5 m radius, and the relative tree height within a 5 m radius, were calculated for each tree and used in the subsequent DBH modeling. A 5 m radius was selected as it represents a distance slightly less than the point at which two mature ponderosa pine trees in the region would begin to have interlocking crowns, representing a proxy for direct competition. The relative tree height within a 5 m radius was estimated using Equation (2):
Relative Height = Height/HeightMax × 100
where Height is the height of the subject tree and HeightMax is the height of the tallest tree within a 5 m radius of the subject tree.
We used each crown polygon to extract a tree-level point cloud, to detect individual tree DBH values following the steps detailed by Swayze and Tinkham [24]. A slice of the point cloud from 1.2 m to 1.4 m was extracted and compressed to a single height of 1.3 m. The rest of the DBH detection process was completed using the R TreeLS package [26]. The compressed point cloud slice was rasterized and evaluated using a Hough Transform circle search algorithm to identify candidate DBH locations with a sufficient point density. Although rare, the process could identify more than one circular object (or candidate DBH) within a single crown’s area. A least-squares circle fitting algorithm was used on the point cloud slice at each candidate DBH location to estimate DBH. The candidate DBHs that successfully fit a circle resulted in a dataset of one or more stem location, and the DBH values aligned with each SfM tree height.

2.4. Matching of Tree Observations

We filtered the SfM dataset of tree crown locations with heights and one or more potential DBH values following methods adapted from Swayze et al. [14]. This filtering used local Forest Inventory and Analysis (FIA) data [27] from the study region to develop Equation (3) as a model representing the regional height to DBH relationship. This model used FIA data from Colorado with greater than 70% ponderosa pine by basal area, densities exceeding 10 m2 ha−1 basal area represented untreated conditions, and site indices within 3 m of the study site’s estimated site index of 22 m at a base age of 100 years were used to maintain a similar height to DBH relationship. Based on the results from Swayze et al. [14], the model was fit as a second order polynomial using the stats R package [23]. Subsequently, Equation (3) was applied to predict a regionally expected DBH value for each tree height. For trees with multiple SfM-derived DBH values, we compared each estimate to the predictions from Equation (3) and retained the SfM-derived DBH with the smallest error. At this point, an unfiltered version of the one-to-one matched SfM height and DBH values was set aside, while another version was filtered against the 90th percentile prediction bounds of Equation (3). If a SfM-derived DBH was outside these bounds, we removed it from the dataset used for further analysis. This process resulted in a dataset with the height for all identified trees and a subset of DBH values meeting regional observations of tree growth form.
DBH (cm) = 1.6121 × Height (m) + Height (m) 0.0276
The SfM extracted tree locations were spatially matched with the stem mapped trees through an iterative selection process. Whereby the height difference between the stem mapped tree and all SfM identified trees within a 4 m buffer was assessed. If the minimum height difference within the radius was less than 4 m, the stem map and SfM tree were considered True Positive matches and removed from further matching. If the minimum height error exceeded 4 m, the stem map tree was considered a False Negative, and the candidate SfM trees went through further matching. After classifying all stem map trees as True Positive or False Negative, we classified any unmatched SfM trees as False Positives. We then calculated the True Positive, False Positive, and False Negative tree extraction rates and an F-score (Equation (4)), which provides a single metric of overall tree extraction success at matching the stem map.
F - score = 2 × ( True   Positive True   Positive   +   False   Negative × True   Positive True   Positive   +   False   Positive ) ( True   Positive True   Positive   +   False   Negative + True   Positive True   Positive   +   False   Positive )

2.5. DBH Model Fitting and Evaluation

We developed five different models using the SfM extracted height, crown area, and competition metrics as independent variables, and the SfM-derived DBH before and after filtering as dependent variables, resulting in a total of 10 unique predictive models. Prior to model development, all variables were tested for collinearity, with no variables exceeding r = 0.34. The first model was a simple linear model relating SfM extracted tree height to SfM DBH (Equation (5)). Then three non-linear models used combinations of UAV height, crown area, and trees ha−1, including a polynomial (Equation (6)) and two multiple non-linear models (Equations (7) and (8)). The multiple non-linear model forms followed the equations proposed by Cao et al. [20]. A multiple linear regression model was fit with UAV tree height, crown area, and competition metrics as independent variables (Equation (9)). The full model was reduced by identifying the variable subset, minimizing the Akaike Information Criterion through stepwise selection. All models were fit using the R stats package [23].
DBH = b1 + b2 × Height
DBH = b1 + b2 × Height + b3 × Height2
DBH = b1 + Heightb2 + TPHb3
DBH = b1 + Heightb2 + Crown Areab3 + TPHb4
DBH = b1 + b2 × Height + b3 × Crown Area + b4 × Relative Height + b5 × TPH + b6 × Min Neighbor Distance
In Equation (4) through Equation (8), Height is the UAV extracted tree height in meters, Crown Area is the UAV extracted crown area in square meters, TPH is the tree ha−1 of UAV identified trees within a 5 m radius of the target tree, Relative Height is the height of the target UAV tree divided by the tallest neighboring tree within a 5 m radius times 100, and Min Neighbor Distance is the horizontal distance in meters between the target UAV tree and the closest other UAV tree.
For each model developed, we then predicted the unknown DBH values based on the SfM derived parameters and produced summaries of tree- and stand-level accuracy. The True Positive tree matches were used to determine the mean error (ME), mean absolute error (MAE), and mean absolute percent error (MAPE) of the predicted DBH values. Stand scale basal area and Dq were also summarized and compared to the stem map observations. The tree level metrics were also summarized across 5 cm diameter classes for the model providing the best tree and stand level predictions.

3. Results

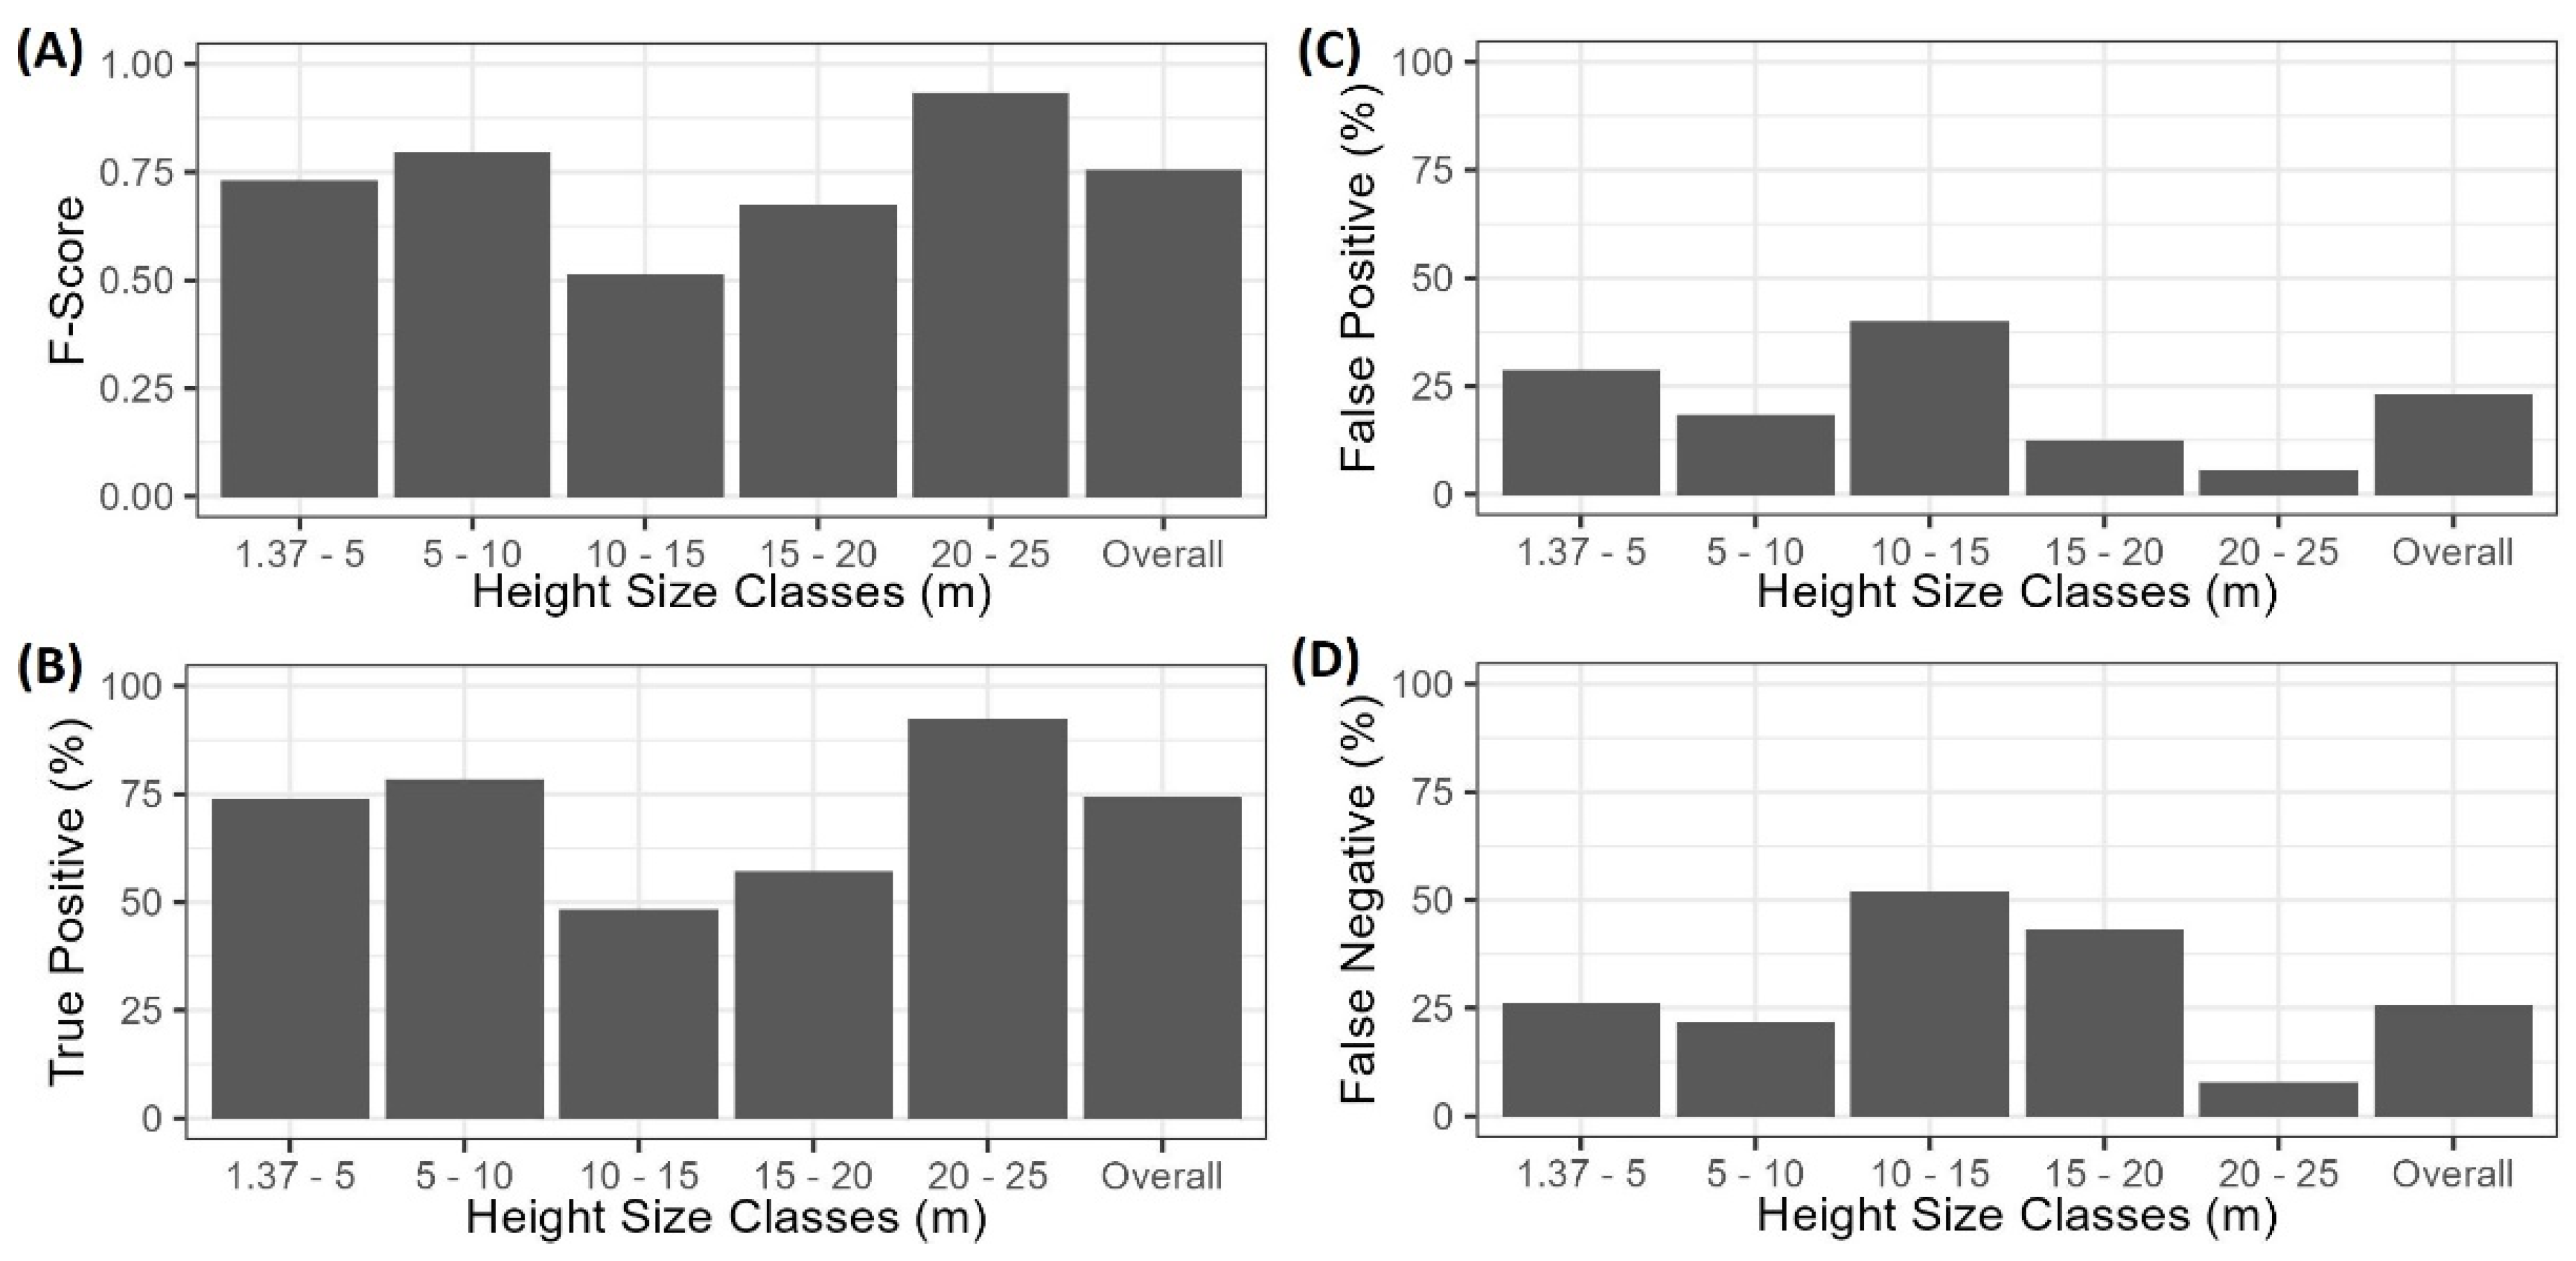
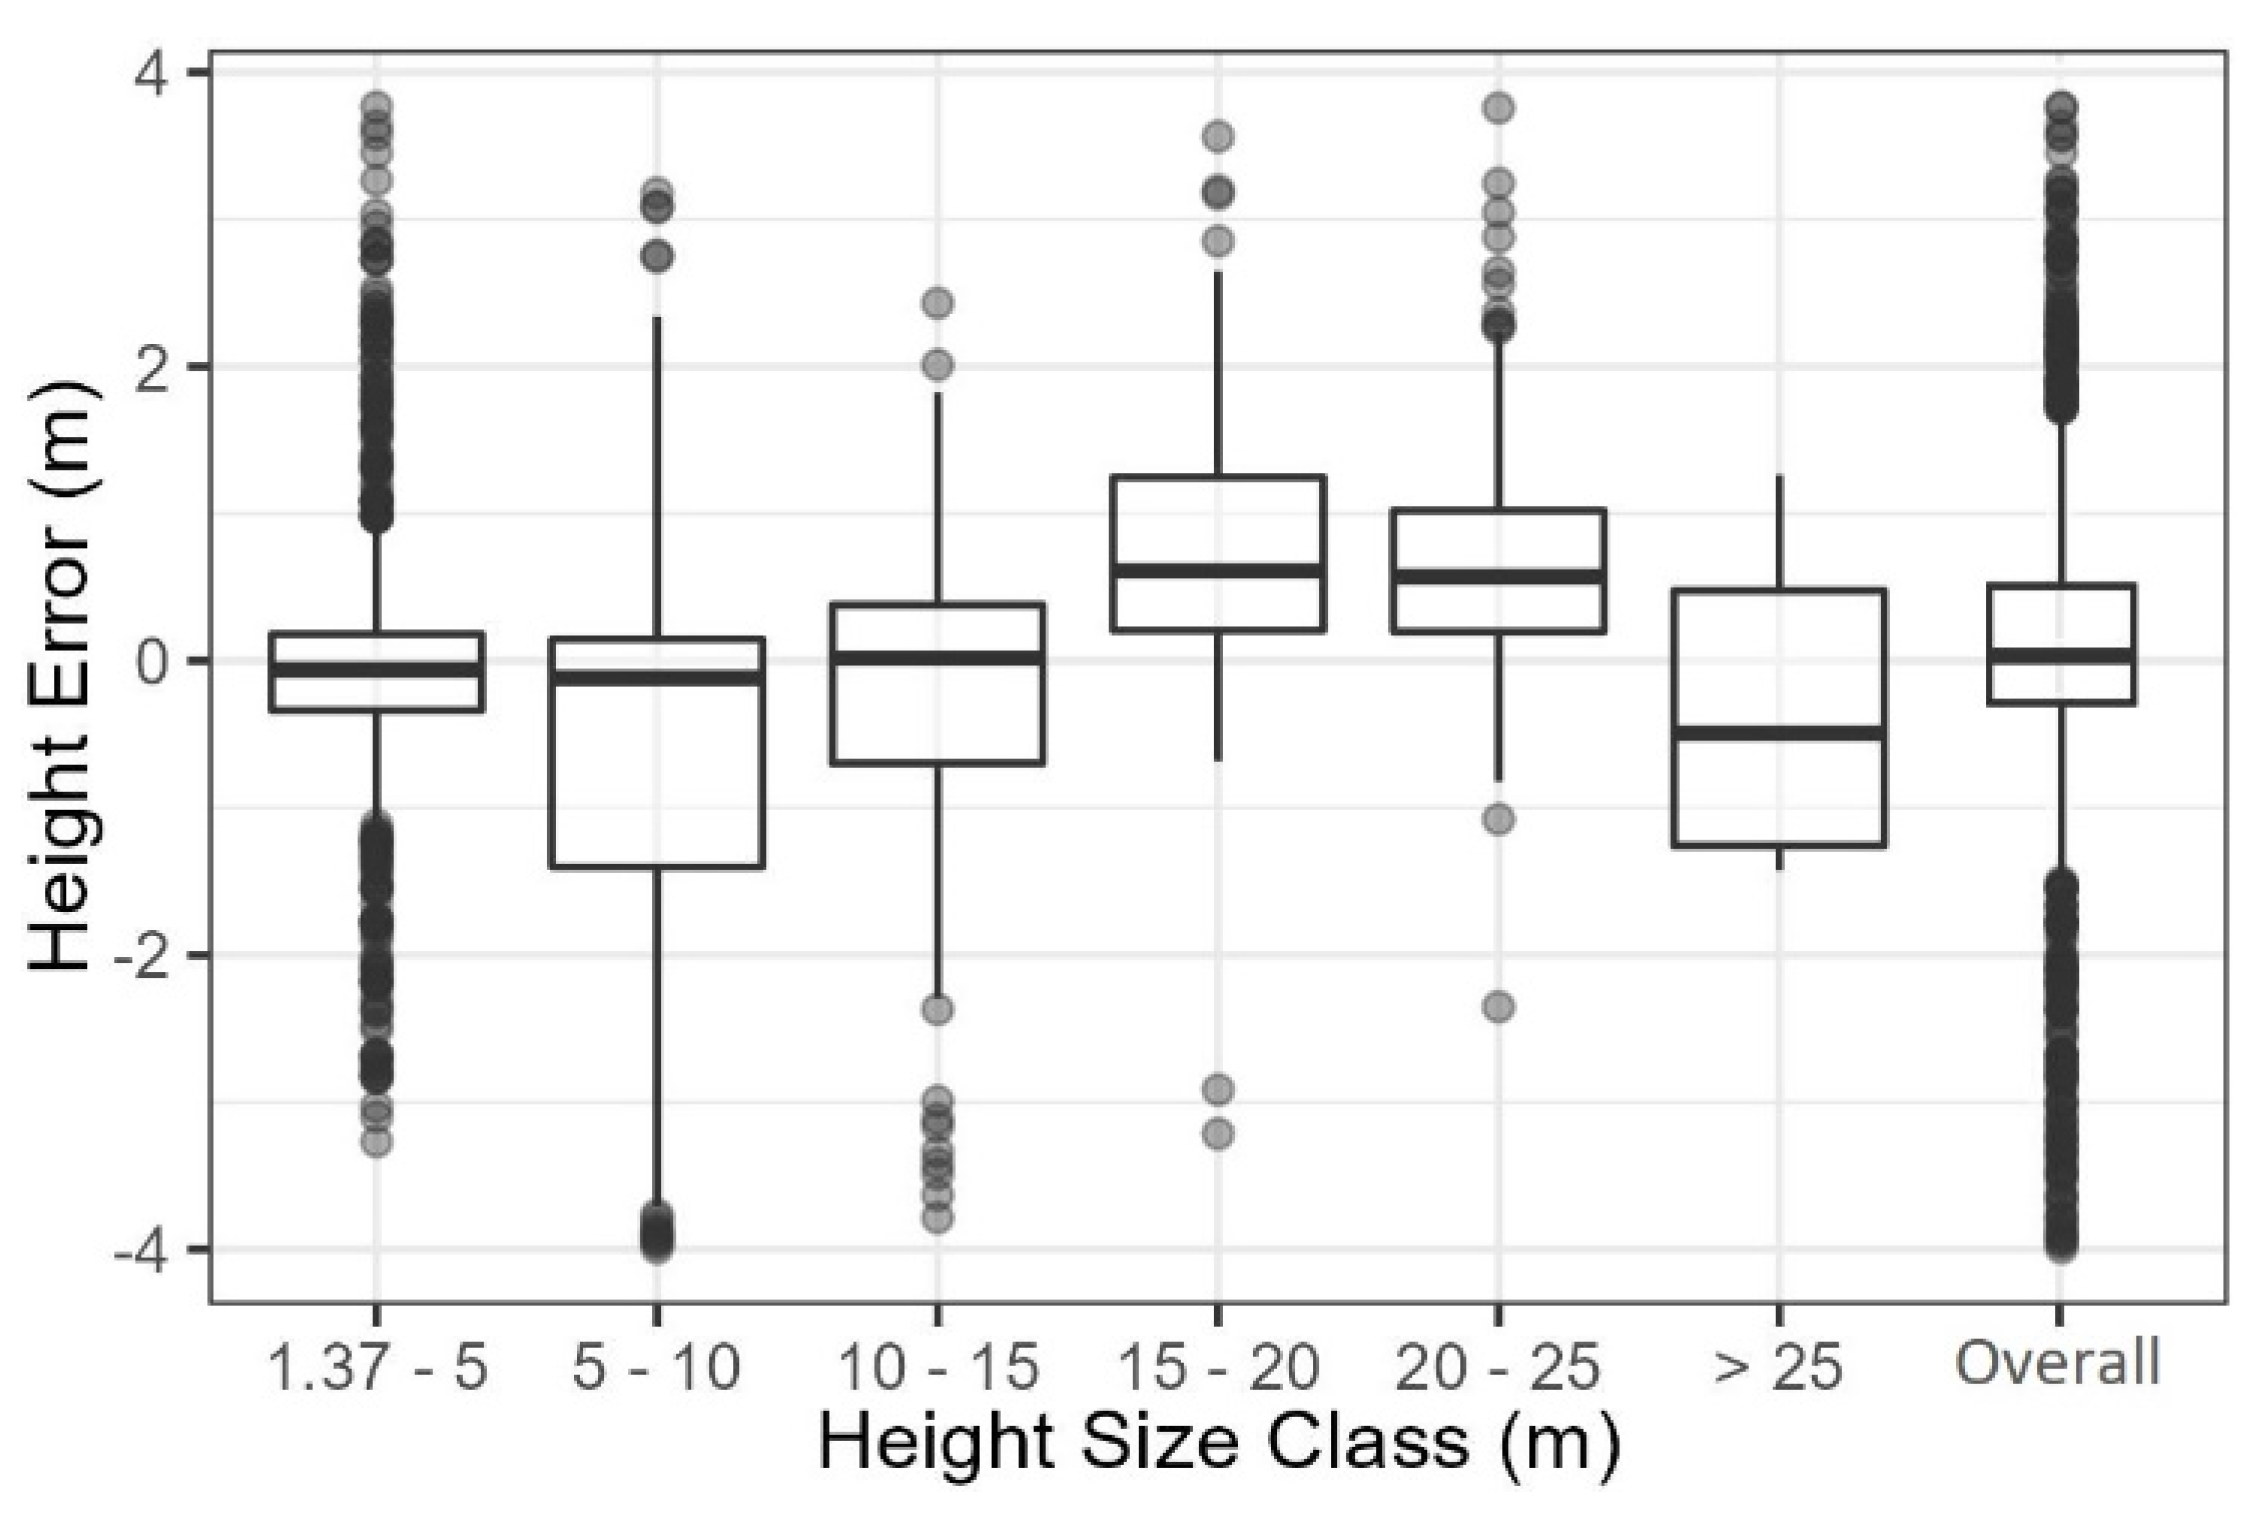
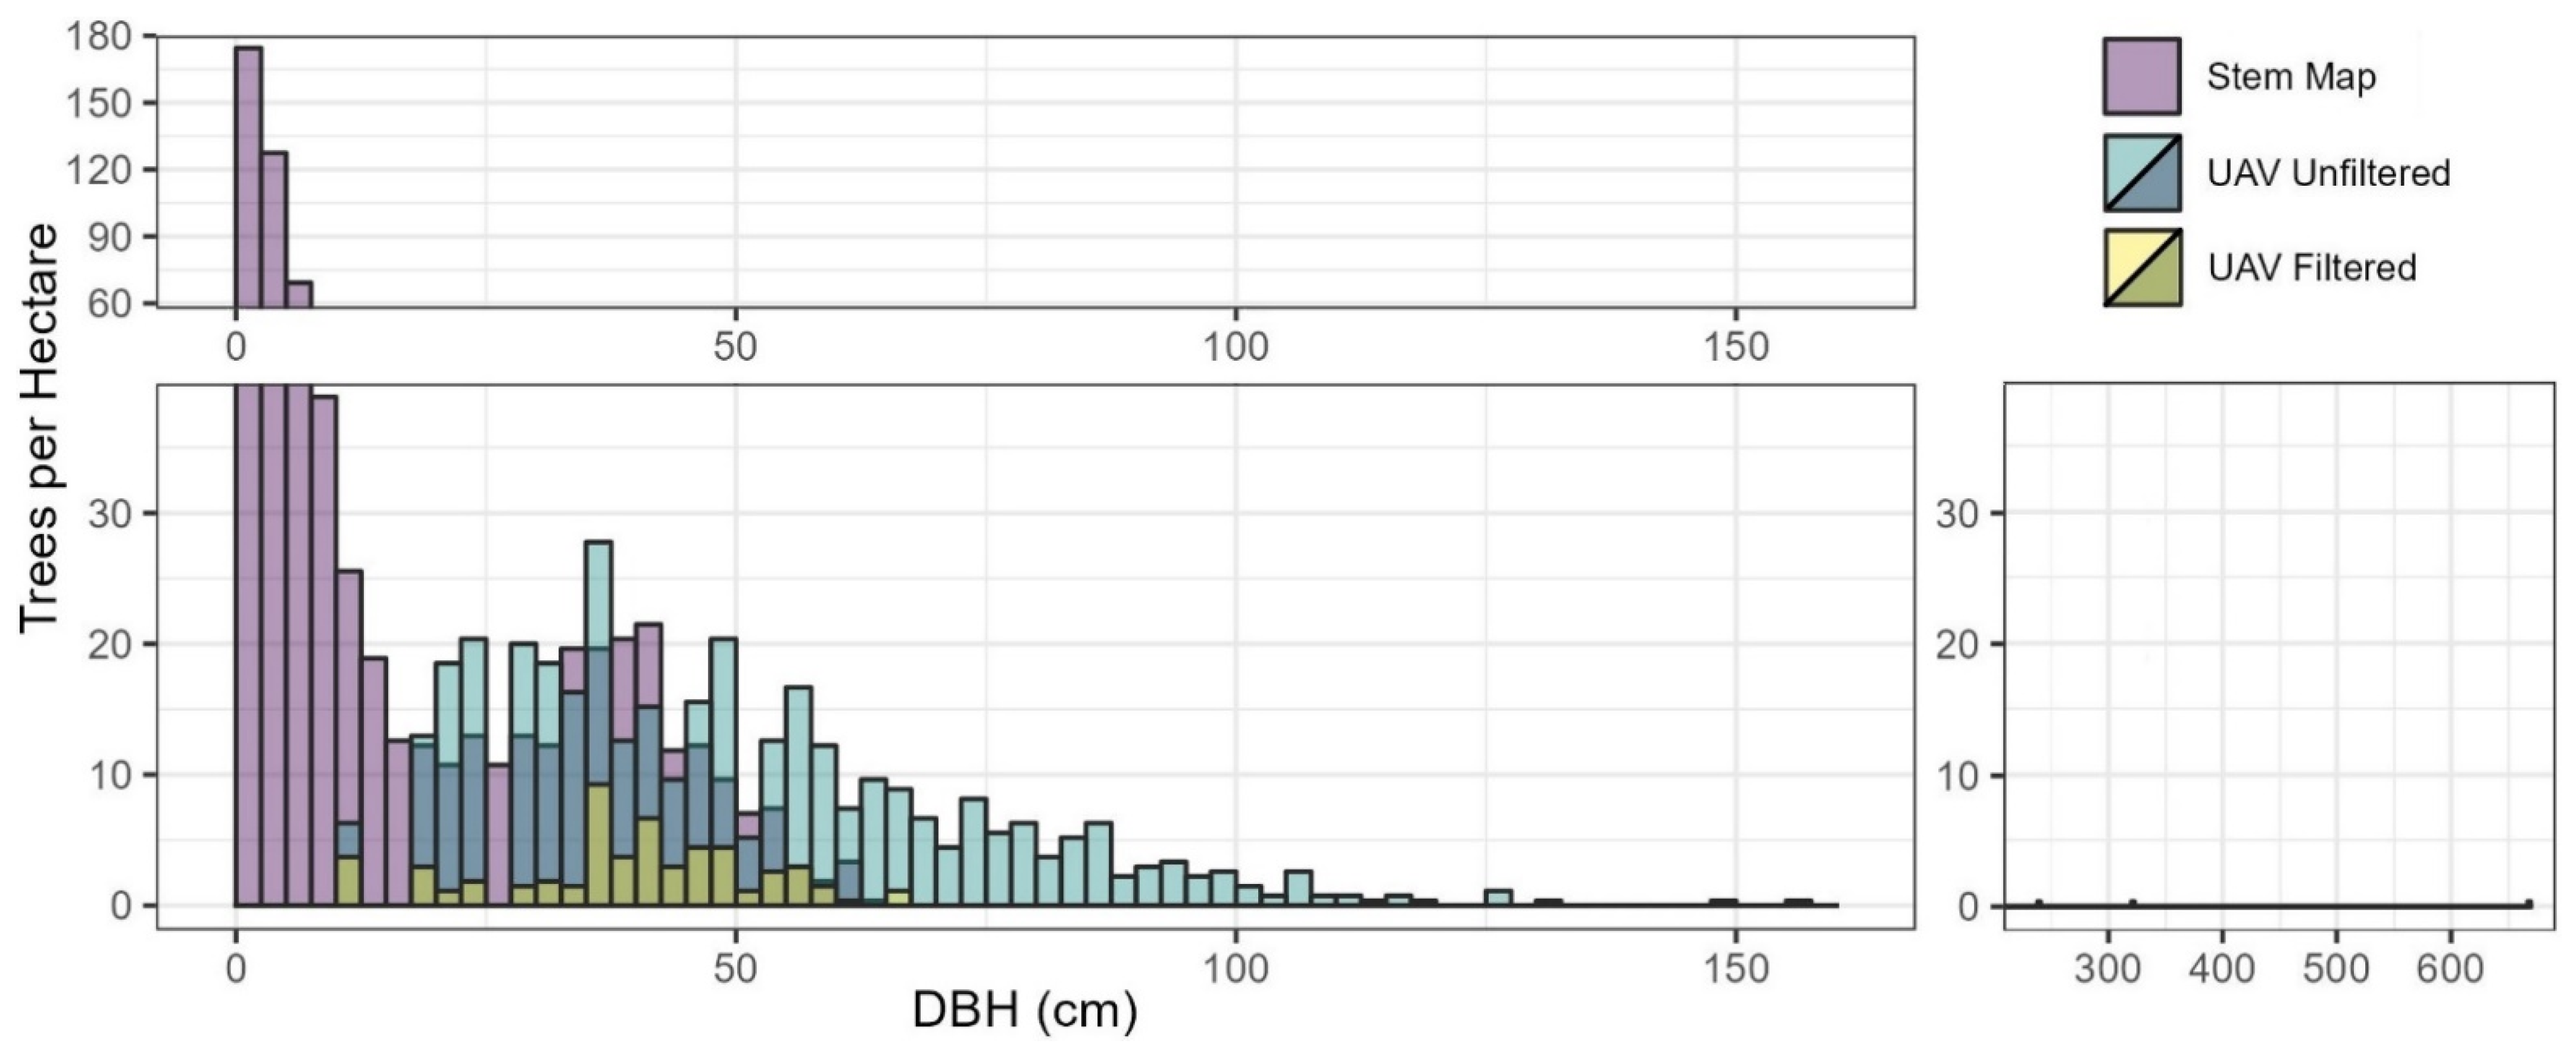
3.1. Tree Extraction

Extraction of tree locations and heights from the SfM data resulted in an overall F-Score of 0.74, but this varied across different tree height classes from 0.51 to 0.93 (Figure 2). Tree extraction also resulted in a mixture of False Positive and False Negative rates that varied across height classes. The SfM data extracted 1755 trees across all size classes, representing an underestimation of 3.9% (or 26.7 trees ha−1) compared to the stem map observations (1827 trees). The 1.37–5 m, 5–10 m, and 20–25 m height size classes had the best tree extraction success, missing stem density by 3.3% (8.3 trees ha−1), −4.7% (3 trees ha−1), and −4.1% (2.5 trees ha−1), respectively. Conversely, the worst extraction was in the 10–15 m and 15–20 m height size classes, where the False Negative and False Positive rates were partially offset, resulting in underestimations of 21.2% (5.5 trees ha−1) and 29.5% (15.3 trees ha−1), respectively. Additionally, the overall mean height error was 0.04 m, and ranged from −0.63 m in the 5–10 m height class to 0.76 m in the 15–20 m height class (Figure 3).
Before filtering, the SfM DBH extraction process identified 965 values, representing 52.8% of the mapped trees. Comparison to the stem mapped DBH distribution showed that the unfiltered SfM DBHs accounted for 4.0%, 112.4%, and 261.1% of stem mapped DBHs in the size classes of <20, 20–40, and >40 cm, respectively (Figure 4). Within the largest DBH size class, the unfiltered DBH values had a range greater than five times the stem mapped values.
Filtering the SfM extracted DBH values with the regional FIA model prediction bounds resulted in a dataset of 150 DBHs (Figure 4). The filtered DBHs represented 8.2% of all stem mapped trees. The proportion of retained trees following filtering was not well balanced across DBH classes, with 1.4%, 17.4%, and 36.0% of stems retained in the <20 cm, 20–40 cm, and >40 cm classes, respectively. The DBH extraction process did not identify any tree with a diameter less than 12.5 cm, although approximately two-thirds of the stem mapped trees had a DBH below this value (Figure 4).

3.2. DBH Model Prediction Performance

Using the unfiltered SfM extracted DBH values (n = 965), only the simple linear and multiple linear models could be resolved, resulting in model standard errors exceeding 31 cm (Table 1). Applying the three fit model forms to predict the missing DBH values resulted in a positive bias, with mean errors exceeding 34 cm and mean absolute percentage errors exceeding 1100% (Table 2). Integrating the predictions from these three models produced an average overestimation error of 415% for the stand basal area and 131% for Dq.
Development of DBH predictive models using the SfM DBH observations after filtering with the FIA prediction bounds (n = 150) produced models that had greater correlations (i.e., R2) and reduced the model standard error by 80% compared to those developed with the unfiltered SfM DBHs (Table 1). Additionally, all model forms were successfully fit to the dataset, although the polynomial and non-linear models each contained one non-significant (α = 0.10) parameter. Applying the five models developed from the filtered SfM DBHs to predict the missing DBH values resulted in an average mean error of 6.5 cm, which translates to an average mean absolute percentage error of 237% (Table 2). When summarized at the stand scale, predictions from the filtered SfM DBH models overestimated the basal area on average by 4.4 m2 ha−1 (17.4%) and Dq by 2.3 cm (10.5%).
Although the simple linear form provided the worst model fit diagnostics of those developed from the filtered SfM DBHs (Table 1), it resulted in the best predictive model for both tree and stand level summarizations (Table 2). This simple linear model had an overall positive bias at 5.6 cm and an absolute error of 6.8 cm (or 193%), but the accuracy and precision varied across the DBH size classes (Table 3). The model’s predictive accuracy transitioned from overestimating the smallest DBH size classes to underestimating the largest size class (Figure 5). The relative precision across the size classes ranged from 383% in the smallest size class (or 7.7 cm) to 7–15% in the three largest size classes (or 3–9 cm; Table 3). The greatest individual tree errors were associated with underprediction and occurred in cases where trees were associated with broken tops and thus had a relatively small height relative to their DBH (Figure 5).

4. Discussion

4.1. UAV Extracted Trees and DBH Filtering

This study’s SfM tree extraction using the variable window filter estimated stand density at 731.3 tree ha−1, an underestimation of 26.7 tree ha−1 (or 3.9%) compared to the stem map. This relatively low error level is in line with Hao et al. [29], who achieved a mean error of 24 tree ha−1 in a young plantation of conifer trees. Our accuracy is also a substantial improvement over Belmonte et al. [30], who underestimated stand density by ~48% in a similar unmanaged ponderosa pine forest, when applying a pointwise tree segmentation technique [31]. Additionally, the heights for the SfM extracted trees provided an unbiased representation of the stem mapped values, providing similar height precision and accuracy as other UAV 3-dimensional remote sensing studies [15,32].
Before data filtering, the detected SfM DBH values produced a robust (n = 965) but biased sample, with DBH values exceeding the maximum field observed DBH by five times. Of the detected DBH values, 25% were greater than the largest stem mapped DBH value (Figure 4). Filtering the detected DBH values with the FIA height to DBH model prediction bounds removed over 800 observations, with the remaining DBH values (n = 150) conforming to the regional allometry. However, limited sample values less than 20 cm DBH were identified, including no values below 12.5 cm (Figure 4).

4.2. DBH Model Fitting and Prediction

Filtering the SfM DBH values substantially improved the model fit and prediction statistics. Before filtering, all models had intercept values exceeding 40 cm. However, models built from the filtered SfM DBHs produced intercept terms from 5.7 to 11.6 cm. While intercept values of this size are still unrealistic for trees with total heights under 2 m, they represent a substantial improvement in the sample data’s ability to represent the biological relationship between height and DBH.
All but one of the stand basal area predictions made using the filtered SfM DBH models resulted in an estimate within 20% of the stem mapped value. This accuracy indicates a strong potential to meet the common forest inventory design standard of an allowable error of ±20% basal area at a 95% confidence level [33]. The two best-performing models (simple linear and non-linear including trees ha−1) overestimated stand basal area by 13.1 and 14.7%, falling well within the United States Department of Agriculture Forest Service’s precision standard. Additionally, when only looking at the basal area of trees greater than 12 cm DBH (regional threshold for overstory sampling), this over estimation was reduced to 6.8% for the best model. Our basal area precision is in line with that achieved by Dalla Corte et al. [34] in eucalypt plantations in Brazil of an 5.9 to 14.5% underestimation when using height to DBH relationships developed from field observations.
Predictions of Dq from the models fit using the filtered SfM DBH values were all overestimated by less than 2.7 cm, with the two best models overestimating the stem map Dq by 1.8 and 2.0 cm (8.3 and 9.2%). Our Dq accuracies were similar to those achieved by Sačkov et al. [35] of 6.9% from airborne LiDAR extracted trees when applying a height to DBH model created from field observations. Additionally, our best-derived Dq values aligned with those achieved through terrestrial LiDAR scanning samples of 1.96 cm in a mixed conifer forest in Yunnan Province, China [36].
This study demonstrates the potential of UAV monitoring in conifer forests with less than 60% canopy cover, to provide near census level tree lists of reliable height and DBH values, representing a step towards precision forest management. These techniques provide the ability to, not only reliably estimate stand metrics such as trees ha−1, basal area, and Dq, but the added benefit of being able to summarize the spatial arrangement of trees presents unique opportunities for silvicultural prescription development. Having a spatial representation of tree size class distributions should facilitate the spatial objectives often sought during the restoration of ponderosa pine-dominated forests [37,38,39].

4.3. DBH Modeling Limitations

The probability of detecting a DBH from a three-dimensional point cloud requires an adequate density of points in the data slice used for circle fitting. This process is likely to be limited in areas of increased canopy cover or where tree crowns extend close enough to the ground to occlude the targeted stem section [14]. These limitations likely contributed to our small sample size of trees with DBHs less than 20 cm (Figure 4) and potentially were the root cause of the errors associated with small trees. Additionally, the increased spread (or residuals) of predicted DBHs greater than 40 cm compared with the stem map values (Figure 5) indicates that the best predicting model failed to account for covariates driving variation in this portion of the population. One potential driver of this is that the 59 DBHs greater than 40 cm detected and retained after filtering failed to represent how covariables such as stand density and crown area might explain variations in DBH for trees at the upper end of the height sigmoidal curve for the stand.
Multiple strategies exist to improve the representativeness of the sample DBH dataset for model development. Increasing the UAV flight extent will likely increase the sample size across DBH size classes, capturing a greater range of tree growing conditions. With a larger sample size available, the authors theorize that the height to DBH model forms that consider covariates may improve the model prediction for mid and large size trees, where stand density is known to impact the height to DBH relationships [40]. Targeting other data sources could also increase sample representativeness and fill data voids such as those in the under 20 cm DBH class. Terrestrial LiDAR or SfM sampling could augment the smallest DBH size classes, with recent advances in these techniques achieving DBH mean errors of less than 2 cm [41,42,43]. Adding targeted field samples to the model development dataset could also fill these data voids. Better capturing the height to DBH relationship in the smallest trees would likely shift the model intercept closer to zero and improve the relative prediction accuracy for these trees. While this study presents a potential pathway for using remotely sensed DBH values to predict missing DBHs, it also highlights potential challenges in ensuring the model development dataset is representative of the population. As similar techniques for creating near census level tree lists of height and DBH are proposed and tested, it will be necessary to ensure that these techniques are robust to variations in site productivity and forest composition.

5. Conclusions

This study demonstrates a potential methodology for taking remotely sensed samples of DBH values and using them to model site-specific height to DBH relationships. This strategy appears capable of providing near census level inventories of tree locations, heights, and DBHs. Having such intensive inventory data of forest stands supports improved forest management outcomes, as managers will be able to explicitly prescribe treatments at the tree level. To fully realize a future of remote sensing assisted intensive forest inventories, it will be necessary to ensure these methods are transferable and reliable across a range of forest productivities and species compositions.

Supplementary Materials

The following supporting information can be downloaded at: https://www.mdpi.com/article/10.3390/f13122077/s1, Table S1: Metashape setting for UAV structure from motion processing in the Align Photos, Optimized Alignment, and Build Dense Cloud steps.

Author Contributions

Conceptualization W.T.T.; methodology W.T.T., N.C.S. and C.M.H.; data collection N.C.S. and W.T.T.; data processing N.C.S.; formal analysis W.T.T. and L.E.L.; resources W.T.T. and M.A.B.; writing—original draft preparation W.T.T.; writing—review and editing C.M.H., M.A.B., L.E.L. and N.C.S.; funding acquisition M.A.B. and W.T.T. All authors have read and agreed to the published version of the manuscript.

Funding

This research was funded by the USDA National Institute of Food and Agriculture (2022-67021-37857), USDA Hatch (COL00401) program, and USDA Rocky Mountain Research Station Joint Venture Agreement (20-JV-11221633-140). This research was supported by the USDA Forest Service, Rocky Mountain Research Station. The findings and conclusions in this publication are those of the authors and should not be construed to represent any official USDA or U.S. Government determination or policy.

Institutional Review Board Statement

Not applicable.

Informed Consent Statement

Not applicable.

Data Availability Statement

The data presented in this study are available on request from the corresponding author.

Acknowledgments

We would like to thank Paula Fornwalt and Steven Ault for their support while this project was conducted at the United States Department of Agriculture Forest Service, Manitou Experimental Forest.

Conflicts of Interest

The authors declare no conflict of interest.

References

  1. Wurtzebach, Z.; DeRose, R.J.; Bush, R.R.; Goeking, S.A.; Healey, S.; Menlove, J.; Pelz, K.A.; Schultz, C.; Shaw, J.D.; Witt, C. Supporting National Forest System Planning with Forest Inventory and Analysis Data. J. For. 2019, 118, 289–306. [Google Scholar] [CrossRef]
  2. Burkhart, H.E.; Avery, T.E.; Bullock, B.P. Forest Measurements, 6th ed.; Waveland Press Inc.: Long Grove, IL, USA, 2018; p. 434. [Google Scholar]
  3. Tinkham, W.T.; Hoffman, C.M.; Ex, S.; Smith, A.M.S. Sensitivity of crown fire modeling to inventory parameter dubbing in FVS. In Proceedings of the 2017 Forest Vegetation Simulator (FVS) e-Conference; U.S. Department of Agriculture, Forest Service, Southern Research Station: Asheville, NC, USA, 2017; pp. 114–123, General Technical Report, SRS-eGTR-224. [Google Scholar]
  4. Weiskittle, A.R.; Hann, D.W.; Kershaw, J.A., Jr.; Vanclay, J.K. Forest Growth and Yield Modeling; Wiley-Blackwell: Chicester, UK, 2011; p. 424. [Google Scholar]
  5. Roxburch, S.H.; Paul, K.I.; Clifford, D.; England, J.R.; Raison, R.J. Guidelines for constructing allometric models for the prediction of woody biomass: How many individuals to harvest? Ecosphere 2015, 6, 38. [Google Scholar] [CrossRef] [Green Version]
  6. Johnson, J.B.; Omland, K.S. Model selection in ecology and evolution. Trends Ecol. Evol. 2004, 19, 101–108. [Google Scholar] [CrossRef]
  7. Nilsson, M. Estimation of tree heights and stand volume using an airborne lidar system. Remote Sens. Environ. 1996, 56, 1–7. [Google Scholar] [CrossRef]
  8. Popescu, S.C.; Wynne, R.H. Seeing the trees in the forest. Photogram. Engine. Remote Sens. 2004, 70, 589–604. [Google Scholar] [CrossRef] [Green Version]
  9. Hudak, A.T.; Crookston, N.L.; Evans, J.S.; Falkowski, M.J.; Smith, A.M.S.; Gessler, P.E.; Morgan, P. Regression modeling and mapping of coniferous forest basal area and tree density from discrete-return lidar and multispectral satellite data. Can. J. Remote Sens. 2006, 32, 126–138. [Google Scholar] [CrossRef]
  10. Falkowski, M.J.; Smith, A.M.S.; Hudak, A.T.; Gessler, P.E.; Vierling, L.A.; Crookston, N.L. Automated estimation of individual conifer tree height and crown diameter via two-dimensional spatial wavelet analysis of lidar data. Can. J. Remote Sens. 2006, 32, 153–161. [Google Scholar] [CrossRef] [Green Version]
  11. Jeronimo, S.M.A.; Kane, V.; Churchill, D.J.; McGaughey, R.; Franklin, J.F. Applying LiDAR individual tree detection to management of structurally diverse forest landscapes. J. For. 2018, 116, 336–346. [Google Scholar] [CrossRef] [Green Version]
  12. Tinkham, W.T.; Smith, A.M.S.; Affleck, D.L.R.; Saralecos, J.D.; Falkowski, M.J.; Hoffman, C.M.; Hudak, A.T.; Wulder, M.A. Development of height-volume relationships in second growth Abies grandis for use with aerial LiDAR. Can. J. Remote Sens. 2016, 42, 400–410. [Google Scholar] [CrossRef]
  13. Neuville, R.; Bates, J.S.; Jonard, F. Estimating forest structure from UAV-mounted lidar point cloud using machine learning. Remote Sens. 2021, 13, 352. [Google Scholar] [CrossRef]
  14. Swayze, N.P.; Tinkham, W.T.; Vogeler, J.C.; Hudak, A.T. Influence of flight parameters on UAS-based monitoring of tree height, diameter, and density. Remote Sens. Environ. 2021, 263, 112540. [Google Scholar] [CrossRef]
  15. Creasy, M.B.; Tinkham, W.T.; Hoffman, C.M.; Vogeler, J.C. Potential for individual tree Monitoring in ponderosa pine-dominated forests using unmanned aerial system structure from motion point clouds. Can. J. For. Res. 2021, 51, 1093–1105. [Google Scholar] [CrossRef]
  16. Silva, C.A.; Hudak, A.T.; Vierling, L.A.; Loudermilk, E.L.; O’Brien, J.J.; Hiers, J.K.; Jack, S.B.; Gonzalez-Benecke, C.; Lee, H.; Falkowski, M.J.; et al. Imputation of Individual Longleaf Pine (Pinus palustris Mill.) Tree Attributes from Field and LiDAR Data. Can. J. Remote Sens. 2016, 42, 554–573. [Google Scholar] [CrossRef]
  17. Luo, L.; Zhai, Q.; Su, Y.; Ma, Q.; Kelly, M.; Guo, Q. Simple method for direct crown base height estimation of individual conifer trees using airborne LiDAR data. Opt. Express 2018, 26, A562–A578. [Google Scholar] [CrossRef]
  18. Fritz, A.; Kattenhorn, T.; Koch, B. UAV-based photogrammetric point clouds—Tree stem mapping in open stands in comparison to terrestrial laser scanner point clouds. International Archives of the Photogrammetry. Remote Sens. Spat. Inform. Sci. 2013, XL-1, 141–146. [Google Scholar] [CrossRef] [Green Version]
  19. Kuželka, K.; Slavik, M.; Surovy, P. Very high density point clouds from UAV laser scanning for automatic tree stem detection and direct diameter measurement. Remote Sens. 2020, 12, 1236. [Google Scholar] [CrossRef] [Green Version]
  20. Cao, Q.V.; Dean, T.J. Predicting diameter at breast height from total height and crown length. In Proceedings of the 15th Biennial Southern Silviculture Research Conference; Guldin, J.M., Ed.; e-General Technical Report, SRS-GTR-175; U.S. Department of Agriculture, Forest Service, Southern Research Station: Asheville, NC, USA, 2013. [Google Scholar]
  21. Tinkham, W.T.; Swayze, N.C. Influence of Agisoft Metashape parameters on UAS structure from motion individual tree detection from canopy height models. Forests 2021, 12, 250. [Google Scholar] [CrossRef]
  22. Roussel, J.R.; Auty, D.; Coops, N.C.; Tompalski, P.; Goodbody, T.R.; Meador, A.S.; Bourdon, J.; de Boissieu, F.; Achim, A. lidR: An R Package for Analysis of Airborne Laser Scanning (ALS) Data. Remote Sens. Environ. 2020, 251, 112061. [Google Scholar] [CrossRef]
  23. R Core Team. R: A language and environment for statistical computing. In R Foundation for Statistical Computing; R Core Team: Vienna, Austria, 2021; Available online: https://www.R-project.org/ (accessed on 26 July 2022).
  24. Swayze, N.P.; Tinkham, W.T. Application of Unmanned Aerial System Structure from Motion Point Cloud Detected Tree Heights and Stem Diameters to model missing Diameter values. MethodsX 2022, 9, 101729. [Google Scholar] [CrossRef]
  25. Plowright, A. ForestTools: Analyzing Remotely Sensed Forest Data. R Package Version 0.2.0. 2018. Available online: https://CRAN.R-project.org/package=ForestTools (accessed on 26 July 2022).
  26. Conto, T. TreeLS: Terrestrial Point Cloud Processing of Forest Data. R Package Version 1.0. 2019. Available online: https://CRAN.R-project.org/package=TreeLS (accessed on 26 July 2022).
  27. Tinkham, W.T.; Mahoney, P.R.; Hudak, A.T.; Domke, G.M.; Falkowski, M.J.; Woodall, C.W.; Smith, A.M.S. Applications of the United States Forest Inventory and Analysis dataset: A review and future directions. Can. J. For. Res. 2018, 48, 1251–1268. [Google Scholar] [CrossRef]
  28. Lefcheck, J.S. piecewiseSEM: Piecewise Structural Equation Modeling in R for Ecology, Evolution, and Systematics. Methods Ecol. Evol. 2016, 7, 573–579. [Google Scholar] [CrossRef]
  29. Hao, Z.; Lin, L.; Post, C.J.; Jiang, Y.; Li, M.; Wei, N.; Yu, K. Assessing tree height and density of a young forest using a consumer unmanned aerial vehicle (UAV). New For. 2021, 52, 843–862. [Google Scholar] [CrossRef]
  30. Belmonte, A.; Sankey, T.; Biederman, J.A.; Bradford, J.; Goetz, S.J.; Kolb, T.; Woolley, T. UAV-derived estimates of forest structure to inform ponderosa pine forest restoration. Remote Sens. Ecol. Conserv. 2020, 6, 181–197. [Google Scholar] [CrossRef] [Green Version]
  31. Li, W.; Guo, Q.; Jakubowski, M.; Kelly, M. A new method for segmenting individual trees from the lidar point cloud. Photogramm. Eng. Remote Sens. 2012, 78, 75–84. [Google Scholar] [CrossRef] [Green Version]
  32. Alonzo, M.; Anderson, H.-E.; Morton, D.C.; Cook, B.D. Quantifying boreal forest structure and composition using UAV structure from motion. Forests 2018, 9, 119. [Google Scholar] [CrossRef] [Green Version]
  33. USDA Forest Service. FSVeg Common Stand Exam Users Guide; Chapter 2: Preparation and Design. Version 2.12.6. 2015. Available online: https://www.fs.fed.us/nrm/documents/fsveg/cse_user_guides/userguide_fsveg_ch2_prep-design.docx. (accessed on 27 August 2022).
  34. Dalla Corte, A.P.; da Cunha Neto, E.M.; Rex, F.R.; Souza, D.; Behling, A.; Mohan, M.; Sanquetta, M.N.I.; Silva, C.A.; Klauberg, C.; Sanquetta, C.R.; et al. High-Density UAV-LiDAR in an Integrated Crop-Livestock-Forest System: Sampling Forest Inventory or Forest Inventory Based on Individual Tree Detection (ITD). Drones 2022, 6, 48. [Google Scholar] [CrossRef]
  35. Sačkov, I.; Kulla, L.; Bucha, T. A comparison of two tree detection methods for estimation of forest stand and ecological variables from airborne LiDAR data in central European forests. Remote Sens. 2019, 11, 1431. [Google Scholar] [CrossRef] [Green Version]
  36. Liu, G.; Wang, J.; Dong, P.; Chen, Y.; Liu, Z. Estimating individual tree height and diameter at breast height (DBH) from terrestrial laser scanning (TLS) data at plot level. Forests 2018, 9, 398. [Google Scholar] [CrossRef] [Green Version]
  37. Addington, R.N.; Aplet, G.H.; Battaglia, M.A.; Briggs, J.S.; Brown, P.M.; Cheng, A.S.; Dickinson, Y.A.; Feinstein, J.A.; Pelz, K.A.; Regan, C.M.; et al. Principles and practices for the restoration of ponderosa pine and dry mixed-conifer forests of the Colorado Front Range. In General Technical Report RMRS-GTR-373; U.S. Department of Agriculture, Forest Service, Rocky Mountain Research Station: Fort Collins, CO, USA, 2018. [Google Scholar]
  38. Tinkham, W.T.; Dickinson, Y.; Hoffman, C.M.; Battaglia, M.A.; Ex, S.; Underhill, J. Visualization of heterogeneous forest structures following treatment in the southern Rocky Mountains. In General Technical Report RMRS-GTR-365; U.S. Department of Agriculture, Forest Service, Rocky Mountain Research Station: Fort Collins, CO, USA, 2017. [Google Scholar]
  39. Reynolds, R.T.; Meador, A.J.S.; Youtz, J.A.; Nicolet, T.; Matonis, M.S.; Jackson, P.L.; DeLorenzo, D.G.; Graves, A.D. Restoring composition and structure in Southwestern frequent-fire forests: A science-based framework for improving ecosystem resiliency. In General Technical Report RMRS-GTR-310; U.S. Department of Agriculture, Forest Service, Rocky Mountain Research Station: Fort Collins, CO, USA, 2013. [Google Scholar]
  40. Tinkham, W.T.; Battaglia, M.A.; Hoffman, C.M. Evaluating long-term seedling growth across densities using Nelder plots and Forest Vegetation Simulator (FVS) in the Black Hills, South Dakota, USA. For. Sci. 2021, 67, 380–388. [Google Scholar] [CrossRef]
  41. Bogdanovich, E.; Perez-Priego, O.; El-Madany, T.S.; Guderle, M.; Pacheco-Labrador, J.; Levick, S.R.; Moreno, G.; Carrara, A.; Martín, M.P.; Migliavacca, M. Using terrestrial laser scanning for characterizing tree structural parameters and their changes under different management in a Mediterranean open woodland. For. Ecol. Manag. 2021, 486, 118945. [Google Scholar] [CrossRef]
  42. Gao, Q.; Kan, J. Automatic Forest DBH Measurement Based on Structure from Motion Photogrammetry. Remote Sens. 2022, 14, 2064. [Google Scholar] [CrossRef]
  43. Morgan, C.J.; Powers, M.; Strimbu, B.M. Estimating Tree Defects with Point Clouds Developed from Active and Passive Sensors. Remote Sens. 2022, 14, 1938. [Google Scholar] [CrossRef]
Figure 1. Study area extent is shown using UAV-derived orthophoto (left) and UAV-derived canopy height model (right) from a structure from motion point cloud.
Forests 13 02077 g001
Figure 2. Summary of SfM tree extraction across height classes using a variable window filter. Panels represent (A) F-Score, (B) True Positive rate, (C) False Positive rate, and (D) False Negative rate.
Forests 13 02077 g002
Figure 3. SfM extracted tree height errors.
Forests 13 02077 g003
Figure 4. Distribution of stem mapped and SfM extracted DBH values, unfiltered and filtered.
Forests 13 02077 g004
Figure 5. Stem mapped vs. best SfM predicted DBH values. Trees marked with triangles were recorded as having broken or missing tops in the field. A simple linear regression (dashed line) through all data points is provided for comparison to the 1:1 line (solid).
Forests 13 02077 g005
Table 1. Model coefficients (b1, b2, etc.) for the five parametric model forms fit to the SfM DBHs before and after filtering as the dependent variable. Values in parentheses are p values.
Parameter D B H = b 1 +
b 2 H e i g h t
D B H = b 1 + b 2 H e i g h t
+ b 3 H e i g h t 2
D B H = b 1 +
H e i g h t b 2 + T P H b 3
D B H = b 1 + H e i g h t b 2
+ T P H b 4 + C r o w n A r e a b 3
M u l t i p l e   L i n e a r  
M o d e l
Unfiltered SfM DBHs
Adj. R20.004 (0.032)0.026 (<0.001)---
SE32.3131.94--306.8
Intercept52.499 (<0.001)42.321 (<0.001)--48.318 (<0.001)
Height−0.267 (0.032)3.181 (<0.001)--−0.9844 (0.002)
Height2-−0.141 (<0.001)---
Trees ha−1-----
Crown Area----0.168 (0.156
Relative HT----19.834 (<0.001)
NN Distance----−1.689 (0.067)
Filtered SfM DBHs
Adj. R20.730 (<0.001)0.742 (<0.001)- 0.804 *
SE6.636.486.566.564.23
Intercept5.729 (0.001)11.648 (<0.001)8.270 (0.518)6.793 (0.663)10.660 (<0.001)
Height1.797 (<0.001)0.634 (0.133)1.172 (<0.001)1.183 (<0.001)1.407 (<0.001)
Height2-0.041 (0.005)---
Trees ha−1--−0.229 (0.980)−0.217 (0.983)−0.001 (0.085)
Crown Area---−0.530 (0.059)0.105 (0.017)
Relative HT-----
NN Distance-----
* R2 for generalized linear model calculated following Lefcheck [28].
Table 2. Tree and stand scale Model prediction performance compared to the stem mapped observations. Stem mapping estimated 25.2 m2 ha−1 of basal area and a Dq of 21.8 cm.
Model FormDBH
ME (cm)
DBH MAE (cm)DBH
MAPE
Basal Area
(m2 ha−1)
Dq
(cm)
Unfiltered SfM DBHs
DBH =   b 1 + b 2 Height 35.136.01227.3130.550.5
DBH =   b 1 + b 2 Height + b 3 Height 2 34.836.51168.4130.550.5
DBH =   b 1 + Height b 2 + TPH b 3 -----
DBH =   b 1 + Height b 2 + Crown   Area b 3 + TPH b 4 -----
DBH = b 1 + b 2 Height + b 3 Crown   Area
+ b 4 Relative   HT + b 5 NNDistance
34.839.91199.8128.650.1
Filtered SfM DBHs
DBH =   b 1 + b 2 Height 5.66.8193.028.523.6
DBH =   b 1 + b 2 Height + b 3 Height 2 7.38.5273.930.524.5
DBH =   b 1 + Height b 2 + TPH b 3 5.97.1213.428.923.8
DBH =   b 1 + Height b 2 + Crown   Area b 3 + TPH b 4 6.77.9260.830.224.3
DBH = b 1 + b 2 Height + b 3 TPH + b 4 Crown   Area 6.87.8245.929.824.2
Table 3. Comparison of simple linear model DBH predictions (built from filtered SfM DBHs) against stem mapped observations for all True Positive matches.
DBH Size Class (cm)True Positive MatchesME (cm)MAE (cm)MAPE
<55917.77.7383.3
5–102476.26.292.2
10–15955.05.545.6
15–20285.36.336.3
20–25244.56.428.5
25–30438.69.735.3
30–35518.18.325.6
35–40865.15.715.5
40–45781.73.37.8
45–5055−2.03.47.2
>5056−8.78.715.4
Overall13545.66.8193.0
Publisher’s Note: MDPI stays neutral with regard to jurisdictional claims in published maps and institutional affiliations.

