Abstract
The general objective of this research was to propose a new fire risk index, specifically the Fire Risk Atlantic Forest (FIAF) index in Itatiaia National Park (PNI). The data were collected from two levels (2 and 10 m) of a micrometeorological tower, with a time series on an hourly scale, daily from 2018 to 2021. Two multiple regression models were generated for the two collection levels (FIAF 2 and 10 m) and, based on the statistical criteria and the choice of the best model, a future simulation was generated using the scenario SSP 4.5 for 2022 to 2050. The correlation matrix between the data from the FIAF and fire foci models was also analyzed. The FIAF model was compared with the traditional models already used in Brazil, such as the Angström indices, Monte Alegre Formula (FMA), and the improved Monte Alegre Formula (FMA+) models. The results showed that the FIAF model at 10 m overestimated the results observed mainly during the dry season. The FIAF 2 m model presented the highest correlation with a fire foci value greater than 0.74. In the future simulation, the years that presented the highest extreme risks were: 2025, 2035, 2041, and 2049. Thus, it is possible to state that the FIAF model at the 2 m level was the best model for predicting the degree of fire risk in the PNI.
1. Introduction
Tropical forests are characterized by high air temperatures, substantial rainfall, and biodiversities that exceed that of any other biome on Earth. These forests represent carbon in the form of biomass that contributes greatly to global carbon productivity [1]. Increasing human pressure, with regional effects on land use change and further global effects, has increased the vulnerability of this ecosystem [2].
With the recurring forest fires in Brazil, accompanied by increasing air temperature, intensified climatic phenomena, and greater anthropic intervention, forests are losing their fire resilience capacity, which is causing a substantial decrease in their areas. The increase in forest fires also reduces air quality and increases atmospheric carbon dioxide [3]. More regular occurrences of phenomena such as the El Niño–Southern Oscillation have also intensified the number of fire foci in various Brazilian biomes [3,4,5,6,7,8].
In the Atlantic Forest close to Itatiaia National Park (PNI), forest fires have been observed more frequently during the dry season in the southeast region [9]. In the PNI, there are approximately 40 endemic vegetation species that are threatened by fire episodes. Fire ecology must be precisely investigated in the PNI, as fires can compromise soil water storage [10] and contribute to the reduction in soil organic matter and nutrient content [11].
Forest fires in Brazilian conservation units also occur on a recurring basis, as shown by studies performed in the Chapada Diamantina National Park [12], Triunfo do Xingu State Environmental Protection Areas (APA), Marajó and Baixada Maranhense [9], and in the PNI [13].
Fire regimes depend on the interactions between climate and vegetation, which affect the availability of biomass and flammability of the material [14]. The severity of forest fires does not only happen in Brazil, but these events have been increasing significantly all over the world as a result of climate change. Climate variability associated with extreme events and anthropogenic activities has increased the number of fires in Australia [15], in the boreal forests of southern Siberia, Russia [16], in Greece [17], and on the west coast of the United States [18]. To assist in the identification of forest fires, fire hazard classification systems have been developed, which provide numerical indices that attempt to estimate the intensity of possible fires [19,20,21].
Fire risk indices are used in many parts of the world to meteorologically integrate and associate information into a single or small number of measurements, such as the risk of fire in the Canadian system, the Fire Weather Index—FWI, which is used in other regions such as the Mediterranean environment of Crete, Greece [22], Portugal [23], and western China [24]. Models include the Forest Fire Danger Index (FFDI), widely used in eastern Australia [25], and the dimensionless index F that has been used in several parts of the world, even in Brazil [9]. In Brazil, some indices have been widely used, such as the Monte Alegre Formula (FMA) and the modified FMA+ that have been widely used in numerous studies in Brazil [26,27,28,29]. Dependence on climate, particularly the future consequences of rising air temperatures and extreme weather events, has incited concern by researchers regarding the increasing number of forest fires [9]. The sixth report of the Intergovernmental Panel on Climate Change (IPCC) showed that higher values of air temperature could contribute to a greater number of mega fires, which could cause permanent loss of these forest areas [30]. Changes in these elements such as air temperature and relative humidity will lead to more extreme fire events in the future [31,32].
Numerous models have been used in an attempt to simulate future climate conditions at regional and global levels, and the meteorological elements generated by these models can be fitted into new proposed scenarios called Shared Socioeconomic Pathways (SSPs) [30]. To generate new indices, such as those for fire hazards, an alternative method is to use the set of models available from the Coupled Model Intercomparison Project Phase 6 (CMIP6) [33].
A better understanding of the relationship between meteorological elements and the degree of fire danger in these regions is important for a greater understanding of the effects of climate change on the Atlantic Forest, which is a heritage site of world biodiversity. This will allow for the development of strategic plans to grow and use the natural resources of the Atlantic Forest in a rational manner. Therefore, this study aimed to investigate and propose a new fire risk index (Fire Risk Atlantic Forest; FIAF) in the PNI and to promote this model as an alternative for new initiatives to generate relevant information on the subject of fires related to climate change in the Atlantic Forest.
2. Materials and Methods
2.1. Study Area
The study area comprised the Itatiaia National Park (PNI), located in southeastern Brazil (Figure 1). It has an approximate area of 225.54 km2 and is located in Serra da Mantiqueira, which is a border region between Minas Gerais and Rio de Janeiro.
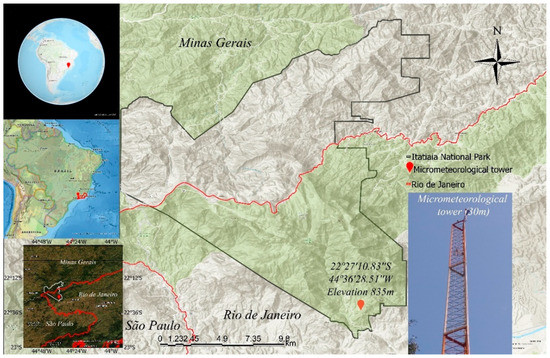
Figure 1.
Geographic location of the study area. The micrometeorological tower used in this study is highlighted.
The climate classification of the municipality of Itatiaia, close to the PNI, is tropical with dry winters and hot summers (Cwa) [34]. A recent study of the PNI using the climate database proposed for the entire national territory by [34,35] verified the occurrence of five climatic regions: tropical humid without a dry season and a hot summer (Cfa), tropical humid without a dry season and a temperate summer (Cfb), tropical humid with a dry winter and hot summer (Cwa), tropical humid with a dry winter and temperate summer (Cwb), and tropical humid with a dry winter and short cool summer (Cwc).
2.2. Micrometeorological Data and Automatic Station A635
The micrometeorological data were collected from a micrometeorological tower located in the lower part of the PNI that was installed in 2015 and has been in operation since 2017. The tower has a height of 30 m, along which the sensors used for this research and others are coupled. The tower is located in an area predominantly composed of dense montana ombrophilous forest, at the geographic coordinates 22°27′10.83″ S and 44°36′28.51″ W and at an elevation of 835 m (Figure 1) [35].
For this study, two sensors were used to measure air temperature (AT; °C) and relative air humidity (RAH; %): model HC2S3 from the Campbell Scientific Company, protected by solar radiation shields, and model 41003 from the Young Company, positioned at heights of 2 and 10 m [35]. A Gill WindSonic sensor was used for wind speed (Wind; m s−1) and wind direction (°) measurements at a height of 10 m. For rainfall data (Rf; mm), hourly data from the same time series of an automatic station (A635) bordering the PNI of the National Institute of Meteorology (INMET) were used. The initial time series totaled 35,040 hourly observations from 2018 to 2021, and these data were transformed into a daily timescale. The wind speed was adapted to a height of 2 m using the method proposed by FAO-56 [36].
Daily analyses of the variables AT, RAH, Wind (2 and 10 m) and Rf were processed through the tidyverse, viridis, lubridate, scales, prophet, readr, readxl, and ggplot2 libraries [37].
2.3. Fire Risk Index
Numerous methods were used for estimating fire risk in this study, such as the Angström indices [38], Monte Alegre Formula (FMA) [39], and the improved Monte Alegre Formula (FMA+) [27,29]. The Angström index was mentioned in 1972 in Brazil [38], while the FMA and FMA+, both were tested and validated in the Brazilian states of Paraná and on the north-central coast from the State of Espírito Santo to the south coast of Bahia [26,28]. The time series included daily data for the years from 2018 to 2021 for the micrometeorological collections from 2 m to 10 m in the PNI. To calculate the FMA, the script available and accessed on 15 April 2022 at <https://italocegatta.github.io/risco-de-incendio-pela-formula-de-monte-alegre/> was used, and for the FMA+ calculation, we chose the electronic spreadsheet SISCLASS developed by [28]. The data followed the standard time of 13:00 h for air temperature, relative humidity, and wind speed.
2.4. Regression Model and Statistical Analysis
A multiple regression analysis was used for the two levels (2 m and 10 m) to generate a new fire risk model for the local conditions of the Atlantic Forest. Prior to choosing the FMA+ model as the dependent variable (Yi 2 m and Yi 10 m), this model was adopted as a standard, as it considers three important meteorological elements for the analysis of the risk index: the air relative air humidity (%), wind speed (m s−1), and rainfall (mm) [28]. The existence of a functional relationship between the independent variables (Xki, i = 1, 2, …, k), wind speed (m s−1), relative humidity (%) at 2 m and 10 m, and rainfall (mm) was verified. From these analyses for the two levels, a regression model was created for the conditions of the Atlantic Forest, which was called the Fire Index Atlantic Forest (FIAF) model, and a new classification of the degree of fire risk was presented for the local conditions of the PNI. The statistical regression model is given by:
where β0, β1, …, βk of Equation (1) are the regression coefficients, β0 is the intercept of the line on the ordinate axis, and β1, …, βk is the slope of the line. The term εi represents the error associated with the distance between the observed value Yi and the corresponding point on the curve of the proposed model.
The statistical performance of the FIAF model was analyzed considering the coefficient of determination (R2) and standard error of estimation (SEE). Willmott’s coefficient was calculated and evaluated [40] within the range from 0 (no agreement) to 1 (perfect agreement).
where Oi is the observed value of FMA+ at the ith observation, is the mean of the observed values at the ith observation, n is the number of samples, i = 1, 2, ..., n, and Pi is the estimated value of FIAF at the ith observation.
2.5. Fire Foci and Correlation Analysis
To verify the accuracy of the new FIAF model at 2 m and 10 m, monthly fire foci data for 2018–2021 were downloaded from the Fire Information for Resource Management System (FIRMS) accessed on 15 April 2022 (https://firms.modaps.eosdis.nasa.gov/) (Figure 2). The monthly fire foci and FIAF data were correlated using a correlation matrix by the spline interpolation method. The libraries used for this analysis and software were FactoMineR, factoextra, GGally, and ggplot2, and R software version 4.1.3 was used to generate the correlation matrix.
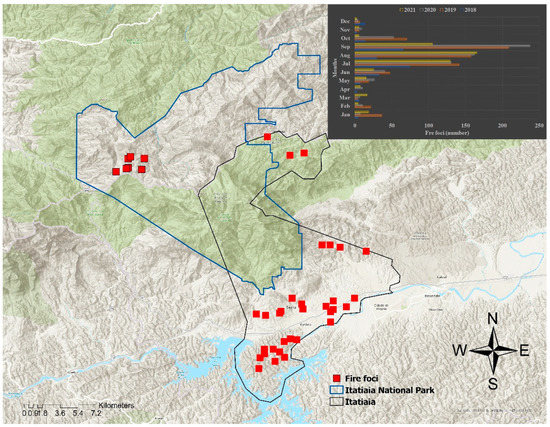
Figure 2.
Distribution of fire foci points and monthly variation during the years 2018–2021 that served for the correlation analysis between the FIAF model and fire foci in Itatiaia National Park, Brazil.
2.6. MRI-ESM2-0 Model—Intermediate Scenario (SSP4.5)
For the future analysis of the FIAF fire risk, the MRI-ESM2-0 model [41] from the Coupled Model Intercomparison Project Phase 6 (CMIP6) was chosen. These data were downloaded into a grid for the coordinates of the micrometeorological tower (Figure 1). For the new IPCC scenarios (2021), known as the Shared Socioeconomic Pathways (SSPs), the scenario chosen was the intermediate SSP4.5. The downloaded data comprised the model output on a daily time scale for the years 2022–2050 for the variables air temperature (°C), minimum air temperature (°C), rainfall (mm), and wind speed (m s−1). The MRI-ESM2-0 model does not include variable relative air humidity (%); therefore, the method proposed in FAO bulletin 56 [36] was used, in which the minimum air temperature (Tmin) would approximately equal the dew point temperature (Tdew) (Tdew ≈ Tmin). Based on this criterion, the current water vapor pressure was calculated for the minimum air temperature (ea = esTmin, kPa) (Equation (5)). The saturation pressure in relation to air temperature (esAT; kPa) was estimated for the air temperature provided by the MRI-ESM2-0 model (Equation (6)), after which the relative humidity of the air at 13:00 h was estimated using the model proposed by [42] (Equations (7) and (8)).
where,
- ea = esTmin = Current water vapor pressure calculated from the saturation pressure esTmin (kPa);
- esAT = Water vapor saturation pressure calculated from the average air temperature of the MRI model (kPa);
- RAHMRI = Relative humidity estimated from the current and saturation pressure of water vapor (Equations (5) and (6)) (%);
- RAHMRI13h = Estimated relative humidity for 13 h (%).
3. Results
3.1. Meteorological Variables
Through the analysis shown in Figure 3, the daily temporal behavior of the variables studied could be verified. The micrometeorological data during the four years studied followed the climatological pattern of the region. The AT 2 m reached its minimum and maximum on 30 July 2021 and 29 November 2021, respectively, with values ranging from 34.86 °C to 8.71 °C, while for the upper level the minimum value occurred on the same day with 9.58 °C and the maximum on 16 May 2019 with 37.33 °C. The RAH at 13:00 h at 2 m and 10 m showed values lower than 29% and 34% for 27 July 2021 (dry season) and values higher than 90% for 16 October 2018 (rainy season). The relative humidity of the air followed the same seasonality as that of the dry and rainy seasons in the southeast region.
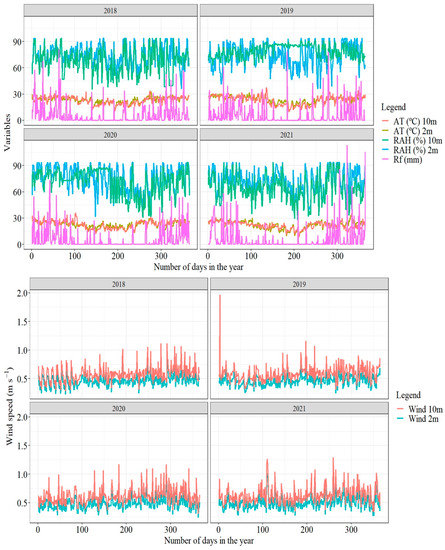
Figure 3.
Temporal distribution of daily micrometeorological data during the years 2018–2021 for the 10 m and 2 m levels in Itatiaia National Park, Brazil. AT = air temperature (°C); RAH = relative air humidity (%); Rf = rainfall (mm)—automatic station A635; Wind = wind speed (m s−1).
The lowest daily wind speed (Wind) at 2 m was found on 3 March 2018 (0.23 m s−1), and the maximum value was 1.57 m s−1 on 3 January 2019. At 10 m, the lowest and highest recorded wind speeds fluctuated between 0.29 m s−1 and 1.96 m s−1 for the same days and years in question. The rainfall totals followed the seasonality of the southeast region and ranged from a minimum of 15.8 mm for the month of June 2021 to a maximum of 502.6 mm for the month of December 2021.
3.2. Regression Model and Degree of Danger for the FIAF
From the evaluation of the micrometeorological data, a multiple regression analysis was generated to develop two new equations for fire risk at the levels of 2 m and 10 m in the PNI. The coefficients found for the two equations verified that the models at 2 m and 10 m were statistically very similar, but the 10 m level obtained the highest coefficient of determination (>0.78) and the highest residual error (>1). For the 2 m level, R2 reached a value of 0.77 with an error less than 0.99. There were no major differences between the models generated at 2 m and 10 m in this analysis. The selected regression models are presented below using Equations (9) and (10):
From the equations generated for the FIAF, a new degree table was created for fire risk in the PNI region (Table 1).

Table 1.
FIAF values (2 and 10 m) and classification according to the degree of fire danger in Itatiaia National Park.
Based on the analysis of the two multiple regression equations (Equations (9) and (10)), we aimed to identify the relationship between the values estimated by the new model for the two FIAFs and the observed levels of FMA+, for which a linear regression analysis was adopted (Figure 4). The FIAF model for the 10 m level presented an R2 = 0.80, a D index = 0.86, and, for this level, the error was greater than eight. The FIAF model at 2 m presented an R2 greater than 0.90, a D index of 0.87, and an error greater than three (Figure 4). The 2 m level was statistically better than that at 10 m in this analysis.
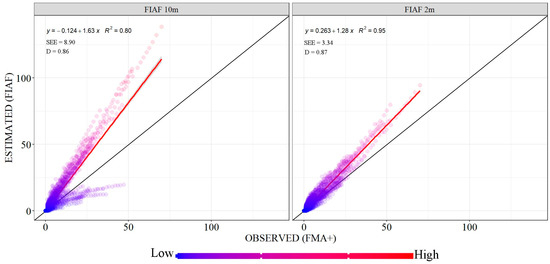
Figure 4.
Regression analysis between the observed FMA+ model and the estimated FIAF for the 2 and 10 m levels in Itatiaia National Park, Brazil.
In Figure 5, the analysis of the error is compared with the model considering the observed FMA+ and the proposed model FIAF for 2 m and 10 m throughout the daily series studied. The 10 m level overestimated the FIAF model compared to that of the 2 m level mainly in the driest season, in which the risk of fire is greater; the smallest errors were concentrated mainly in the rainy season for both levels (2 m and 10 m). The smallest errors found throughout the series were found with the 2 m level FIAF model (Figure 5).
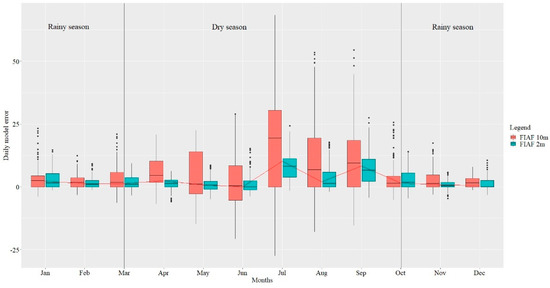
Figure 5.
Daily temporal analysis of the error associated with the FIAF model for the 10 and 2 m levels, highlighting the two seasons in the southeast region (dry and rainy) for the Itatiaia National Park, Brazil.
When analyzing the results between the fire foci and FIAF correlations, the most significant result appeared to be found for the 2 m level, in which the correlation coefficient was above 0.74, whereas for the FIAF model at 10 m, the coefficient of correlation reached a value greater than 0.57 (Figure 6).
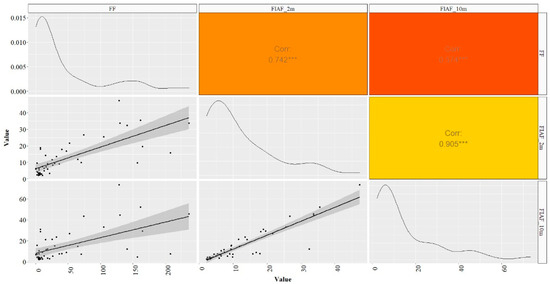
Figure 6.
Correlation matrix between observed fire foci (FF) data and the FIAF model for the two levels of 2 and 10 m (FIAF_2m and FIAF_10m) during the years 2018 to 2021 in Itatiaia National Park, Brazil.
In the risk analysis (Figure 7), a weak relationship among the seasonality of fires in the Atlantic Forest was observed with the Angström model, in which the values were concentrated in the unfavorable fire conditions and unlikely fire occurrence categories. The indices that best identified the fire risk conditions for the PNI were the FMA, FMA+, and the new proposed model FIAF at 2 and 10 m, in which the highest concentration of risk was found during the winter months (June, July, August, and September), which represent the driest season, with low cloud cover, a greater number of fire foci, and low relative humidity. The months that represent the rainy season were considered low risk (Figure 7). The 10 m level (Figure 7 on the right) FIAF index presented as extreme, mainly in July, when compared to the results obtained at 2 m (Figure 7 on the left). The more extreme results of the FIAF model at 10 m may be associated with high dispersion and low correlation with fire foci in the vicinity of the PNI (Figure 4, Figure 5 and Figure 6).
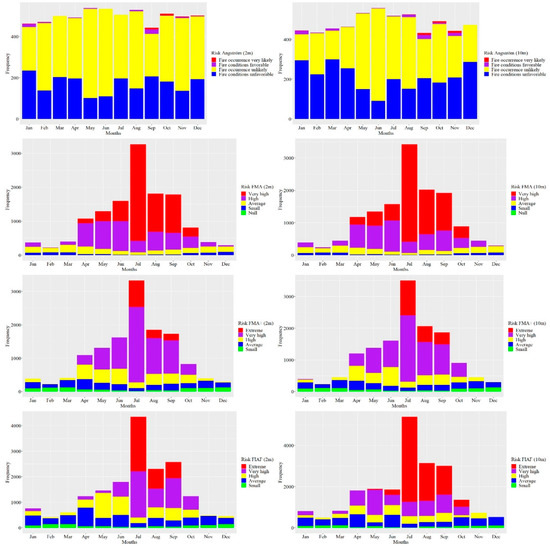
Figure 7.
Fire risk for the models studied in Itatiaia National Park, Brazil. Left, level 2 m, and right, 10 m.
Based on the criteria established in the results, the FIAF model at 2 m (Equation (9)) was selected as the best for the PNI conditions, and the degree of future fire risk was simulated in the MRI model. In Figure 8, the daily temporal behavior from 2018 to 2021 is represented for the observed data of the generated FIAF model (2 m and 10 m) and the future SSP4.5 scenario (2022–2050) for the MRI model. The future FIAF simulation started in 2022. From the FIAF model at 2 m (Equation (9)), the results revealed that the fire risk extended in a few months before being considered low risk (small), such as in May, when the highest values were concentrated, and in September (extreme), when the number of fire foci increased considerably in this region.
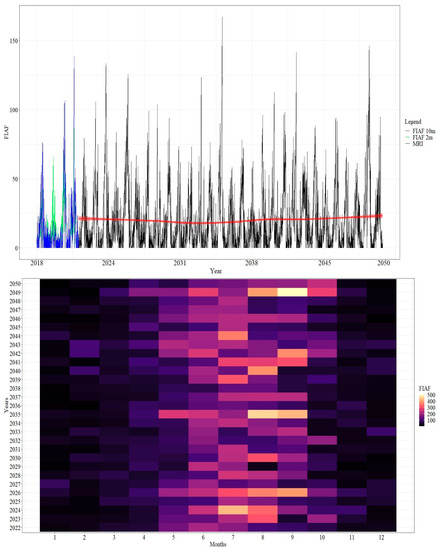
Figure 8.
Daily temporal analysis of the FIAF model at 2 and 10 m (2018–2021) and future scenario SSP 4.5 associated with the risk frequency of monthly MRI fires (2022–2050).
The years that presented the highest extreme risks were 2025, 2035, 2041, and 2049, and after 2035, a periodicity occurred of approximately seven years for extreme conditions of the fire index (2035, 2041, and 2049). Although the rainy season has been considered to have the lowest intensity in the risk associated with fires in the past (2018–2021), this season is expected to experience more extreme conditions, mainly from the year 2026 (Figure 8).
4. Discussion
4.1. Meteorological Variables and Fire Risk Models
The daily results of the micrometeorological elements from 2018 to 2021 from the PNI tower followed the seasonality of the region, with the highest values being found during the beginning of the spring equinox (beginning of the rainy season) and increasing until the end of the summer solstice in the southeastern region (end of the rainy season) [35]. According to the World Meteorological Organization (WMO), 2021 was one of the seven hottest years in the history of global mean temperature records [43], and as found in our results, 2021 had increased rainfall when compared to 2020. According to the National Oceanic and Atmospheric Administration (NOAA), 2021 was a La Niña year [44], where rainfall in the south of the country was below average and that in the southeast was above the climatological average [45].
Our FIAF model, when compared with other models such as the FMA of [39] and the FMA+ index of [26] used by [28], suggested that the results obtained can be used with local conditions of the PNI. Other models, such as that of Angström (Figure 7), proved to be limited to the local and climatic conditions of the study region. In some regions, such as the Brazilian Agreste, climatic conditions favor the Angström index in presenting a high correlation with fires [46].
Correlations with fire foci obtained from the FIAF at 2 m showed that this model could be applied to the conditions of the Atlantic Forest, which is characterized by high volumes of precipitation during the rainy season and low rainfall during the dry season (Figure 4, Figure 5 and Figure 6). Although large volumes of rainfall occur in this region, the Atlantic Forest is highly susceptible to fires during winter, mainly because of the significant reduction in relative humidity (Figure 3). Unlike other indices used in the state of Rio de Janeiro [9], the FIAF showed a high correlation with the driest season, where the number of fires increased considerably [7] (Figure 2).
In Norway, cloud computing services have been developed to create a fire risk index for homes, as the vast majority of houses are made of wood [47]. Although our results were obtained from another region and a different biome, the main objective of this study was to create a local meteorological database and an FIAF predictive model at 2 m for the reduction in fire risks in the Atlantic Forest area.
As proposed by our FIAF model, new indices were created from meteorological elements. In the United States, a new fire index was also created capable of simulating and predicting large fires [48], i.e., the Hot–Dry–Windy Index (HDW), which takes into account meteorological elements such as relative humidity, air temperature, water vapor pressure deficit, and wind speed.
In Poland, the authors used the fire risk model from the Canadian Fire Weather Index (FWI) system and coupled this model to the meteorological fields generated by the Weather Research and Forecasting (WRF) model for the year 2019 [49].
4.2. Future Analysis of FIAF in the Atlantic Forest
The implementation of new fire risk indices for future climate scenarios, such as the FIAF implemented in the MRI model (Figure 8), is critical for the Atlantic Forest, which has been the subject of studies and interest in the behavior of fires, future fire risk scenarios, and fire foci [7,9]. Ref. [12] also highlighted the importance of understanding climate risks and the vulnerability of these regions and commented that the similar results found in that study may guide the planning of the segmentation of the most vulnerable areas to reduce exposure or protect vulnerable populations to future fires. In a study in the Atlantic Forest Central Corridor [51], it was highlighted that the imminent risks arising from agricultural expansion and the dismantling of environmental inspection agencies in Brazil increase the need for research that can assist in the management of areas such as the Atlantic Forest.
Heat waves will occur more frequently, and dry seasons will intensify, thereby increasing the imminent risk of fires in the Atlantic Forest (Figure 8). A practical example of this was observed in in Australia in 2019/20, prior to the arrival of the COVID19 pandemic. At that time, Australia experienced a mega fire in the southeast region that was unprecedented [15]. Ref. [15] highlighted that past projections of more than a decade of fire risks had previously been detected and that these mega fires were predicted for 2020. Our results using only one scenario considered intermediate SSP4.5 to address these issues, and the months corresponding to the dry season in the southeast region clarified that these fire risk events may be repeated on a scale unprecedented in the Atlantic Forest (Figure 8).
A recent study in the state of Rio de Janeiro [52] verified the reduction in rainfall during the rainy season. These results converge with those found by the FIAF, mainly during the month of May 2035 (Figure 8), in which, through the analysis of the model, the rainy season is expected to be shorter, which will further increase the natural disasters associated with extreme hydrometeorological events over small intervals and mega fires during the dry season.
The world has experienced major drought events, such as those that occurred in 2005, 2010, and 2015, with an emphasis on those that occurred in 2005 and 2010 due to their severity and territorial extension [53,54]. Those authors also suggested that, in future simulations, the risk of extreme drought events will be more intense, even in humid regions [53]. Our results showed similar events to those that have previously occurred; the years 2035, 2041, and 2049 were indicated as years in which extreme drought events could trigger larger fire events in the Atlantic Forest and also in various regions of the world [15,16,17,18]. Ref. [9] also indicated that the increasing occurrence of fires in the Atlantic Forest requires further study of this area for monitoring and follow-up of these elements over time.
In a recent study in South America using the CanESM5 model and the future scenarios SSP126 and SSP585 for all biomes from the World Wide Fund for Nature, the authors verified the increase in air temperature mainly in tropical regions during the studied years of 2021–2040 [55]. This increase in air temperature in these biomes will accelerate the probability of mega fires and consequently the reduction in vegetation mainly during the dry season.
In the Iberian Peninsula, the meteorological indices of present and future fires were also studied, where the authors also verified an increase in the future climatic risk of fires, especially in late spring and early autumn, and also in the south and east of the Iberian Peninsula [56]. Our results also addressed seasonal issues such as those raised in this work [56], also associating greater fire risks in certain months and years (Figure 8).
UK researchers also used meteorological elements and fire models for spring conditions such as the Initial Spread Index (ISI) and Fire Weather Index for drier weather conditions, especially in summer [57]. The authors comment in their work that, in the future, the events associated with fire risks will be much greater, since the air temperature will increase from 2 to 4 °C.
5. Conclusions
The FIAF model at the 2 m level was the best model for predicting the degree of fire risk in Itatiaia National Park, and it can be used in other regions with similar climates.
The Angström model showed no relationship with the climatic conditions of the study area. In addition to the proposed FIAF model, the FMA and FMA+ models were reliable models that could be used for this region.
This study showed the potential of the FIAF model to contribute to future action in combatting fires in the Atlantic Forest, as well as its applicability to models that simulate the future climate for Shared Socioeconomic Pathway (SSPs) scenarios. The FIAF model used for the proposed future scenario showed that the years 2035, 2041, and 2049 will be years of major fire events in the Atlantic Forest.
Author Contributions
Conceptualization: R.C.D. Formal analysis: R.C.D., H.S.W., M.G.P., A.Q.d.A., D.C.d.C., D.d.S.L., E.Z., S.J.M.d.C.d.M., G.L.d.S., R.O.d.S., R.S.d.S. and O.A.Q.d.S. Investigation: R.C.D. Resources: R.C.D. Data curation: R.C.D., H.S.W., M.G.P., A.Q.d.A., D.C.d.C., D.d.S.L., E.Z., S.J.M.d.C.d.M., G.L.d.S., R.O.d.S., R.S.d.S. and O.A.Q.d.S. Writing—original draft preparation: R.C.D., H.S.W., M.G.P., A.Q.d.A., D.C.d.C., D.d.S.L., E.Z., S.J.M.d.C.d.M., G.L.d.S., R.O.d.S., R.S.d.S. and O.A.Q.d.S. Writing—review and editing: R.C.D., H.S.W., M.G.P., A.Q.d.A., D.C.d.C., D.d.S.L., E.Z., S.J.M.d.C.d.M., G.L.d.S., R.O.d.S., R.S.d.S. and O.A.Q.d.S. Visualization: R.C.D., H.S.W., M.G.P., A.Q.d.A., D.C.d.C., D.d.S.L., E.Z., S.J.M.d.C.d.M., G.L.d.S., R.O.d.S., R.S.d.S. and O.A.Q.d.S. Supervision: R.C.D. Project administration: Rafael Coll Delgado. All authors reviewed the manuscript. All authors have read and agreed to the published version of the manuscript.
Funding
This research was funded by the Research Support Foundation of the State of Rio de Janeiro—FAPERJ grant (201.188/2022) and the National Council for Scientific and Technological—CNPq grant (308922/2021-2).
Data Availability Statement
Not applicable.
Acknowledgments
We also thank the Federal Rural University of Rio de Janeiro and the Itatiaia National Park—Parna Itatiaia—ICMBio. We would also like to thank the Instituto Nacional de Meteorologia—INMET for the availability of data from the A635 automatic station.
Conflicts of Interest
The authors declare no conflict of interest.
References
- Grace, J.; Malhi, Y.; Higuchi, N.; Meir, P. Productivity of tropical rain forests. In Terrestrial Global Productivity; Roy, J., Saugier, B., Mooney, H.A., Eds.; Academic Press: Cambridge, MA, USA, 2001; pp. 401–426. [Google Scholar]
- Grelle, C.E.; Rajão, H.; Marques, M. The Future of the Brazilian Atlantic Forest. In The Atlantic Forest; Springer: Cham, Switzerland, 2021; pp. 487–503. [Google Scholar]
- Silva Junior, C.A.; Teodoro, P.E.; Delgado, R.C.; Pereira, L.; Teodoro, R.; Lima, M.; de Andréa Pantaleão, A.; Rojo Baio, F.H.; Brito De Azevedo, G.; Taís De Oliveira, G.; et al. Persistent fire foci in all biomes undermine the Paris Agreement in Brazil. Sci. Rep. 2020, 123, 16246. [Google Scholar] [CrossRef] [PubMed]
- Barbosa, M.L.F.; Delgado, R.C.; Teodoro, P.E.; Pereira, M.G.; Correia, T.P.; de Mendonça, B.A.F.; Ávila Rodrigues, R.D. Occurrence of fire foci under different land uses in the State of Amazonas during the 2005 drought. Environ. Dev. Sustain. 2018, 21, 2707–2720. [Google Scholar] [CrossRef]
- Andrade, C.F.; Delgado, R.C.; Barbosa, M.L.F.; Teodoro, P.E.; da Silva Junior, C.A.; Wanderley, H.S.; Capristo-Silva, G.F. Fire regime in Southern Brazil driven by atmospheric variation and vegetation cover. Agric. For. Meteorol. 2020, 295, 108194. [Google Scholar] [CrossRef]
- Barbosa, M.L.F.; Delgado, R.C.; de Andrade, C.F.; Teodoro, P.E.; Junior, C.A.S.; Wanderley, H.S.; Capristo-Silva, G.F. Recent trends in the fire dynamics in Brazilian Legal Amazon: Interaction between the ENSO phenomenon, climate and land use. Environ. Dev. 2021, 39, 100648. [Google Scholar] [CrossRef]
- Santos, R.O.; Delgado, R.C.; Vilanova, R.S.; de Santana, R.O.; de Andrade, C.F.; Teodoro, P.E.; Silva Junior, C.A.; Capristo-Silva, G.F.; Lima, M. NMDI application for monitoring different vegetation covers in the Atlantic Forest biome, Brazil. Weather Clim. Extrem. 2021, 33, 100329. [Google Scholar] [CrossRef]
- Teodoro, P.E.; da Silva Junior, C.A.; Delgado, R.C.; Lima, M.; Teodoro, L.P.R.; Baio, F.H.R.; de Oliveira Sousa Azevedo, G.T.; de Andréa Pantaleão, A.; Capristo-Silva, G.F.; Facco, C.U. Twenty-year impact of fire foci and its relationship with climate variables in Brazilian regions. Environ. Monit. Assess. 2022, 194, 90. [Google Scholar] [CrossRef] [PubMed]
- Jesus, C.S.L.; Delgado, R.C.; Wanderley, H.S.; Teodoro, P.E.; Pereira, M.G.; Lima, M.; de Ávila Rodrigues, R.; da Silva Junior, C.A. Fire risk associated with landscape changes, climatic events and remote sensing in the Atlantic Forest using ARIMA model. Remote Sens. Appl. Soc. Environ. 2022, 26, 100761. [Google Scholar] [CrossRef]
- Rodrigues, E.L.; Jacobi, C.M.; Figueira, J.E.C. Wildfires and their impact on the water supply of a large neotropical metropolis: A simulation approach. Sci. Total Environ. 2019, 651, 1261–1271. [Google Scholar] [CrossRef]
- Aaltonen, H.; Köster, K.; Köster, E.; Berninger, F.; Zhou, X.; Karhu, K.; Pumpanen, J. Forest fires in Canadian permafrost region: The combined effects of fire and permafrost dynamics on soil organic matter quality. Biogeochemistry 2019, 143, 257–274. [Google Scholar] [CrossRef]
- Benfica, N.S.; Silva, D.P.; Figueiredo, R.M.; Brunow, J.C. Validação do Produto de Área Queimada MCD64A1 de Resolução Moderada. Braz. J. Dev. 2020, 6, 91164–91171. [Google Scholar] [CrossRef]
- Aximoff, I.; Nunes-Freitas, A.F.; Braga, J.M.A. Regeneração natural pós-fogo nos campos de altitude no Parque Nacional do Itatiaia, sudeste do Brasil. Oecol. Aust. 2016, 20, 62–80. [Google Scholar] [CrossRef]
- Dietze, E.; Mangelsdorf, K.; Andreev, A.; Karger, C.; Hopmans, E.C.; Schreuder, L.T.; Sachse, D.; Rach, O.; Nowaczyk, N.; Herzschuh, U. Anhydrosugars in Sediments pf Lake El’gygytgyn-Fire Regime Reconstructions of Ne Siberia during the Last Two Interglacials. In Proceedings of the 29th International Meeting on Organic Geochemistry, Gothenburg, Sweden, 1–6 September 2019; European Association of Geoscientists & Engineers: Utrecht, The Netherlands, 2019; Volume 2019, pp. 1–2. [Google Scholar]
- Abram, N.J.; Henley, B.J.; Sen Gupta, A.; Lippmann, T.J.; Clarke, H.; Dowdy, A.J.; Sharples, J.J.; Nolan, R.H.; Zhang, T.; Wooster, M.J.; et al. Connections of climate change and variability to large and extreme forest fires in southeast Australia. Commun. Earth Environ. 2021, 2, 8. [Google Scholar] [CrossRef]
- Sun, Q.; Burrell, A.; Barrett, K.; Kukavskaya, E.; Buryak, L.; Kaduk, J.; Baxter, R. Climate variability may delay post-fire recovery of boreal forest in southern Siberia. Russia. Remote Sens. 2021, 13, 2247. [Google Scholar] [CrossRef]
- Troumbis, A.Y.; Kalabokidis, K.; Palaiologou, P. Diverging rationalities between forest fire management services and the general public after the 21st-century mega-fires in Greece. J. For. Res. 2022, 33, 553–564. [Google Scholar] [CrossRef]
- Varga, K.; Jones, C.; Trugman, A.; Carvalho, L.M.; McLoughlin, N.; Seto, D.; Thompson, C.; Daum, K. Megafires in a Warming World: What Wildfire Risk Factors Led to California’s Largest Recorded Wildfire. Fire 2022, 5, 16. [Google Scholar] [CrossRef]
- Chelli, S.; Maponi, P.; Campetella, G.; Monteverde, P.; Foglia, M.; Paris, E.; Lolis, A.; Panagopoulos, T. Adaptation of the Canadian fire weather index to Mediterranean forests. Nat. Hazards 2015, 75, 1795–1810. [Google Scholar] [CrossRef]
- Naderpour, M.; Rizeei, H.M.; Ramezani, F. Forest fire risk prediction: A spatial deep neural network-based framework. Remote Sens. 2021, 13, 2513. [Google Scholar] [CrossRef]
- Sivrikaya, F.; Küçük, Ö. Modeling forest fire risk based on GIS-based analytical hierarchy process and statistical analysis in Mediterranean region. Ecol. Inform. 2022, 68, 101537. [Google Scholar] [CrossRef]
- Dimitrakopoulos, A.P.; Bemmerzouk, A.M.; Mitsopoulos, I.D. Evaluation of the Canadian fire weather index system in an eastern Mediterranean environment. Meteorol. Appl. 2011, 18, 83–93. [Google Scholar] [CrossRef]
- Carvalho, A.; Flannigan, M.D.; Logan, K.; Miranda, A.I.; Borrego, C. Fire activity in Portugal and its relationship to weather and the Canadian Fire Weather Index System. Int. J. Wildland Fire 2008, 17, 328–338. [Google Scholar] [CrossRef]
- Masinda, M.M.; Li, F.; Qi, L.; Sun, L.; Hu, T. Forest fire risk estimation in a typical temperate forest in Northeastern China using the Canadian forest fire weather index: Case study in autumn 2019 and 2020. Nat. Hazards 2022, 111, 1085–1101. [Google Scholar] [CrossRef] [PubMed]
- Sharples, J.J.; McRae, R.H.; Weber, R.O.; Gill, A.M. A simple index for assessing fire danger rating. Environ. Model. Softw. 2009, 24, 764–774. [Google Scholar] [CrossRef]
- Nunes, J.R.S.; Soares, R.V.; Batista, A.C. FMA+-Um novo índice de perigo de incêndios florestais para o estado do Paraná, Brasil. Floresta 2006, 36, 75–91. [Google Scholar] [CrossRef]
- Torres, F.T.P.; Lima, G.S.; Martins, S.V.; Valverde, S.R. Analysis of efficiency of fire danger indices in forest fire prediction. Rev. Arvore 2017, 41, 1–10. [Google Scholar] [CrossRef][Green Version]
- Eugenio, F.C.; dos Santos, A.R.; Pedra, B.D.; Pezzopane, J.E.M.; da Silva, S.D.P.; Fantinel, R.A. System for calculating and defining classes in modified Monte Alegre Formula-FMA+ Sisclass. Floresta 2021, 52, 131–139. [Google Scholar] [CrossRef]
- Lima, M.B.; Costa, G.B.; Pereira, W.D.S.; Da Silva, D.T.C.; Matias, L.V.D.S.; Macambira, A.C.D.S.; Almada, N.B. Aspectos Sazonais de um Índice de Risco de Incêndios Florestais na Região Norte do Brasil por Meio de Dados Meteorológicos. Biodivers. Bras.-BioBrasil 2021, 11, 46–59. [Google Scholar] [CrossRef]
- IPCC. Climate Change 2014: AR6 Synthesis Report. In Contribution of Working Groups I, II and III to the Sixth Assessment Report of the Intergovernmental Panel on Climate Change (Issues 1–151). 2021. Available online: https://archive.ipcc.ch/pdf/assessment-report/ar5/syr/SYR_AR5_FINAL_full_wcover.pdf (accessed on 15 May 2022).
- Touma, D.; Stevenson, S.; Lehner, F.; Coats, S. Human-driven greenhouse gas and aerosol emissions cause distinct regional impacts on extreme fire weather. Nat. Commun. 2021, 12, 212. [Google Scholar] [CrossRef] [PubMed]
- Burrell, A.L.; Sun, Q.; Baxter, R.; Kukavskaya, E.A.; Zhila, S.; Shestakova, T.; Rogers, B.M.; Kaduk, J.; Barrett, K. Climate change, fire return intervals and the growing risk of permanent forest loss in boreal Eurasia. Sci. Total Environ. 2022, 831, 154885. [Google Scholar] [CrossRef]
- Eyring, V.; Bony, S.; Meehl, G.A.; Senior, C.A.; Stevens, B.; Stouffer, R.J.; Taylor, K.E. Overview of the Coupled Model Intercomparison Project Phase 6 (CMIP6) experimental design and organization. Geosci. Model Dev. 2016, 9, 1937–1958. [Google Scholar] [CrossRef]
- Alvares, C.A.; Stape, J.L.; Sentelhas, P.C.; Gonçalves, J.D.M.; Sparovek, G. Köppen’s climate classification map for Brazil. Meteorologische Zeitschrift 2013, 22, 711–728. [Google Scholar] [CrossRef]
- Andrade, M.D.; Delgado, R.C.; De Ávila Rodrigues, R.; Teodoro, P.E.; Da Silva Junior, C.A.; Pereira, M.G. Evaluation of the MOD11A2 product for canopy temperature monitoring in the Brazilian Atlantic Forest. Environ. Monit. Assess. 2021, 193, 45. [Google Scholar] [CrossRef] [PubMed]
- Allen, R.G.; Pereira, L.S.; Raes, D.; Smith, M. FAO Irrigation and drainage paper No. 56. Rome Food Agric. Organ. United Nations 1998, 56, e156. Available online: http://www.climasouth.eu/sites/default/files/FAO%2056.pdf (accessed on 3 May 2022).
- Team, R.C. R: A Language and Environment for Statistical Computing; R Foundation for Statistical Computing: Vienna, Austria, 2018; Available online: https://www.r-project.org/ (accessed on 31 October 2022).
- Angstrom, A. Riskerna for skogsbrand och deras beroende av vader och klimat (The risks for forest fires and their relation to weather and climate). Svenska Skogsvirdsforeningens Tidskrift 1942, 40, 323–343. [Google Scholar]
- Soares, R.V. Índices de perigo de incêndio. Floresta 1972, 3, 19–40. [Google Scholar] [CrossRef]
- Willmott, C.J. On the validation of models. Phys. Geogr. 1981, 2, 184–194. [Google Scholar] [CrossRef]
- Yukimoto, S.; Kawai, H.; Koshiro, T.; Oshima, N.; Yoshida, K.; Urakawa, S.; Tsujino, H.; Deushi, M.; Tanaka, T.; Hosaka, M.; et al. The Meteorological Research Institute Earth System Model version 2.0, MRI-ESM2.0: Description and basic evaluation of the physical component. J. Meteorol. Soc. Jpn. 2019, 97, 931–965. [Google Scholar] [CrossRef]
- Alvares, C.A.; Cegatta, I.R.; Vieira, L.A.A.; Pavani, R.F.; de Mattos, E.M.; Sentelhas, P.C.; Stape, J.L.; Soares, R.V. Forest fire danger: Application of Monte Alegre Formula and assessment of the historic for Piracicaba, SP. Sci. For. 2014, 42, 521–532. [Google Scholar]
- Instituto Nacional de Meteorologia—INMET. 2022. Available online: https://portal.inmet.gov.br/noticias/inmet-aponta-que-a-%C3%BAltima-d%C3%A9cada-foi-a-mais-quente-no-brasil (accessed on 3 May 2022).
- National Oceanic and Atmospheric Administration—NOAA. El Niño/Southern Oscillation (ENSO). Available online: https://www.ncei.noaa.gov/access/monitoring/enso/ (accessed on 3 May 2022).
- Instituto Nacional de Meteorologia—INMET. 2022. Available online: https://portal.inmet.gov.br/noticias/comparativo-de-chuvas-em-novembro-2020-e-2021-no-brasil (accessed on 3 May 2022).
- White, B.L.A. Incêndios Florestais no Parque Nacional Serra de Itabaiana-Sergipe. [Dissertação] São Cristóvão: Universidade Federal de Sergipe. 2010. Available online: https://ri.ufs.br/handle/riufs/4175 (accessed on 3 May 2022).
- Stokkenes, S.; Strand, R.D.; Kristensen, L.M.; Log, T. Validation of a Predictive Fire Risk Indication Model using Cloud-based Weather Data Services. Procedia Comput. Sci. 2021, 184, 186–193. [Google Scholar] [CrossRef]
- Srock, A.F.; Charney, J.J.; Potter, B.E.; Goodrick, S.L. The hot-dry-windy index: A new fire weather index. Atmosphere 2018, 9, 279. [Google Scholar] [CrossRef]
- Mandal, A.; Nykiel, G.; Strzyzewski, T.; Kochanski, A.; Wrońska, W.; Gruszczynska, M.; Figurski, M. High-resolution fire danger forecast for Poland based on the Weather Research and Forecasting Model. Int. J. Wildland Fire 2021, 31, 149–162. [Google Scholar] [CrossRef]
- Nainggolan, H.A.; Veanti, D.P.O.; Akbar, D. Utilisation of nasa-gfwed and firms satellite data in determining the probability of hotspots using the fire weather index (fwi) in ogan komering ilir regency, south sumatra. Int. J. Remote Sens. Earth Sci. 2021, 17, 85–98. [Google Scholar] [CrossRef]
- Santana, R.O.; Delgado, R.C.; Schiavetti, A. The past, present and future of vegetation in the Central Atlantic Forest Corridor, Brazil. Remote Sens. Appl. Soc. Environ. 2020, 20, 100357. [Google Scholar] [CrossRef]
- Pereira, R.M.S.; Wanderley, H.S.; Delgado, R.C. Homogeneous regions for rainfall distribution in the city of Rio de Janeiro associated with the risk of natural disasters. Nat. Hazards 2022, 111, 333–351. [Google Scholar] [CrossRef]
- Panisset, J.S.; Libonati, R.; Gouveia, C.M.P.; Machado-Silva, F.; França, D.A.; França, J.R.A.; Peres, L.F. Contrasting patterns of the extreme drought episodes of 2005, 2010 and 2015 in the Amazon Basin. Int. J. Climatol. 2018, 38, 1096–1104. [Google Scholar] [CrossRef]
- Semenova, I.; Sumak, K. Dynamics of fire weather conditions in the mixed forest areas of Belarus and Ukraine under recent climate change. Geofizika 2022, 39, 71–84. [Google Scholar] [CrossRef]
- Delgado, R.C.; de Santana, R.O.; Gelsleichter, Y.A.; Pereira, M.G. Degradation of South American biomes: What to expect for the future? Environ. Impact Assess. Rev. 2022, 96, 106815. [Google Scholar] [CrossRef]
- Calheiros, T.; Pereira, M.G.; Nunes, J.P. Assessing impacts of future climate change on extreme fire weather and pyro-regions in Iberian Peninsula. Sci. Total Environ. 2021, 754, 142233. [Google Scholar] [CrossRef]
- Perry, M.C.; Vanvyve, E.; Betts, R.A.; Palin, E.J. Past and future trends in fire weather for the UK. Nat. Hazards Earth Syst. Sci. 2022, 22, 559–575. [Google Scholar] [CrossRef]
Publisher’s Note: MDPI stays neutral with regard to jurisdictional claims in published maps and institutional affiliations. |
© 2022 by the authors. Licensee MDPI, Basel, Switzerland. This article is an open access article distributed under the terms and conditions of the Creative Commons Attribution (CC BY) license (https://creativecommons.org/licenses/by/4.0/).