
Canopy Interception of Different Rainfall Patterns in the Rocky Mountain Areas of Northern China: An Application of the Revised Gash Model

Abstract
1. Introduction
2. Materials and Methods
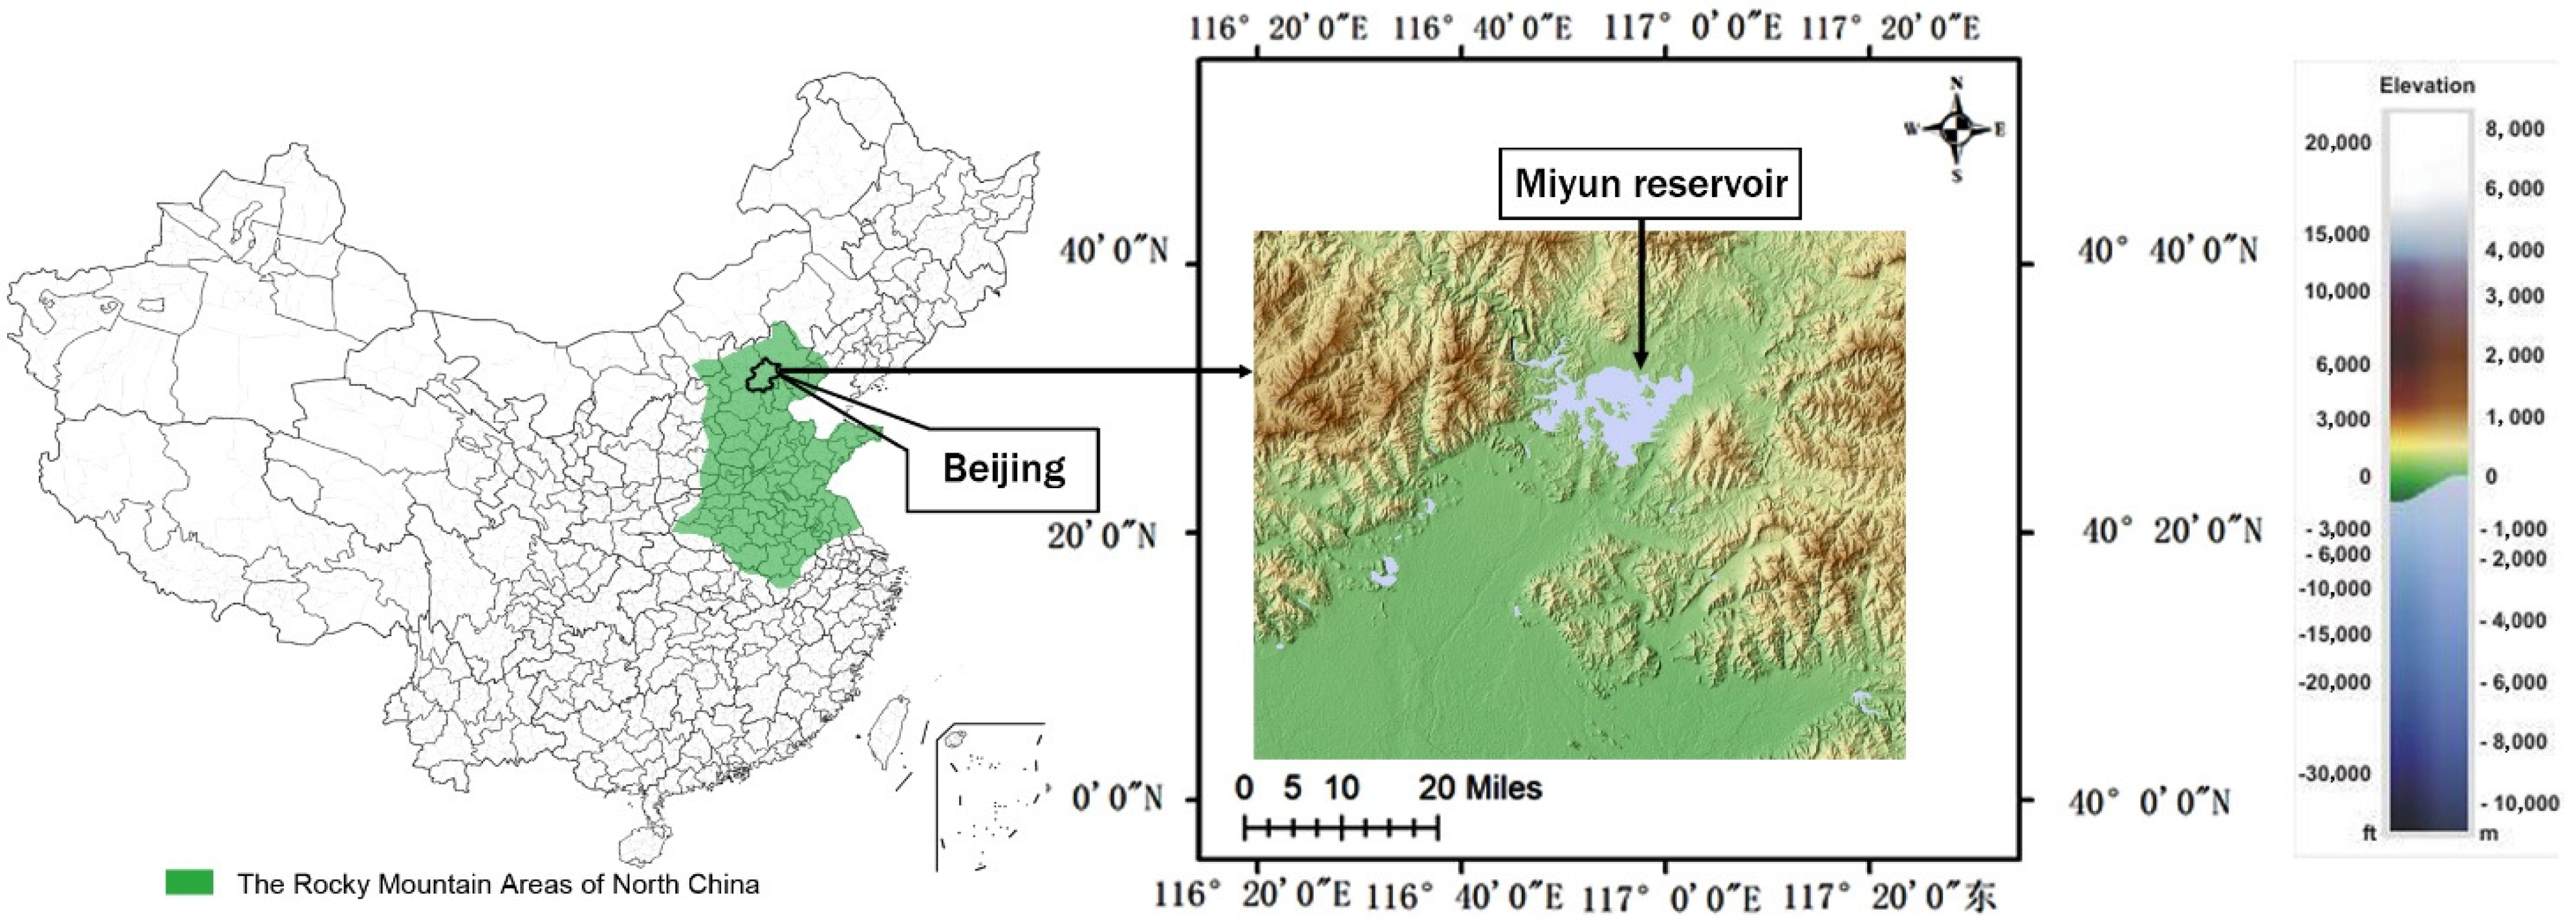
2.1. Study Area
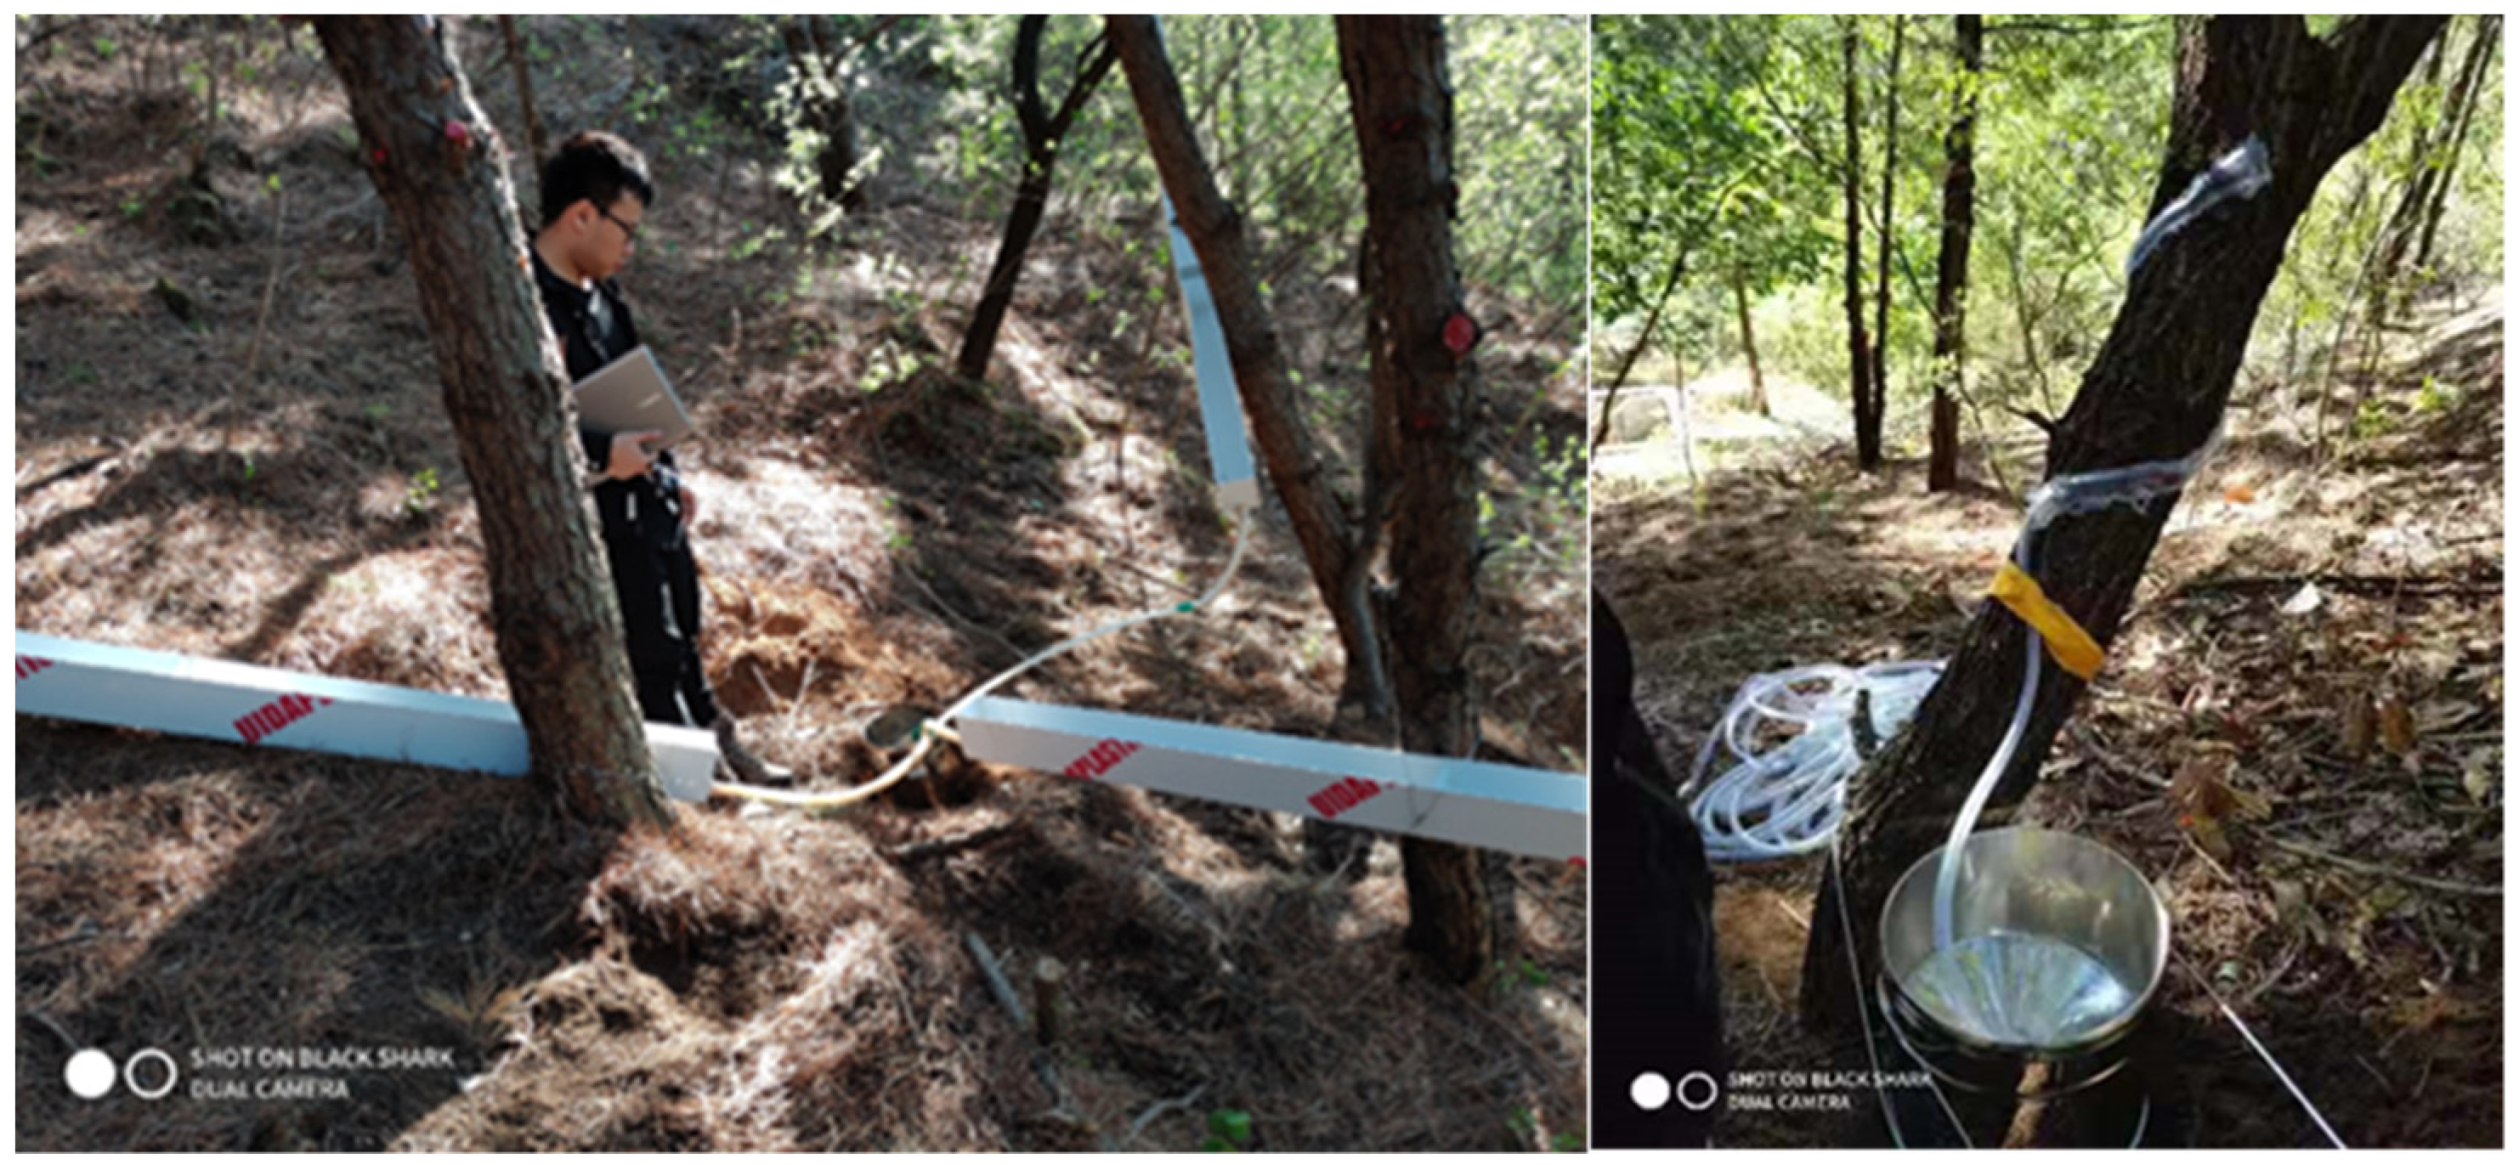
2.2. Data Sources
2.3. Methodology
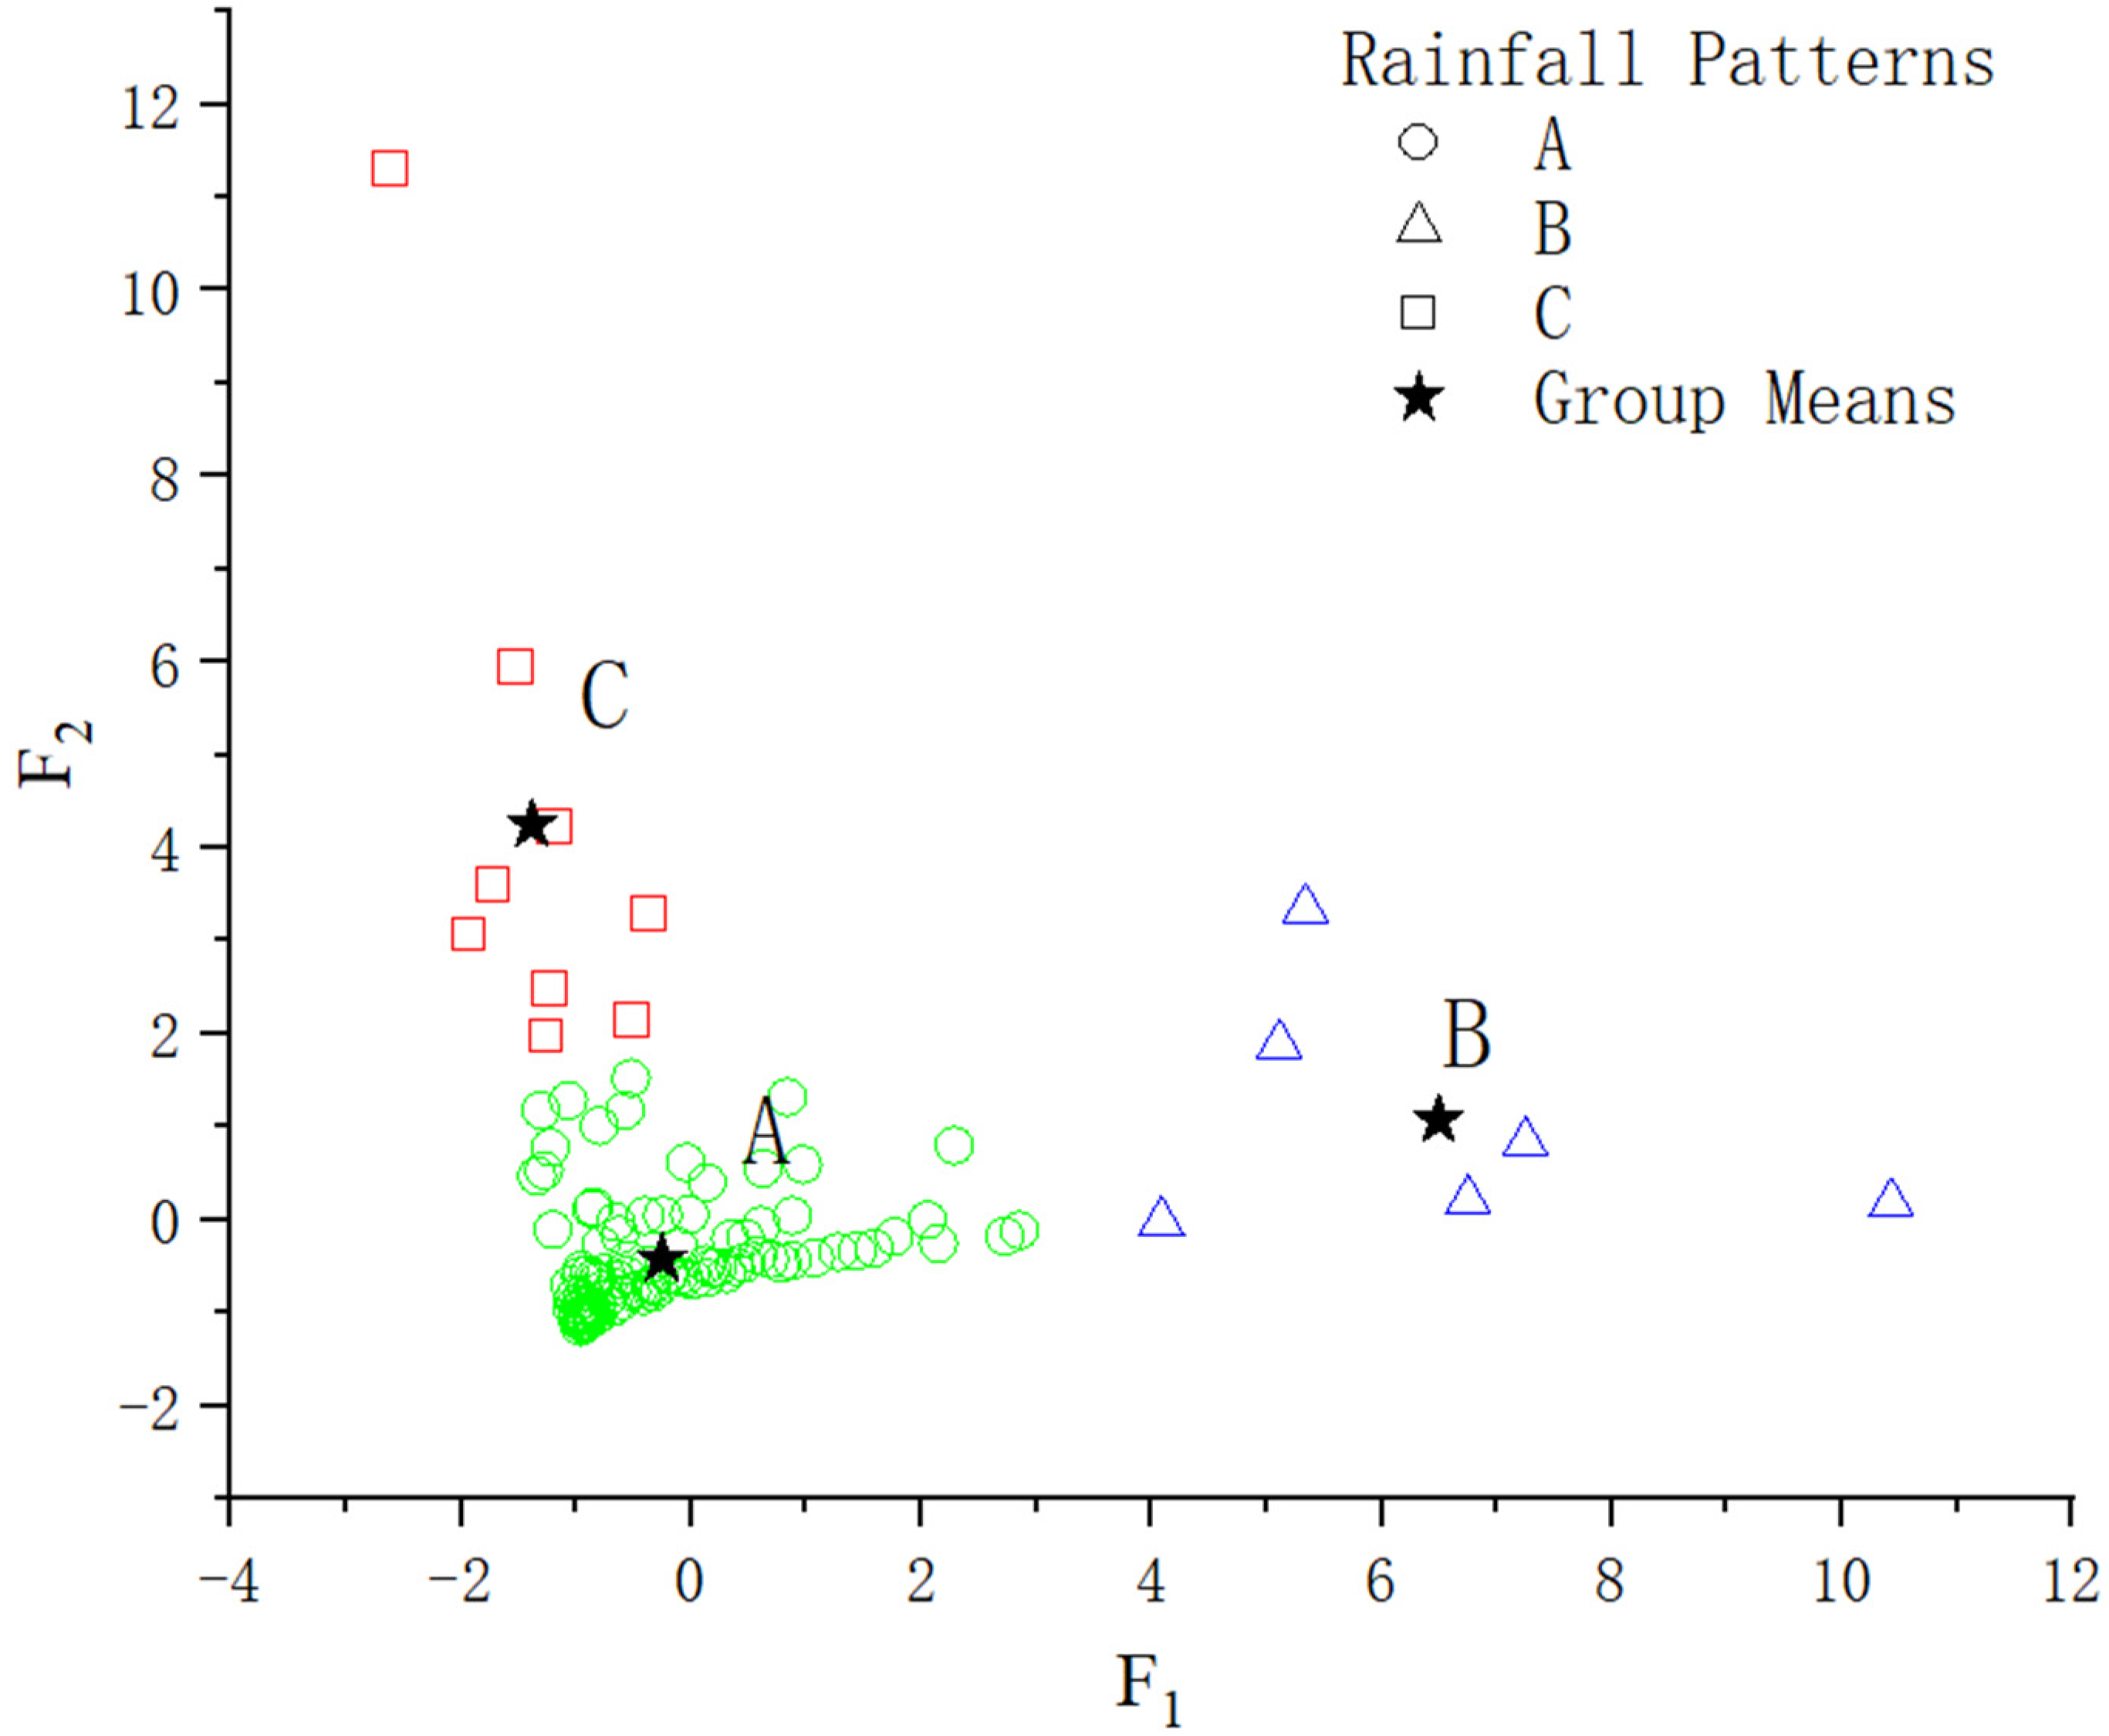
2.3.1. Rain Pattern Division
2.3.2. Descriptions of the Revised Gash Model
2.3.3. Calculation of the Revised Gash Model
3. Results
3.1. Rain Pattern Classification and Statistical Analysis
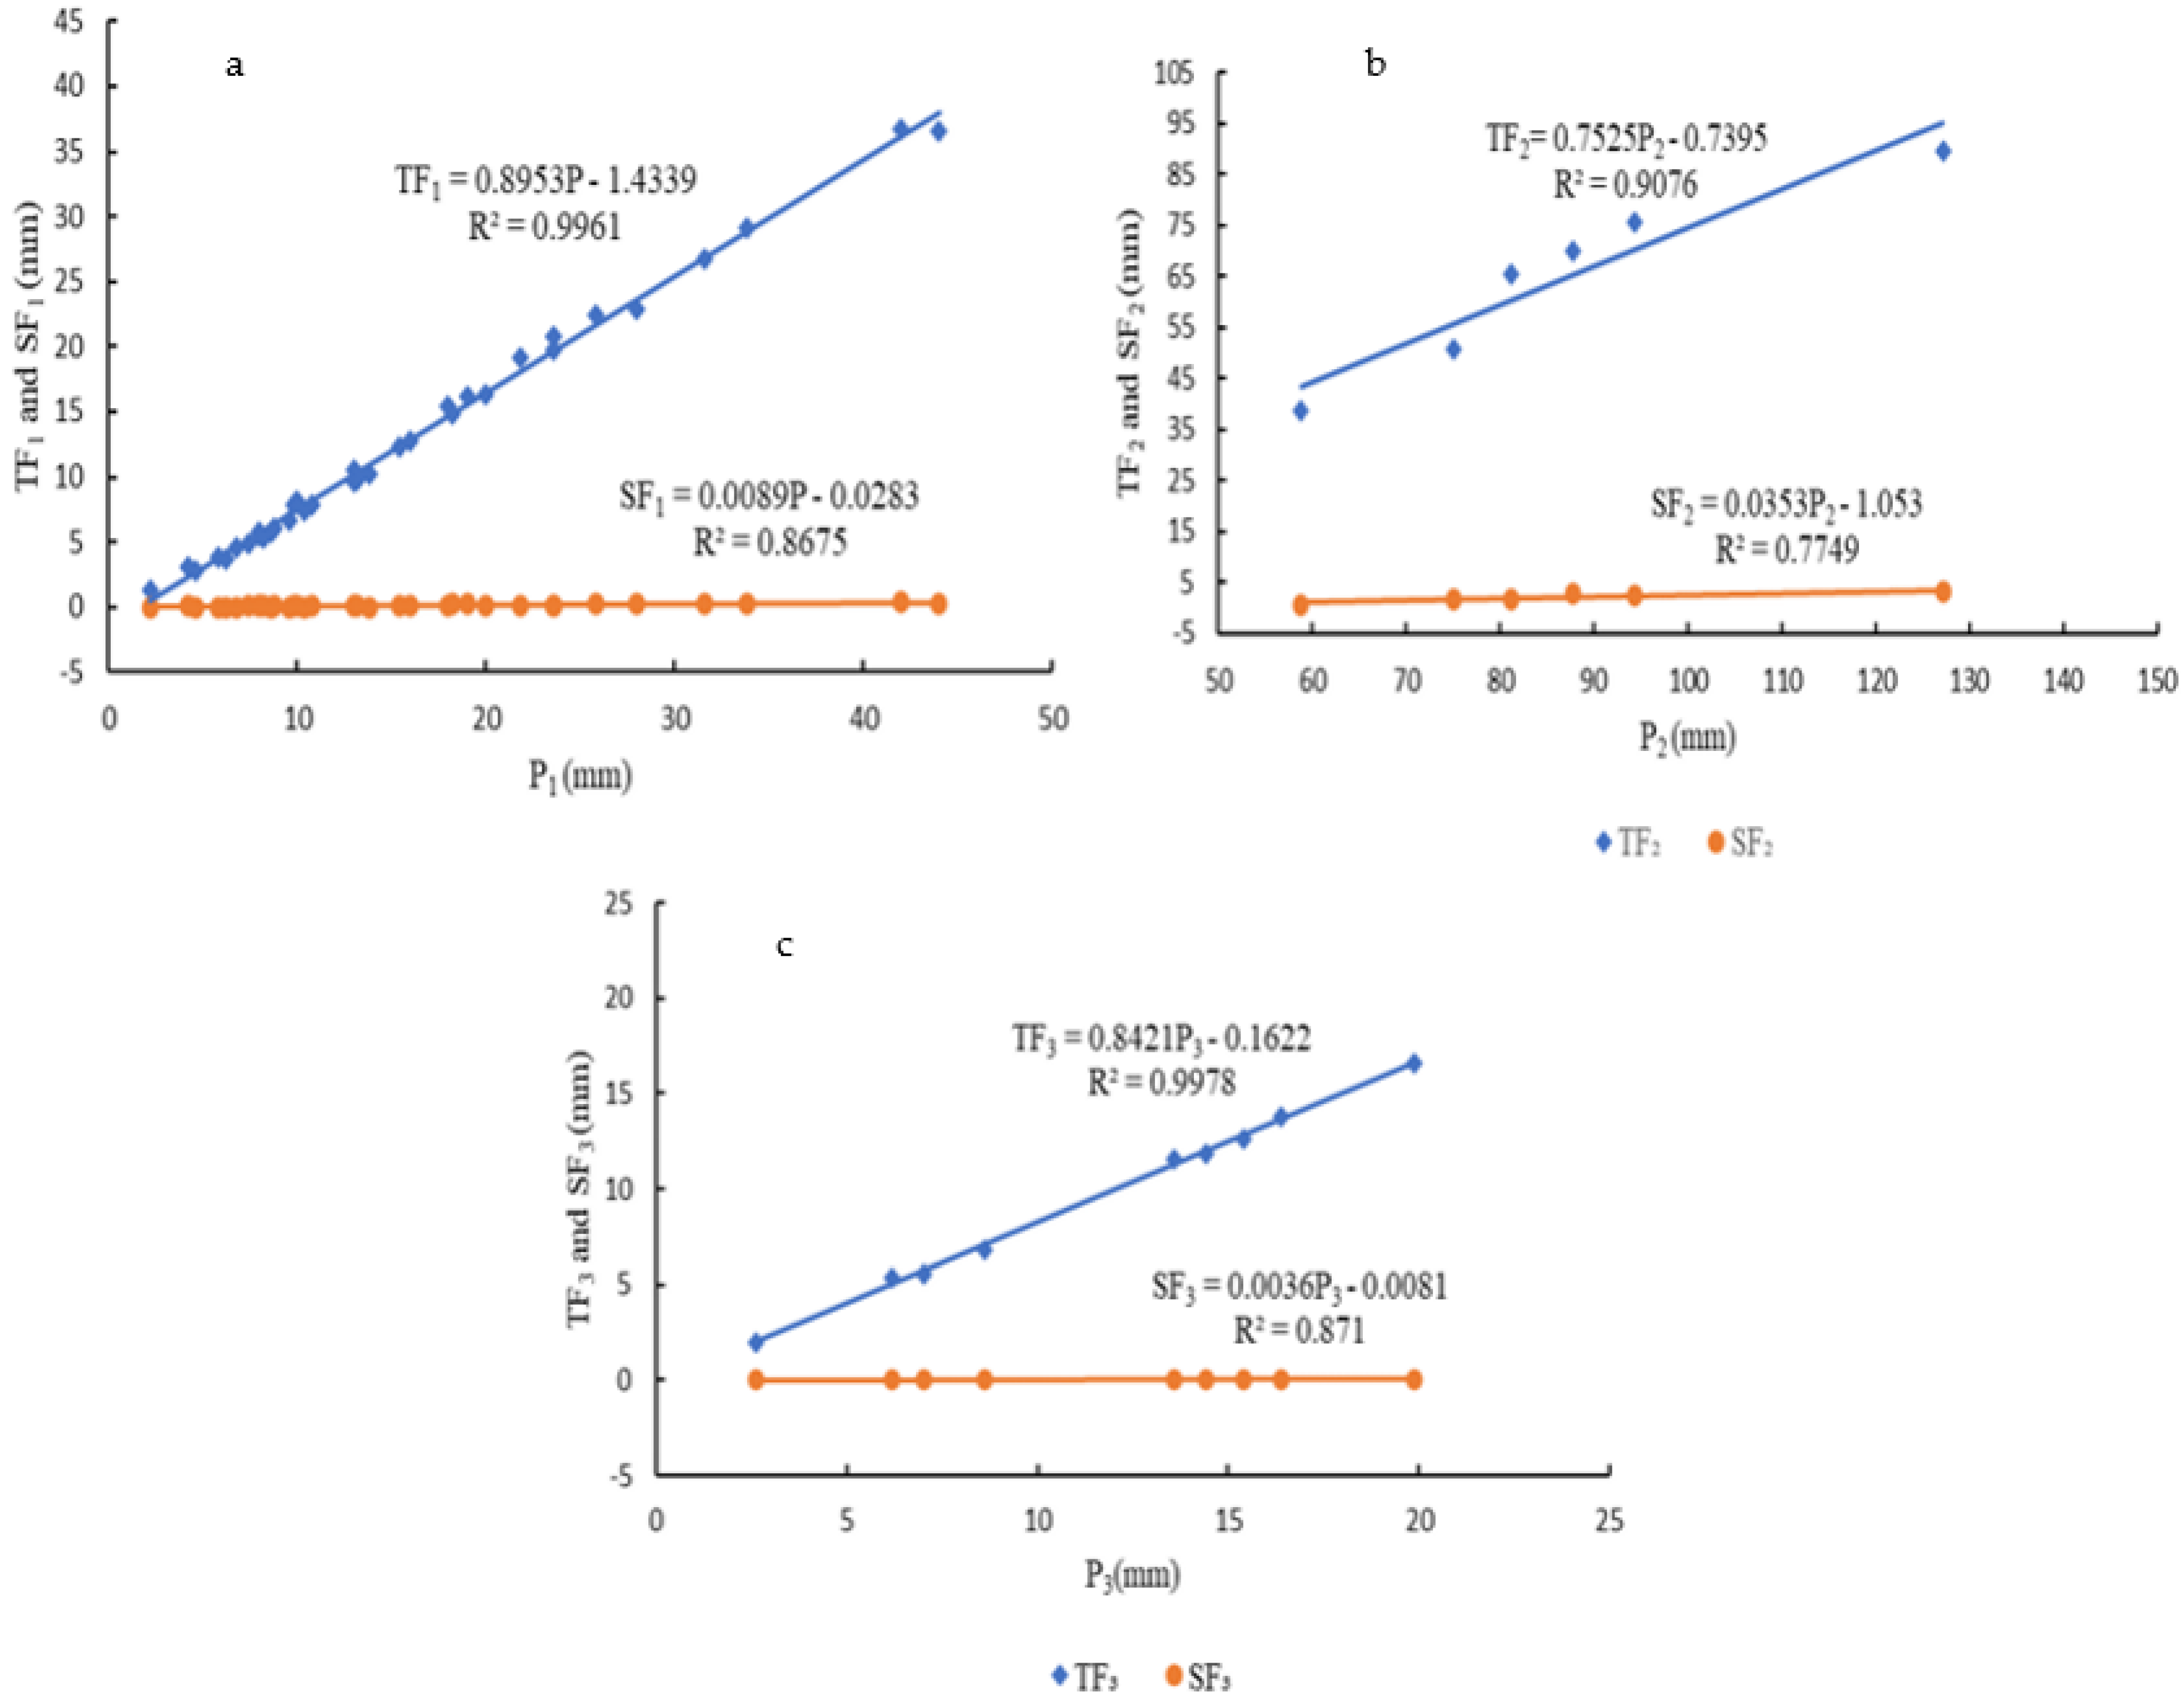
3.2. Parameters Related to Canopy and Stem
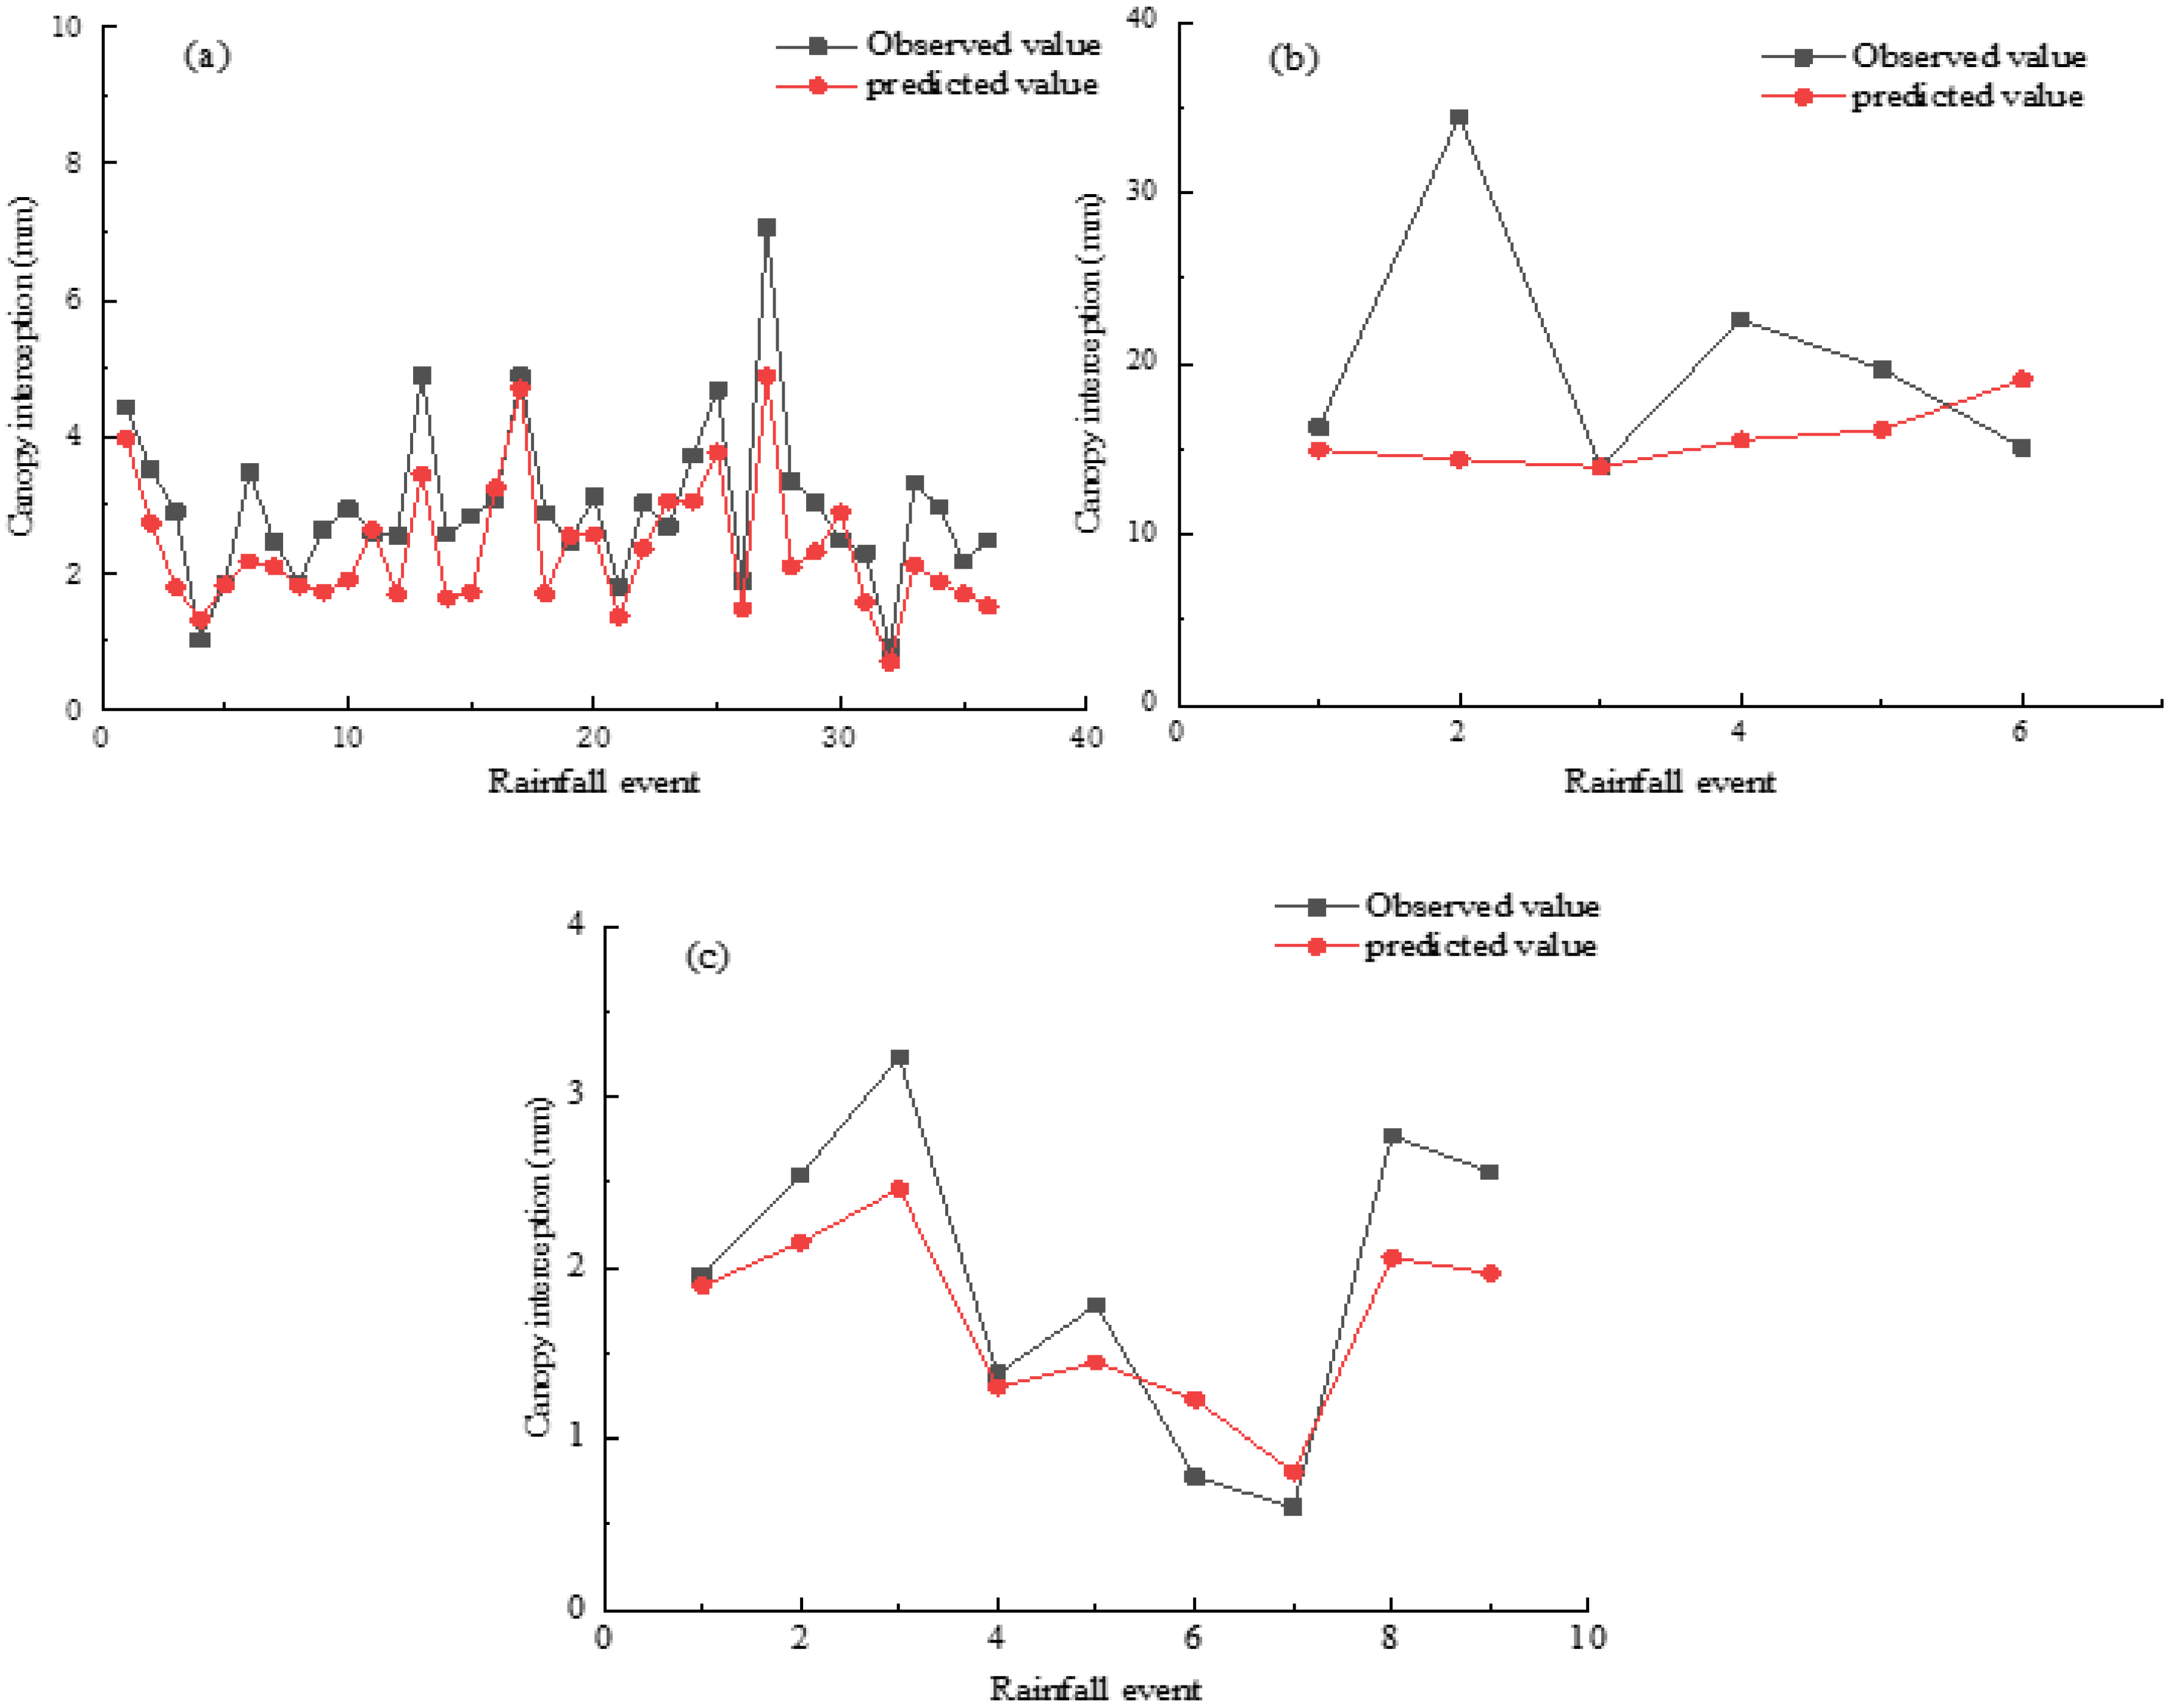
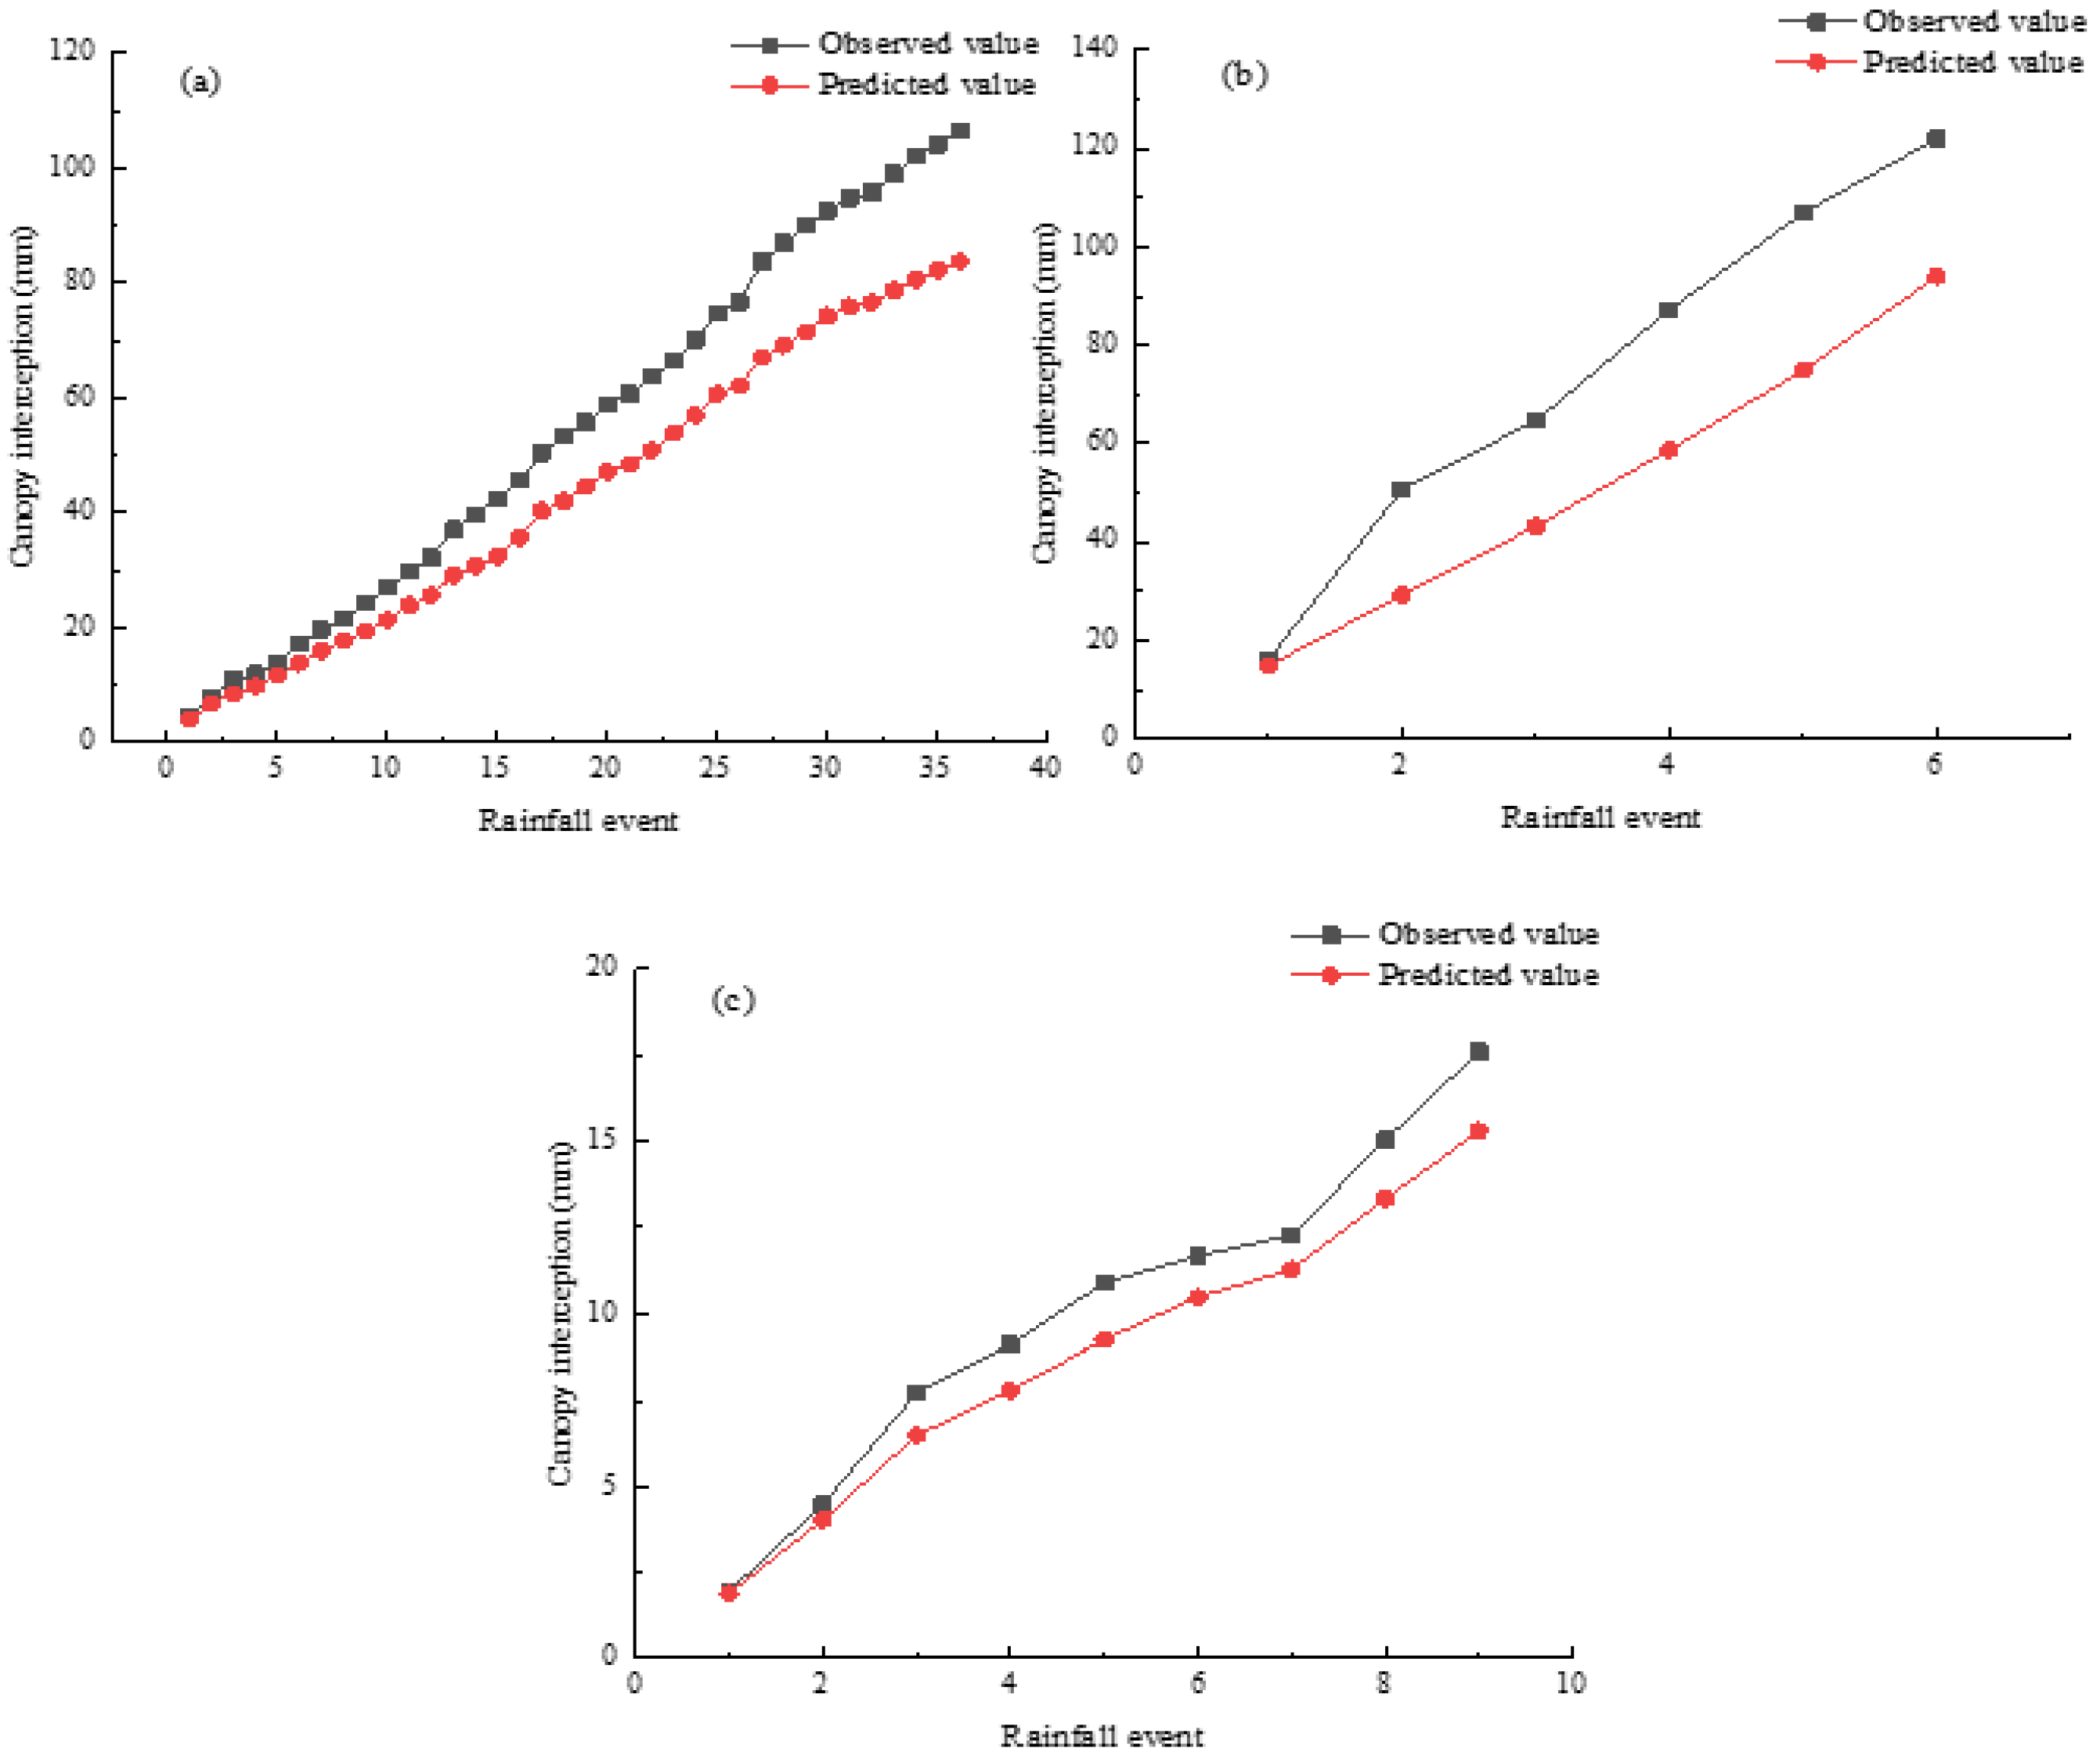
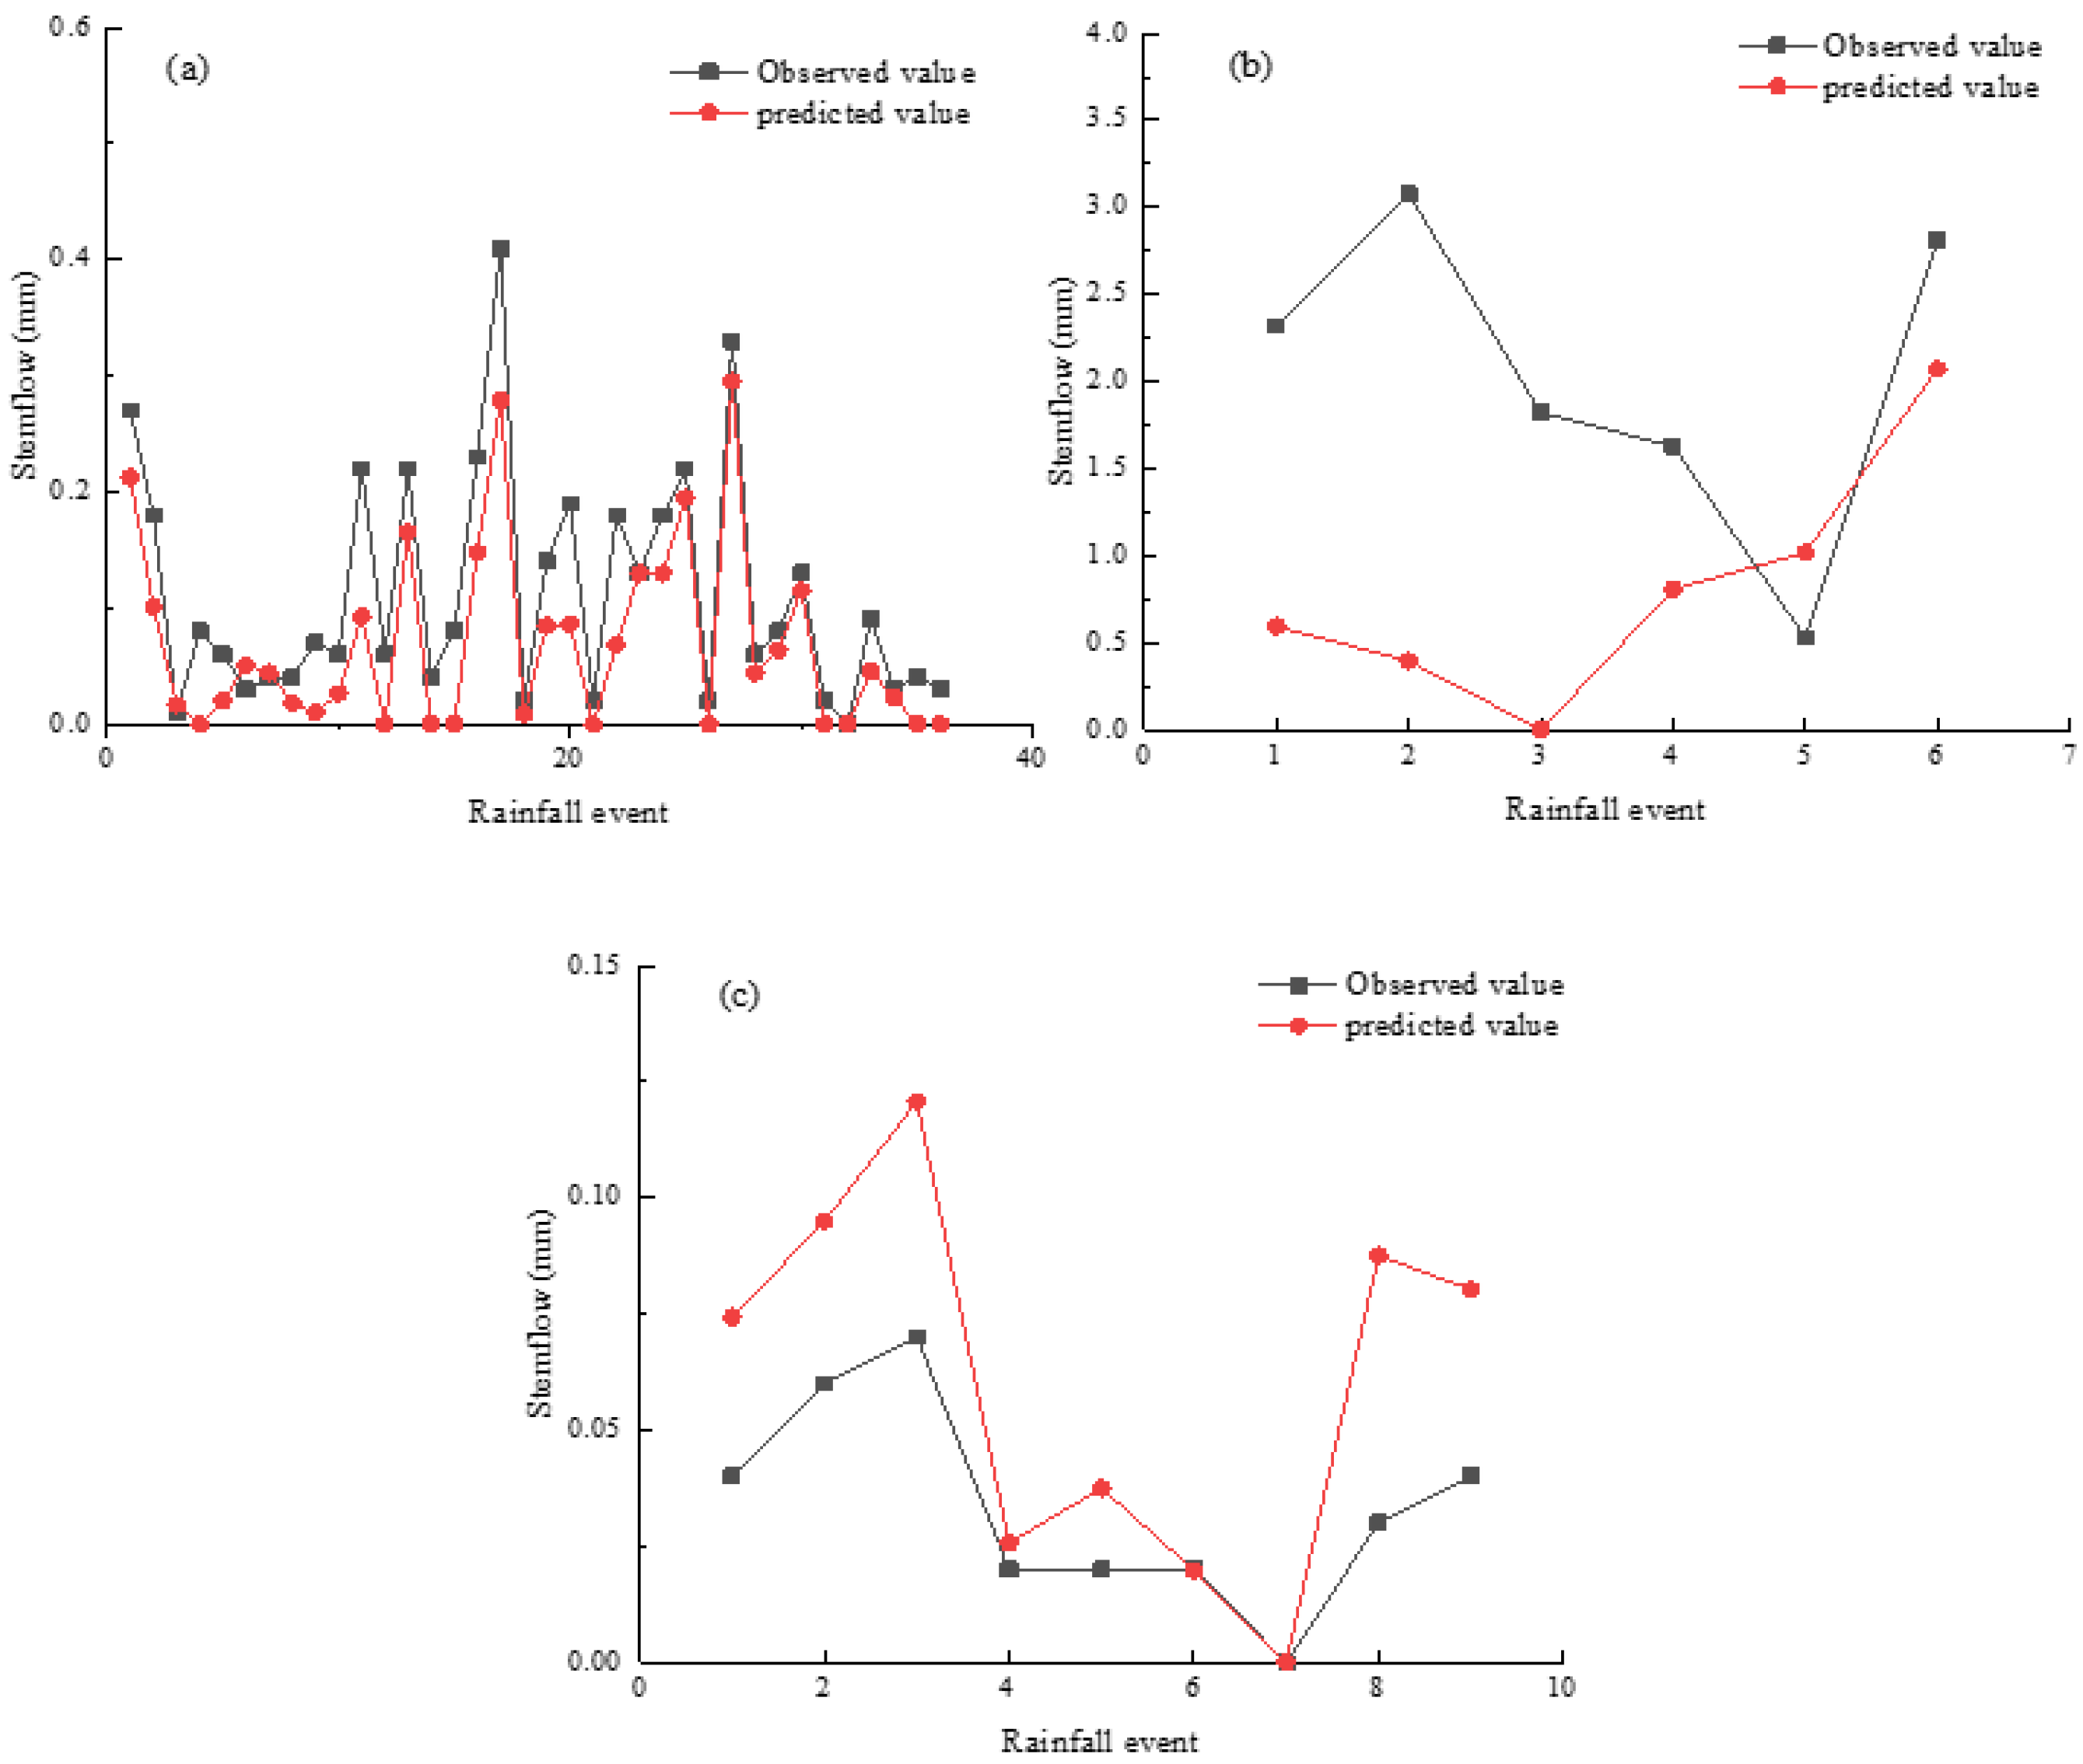
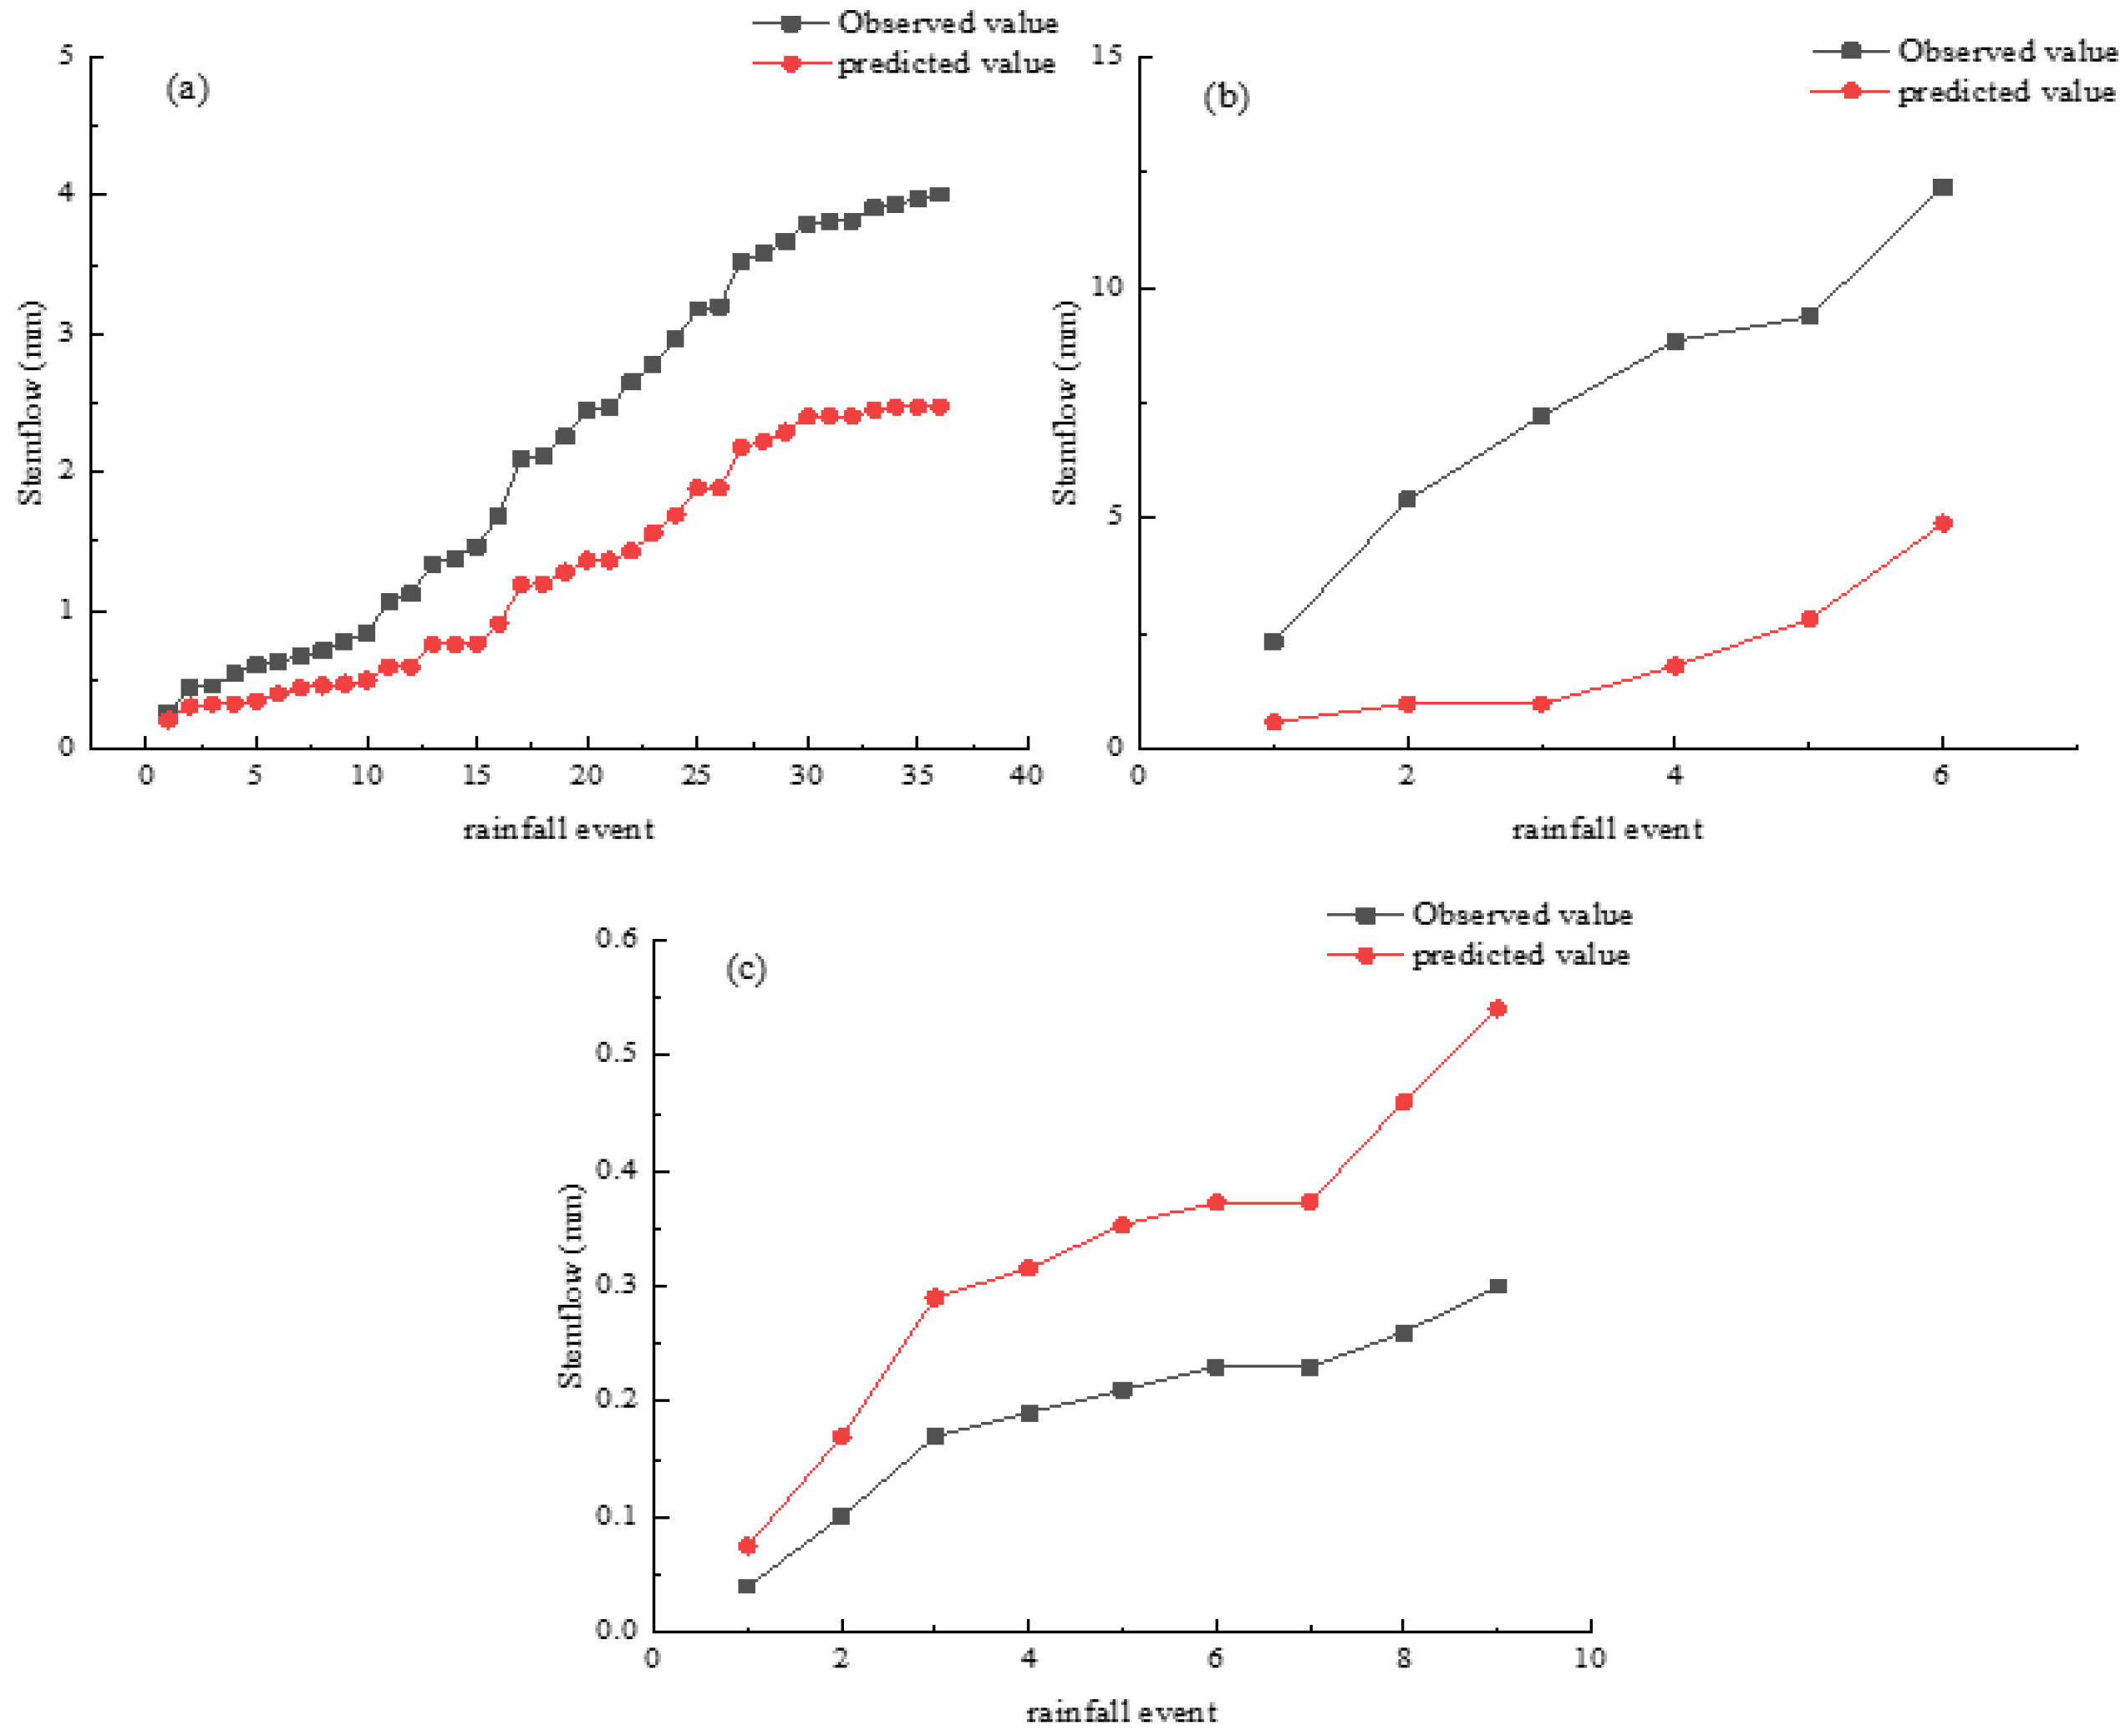
3.3. Model Estimation Results
4. Discussion
4.1. Rainfall Patterns and Characteristics in the Rocky Mountain Areas of Northern China
4.2. Parameters of Revised Gash Model
4.3. Simulation Results of the Revised Gash Model
5. Conclusions
Author Contributions
Funding
Data Availability Statement
Acknowledgments
Conflicts of Interest
References
- Delire, C.; de Noblet-Ducoudré, N.; Sima, A.; Gouirand, I. Vegetation dynamics enhancing long-term climate variability confirmed by two models. J. Clim. 2011, 24, 2238–2257. [Google Scholar] [CrossRef]
- Murray, S.J.; Foster, P.N.; Prentice, I.C. Future global water resources with respect to climate change and water withdrawals as estimated by a dynamic global vegetation model. J. Hydrol. 2012, 448–449, 14–29. [Google Scholar] [CrossRef]
- Fleischbein, K.; Wilcke, W.; Goller, R.; Boy, J.; Valarezo, C.; Zech, W.; Knoblich, K. Rainfall interception in a lower montane forest in Ecuador: Effects of canopy properties. Hydrol. Processes 2005, 19, 1355–1371. [Google Scholar] [CrossRef]
- Sadeghi, S.M.M.; Attarod, P.; Van Stan, J.T.; Pypker, T.G. The importance of considering rainfall partitioning in afforestation initiatives in semiarid climates: A comparison of common planted tree species in Tehran, Iran. Sci. Total Environ. 2016, 568, 845–855. [Google Scholar] [CrossRef]
- Lloyd, C. Spatial variability of throughfall and stemflow measurements in Amazonian rainforest. Agric. For. Meteorol. 1988, 42, 63–73. [Google Scholar] [CrossRef]
- Mahendrappa, M.K. Partitioning of rain water and chemicals into throughfall and stemflow in different forest stands. For. Ecol. Manag. 1990, 30, 65–72. [Google Scholar] [CrossRef]
- Tobon, M.; Bouten, C.W.; Serink, J. Gross rainfall and its portioning into throughfall, stemflow and evaporation of intercepted water in four forest ecosystems in western Amazionia. J. Hydrol. 2000, 237, 40–57. [Google Scholar]
- Johnson, R.C. The interception, throughfall and stemflow in a forest highland in Scotland and the comparison with other upland forests in the UK. J. Hydrol. 1990, 118, 281–287. [Google Scholar] [CrossRef]
- Rowe, L.K. Rainfall interception by an evergreen beech forest, Nelson, New Zealand. J. Hydrol. 1983, 66, 143–158. [Google Scholar] [CrossRef]
- Li, X.; Xiao, Q.; Niu, J. Process-based rainfall interception by small trees in Northern China: The effect of rainfall traits and crown structure characteristics. Agric. For. Meteorol. 2016, 218, 65–73. [Google Scholar] [CrossRef]
- Llorens, P.; Domingo, F. Rainfall partitioning by vegetation under Mediterranean conditions: A review of studies in Europe. J. Hydrol. 2007, 335, 37–54. [Google Scholar] [CrossRef]
- Deng, J.F. Fitting the revised Gash analytical model of rainfall interception to Mongolian Scots pines in Mu Us Sandy Land, China. Trees For. People 2020, 1, 100007. [Google Scholar] [CrossRef]
- Bruijnzeel, L.A. Hydrological functions of tropical forests: Not seeing the soil for the trees. Agric. Ecosyst. Environ. 2004, 104, 185–228. [Google Scholar] [CrossRef]
- Roth, B.E.; Slatton, K.C.; Cohen, M. On the potential for high-resolution LiDAR to improve rainfall interception estimates in forest ecosystems. Front. Ecol. Environ. 2007, 5, 421–428. [Google Scholar] [CrossRef]
- Li, X.Y.; Liu, L.Y.; Gao, S.Y.; Ma, Y.J.; Yang, Z.P. Stemflow in three shrubs and its effect on soil water enhancement in semiarid loess region of China. Agric. For. Meteorol. 2008, 148, 1501–1507. [Google Scholar] [CrossRef]
- Llorens, P.; Latron, J.; Carlyle-Moses, D.E.; Nathe, K.; Chang, J.L.; Nanko, K.; Iida, S.; Levia, D.F. Stemflow infiltration areas into forest soils around American beech (Fagus grandifolia Ehrh.) trees. Ecohydrology 2021, 15, 2369. [Google Scholar] [CrossRef]
- Pinos, J.; Latron, J.; Levia, D.F.; Llorens, P. Drivers of the circumferential variation of stemflow inputs on the boles of Pinus sylvestris L. (Scots pine). Ecohydrology 2021, 14, 2438. [Google Scholar] [CrossRef]
- Hanchi, A.; Rapp, M. Stemflow determination in forest stands. For. Ecol. Manag. 1997, 3, 231–235. [Google Scholar] [CrossRef]
- Zheng, C.L.L.; Jia, L. Global canopy rainfall interception loss derived from satellite earth observations. Ecohydrology 2020, 13, 2. [Google Scholar] [CrossRef]
- Horton, E.R. Rainfall Interception. MWR 1919, 47, 603–623. [Google Scholar] [CrossRef]
- Cui, Y.K.; Zhao, P.; Yan, B.Y.; Xie, H.J.; Yu, P.T.; Wan, W.; Fan, W.J.; Hong, Y. Developing the Remote Sensing-Gash Analytical Model for Estimating Vegetation Rainfall Interception at Very High Resolution: A Case Study in the Heihe River Basin. Remote Sens. 2014, 9, 661. [Google Scholar] [CrossRef]
- Limousin, J.M.; Rambal, S.; Ourcival, J.M.; Joffre, R. Modeling rainfall interception in a Mediterranean Quercus ilex ecosystem: Lesson from a through-fall exclusion experiment. J. Hydrol. 2008, 357, 57–66. [Google Scholar] [CrossRef]
- Sadeghi, S.M.M.; Attarod, P.; Stan, G.T.V.; Pypker, T.G.; Dunkerley, D. Efficiency of the reformulated Gash’s interception model in semiarid afforestations. Agric. For. Meteorol. 2015, 201, 76–85. [Google Scholar] [CrossRef]
- Shi, Z.J.; Wang, Y.H.; Xu, L.H. Fraction of incident rainfall within the canopy of a pure stand of Pinus armandiiith revised Gash model in the Liupan Mountains of China. J. Hydrol. 2010, 2, 1–7. [Google Scholar]
- Cuartas, L.A.; Tomasella, J.; Nobre, A.D.; Hodnett, M.G.; Waterloo, M.J.; Munera, J.C. Interception water-partitioning dynamics for a pristine rainforest in central Amazonia: Marked differences between normal and dry years. Agric. For. Meteorol. 2007, 145, 69–83. [Google Scholar] [CrossRef]
- Bolanos-Sanchez, C.; Prado-Hernandez, J.V.; Silvan-Cardenas, J.L.; Vazquez-Pena, M.A.; Madrigal-Gomez, J.M.; Martinez-Ruiz, A. Estimating Rainfall Interception of Pinus hartwegii and Abies religiosa Using Analytical Models and Point Cloud. Forests 2021, 12, 866. [Google Scholar] [CrossRef]
- Eliades, M.; Bruggeman, A.; Djuma, H.; Christou, A.; Rovanias, K.; Lubczynski, M.W. Testing three rainfall interception models and different parameterization methods with data from an open Mediterranean pine forest. Agric. For. Meteorol. 2022, 313, 108755. [Google Scholar] [CrossRef]
- Attarod, P.; Sadeghi, S.M.M.; Pypker, T.G.; Bagheri, H.; Bagheri, M.; Bayramzadeh, V. Needle-leaved trees impacts on rainfall interception and canopy storage capacity in an arid environment. New For. 2015, 46, 339–355. [Google Scholar] [CrossRef]
- Seyed, M.M.S.; Pedram, A.; Thomas, G.P.; David, D. Is canopy interception increased in semiarid tree plantations? Evidence from a field investigation in Tehran, Iran. Turk. J. Agric. For. 2014, 38, 792–806. [Google Scholar]
- Gong, W.F.; Liu, T.D.; Duan, X.Y.; Sun, Y.X.; Zhang, Y.Y.; Tong, X.Y.; Qiu, Z.X. Estimating the Soil Erosion Response to Land-Use Land-Cover Change Using GIS-Based RUSLE and Remote Sensing: A Case Study of Miyun Reservoir, North China. Water 2022, 14, 742. [Google Scholar] [CrossRef]
- Wang, X.; Hao, G.L.; Yang, Z.F.; Liang, P.Y.; Cai, Y.P.; Li, C.H.; Sun, L.; Zhu, J. Variation analysis of streamflow and ecological flow for the twin rivers of the Miyun Reservoir Basin in northern China from 1963 to 2011. Sci. Total Environ. 2015, 536, 739–749. [Google Scholar] [CrossRef] [PubMed]
- Yin, Q.; Wang, Y.; Xie, Y.; Liu, A. Characteristics of intra-strom temporal pattern over China. Adv. Water Sci. 2014, 25, 617–624. (In Chinese) [Google Scholar]
- Zhen, F.; Bian, F.; Lu, J.; Tan, C.; Xu, X. Effects of rainfall patterns on hillslope erosion with longitudinal ridge in typical black soil region of northeast China. Trans. Chin. Soc. Agric. Mach. 2016, 47, 90–97. (In Chinese) [Google Scholar]
- Zhou, Z.; Wang, L.; Wang, X.; Ma, H.; Li, M. Rainfall characteristics and their effects on slope erosion in western loess hilly region. Bull. Soil Water Conserv. 2014, 34, 24–27. (In Chinese) [Google Scholar]
- Keifer, C.J.; Chu, H.H. Synthetic storm pattern for drainage design. J. Hydraul. Div. ASCE 1957, 83, 1–25. [Google Scholar] [CrossRef]
- Pilgrim, D.H.; Cordery, I. Rainfall temporal patterns for design floods. J. Hydraul. Div. 1975, 101, 81–95. [Google Scholar] [CrossRef]
- Huff, F.A. Time distribution of rainfall in heavy storms. Water Resour. Res. 1967, 3, 1007–1019. [Google Scholar] [CrossRef]
- Yen, B.C.; Chow, C.T. Design hyetographs for small drainage structures. ASCE J. Hydraul. Div. 1980, 106, 1055–1076. [Google Scholar] [CrossRef]
- Fang, H.Y.; Cai, Q.G.; Chen, H.; Li, Q.Y. Effect of rainfall regime and slope on runoff in a gullied loess region on the loess plateau in China. Environ. Manag. 2008, 42, 402–411. [Google Scholar] [CrossRef]
- Wu, L.; Wang, Y.; Wang, C.; Wang, Y.; Wang, B. Effect of rainfall patterns on hillslope soil erosion in rocky mountain area of north China. Trans. Chin. Soc. Agric. Eng. 2017, 33, 157–164. (In Chinese) [Google Scholar]
- Zhang, J.J.; Sun, Z.B.; Chen, S.J. A pattern classification of the mean pentad circulations at 500 mb level over East Asia. Acta Meteorol. Sin. 1984, 42, 311–319. [Google Scholar]
- Ye, H.Z. Establishment and selection of regionalized Gauss-Markov hyetograph. Resour. Sci. 2004, 26, 44–53. [Google Scholar]
- Gash, J.H.C. An analytical model of rainfall interception in forest. Q. J. R. Meteorol. Soc. 1979, 105, 43–55. [Google Scholar] [CrossRef]
- Van Dijk, A.I.J.M.; Bruijnzeel, L.A. Modelling rainfall interception by vegetation of variable density using an adapted analytical model. J. Hydrol. 2001, 247, 239–262. [Google Scholar] [CrossRef]
- Lankreijer, H.; Hendriks, M.J.; Klaassen, W. A comparison of models simulating rainfall interception of forests. Agric. For. Meteorol. 1993, 64, 187–199. [Google Scholar] [CrossRef]
- Teklehaimonot, Z.; Jarvis, P.G. Modelling of rainfall interception loss on agroforestry systems. Agric. Sys. 1991, 14, 65–80. [Google Scholar] [CrossRef]
- Wen, J.L. Short Communication. Simulation of gash model to rainfall interception of Pinus tabulaeformis. For. Syst. 2014, 23, 300–303. [Google Scholar]
- Valente, F.; David, J.J.M.; Gash, J.H.C. Modeling interception loss for two sparse eucalypt and pine forests in central Portugal using reformulated Rutter and Gash analytical models. J. Hydrol. 1997, 190, 141–162. [Google Scholar] [CrossRef]
- Wallance, J.; McJannet, D. On interception modeling of a lowland coastal rainforest in northern Queensland Australia. J. Hydrol. 2006, 329, 477–488. [Google Scholar] [CrossRef]
- Wang, Y.P.; Wang, L. Modeling canopy rainfall interception of a replanted Robinia pseudoacacia forest in the Loess Plateau. Acta Ecol. Sin. 2012, 32, 5445–5453. [Google Scholar] [CrossRef]
- Liu, S. Estimation of rainfall storage capacity in the canopies of cypress wetlands and slash pine uplands in North Central Florida. J. Hydrol. 1998, 207, 32–41. [Google Scholar] [CrossRef]
- Deguchi, A.; Hattori, S.; Park, H.T. The influence of seasonal changes in canopy structure on interception loss: Application of the revised Gash model. J. Hydrol. 2006, 318, 80–102. [Google Scholar] [CrossRef]
- Llorens, P.; Poch, R.; Latron, J. Rainfall interception by a Pinus sylventris forest patch overgrown in a Mediterranean moun tainous abandoned area. J. Hydrol. 1997, 199, 331–345. [Google Scholar] [CrossRef]
- Wang, L.; Zhang, Q.F.; Shao, M.A.; Wang, Q.J. Rainfall Interception in a Robinia pseudoacacia Forest Stand: Estimates Using Gash’s Analytical Model. J. Hydrol. Eng. 2013, 18, 474–479. [Google Scholar] [CrossRef]


| Types | Plot Size (m2) | Average Crown Closure | Height (m) | DBH (cm) | Crown Width (m) | Basal Area (m2/ha) |
|---|---|---|---|---|---|---|
| P. tabulaeformis | 4279.30 | 0.31 | 2.72 | 11.30 | 1.55 | 0.54 |
| Rainfall Patterns | Variable Characteristics | Number of Events | Percentage of Rainfall Events | |||
|---|---|---|---|---|---|---|
| P (mm) | T (h) | I (mm/h) | ||||
| A | Total | 1217.4 | 367.0 | 572.2 | 105 | 87.5% |
| Mean (SE) | 11.6 (+1.01) | 3.5 (+0.26) | 5.4 (+0.53) | |||
| V25 | 3.6 | 1.2 | 1.7 | |||
| V75 | 16.4 | 5.2 | 6.6 | |||
| B | Total | 524.4 | 59.8 | 94.0 | 6 | 5% |
| Mean (SE) | 87.4 (+8.57) | 10.0 (+2.57) | 15.7 (+5.19) | |||
| V25 | 76.6 | 4.5 | 6.3 | |||
| V75 | 92.8 | 12.8 | 23.1 | |||
| C | Total | 104.1 | 2.8 | 369.7 | 9 | 7.5% |
| Mean (SE) | 11.6 (+1.79) | 0.3 (+0.05) | 41.1 (+6.49) | |||
| V25 | 7.0 | 0.18 | 28.7 | |||
| V75 | 15.4 | 0.33 | 41.2 | |||
| Rainfall Pattern | Linear Equation | R2 |
|---|---|---|
| A | TF1 = 0.8953P − 1.4339 | 0.9961 |
| B | TF2 = 0.7525P2 − 0.7395 | 0.9076 |
| C | TF3 = 0.8421P3 − 0.1622 | 0.9978 |
| Rain Patterns | Linear Equation | R2 |
|---|---|---|
| A | SF1 = 0.0089P − 0.0283 | 0.8675 |
| B | SF2 = 0.0353P2 − 1.053 | 0.7749 |
| C | SF3 = 0.0036P3 − 0.0081 | 0.871 |
| Components | Rainfall Patterns | |||||
|---|---|---|---|---|---|---|
| A | B | C | ||||
| Observed values (mm) | Predicted values (mm) | Observed values (mm) | Predicted values (mm) | Observed values (mm) | Predicted values (mm) | |
| For rainfall PG < P′G | / | 0.682 | / | 0 | / | 0.81 |
| For rainfall PG ≥ P′G | / | 6.764 | / | 8.53 | / | 1.15 |
| Evaporation from canopy during rainfall | / | 37.691 | / | 31.05 | / | 6.95 |
| Evaporation after rainfall | / | 37.321 | / | 47.09 | / | 6.36 |
| Evaporation from trunk for PG ≥ P″G | / | 0.73 | / | 5.27 | / | 0.03 |
| Evaporation from trunk for PG < P″G | / | 0.53 | / | 2.08 | / | 0 |
| Canopy interception | 106.59 | 83.72 | 122.01 | 94.02 | 17.6 | 15.3 |
| Stemflow | 4.01 | 2.47 | 12.19 | 4.89 | 0.3 | 0.54 |
| Throughfall | 452.6 | 477 | 390.2 | 425.5 | 86.2 | 88.26 |
| Components | Rainfall Patterns | |||
|---|---|---|---|---|
| A | B | C | ||
| Rainfall numbers | 36 | 6 | 9 | |
| Maximum rainfall(mm) | 44 | 127.2 | 19.9 | |
| Minimum rainfall(mm) | 2.2 | 58.8 | 2.6 | |
| Average rainfall (mm) | 15.64 | 87.4 | 11.57 | |
| Total rainfall (mm) | 563.2 | 524.4 | 104.1 | |
| Canopy interception | Total observed (mm) | 106.59 | 122.01 | 17.6 |
| Total predicted (mm) | 83.72 | 94.02 | 15.3 | |
| RMSE | 0.85 | 8.96 | 0.47 | |
| CE | 0.44 | 0.4 | 0.7 | |
| R (unitless) | 0.87 ** | 0.53 | 0.97 ** | |
| Stemflow | Total observed (mm) | 4.01 | 12.19 | 0.3 |
| Total predicted (mm) | 2.47 | 4.89 | 0.54 | |
| RMSE | 0.056 | 1.58 | 0.03 | |
| CE | 0.67 | 0.72 | 0.62 | |
| R (unitless) | 0.93 ** | 0.84 | 0.93 ** | |
Publisher’s Note: MDPI stays neutral with regard to jurisdictional claims in published maps and institutional affiliations. |
© 2022 by the authors. Licensee MDPI, Basel, Switzerland. This article is an open access article distributed under the terms and conditions of the Creative Commons Attribution (CC BY) license (https://creativecommons.org/licenses/by/4.0/).
Share and Cite
Qian, Y.; Shi, C.; Zhao, T.; Lu, J.; Bi, B.; Luo, G. Canopy Interception of Different Rainfall Patterns in the Rocky Mountain Areas of Northern China: An Application of the Revised Gash Model. Forests 2022, 13, 1666. https://doi.org/10.3390/f13101666
Qian Y, Shi C, Zhao T, Lu J, Bi B, Luo G. Canopy Interception of Different Rainfall Patterns in the Rocky Mountain Areas of Northern China: An Application of the Revised Gash Model. Forests. 2022; 13(10):1666. https://doi.org/10.3390/f13101666
Chicago/Turabian StyleQian, Yunkai, Changqing Shi, Tingning Zhao, Jinsheng Lu, Biao Bi, and Guangtian Luo. 2022. "Canopy Interception of Different Rainfall Patterns in the Rocky Mountain Areas of Northern China: An Application of the Revised Gash Model" Forests 13, no. 10: 1666. https://doi.org/10.3390/f13101666
APA StyleQian, Y., Shi, C., Zhao, T., Lu, J., Bi, B., & Luo, G. (2022). Canopy Interception of Different Rainfall Patterns in the Rocky Mountain Areas of Northern China: An Application of the Revised Gash Model. Forests, 13(10), 1666. https://doi.org/10.3390/f13101666