Article

Modeling Climate Effects on Site Productivity of Plantation Grown Jack Pine, Black Spruce, Red Pine, and White Spruce Using Annual/Seasonal Climate Values

Ontario Forest Research Institute, Ontario Ministry of Natural Resources and Forestry, 1235 Queen St. East, Sault Ste Marie, ON P6A 2E5, Canada
Forests 2022, 13(10), 1600; https://doi.org/10.3390/f13101600
Submission received: 29 August 2022 / Revised: 23 September 2022 / Accepted: 27 September 2022 / Published: 30 September 2022
(This article belongs to the Special Issue Modeling Forest Response to Climate Change)

Abstract

:
Site index (SI) is a commonly used measure of forest site productivity and is affected by climate change. Therefore, climate effects on site productivity were analyzed and modeled for jack pine (Pinus banksiana Lamb.), black spruce (Picea mariana (Mill.) B.S.P.), red pine (Pinus resinosa Ait.), and white spruce (Picea glauca (Moench) Voss) plantations using annual/seasonal values of climate variables. Jack pine and black spruce trees were each sampled from 25 plantations (sites), and red pine and white spruce trees were sampled from 30 and 31 plantations, respectively, from across Ontario, Canada. Stem analysis data collected from 201 jack pine, 211 black spruce, 90 red pine, and 93 white spruce trees were used in this study. To analyze and model climatic effects on site productivity, parameters of the stand height models were expressed in terms of climate variables. A nonlinear mixed-effects modelling approach was applied to fit the stand height models. Climate effects on site productivity was evaluated by predicting stand heights in three areas (the central, eastern/southeastern, and western parts of Ontario) for the period 2021 to 2080 under three emissions trajectories (representative concentration pathways (RCP) 2.6, 4.5, and 8.5 watts m−2). Climate effects on site productivity depended on tree species and location. For jack pine, climate effects were positive and pronounced only in western Ontario under all emissions scenarios. The effects were negative and mild after breast height age (BHA) 50 in central Ontario for black spruce. Similarly, the effects were negative and more pronounced at all areas after BHA 35 for red pine. On the other hand, for white spruce the effects were negative and highly pronounced from a young age under all scenarios, mainly in the southeast. For all species except for jack pine, climate effects were more pronounced under RCP 8.5 than the other two scenarios.

1. Introduction

Site productivity influences growth, mortality, and recruitment of trees in a stand [1]. It is commonly measured in terms of a site index (SI), with SI defined as stand height (average height of dominant and codominant trees) at a specified stand age [2]. Most stand scale growth and yield models that are used in developing forest management plans are driven by SI. Consequently, accurate SI estimates are fundamental for informed forest management decisions.
The site index depends on species, site, growing environment, and climate [3]. Researchers have used different approaches to examine and model climate effects on site productivity. Some have regressed SI in terms of climate/environmental variables directly [4,5,6,7]. However, Ung et al. [5] indicated that linear relationships between the SI and biophysical variables were inadequate for use in growth and yield models.
Similarly, Albert and Schmidt [6] found less than 40% variation in SI explained by biophysical variables for Norway spruce (Picea abies (L.) Karst.) and common beech (Fagus sylvatica L.) trees in Lower Saxony, Germany. On the other hand, Weiskittel et al. [7] reported that 68% of the variability in SI was explained by climate-related variables for tree species grown in western U.S. forests.
Bergh et al. [8] used a process-based simulation model, to compute and compare the effect of increased temperature on net primary productivity (NPP) for Norway spruce (Picea abies), Scots pine (Pinus sylvestris), black cottonwood (Populus trichocarpa), and European beech (Fagus sylvatica) growing in the Nordic countries (Finland, Denmark, Norway, Iceland, and Sweden). Their results showed that if the temperature is increased by 4 degrees C, Norway spruce and Scots pine NPP would increase by 24%–37% in spring. In another study, Pedlar and McKenney [9] used published and provenance trial data to assess the estimated growth response of five northern conifers to climate change. They reported that climate warming could have a significant positive effect on cold-origin (northern) populations, but negative effects on warm-origin (southern) populations. Similarly, Guo et al. [10] investigated local adaptation process of bud phenology of five black spruce populations originating from the latitudinal range of boreal forest. They found a relationship between bud phenology and the mean annual temperature at the sites of tree origin.
Since climate is not the sole factor influencing site productivity, SI expressed solely in terms of climate variables would not provide accurate estimates of forest site productivity. To improve model efficiency, other researchers defined the parameters of SI models in terms of climate- and site-related variables [11,12,13]. However, other than stating that incorporating biophysical variables (including climate) improved fit statistics, these researchers did not quantify the magnitude and nature (positive or negative) of climate effects on site productivity.
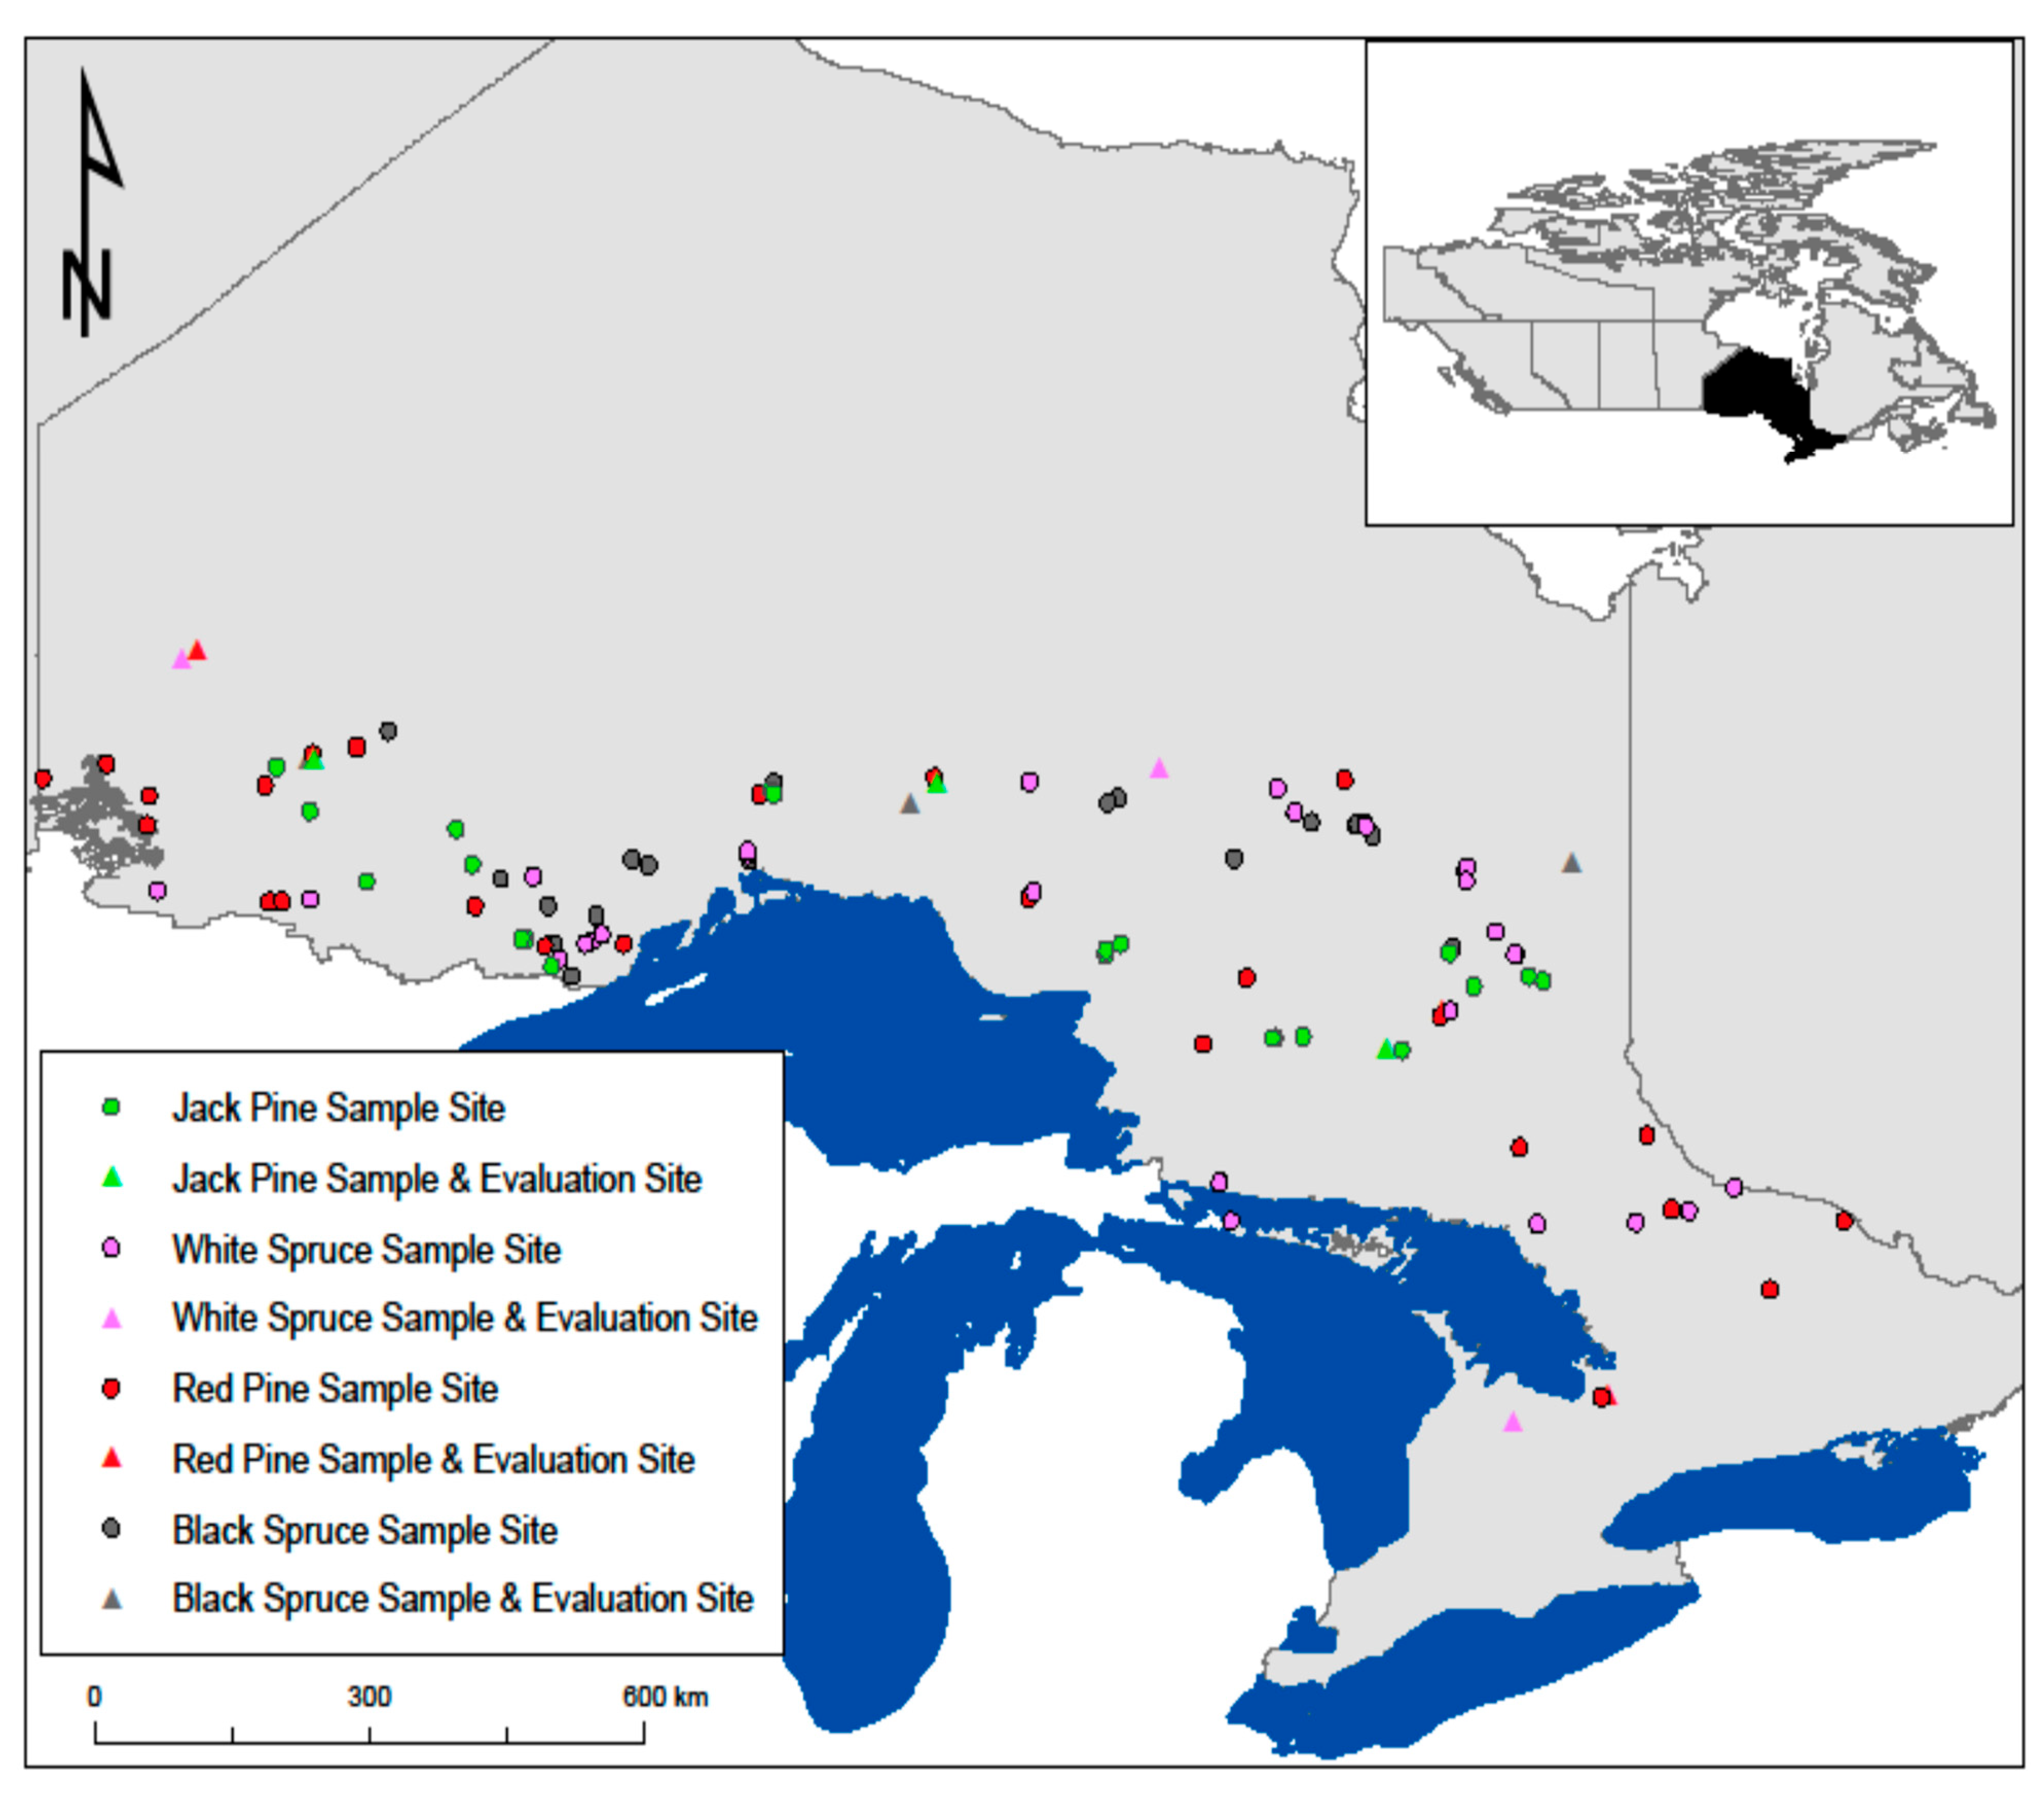
Recently, stand height growth/SI models have been developed by incorporating climate variables in stand height growth models for several tree species in Ontario, Canada: plantation grown jack pine (Pinus banksiana Lamb.) and black spruce (Picea mariana Mill. B.S.P.) [14], red pine (Pinus resinosa Ait.) [15], white spruce (Picea glauca (Moench) Voss) [16], and white pine (Pinus strobus L.) [3] and natural origin mixed stands of jack pine and black spruce [17] and black spruce and trembling aspen (Populus tremuloides Michx.) [18].
When climate-sensitive SI models were developed for jack pine, black spruce, red pine, and white spruce plantations, only 30-year average values of climate variables were available for evaluation [14,15,16]. Therefore, the average values of climate variables over the lifespan of sample trees were used to develop climate-sensitive stand height growth/SI models for these tree species. These models were evaluated using projected average values of climate variables significant in the models for a 30-year period under different climate change scenarios.
However, in the case of white pine plantations and natural origin mixed stands, annual and seasonal values of climate variables were available for past and future growth periods. Past and future annual/seasonal values of index variables derived from climate-related variables (e.g., climatic moisture index) were also available. Therefore, Sharma and Parton [3] and Sharma [17,18] analyzed climate effects on site productivity of these tree species using annual/seasonal values of temperature- and precipitation-related climate and derived variables and developed climate-sensitive stand height growth/SI models for these plantations and mixed stands. In these studies, model evaluation included the use of projected annual/seasonal values of climate variables for a future 80-year growth period under three climate change scenarios.
Since the values of climate variables fluctuate every year/season, it is intuitive to use annual/seasonal values of climate variables to examine and model climate effects on site productivity. Models developed using annual/seasonal values of original and derived climate variables will provide more accurate information about the climate effects on tree growth than those developed using the average values over the period of tree growth. Therefore, the objectives of this study were to derive stand height growth/SI models for jack pine, red pine, black spruce, and white spruce plantations by incorporating yearly/seasonal values of climate variables and to assess the effects of future climate scenarios on stand height growth of these tree species using projected yearly/seasonal values of climate variables.

2. Methods

2.1. Height and Age Data

Data used in this study were collected from jack pine, red pine, black spruce, and white spruce trees grown in plantations. Twenty-five even-aged monospecific plantations were sampled for each of jack pine and black spruce. Similarly, 30 and 31 monospecific plantations were sampled for red pine and white spruce, respectively. These plantations were selected from across the species’ range [19] in Ontario (Figure 1). Details of sampling trees and collecting stem analysis data have been provided in studies by Sharma et al. [14] for jack pine and black spruce and Sharma and Parton [15,16] for red pine and white spruce.
Height growth of all tree species used in this study was erratic before trees reached breast height [14,15,16]. Therefore, unless otherwise specified, height from breast height and age from breast height (breast height age, BHA) were used for all analyses reported in this study. As a result, tree height refers to height above breast height and age to BHA.
Since height growth below breast height was irregular, BHA of trees sampled from three plots at a site did not necessarily reach a particular BHA during the same calendar year. Combining the growth series from the three plots would result in averaging height growth across years, precluding analysis of climate effects on stand height growth (mean height of three trees sampled from a site) using a climate variable value associated with a specific calendar year. Therefore, in this study growth series from the three plots at each site were not combined to obtain site-scale estimates.
Observed heights were plotted against their ages to form height–age curves for each tree. Trees for which curves indicated possible injuries or early height growth suppression were discarded. This resulted in 201 and 211 jack pine and black spruce trees, respectively, to be used for analysis. None of red pine or white spruce trees sampled had any noticeable defect, so all trees (90 and 93 for red pine and white spruce, respectively) were used in analyzing climate effects and developing stand height/SI models. Summary statistics for total age, total height, diameter at breast height (DBH), and BHA for the trees used in this study are presented in Table 1.

2.2. Climate Data

All climate variables for each plot location for each tree species were estimated using Canadian climate models [20]. These models were generated from continuous climate grids using ANUSPLINE based on corrected Canadian weather station data [21,22], which includes many stations in Ontario. For each plot location, estimates of average seasonal and yearly values of these variables were calculated for each year, starting when the sampled tree reached breast height, until 2018.
A total of 68 climate-related variables were computed, including minimum, mean, and maximum air temperatures and total precipitation, estimated for each month of the year, for each quarter (consecutive three-month periods), and annually. The 68 variables also included longitude, latitude, and elevation (site-related variables). Details of calculating climate data were documented by Sharma et al. [14] and Sharma and Parton [15,16]. In addition, potential evapotranspiration (PET) was subtracted from mean monthly precipitation (MMP) to estimate climatic moisture index (CMI) for each year (see [23]). These values were also calculated for each plot for each species.
Total or partial CMI values were then computed by summing the 12-month or partial-month (months for which CMI was significant in the regression) values of CMI for each year for each sample site. Estimates for all climate variables were provided by Dan McKenney (Canadian Forest Service, 2018, pers. comm.). Summary statistics of climate variables that explained the variation in stand height growth of jack pine, black spruce, red pine, and white spruce plantations are included in Table 1.

2.3. Stand Height/Site Index Equations

Sharma et al. [14] and Sharma and Parton [15,16] evaluated variants of Chapman-Richards and Hossfeld IV functions for the tree species used in this study and found a variant of the Hossfeld IV function (Equation (1)), also known as McDill–Amateis growth function (see [24] p. 126), provided the best fit statistics (R2 and MSE). This variant also produced the most consistent and biologically realistic height estimates across productivity classes for all four species studied. The variant (model form) was:
H = α 0 1 1 α 0 H 1 A 1 A α 1 + ε
where H and H1 are stand heights (from breast height) at BHAs A and A1, respectively, α0 and α1 are model parameters and ε is the error term. This model form was used in this study as the base function to examine and model climate effects on stand height growth. In general, α0 defines the asymptote of the curve, and α1 determines the shape. α1 is also called the rate parameter that determines the growth rate. To analyze and model the climate effects on stand height growth, the asymptote and rate parameter (α0 and α1, respectively) in Equation (1) were expressed in terms of climate variables.

2.4. Model Fitting and Evaluation

The data used in this study came from stem analysis. These data are hierarchical (i.e., height–age series within sites), resulting in two sources of variation: among sites and within a site. Observations within a site (height–age series) (correlated) are dependent as they originate from the same tree. However, observations among sites are independent. To address the problem of autocorrelation, a mixed-effects modelling approach was used to fit the stand height growth model for all tree species.
To examine and model climate effects on site productivity, climate- and site-related variables were partitioned into three groups (precipitation, temperature, and site) and introduced to Equation (1) successively from each group. The climate- and site-related variables that were significant and resulted in the lowest Akaike information criterion (AIC; [25]) value were selected and incorporated into the stand height models. Quadratic transformations and two-way interactions of the climate variables that were significant in the regression were also introduced one by one in the presence of their original variables. All climate and site variables, their two-way interactions, and transformations that were both significant and improved model fit were selected as climate variables.
Random effects parameters were added successively to the fixed-effects coefficients of climate variables as necessary. Goodness-of-fit criteria such as log-likelihood (twice the negative log-likelihood) ratio, assessment of model residuals, and AIC were used to evaluate the model with random effects. The model with the smallest goodness-of-fit value was considered best. The model form that resulted in the smallest value of AIC was used as the final model for each species.
Estimated values of stand heights of jack pine, black spruce, red pine, and white spruce trees using the models with climate variables were used to evaluate climatic effects on future stand height growth for three areas. These areas were in the center (near Hearst), the eastern (north of Sudbury for jack pine and black spruce and near Barrie for red pine and white spruce), and western (near Dryden for jack pine and black spruce and near Red Lake for red pine and white spruce) parts of Ontario, where the trees were sampled (see Figure 1).
The evaluation of climate effects was performed under three emissions trajectories (2.6, 4.5 and 8.5 Watts/m2). These trajectories, known as representative concentration pathways (RCPs), produce different levels of warming at the end of the century using the Canadian model [20]. The projected values of climate variables (from [20]) that were significant in expressing the asymptote and rate parameter in Equation (1) were used in evaluating climate effects. Height growth curves were also generated for the 80-year growth period (2021–2100) for all tree species for all emissions scenarios.

3. Results

The base model (Equation (1)) coefficient estimates were provided in studies by Sharma et al. [14], Sharma and Parton [15], and Sharma and Parton [16] for jack pine and black spruce, red pine, and white spruce, respectively. Those estimates remain the same and, hence, are not reported here. Any differences would be associated with the climate variables since annual/seasonal values were used in this study instead of the average values over the trees’ past growth periods used in the previous studies.
Climate effects on stand height growth were analyzed by expressing parameters (α0 and α1) in Equation (1) in terms of climate variables as described earlier. For jack pine, mean diurnal temperature range (MDTR), its quadratic transformation, and April CMI (CMIApr) explained the variation in asymptote. Similarly, MDTR and May CMI (CMIMay) were significant in explaining the rate parameter for this tree species. For black spruce, precipitation of warmest quarter (PWQ) and July CMI (CMIJul) explained the variations in the asymptote and rate parameter, respectively.
For red pine, growing season mean temperature (GSMT) and the sum of March, April, October, and November CMIs (CMISum) explained the variation in the asymptote and rate parameter, respectively. On the other hand, only one temperature-related variable (annual maximum temperature (AnMaxT)) was significant in explaining the variation in the rate parameter for white spruce.
As stated, random effects parameters were sequentially added to the fixed-effects coefficients, starting with the intercept in the expression for asymptote. Only site-level random effects associated with the intercept in expressions for both asymptote and rate parameter were significant for all species. However, no random effects associated with the fixed-effects coefficients attached to climate variables were significant. Final models with climate variables and random effects for jack pine, black spruce, red pine, and white spruce can be mathematically expressed as:
jack pine
H i j k = β 0 + b 0 i + β 1 C M I A p r + β 2 M D T R + β 3 M D T R 2 1 1 β 0 + b 0 i + β 1 C M I A p r + β 2 M D T R + β 3 M D T R 2 H i j l l k A i j l ( l k ) A i j k β 4 + b 4 i + β 5 C M I M a y + β 6 M D T R + ε i j k
black spruce
H i j k = β 0 + b 0 i + β 1 P W Q 1 1 β 0 + b 0 i + β 1 P W Q H i j l l j A i j l ( l k ) A i j k β 2 + b 2 i + β 3 C M I J u l + ε i j k
red pine
H i j k = β 0 + b 0 i + β 1 G S M T 1 β 0 + b 0 i + β 1 G S M T H i l l k A i j l ( l k ) A i j k β 2 + b 2 i + β 2 C M I S u m + ε i j k
white spruce
H i j k = β 0 + b 0 i 1 β 0 + b 0 i H i j l l k A i j l ( l k ) A i j k β 1 + b 1 i + β 2 A n M a x T + ε i j k
where Hijk is the stand height at age Aijk (kth observations of series j and site i), Hijl is the stand height at age Aijl at the same series and site (lth observations of series j and site i and lk), b0i is site-scale random effect associated with the intercept expressing the asymptote, and bmi (m = 1, 2, and 4) is also site-scale random effect but associated with the intercept that expressed the rate parameter. Both random effects are independent of εijk. Random effects, b0i and bmi, are normally distributed with mean zero and variances σ02 and σ12, respectively, and covariance σ0σ1. β0β6 are fixed effects parameters to be estimated. Other variables are as defined earlier.
Estimated parameters and fit statistics are listed in Table 2. For all species, fit statistics (RMSE, log-likelihood, AIC) decreased when climate variables were included in the model. Equations (2)–(5) incorporated climate variables that significantly improved fit statistics. As a result, these equations could be used to explain the effects of climate on stand height growth for jack pine, black spruce, red pine, and white spruce. As mentioned, only site-level random effects associated with the intercept of functions used to express both asymptote and rate parameter were significant for all species.
Estimated parameter values are consistent with biological expectations. For jack pine, the coefficients of April CMI and MDTR are negative. On the other hand, the coefficient for the quadratic transformation is positive. MDTR decreases as the rate of climate change increases. Therefore, decreasing MDTR has positive effect on the asymptote if evapotranspiration exceeds precipitation in April. However, the effect diminishes as the rate of climate change increases because of the opposite sign in the quadratic transformation of MDTR. Similarly, coefficients of both climatic variables (May CMI and MDTR) are negative in the expression for the rate parameter. This finding indicates that growth rate increases with the rate of change in climate if evapotranspiration is higher than total precipitation in May.
For black spruce, the coefficients of climate variables expressing the variation in asymptote and rate parameters (PWQ and CMIJuly, respectively) are positive, i.e., the asymptote increases as the precipitation of the warmest quarter increases. Similarly, the growth rate increases if July precipitation exceeds evapotranspiration during that month.
For red pine, the coefficient of GSMT expressing the variation in asymptote is negative. Similarly, the coefficient of the climate variable (CMIsum) that was significant in explaining the variation in the rate parameter is positive. This indicates that the increase in growing season mean temperature negatively affects the asymptote. On the other hand, an increase in the sum of March, April, October, and November CMIs will increase the growth rate of red pine plantations.
For white spruce, no climate variable significantly explained the variation in the asymptote. However, the rate parameter could be expressed in terms of one climate variable (AnMaxT), and the coefficient of this variable was negative. Thus, for this tree species, the asymptote is not affected by the change in climate, but height growth is reduced if the AnMaxT increases.
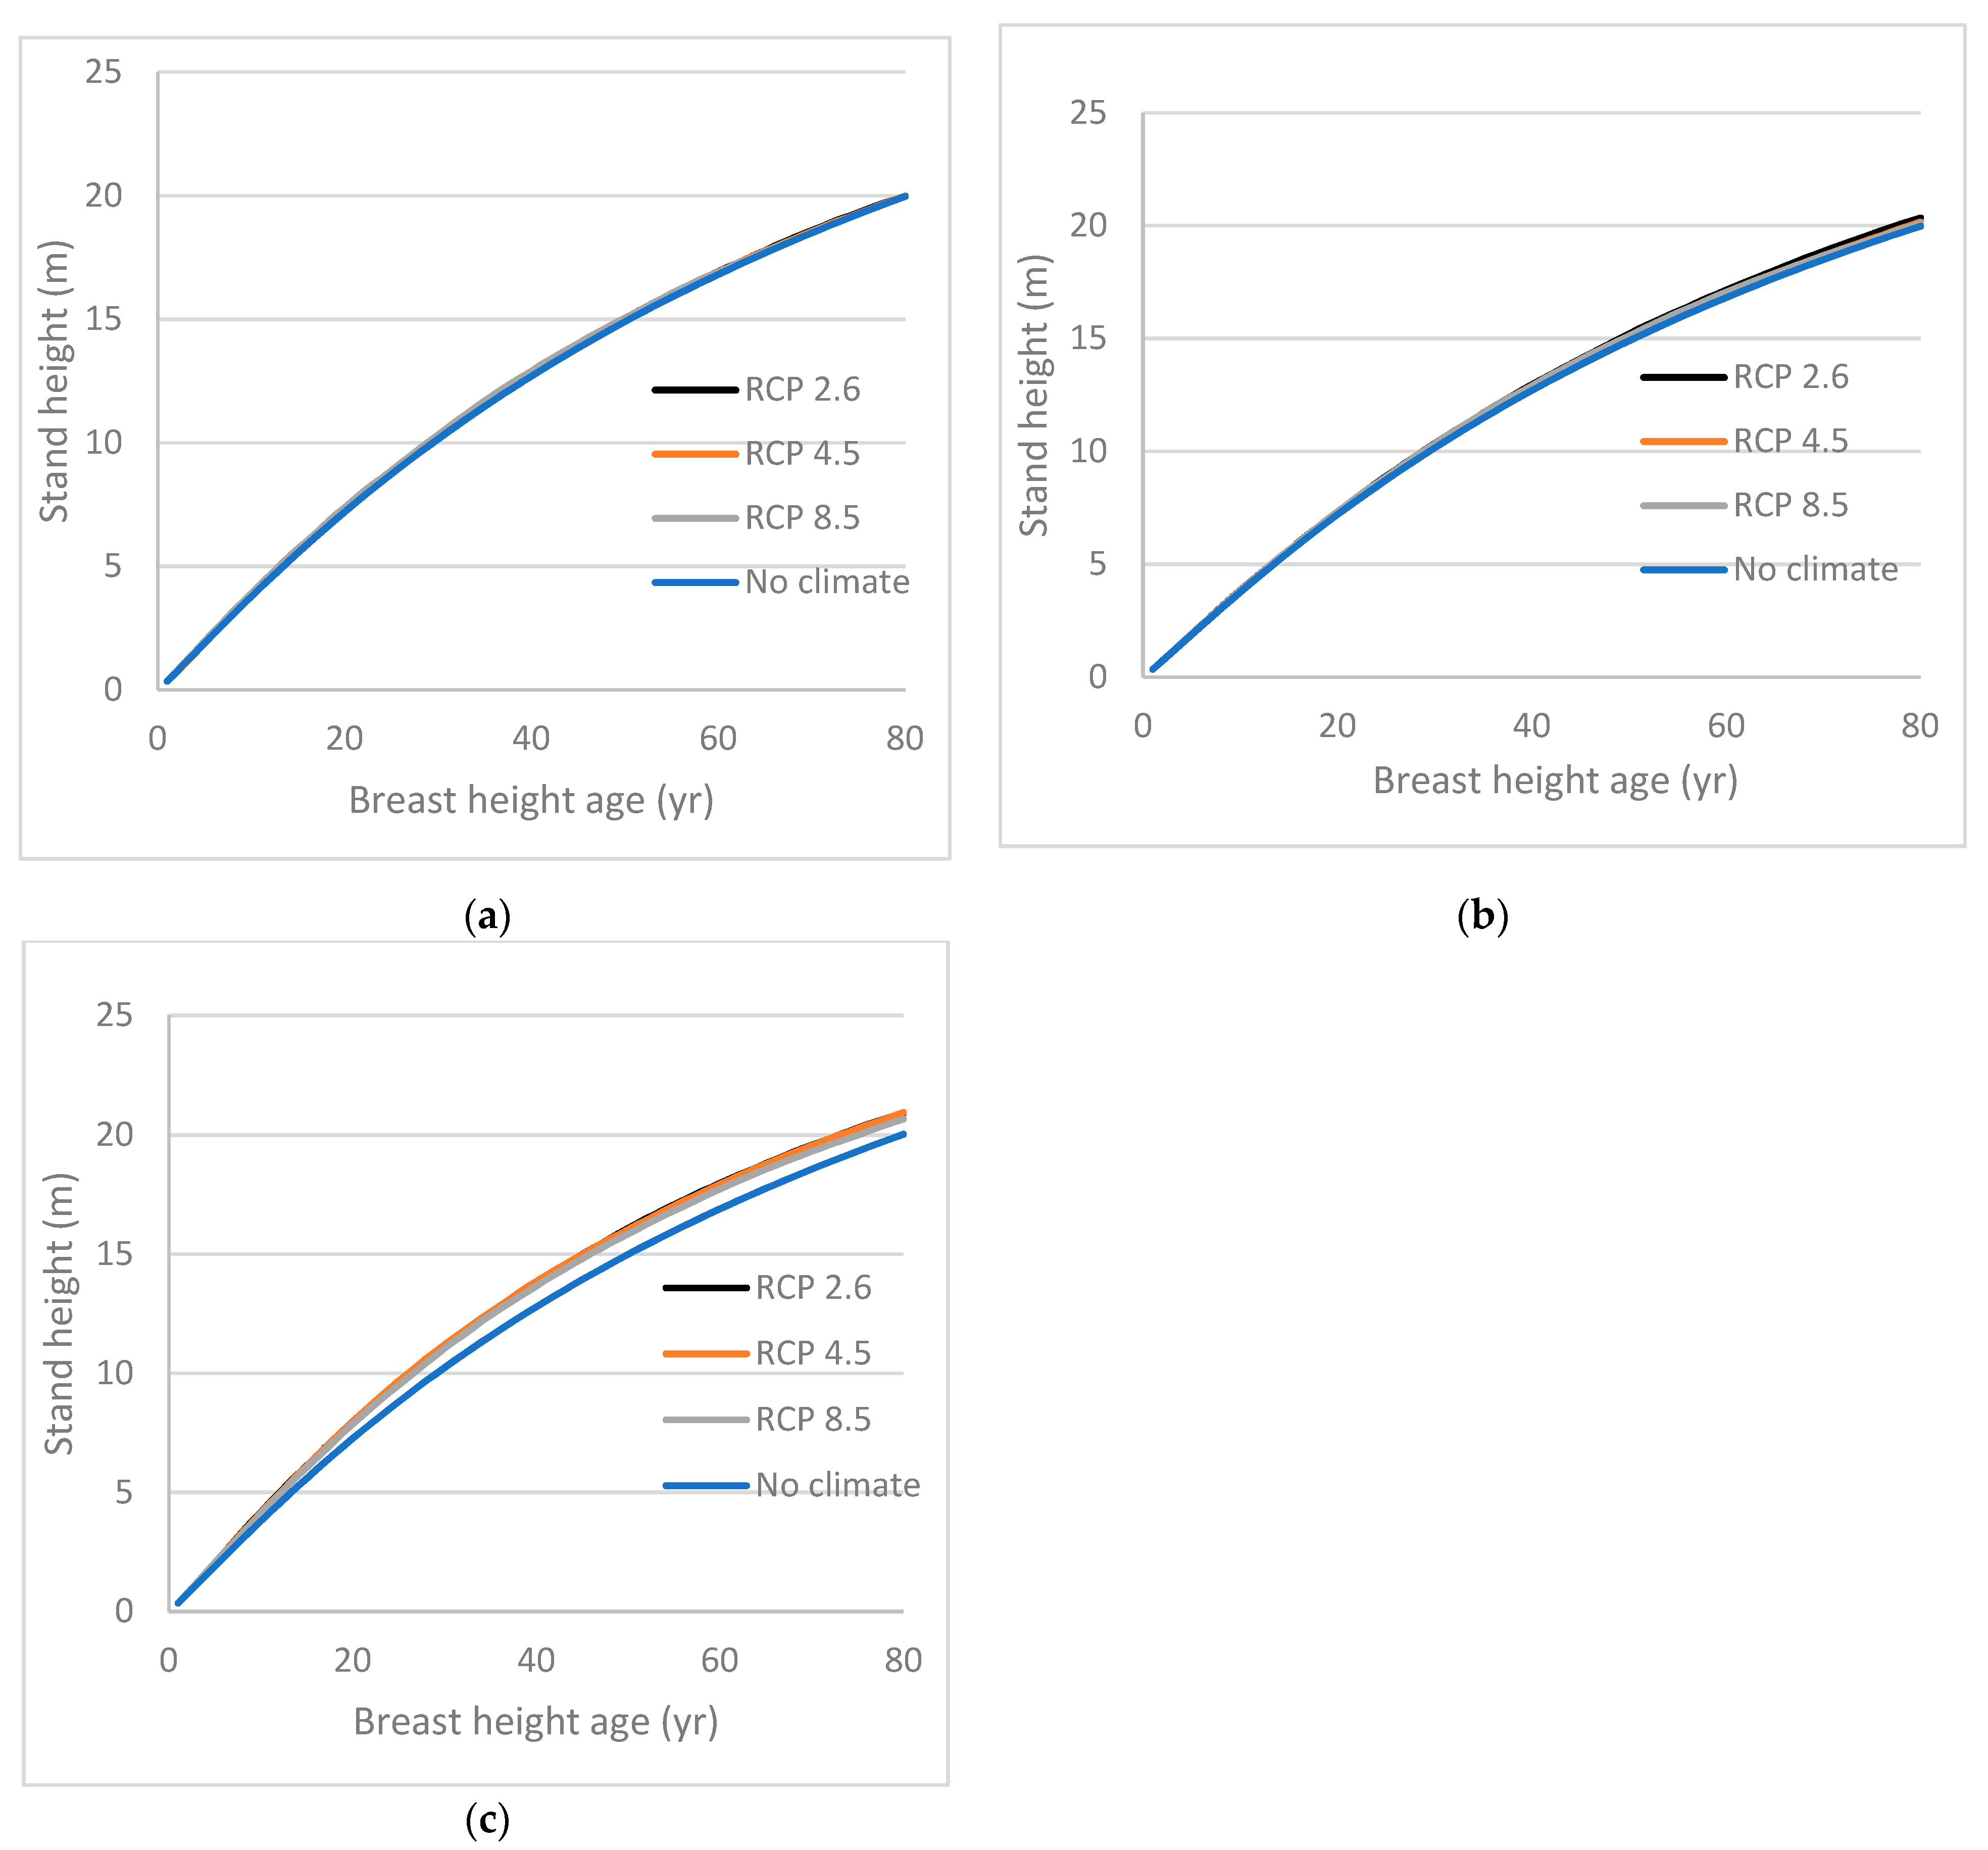
To evaluate climate effects on site productivity of different tree species, future stand heights were predicted for jack pine, black spruce, red pine, and white spruce trees at three areas in Ontario under three climate change scenarios (Figure 2, Figure 3, Figure 4 and Figure 5). These estimates were made for an 80-year (2021–2100) growth period using only fixed-effects coefficients in the models. For all species, the average height value at age one BHA (0.35 m for jack pine and black spruce and 0.5 m for red pine and white spruce) was used as the initial height for generating height–age curves. Under all climate change scenarios, projected values of annual/seasonal climate variables were used to estimate future stand heights for all species. Height–age curves were also produced for a no climate change scenario for all species.
Jack pine height growth was positively affected by climate change in the west (Figure 2). At BHA 80, stand heights were higher by 4.4, 4.6, and 3.2% under 2.6, 4.5 and 8.5 emission scenarios, respectively, compared to those under the no climate change scenario. However, height growth was not significantly affected by climate change for the east and central areas of Ontario. The positive effect in the west increased from RCP 2.6 to 4.5 but decreased from RCP 4.5 to 8.5. Thus, the positive effect of climate change in the west is not linear but concave down.
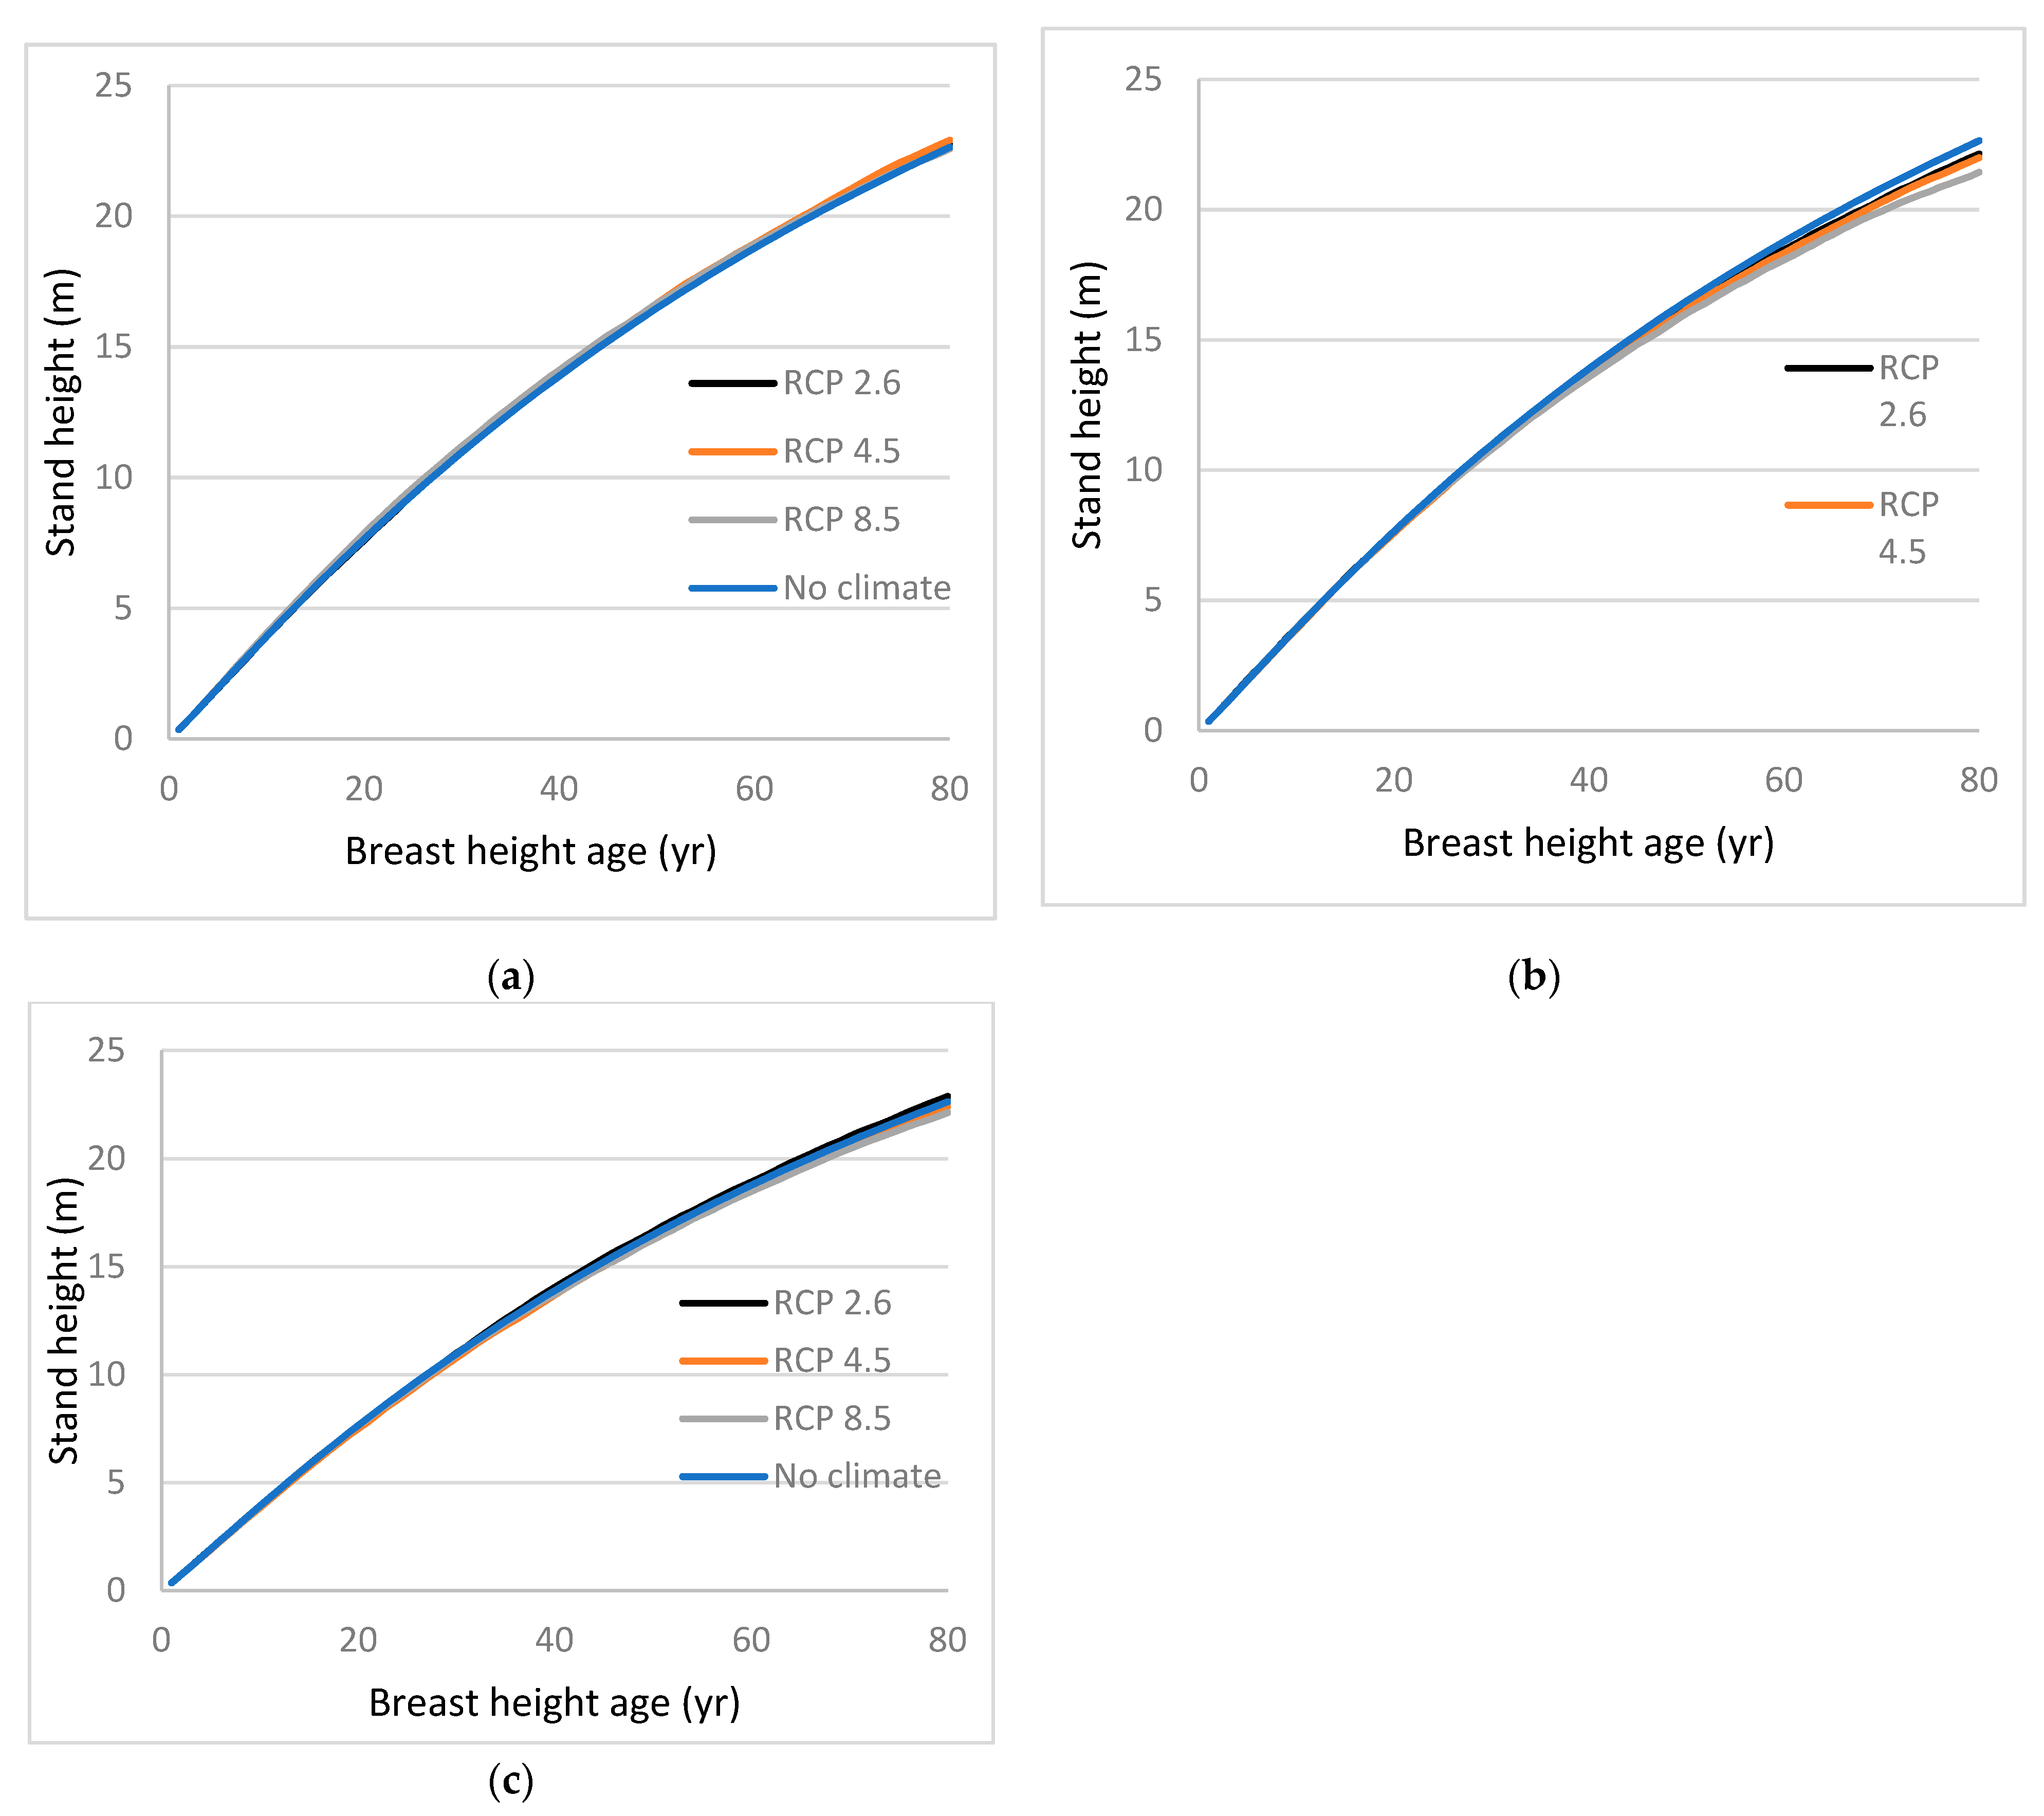
The climate change effect on black spruce height growth was not pronounced for stands in the east and west (Figure 3). However, the effects on height growth were negative and minimal for stands in central Ontario. The negative effect was more pronounced under RCP 8.5 than the other two (2.6 and 4.5) emission scenarios. At BHA 80, stand heights were lower by 2.2, 2.9, and 5.3% under RCP 2.6, 4.5, and 8.5 emission scenarios, respectively, compared to those under the no climate change scenario.
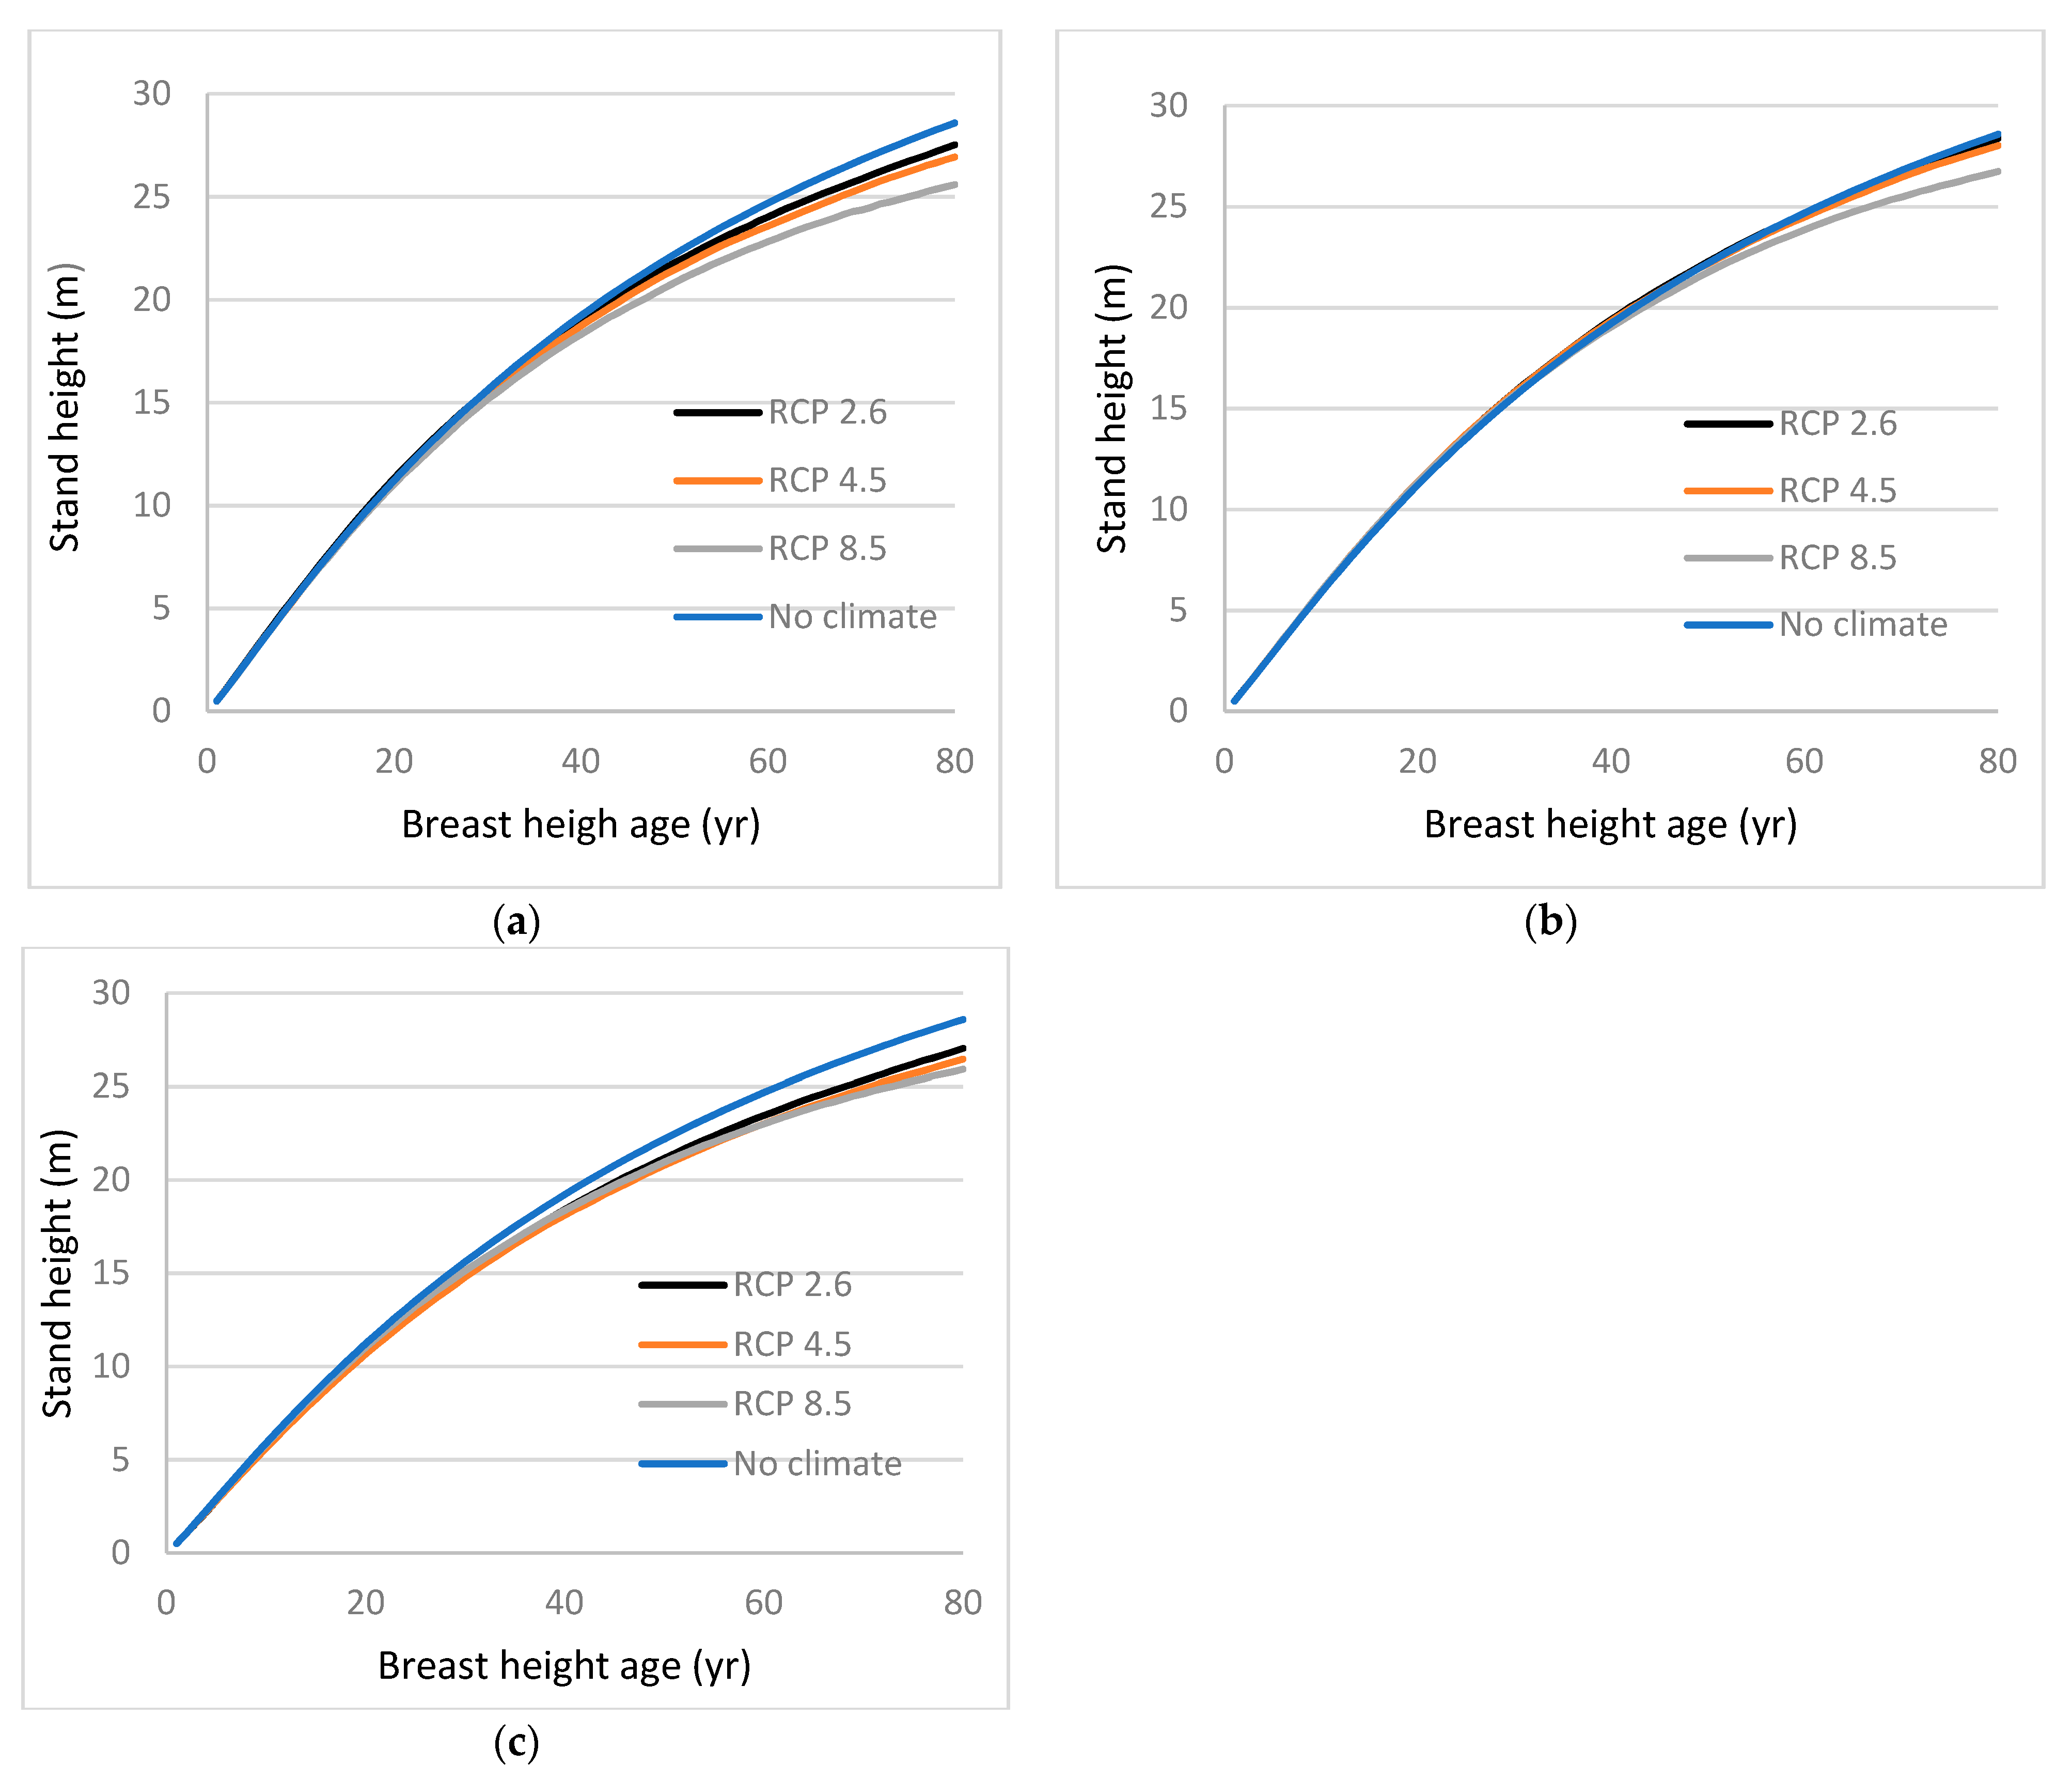
At all locations, red pine stand height growth was negatively affected by climate (Figure 4). However, the differences in stand heights under RCP 2.6 and 4.5 and the no climate change scenario were not pronounced in southeastern Ontario across stand age. At BHA 80, under RCP 8.5 stand heights were 6.4% shorter than those under the no climate change scenario. For the other two areas, stand heights under all three emission scenarios were affected by climate change. At the end of the same growth period, in central Ontario, stand heights under RCP 2.6, 4.5, and 8.5 were shorter by 3.7, 5.8, and 10.5%, respectively, compared to those under the no climate change scenario. Similarly, in the west, stand heights under RCP 2.6, 4.5, and 8.5 were shorter by 5.4, 7.5, and 9.3%, respectively, relative to the no climate change scenario.
For white spruce, the difference in stand heights under all emission scenarios relative to the no climate change climate scenario was not pronounced for central and western Ontario across stand age (Figure 5). However, stand heights under all three emission scenarios were lower relative to the current climate scenario in the southeastern part of the province (near Barrie). At BHA 80, stand heights under RCP 2.6, 4.5, and 8.5 in this area were lower by 18.3, 18.3, and 21.0%, respectively.

4. Discussion

Site productivity is affected by climate and other environmental conditions [26]. Climate effects on site productivity have recently been analyzed and modelled for jack pine, black spruce, red pine, white spruce, and white pine plantations [3,14,15,16] and for natural origin jack pine and black spruce [17] and black spruce and trembling aspen [18] mixed stands in Ontario. Climatic conditions such as changes in temperature and precipitation regimes were used to analyze climate effects in these studies. The nature and magnitude of effects varied by species and geographic region.
As mentioned, [14,15,16] used average seasonal and annual values of climate variables over the lifespan of trees to analyze climate effects on site productivity of jack pine, black spruce, red pine, and white spruce plantations. They reported that stand height growth of jack pine and black spruce plantations was affected by both precipitation- and temperature-related variables (growing season total precipitation (GSTP) and growing season mean temperature (GSMT)). Similarly, stand height growth of white spruce plantations was affected by warmest quarter total precipitation (WQTP) and warmest quarter mean temperature (WQMT). However, red pine plantation height growth was affected only by a temperature-related variable (GSMT).
Values of climate variables fluctuate almost every year. Therefore, the effects of climate on tree growth vary from year to year. Now we have the projected annual/seasonal values of climate variables available for a future 80-year growth period to evaluate climate effects. Moreover, derived values of climate variables (e.g., CMI) are also available for use in analyzing and evaluating of climate effects. Therefore, in this study annual/seasonal values of climate variables including CMI were used to reanalyze climate effects on site productivity of jack pine, black spruce, red pine, and white spruce plantations.
In contrast to findings by Sharma et al. [14] that GSTP and GSMT explained the variation in both the asymptote and rate parameters of the jack pine and black spruce height growth models, in this study MDTR, its quadratic transformation, and April CMI explained the variation in the asymptote of the jack pine height growth model and PWQ that of black spruce. Similarly, MDTR and May CMI significantly affected the rate of height growth for jack pine and July CMI affected that of black spruce. The climatic effects found by Sharma et al. [14] were negative for both species, minimal for jack pine and more pronounced for black spruce. In this study, however, the effects were positive for jack pine and negative for black spruce, and for both species, they were minimal where present.
When the average values of climate variables over tree lifespan were used, only GSMT explained the variation in the rate parameter of the red pine height growth model [15]. The effect of climate on site productivity was highly negative in all three areas evaluated. In this study, however, the sum of March, April, October, and November CMI was also significant in the model for red pine. GSMT and the sum of CMIs explained the variations in the asymptote and the rate parameter, respectively. The effects were negative and pronounced only after BHA 30 for all three areas.
In another study, Sharma and Parton [16] reported both temperature- and precipitation-related variables (WQTP and WQMT) explained the variation in both the asymptote and rate parameter of a white spruce height growth model. The effect of climate was negative and more pronounced for white spruce than for jack pine, black spruce, and red pine. In this study, however, only AnMaxT was significant in explaining variations in the rate parameter of the height growth model for white spruce plantations. The effects were negative and highly pronounced in central Ontario. However, the effects were minimal in the other areas.
For white pine plantations, only MDTR affected stand height growth [3]. The effect was mild and positive in central Ontario and negative in the south. It was not pronounced in other areas. For jack pine and black spruce natural origin mixed stands, a temperature-related variable (GSMT) was important in explaining the variation in stand height growth for both jack pine and black spruce trees [17]. The effect was negative and not pronounced for jack pine but positive and pronounced after BHA 35 years for black spruce. Annual/seasonal values of climate variables were used in analyzing and modelling the climate effects in these studies.
Sharma [18] also examined the climate effects on site productivity of black spruce and trembling aspen natural origin mixed stands using annual/seasonal values of climate variables. A temperature-related variable (MDTR) was important in explaining the variation in stand height growth for both black spruce and trembling aspen trees. The effect was positive for both species but not pronounced in three of the four areas evaluated.
Sharma [18] reported that even in natural origin mixed stands, climate variables that explained the height growth of black spruce grown with different tree species were not the same. Stand height growth of black spruce was explained by GSMT and MDTR in the presence of jack pine and trembling aspen, respectively. The climate variable that explained the variation in the stand height growth of trembling aspen grown with black spruce was also MDTR. Although MDTR was the significant climate variable in the stand height growth models for both black spruce and trembling aspen, it explained the variation in the asymptote for black spruce but in the rate parameter for trembling aspen [18]. These findings indicated that climate effects on site productivity depend not only on tree species but also on stand type (plantations vs. natural origin mixed stands) and species mixture (other tree species growing in the stands).
Climate effects on site productivity also depended on the time over which climate variable values were calculated. First, the climate variables significant in the model averaged over trees’ lifespan differed from those significant based on annual/seasonal values linked to growth period. Second, the nature and magnitude of the effects differed. Since climate varies annually, climate effects analyzed using the annual/seasonal values would be more accurate than those using average values. Therefore, annual/seasonal values are recommended for analyzing climate effects on tree/forest growth.
A site index expressed in terms of biophysical variables alone does not provide an accurate estimate of site productivity because it is determined by more than climate and other environmental variables. Climate and environmental variables are estimated at landscape scale, but several microsite variables (e.g., soil type, available nutrients) also influence site productivity. Therefore, climate effects on SI should be analyzed by incorporating climate variables in SI/stand height growth models. The effects of microsite variables on SI/stand height growth are reflected by the initial values of stand heights required in the models presented here. Better soil with more available nutrients may produce higher initial height values at a particular stand age.
The results presented here are consistent with other studies conducted in other geographic regions. As Bergh et al. [8] reported, net primary production of Scots pine grown in Nordic countries could increase with the increase in temperature. Similarly, the study by Pedlar and McKenney [9] showed that the growth response of five northern conifers to climate change could be positive on cold-origin (northern) populations, but negative on warm-origin (southern) populations. As mentioned earlier, climate effects on jack pine site productivity were positive in the north and severely negative for white spruce in the south.
The models presented here can be readily applied to statistical growth and yield models to estimate site productivity more accurately under a changing climate. These models characterize not only stand height growth models that can be used under a changing climate but also a means to evaluate the effect of climate on site productivity that depends on tree species and geographic location. For a given tree species, the climatic effect on site productivity can be explained by interpreting the sign and magnitude of the coefficients of the climate variables significant in the models.
The estimates for the coefficients of base model (Equation (1)) have been presented by Sharma et al. [14] for jack pine and black spruce, by Sharma and Parton [15] for red pine, and by Sharma and Parton [16] for white spruce. Those estimates remain the same and, hence, are not reported here.

5. Conclusions

Climate effects on site productivity were reanalyzed and modelled for jack pine (Pinus banksiana Lamb.), black spruce (Picea mariana (Mill.) B.S.P.), red pine (Pinus resinosa Aiton), and white spruce (Picea glauca (Moench) Voss) plantations using annual/seasonal values of climate variables. For this analysis, parameters of the stand height growth model were expressed in terms of climate variables for all tree species. A nonlinear mixed-effects approach was applied to fit the models with climate variables. Including climate variables improved the model fit statistics for all four tree species.
Climate effects on site productivity depended on tree species and location. For jack pine, the effects were positive and pronounced only in the west of Ontario under all three emissions scenarios (2.6, 4.5, and 8.5 watts m−2). For black spruce, effects were negative and minimal after BHA 50 in central Ontario. Similarly, the effects were negative and more pronounced in all areas (southeast, central, and west of Ontario) after BHA 35 for red pine. On the other hand, the effects were negative and notable from when white spruce were young under all scenarios in the southeast. The effects under RCP 8.5 were more pronounced than those under other two scenarios for all species except jack pine. The difference between the effects under RCP 2.6 and 4.5, however, was not as pronounced as those between RCP 4.5 and 8.5 for all areas for all species.
The climate effects analyzed using annual/seasonal values of climate variables differed in nature (positive or negative) and magnitude from those estimated using the average values of climate variables over the trees’ lifespan. Since climate effects analyzed using the annual/seasonal values of climate variable would be more accurate than those estimated using the average values, the former are best to be used in forest management planning.

Funding

This research received no external funding.

Data Availability Statement

The data used in this study have been presented in Table 1.

Acknowledgments

This study was supported by the Ontario Ministry of Natural Resources and Forestry (MNRF). Support for data collection was provided by the Forestry Futures Trust Enhanced Forest Productivity Science Program. The author is grateful to Daniel McKenney, Canadian Forest Service, for providing estimates of climate variables for study sites and Lisa Buse, Ontario Forest Research Institute, for editing an earlier version of the manuscript.

Conflicts of Interest

The authors declare no conflict of interest.

References

  1. Vanclay, J.K. Modelling Forest Growth and Yield: Applications to Mixed Tropical Forests; CAB International: Oxon, UK, 1994; 312p. [Google Scholar]
  2. Sharma, M.; Amateis, R.L.; Burkhart, H.E. Top height definition and its effect on site index determination in thinned and unthinned loblolly pine plantations. For. Ecol. Manag. 2002, 168, 163–175. [Google Scholar] [CrossRef]
  3. Sharma, M.; Parton, J. Modelling effects of climate on site productivity of white pine plantations. Can. J. For. Res. 2019, 49, 1289–1297. [Google Scholar] [CrossRef]
  4. Hunter, I.R.; Gibson, A.R. Predicting Pinus radiata site index from environmental variables. N. Z. J. For. Sci. 1984, 14, 53–64. [Google Scholar]
  5. Ung, C.-H.; Bernier, P.Y.; Raulier, F.; Fournier, R.A.; Lambert, M.C.; Regniere, J. Biophysical site indices for shade tolerant and intolerant boreal species. For. Sci. 2001, 47, 83–95. [Google Scholar]
  6. Albert, M.; Schmidt, M. Climate-sensitive modelling of site-productivity relationships for Norway Spruce (Picea abies (L.) Karst.). For. Ecol. Manag. 2010, 259, 739–749. [Google Scholar] [CrossRef]
  7. Weiskittel, A.R.; Crookston, N.L.; Radtke, P.J. Linking climate, gross primary productivity, and site index across forests of the western United States. Can. J. For. Res. 2011, 41, 1710–1721. [Google Scholar] [CrossRef]
  8. Bergha, J.; Freeman, M.; Sigurdsson, B.; Kellomaki, S.; Laitinen, K.; Niinisto, H.P.; Linder, S. Modelling the short-term effects of climate change on the productivity of selected tree species in Nordic countries For. Ecol. Manag. 2003, 183, 327–340. [Google Scholar] [CrossRef]
  9. Pedlar, J.H.; McKenney, D.W. Assessing the anticipated growth response of northern conifer populations to a warming climate. Sci. Rep. 2017, 7, 43881. [Google Scholar] [CrossRef]
  10. Guo, X.; Klisz, M.; Puchalka, R.; Silvestro, R.; Faubert, P.; Belien, E.; Huang, J.; Rossi, S. Common-garden experiment reveals clinal trends of bud phenology in black spruce populations from a latitudinal gradient in the boreal forest. J. Ecology 2022, 110, 1043–1053. [Google Scholar] [CrossRef]
  11. Beaumont, J.F.; Ung, C.H.; Bernier-Cardou, M. Relating site index to ecological factors in black spruce stands: Tests of hypotheses. For. Sci. 1999, 45, 484–491. [Google Scholar]
  12. Wang, Y.; LeMay, V.M.; Baker, T.G. Modelling and prediction of dominant height and site index of Eucalyptus globulus plantations using a nonlinear mixed-effects model approach. Can. J. For. Res. 2007, 37, 1390–1403. [Google Scholar] [CrossRef]
  13. Bravo-Oviedo, M.; Bravo, T.F.; Montero, G.; del Rio, M. Dominant height growth equations including site attributes in the generalized algebraic difference approach. Can. J. For. Res. 2008, 38, 2348–2358. [Google Scholar] [CrossRef]
  14. Sharma, M.; Subedi, N.; TerMikaelian, M.; Parton, J. Modeling climatic effects on stand height/site index of plantation-grown jack pine and black spruce trees. For. Sci. 2015, 61, 25–34. [Google Scholar] [CrossRef] [Green Version]
  15. Sharma, M.; Parton, J. Climatic effects on site productivity of red pine plantations. For. Sci. 2018, 64, 544–554. [Google Scholar] [CrossRef]
  16. Sharma, M.; Parton, J. Analyzing and modelling effects of climate on site productivity of white spruce plantations. For. Chron. 2018, 93, 173–182. [Google Scholar] [CrossRef]
  17. Sharma, M. Climate effects on jack pine and black spruce productivity in natural origin mixed stands and site index conversion equations. Trees For. People 2021, 5, 100089. [Google Scholar] [CrossRef]
  18. Sharma, M. Climate effects on black spruce and trembling aspen productivity in natural origin mixed stands. Forests 2022, 13, 430. [Google Scholar] [CrossRef]
  19. Rowe, J.S. Forest Regions of Canada; Government of Canada, Department of the Environment, Canadian Forestry Service: Ottawa, ON, Canada, 1972; Publication No. 1300.
  20. McKenney, D.W.; Hutchinson, M.F.; Papadopol, P. Customized spatial climate models for North America. Bull. Am. Meteorol. Soc. 2011, 92, 1161–1622. [Google Scholar] [CrossRef]
  21. Mekis, É.; Vincent, L.A. An overview of the second generation adjusted daily precipitation data set for trend analysis in Canada. Atmos. Ocean. 2011, 49, 163–177. [Google Scholar] [CrossRef]
  22. Vincent, L.A.; Wang, X.L.; Milewska, E.J.; Wan, H.; Yang, F.; Swail, V. A second generation of homogenized Canadian monthly surface air temperature for climate trend analysis. J. Geophys. Res. Atmos. 2012, 117, D18110. [Google Scholar] [CrossRef]
  23. Hogg, E.H. Climate and the southern limit of the western Canadian boreal forest. Can. J. For. Res. 1994, 24, 1835–1845. [Google Scholar] [CrossRef]
  24. Burkhart, H.E.; Tome, M. Modeling Forest Trees and Stands; Springer: Dordrecht, The Netherlands, 2012; 457p. [Google Scholar]
  25. Akaike, H. A Bayesian analysis of the minimum AIC procedure. Ann. Inst. Stat. Math. 1978, 30, 9–14. [Google Scholar] [CrossRef]
  26. Clutter, J.L.; Fortson, J.C.; Pienaar, L.V.; Brister, G.H.; Bailey, R.L. Timber Management: A Quantitative Approach; Krieger Publishing Company: Malabar, FL, USA, 1983. [Google Scholar]
Figure 1. Distribution of jack pine and black spruce plantation sites sampled across Northern Ontario, Canada. Latitude and longitude ranged from 47° N to 50° N and 80° W to 92° W, respectively.
Forests 13 01600 g001
Figure 2. Stand height profiles for jack pine trees generated using projected values of climate variables for the period 2021 to 2080, assuming climate remains stable (no climate) or warms (RCPs 2.6, 4.5, and 8.5), in Equation (2) for (a) eastern (near Sudbury), (b) central (near Hearst), and (c) western (near Dryden) Ontario, Canada. Climate variables were projected for locations close to sample sites using three emissions trajectories known as representative concentration pathways (RCPs).
Forests 13 01600 g002
Figure 3. Stand height profiles for black spruce trees generated using projected values of climate variables for the period 2021 to 2080, assuming climate remains stable (no climate) or warms (RCPs 2.6, 4.5, and 8.5), in Equation (3) for (a) eastern (near Sudbury), (b) central (near Hearst), and (c) western (near Dryden) Ontario, Canada. Climate variables were projected for locations close to sample sites using three emissions trajectories known as representative concentration pathways (RCPs).
Forests 13 01600 g003
Figure 4. Stand height profiles for red pine trees generated using projected values of climate variables for the period 2021 to 2080, assuming climate remains stable (no climate) or warms (RCPs 2.6, 4.5, and 8.5), in Equation (4) for (a) southeastern (near Barrie), (b) central (near Hearst), and (c) western (near Red Lake) Ontario, Canada. Climate variables were projected for locations close to sample sites using three emissions trajectories known as representative concentration pathways (RCPs).
Forests 13 01600 g004
Figure 5. Stand height profiles for white spruce trees generated using projected values of climate variables for the period 2021 to 2080, assuming climate remains stable (no climate) or warms (RCPs 2.6, 4.5, and 8.5), in Equation (5) for (a) southeastern (near Barrie), (b) central (near Hearst), and (c) western (near Red Lake) Ontario, Canada. Climate variables were projected for locations close to sample sites using three emissions trajectories known as representative concentration pathways (RCPs).
Forests 13 01600 g005
Table 1. Summary statistics (N = number of samples, Std Dev = standard deviation) for total height, diameter at breast height (DBH), total age, and breast height age (BHA) of plantation grown trees in Ontario, Canada and climate variables that best explained the variation in stand height growth of tree species used in this study. (CMI = climatic moisture index, MDTR = mean diurnal temperature range, PWQ = precipitation of warmest quarter, GSMT = growing season mean temperature, AnMxT = annual maximum temperature).
VariableNMeanStd DevMinimumMaximum
Jack pine
Height (m)20116.712.3811.8023.02
DBH (cm)20119.594.029.9034.30
Total age (year)20142.2210.2626.0063.00
BHA (year)20138.6810.0023.0060.00
CMI (April)27002.922.45−5.6214.54
CMI (May)27000.583.18−6.8510.03
MDTR (°C)270012.251.317.216.2
Black spruce
Height (m)21112.552.236.8217.85
DBH (cm)21116.392.8110.1024.80
Total age (year)21138.348.4024.0084.00
BHA (year)21132.017.1020.0046.00
CMI (July)2700−1.353.39−10.112.28
PWQ (mm)2700243.6747.7297406
Red pine
Height (m)9021.834.1013.2530.90
DBH (cm)9031.396.2321.3056.20
Total age (year)9059.9018.1227.0097.00
BHA (year)9055.2618.0723.0093.00
CMI (March)34564.022.18−1.5214.36
CMI (April)34562.722.62−6.2214.5
CMI (Oct)34563.683.66−6.2219.45
CMI (Nov)34565.402.73−0.6317.89
GSMT (°C)345613.180.7310.8715.82
White spruce
Height (m)9320.982.9115.2529.35
DBH (cm)9329.976.6716.3052.90
Total age (year)9355.6210.2642.0087.00
BHA (year)9349.8610.1835.0082.00
AnMaxT (°C)27007.440.526.148.05
CMI = mean monthly precipitation–monthly potential evapotranspiration.
Table 2. Parameter estimates, their standard errors (SE), and fit statistics (MSE (σe2), variance of b0 (σ02), variance of b1 (σ12), covariance of b0 and b1 (σ0 σ1), and the Akaike information criterion (AIC) for the models with climate variables (Equations (2)–(5)) for jack pine, black spruce, red pine, and white spruce trees grown in plantation across Ontario, Canada.
Jack PineBlack Spruce
ParametersEstimatesSEEstimatesSE
β0104.81030.62230.0027.0212
β1−0.51350.16670.08900.0319
β2−14.88255.51861.09220.0126
β30.81070.24990.00480.0012
β41.31330.0740----
β5−0.00620.0012----
β6−0.01910.0057----
σe20.01840.00030.01160.0002
σ0283.01037.304200.0083.210
σ120.00600.00200.00260.0010
σ0σ1−0.31890.2001−0.33130.2165
AIC−8620--−10.492--
Red pineWhite spruce
β078.98729.989768.6066.9399
β1−2.19570.69331.35750.0986
β21.08510.0204−0.02460.0109
β30.00250.0006----
σe20.00660.00010.01520.0003
σ02260.00117.271232.99680.89
σ120.00780.00220.00860.0028
σ0σ1−1.19330.4377−1.59010.9488
AIC−10452--−5829--
All parameter estimates were statistically significant (p < 0.05).
Publisher’s Note: MDPI stays neutral with regard to jurisdictional claims in published maps and institutional affiliations.

