Article

A Study of Forest Carbon Sink Increment from the Perspective of Efficiency Evaluation Based on an Inverse DEA Model

1
The Collective Forestry Reform and Development Research Center of New Types of Think Tanks with Universities in Fujian, Fujian Agriculture and Forestry University, Fuzhou 350002, China
2
College of Computer and Information Sciences, Fujian Agriculture and Forestry University, Fuzhou 350002, China
3
College of Economics and Management, Fujian Agriculture and Forestry University, Fuzhou 350002, China
*
Author to whom correspondence should be addressed.
Forests 2022, 13(10), 1563; https://doi.org/10.3390/f13101563
Submission received: 31 August 2022 / Revised: 19 September 2022 / Accepted: 21 September 2022 / Published: 25 September 2022
(This article belongs to the Section Forest Inventory, Modeling and Remote Sensing)

Abstract

:
Forest carbon sink efficiency refers to the efficiency of input-output indicators related to carbon sinks. This paper studies carbon sink efficiency from the perspective of resource allocation; guides the optimal allocation of resources; and selects forestry employees, forestry investment amount and afforestation area as input indicators; the forest carbon sink efficiency in China is calculated and analyzed based on a data envelopment analysis model by converting the forest volume into the forest carbon sink through the volume expansion factor method. The grey prediction model is used to estimate the change in the input indicator, and the production possibility set is constructed with the input indicator before and after the change and the current output indicator. The efficiency of the decision units before the change is calculated, and through the comparison of efficiency, the conditions of forest carbon sink increase in 15 provinces are obtained. The optimal allocation of the output indicator is calculated based on the inverse data envelopment analysis model. The largest increase in forestry carbon sink is 169,362 megatons in Guangdong, and the smallest is 619 megatons in Tianjin. Finally, some suggestions for the path of forest carbon sink increment are put forward.

1. Introduction

Forests are the largest pools of carbon in terrestrial ecosystems. In recent years, the relationship between forests and sustainable development has taken on new developments, although conservation and utilization have always been important topics in forest management [1,2]. Xi Jinping, the president of the People’s Republic of China proposed the carbon peaking and carbon neutrality goals on 22 September 2020. Expanding forest cover and increasing forest productivity are important measures for many countries and international organizations to address climate change in the next 30–50 years, and they are the most powerful measures for China to achieve its carbon peaking and carbon neutrality goals [3]. Forests are important vehicles for achieving China’s dual ecological and economic goals and an important way to realize the value of ecological products [4]. Studying the incremental forest carbon sink from the perspective of efficiency can realize the optimal allocation of resources for the development of forest carbon sink, which is of great significance for the sustainable realization of forest ecological value.
Forest resource management is the efficient integration and resource allocation of forest resources, which aims to improve forestry production efficiency [5]. In existing studies, efficiency measures are mainly based on stochastic frontier approach (SFA) [6,7] and data envelopment analysis (DEA) [8,9,10,11]. Due to its nonparametric nature and efficiency decomposability, DEA is widely used in efficiency measurement. Based on DEA, scholars have studied the input–output efficiency of forestry from both spatial and temporal perspectives. Yang et al. [12] used a super-efficient DEA model to conduct a static spatial study of regional forestry input–output efficiency from the perspective of integrated efficiency and used the Malmquist indicator to analyze the developments in regional forestry in dynamic time from total factor productivity change, technical progress change and technical efficiency change. He et al. [13] applied dynamic network DEA to the evaluation of forest park tourism efficiency and studied the resource utilization degree of forest parks by constructing a two-stage dynamic network DEA model. Xie et al. [14] used the super-efficient DEA model and the Malmquist indicator to study the regional and time-series differences in the efficiency of the forestry industry in China and used two-stage least squares to study the diffusion effect of the forestry industry. Zhang et al. [15] combined life cycle assessment (LCA) and time-series DEA to explore the ecological efficiency of complex forestry enterprises with the goal of carbon peaking and carbon neutralization. With the gradual attention of scholars to forest carbon sink research, forest carbon sink efficiency research has also become a population direction. Yao et al. [16] constructed a forest carbon sink efficiency indicator system based on western economic theory and used a BCC model (belongs to DEA) and Malmquist indicator to statically evaluate and dynamically analyze the forest carbon sink efficiency of 29 provinces (cities and districts) in China from 1999 to 2018, providing development ideas for Chinese forestry to achieve the dual goals of economy and ecology. Wang et al. [17] used weighted location entropy and Herfindahl reciprocal to measure forestry industry agglomeration and used DEA and the Malquist index DEA and the Malmquist index to measure forestry total factor productivity, and studied the impact of two forestry agglomerations on forestry total factor productivity. Ao et al. [18] used three-stage DEA to remove the influence of environmental factor and correct the carbon sink efficiency and further analyzed the influence of household factors, government subsidies, fertilizer application, and forest structure on the carbon sink efficiency. Luo et al. [4] used DEA to analyze the economic efficiency of carbon sinks in China’s provinces from the perspective of carbon sink inputs and outputs and explored the regional coordination of the economic efficiency of forestry carbon sinks in each region by constructing a development matrix of forestry carbon sink types; Long et al. [19] considered the super-efficient SBM model with non-expected outputs to measure low carbon efficiency and study the spatial differences in low carbon efficiency among regions. Yin et al. [20] used the Malmquist indicator method to evaluate the technical efficiency, allocative efficiency, and profit efficiency of forestry carbon sequestration technology and analyzed the influencing factors and spatial spillover effects of carbon sequestration efficiency using the spatial Durbin model. At present, scholars are more concerned with the efficiency evaluation of forest carbon sinks, and there is little research on how to further consider the optimal allocation of incremental forest carbon sinks on the basis of efficiency evaluation.
Some scholars have proposed an inverse DEA model that mainly addresses the situation of input–output interaction with constant efficiency [21]. The addition of preference cone constraints in the extension of this model enables decision makers to incorporate their preferences or important policies into the production analysis and resource allocation process, which is beneficial in guiding decision makers in resource allocation [22]. Sewanee et al. [23] proposed an inverse model of the BCC model that can retain all the production possibilities in the set consisting of current decision-making units (DMUs) and DMUs with new input–output values for the relative efficiency of DMUs and simultaneously consider the increase in some outputs and the decrease in other outputs of the evaluated DMUs. Sayar et al. [24] considered the variability of input and output levels and constructed a reverse DEA model of income and budget constraints on the basis of the traditional reverse DEA model to meet the income and budget constraints. Inverse DEA has now been widely used in forecasting from the perspective of efficiency and resource allocation. For example, it has applied in the fields of education [25], energy conservation [26], resource allocation in a low-carbon economy [27], and the petroleum industry [28].
According to the existing forestry carbon sink methodology, the carbon sink entering to the market transaction mainly refers to the increment of carbon sink, and it is important to study the increment of forest carbon sink to promote forestry carbon sink transactions and realize the value of ecological products. On the basis of efficiency evaluation, the study of carbon sink increment can achieve better resource optimization allocation. The research on the increment of forest carbon sink under the perspective of efficiency evaluation currently has two main problems: (1) What are the prerequisites for the increment of forest carbon sink from the perspective of efficiency? (2) What does the quantitative analysis of incremental forest carbon sinks entail from the perspective of efficiency? This paper selects an indicator system based on relevant literature, analyzes the efficiency of existing indicator data based on DEA, measures the changes in labor and capital input indicators using a gray prediction model, uses the recent average to represent the changes in land indicators, constructs the production possibility set before and after the changes of input indicators, compares the efficiency before and after the changes in the possibility set, and illustrates the forest carbon sink through the efficiency changes. The prerequisites for the increase in forest carbon sink are explained by the change in efficiency. Then, the optimal carbon sink increment is measured based on the inverse DEA model for the area of carbon sink increment. Finally, the conclusions of the empirical study are used to give policy recommendations on the path of incremental forest carbon sinks in China.

2. Research Methods

2.1. Data Envelopment Analysis

Data envelopment analysis (DEA) was first proposed in 1978 by Charnes et al. [29] a leading American operations researcher, as a method that provides evaluation results through linear programming in a set of comparable decision-making units (DMU) that can identify those units that demonstrate best practices and will form an effective frontier. In addition, the method enables one to measure the level of efficiency of non-frontier units and to identify benchmarks against which such inefficient units can be compared.
Suppose there are n decision-making units, each of which has m inputs, X j = ( X 1 j , X 2 j , , X m j ) T and r outputs, Y j = ( Y 1 j , Y 2 j , , Y r j ) T . Then, it is assumed that the output CCR model with constant returns to scale is:
M a x φ d S u b j e c t   t o   j = 1 n λ j Χ i j Χ i d                                     j = 1 n λ j Y r j φ d Y r d                                     λ i 0 , i = 1 , , m , r = 1 , , s , j = 1 , , n
The inverse DEA problem considers how much the output of this DMU can increase if the input of the DMU is increased under the as assumption that the current level of efficiency remains unchanged, and how much the input should increase if the output increase is given? On the premise of maintaining the efficiency of D M U d , the decision unit after changing its input or output is denoted as D M U d * . For all current DMUs, use φ 1 , φ 2 , , φ n denotes the value of its optimal relative efficiency. The input increment is denoted as Δ X d = ( Δ X 1 d , Δ X 2 d , , Δ X m d ) , the changed input is denoted as α d = Δ X d + X d , and the changed output is denoted as β d = Δ Y d + Y d .
The above output inverse DEA model based on constant efficiency can be expressed as
M a x W T Δ T Y d = W T ( Δ Y 1 d , Δ Y 2 d , , Δ Y r d ) S u b j e c t   to   j = 1 n λ j X i j α i d                                           j = 1 n λ j Y r j α d β r d                                           λ i 0 , i = 1 , , m , r = 1 , , s , j = 1 , , n
where W T is the weight assignment of s outputs.

2.2. Grey Prediction Model

Because of the change in forestry indicator accounting items and the lack of original data in China, the grey prediction model is used to forecast. By identifying the degree of similarity between the development trends in system factors (conducting correlation analysis) and processing raw data to find the laws of system changes, we can generate data series with strong regularity. Then, the corresponding differential equation model is established to predict the future development trends.
Construct a GM (1,1) gray prediction model.
  • The original sequence is constructed separately by each indicator:
X ( 0 ) = ( x 0 ( 1 ) , x 0 ( 2 ) , , x 0 ( n ) )
2.
Perform an accumulation of the established original sequence to generate the cumulative sequence:
X ( 1 ) = ( x 1 ( 1 ) , x 1 ( 2 ) , , x 1 ( n ) )
3.
Then the weighted adjacent value is generated for the accumulated generating sequence X ( 1 ) :
z ( 1 ) ( k ) = ( α x 0 ( k ) + ( 1 α ) x 0 ( k 1 ) ) , k = 2 , . n
4.
Define the grey differential equation as:
X 0 ( k ) + a Z 1 ( k ) = b
where a is the development coefficient and b is the grey action quantity.
5.
Construct the whitening equation:
d X 1 d t + a X 1 = b
6.
The solution equation of the corresponding function is thereby:
X ^ ( k + 1 ) = ( X 1 ( 0 ) b a ) e a k + b a , k = 1 , 2 , , n 1

3. Data Sources and Indicator Selection

3.1. Data Sources

The indicator data are from the China Statistical Yearbook, the China Forestry Statistical Yearbook, and the Statistical Yearbook of the National Bureau of Statistics of China. Some missing data were completed by interpolation and linear regression.

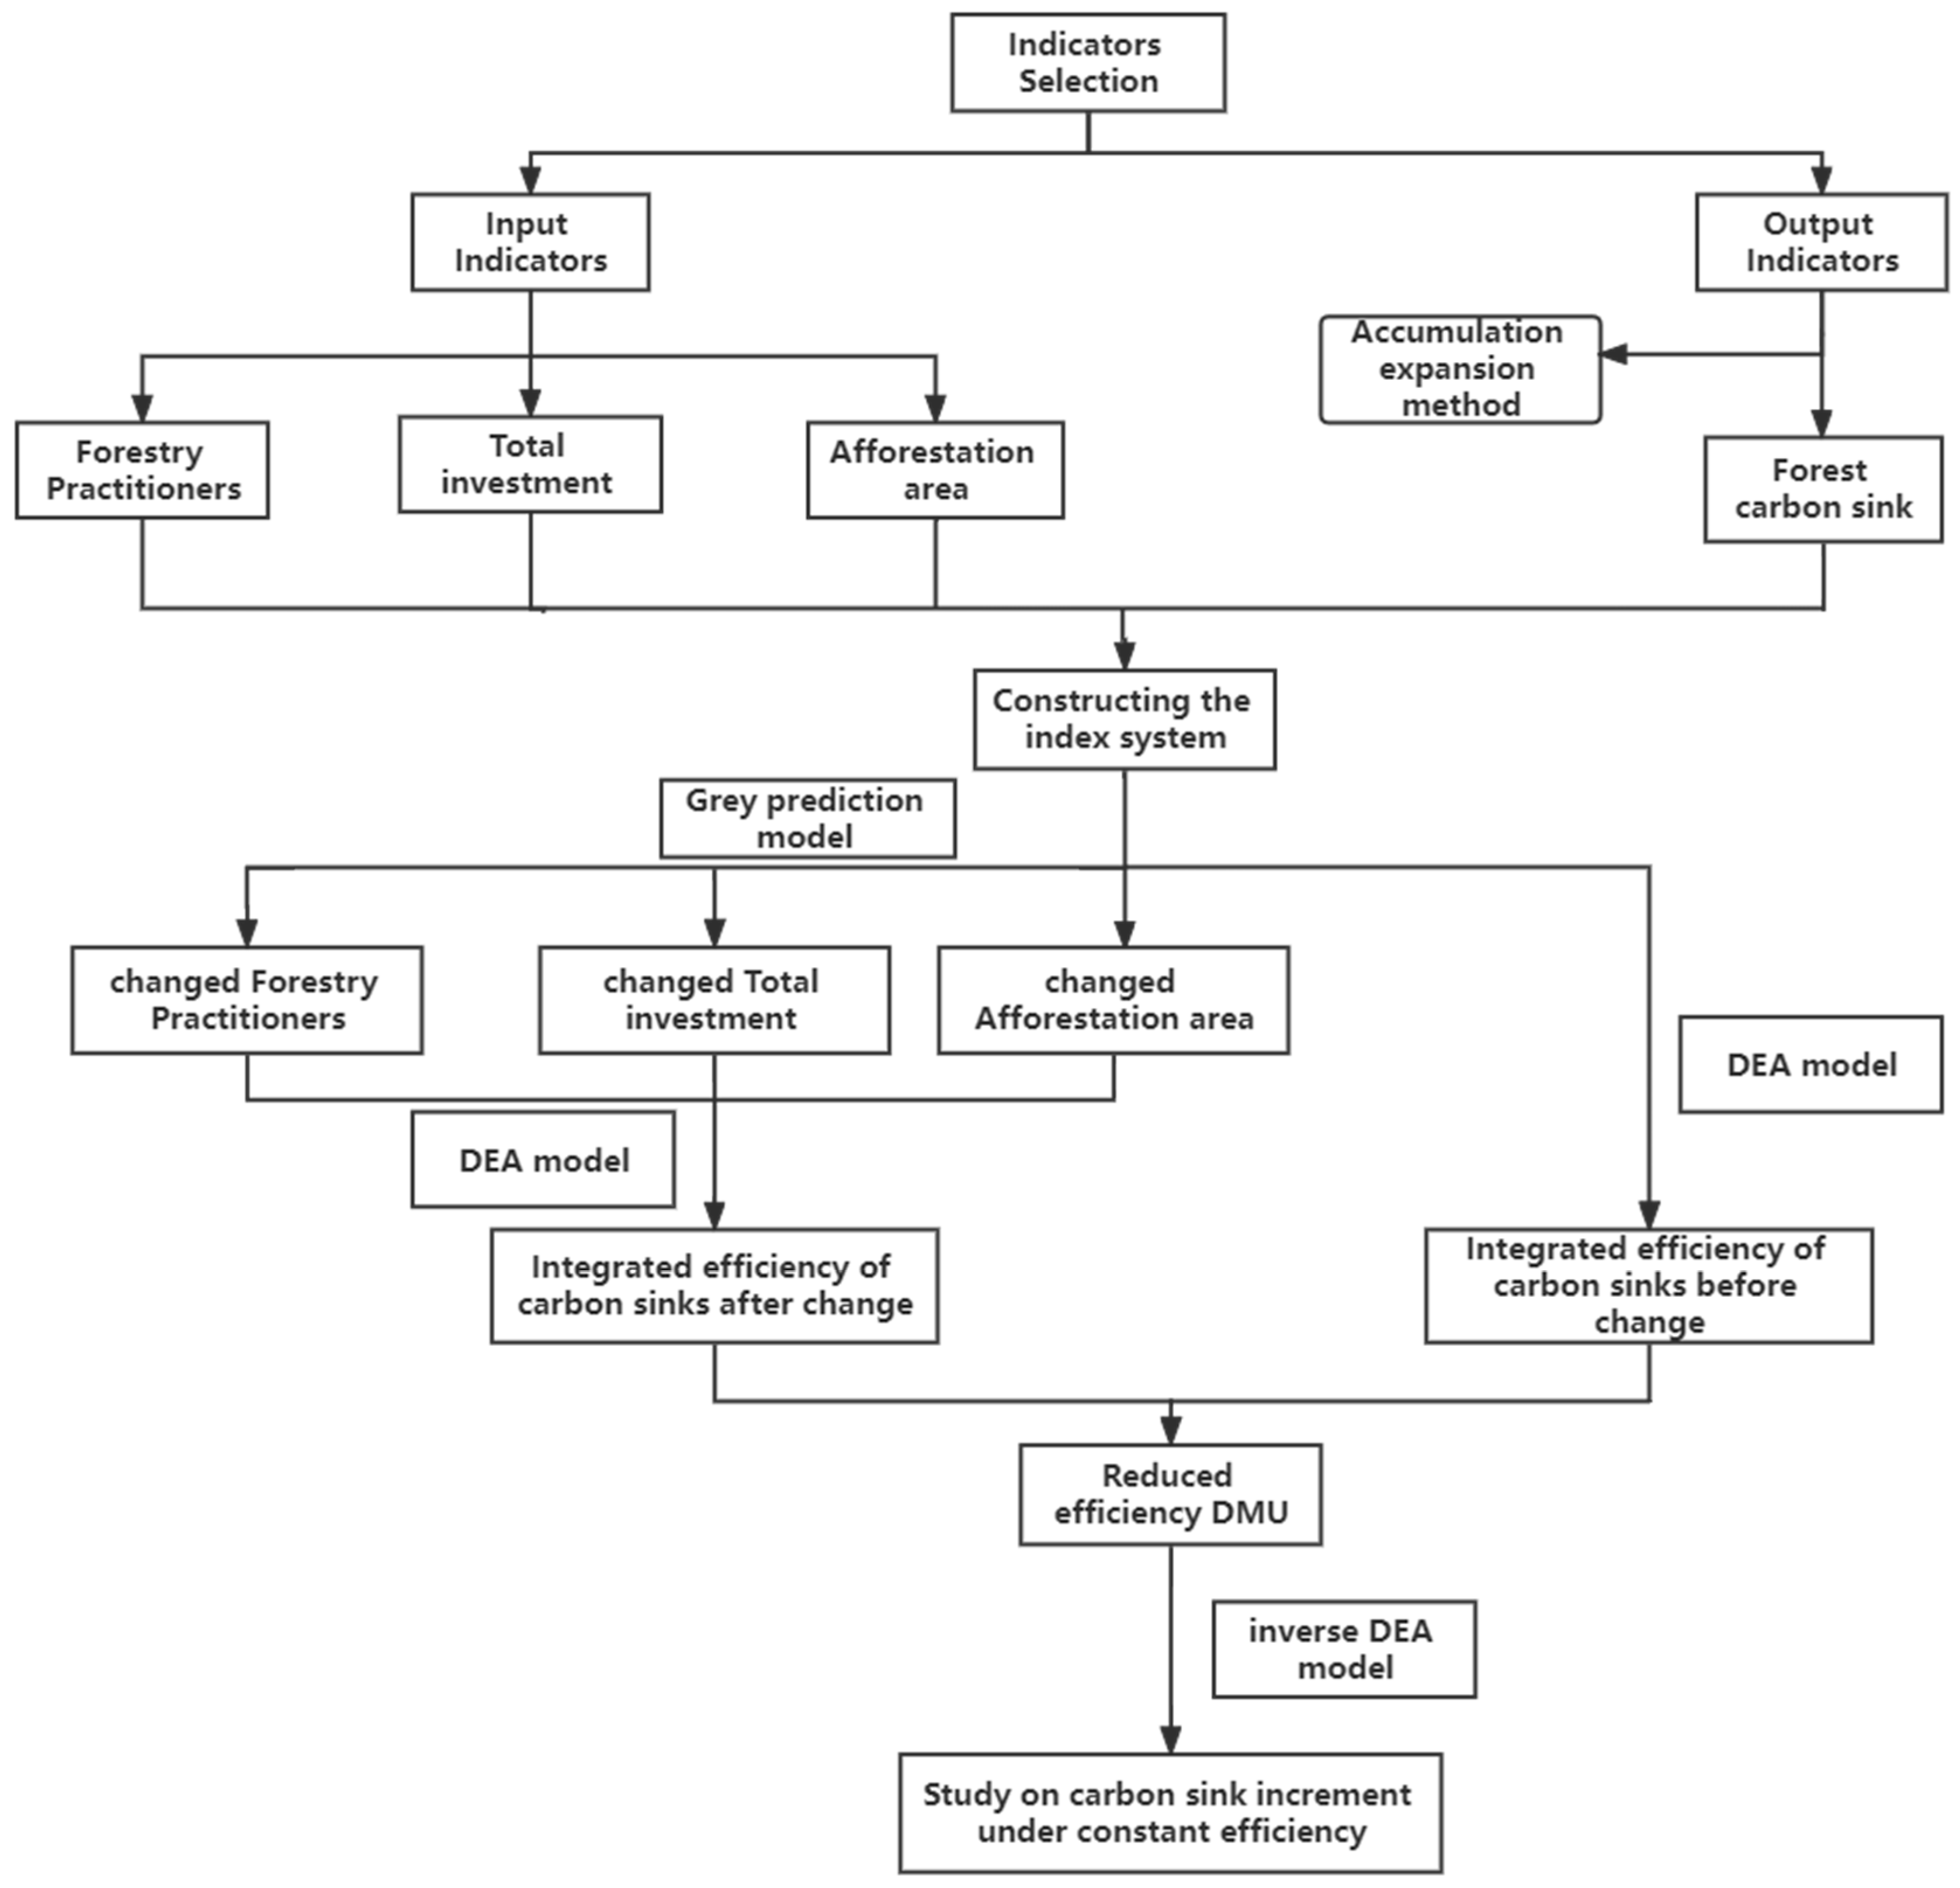
3.2. Selection of Input-Output Indicators

The purpose of this paper is to analyze the comprehensive evaluation indicators of forest carbon sink efficiency in China, so the construction of a scientific and rigorous evaluation indicator system is the basis and the key task of the study. Based on the connotation of forest carbon sink, previous researchers have investigated the conciseness, operability, and quantifiability of forest carbon sink indicators [18,30,31,32,33]. The actual evaluation indicator systems of forest carbon sink efficiency in China are constructed from the perspectives of labor, capital, and land factors, as shown in Table 1.
The labor input is the year-end number of selected forestry practitioners. The number of employees refers to the number of employees at all levels and units in China. This indicator can reflect the labor force invested in China’s forestry development. The number of state-owned economic units refers to the number of employees in units whose means of production are owned by the state; the number of collective economic units refers to the means of production, the number of employees in units means of production, i.e., the number of employees in units owned by some members of society; the number of employees in other economic units is the number of employees in units other than the above two. The three types together constitute the number of forestry practitioners, which comprehensively reflects the labor input into forestry and the personnel input that can reflect the efficiency of forest carbon sinks.
The capital investment selects the completed amount of forestry investment, which is the forestry investment used in ecological construction and protection, forestry support and security, and other fields [34]. Among them, ecological restoration and improvement aim at restoring polluted environments based on biological restoration under the guidance of ecological principles, combining various physical restoration, chemical restoration, and engineering technical measures. Forest product processing and manufacturing refers to using forest products as raw materials for final products. Forestry industry development is based on forest resources and uses scientific and technological means to produce forestry-related products in an organized and large-scale manner. The above constitutes the complete amount of forestry investment, covering all aspects of forestry investment, and can reflect the capital investment in forest carbon sink efficiency.
The land is invested in the selected afforestation area. Forestry projects refer to processes, activities, or mechanisms that absorb and fix carbon dioxide in the atmosphere through afforestation, reforestation and forest management, vegetation restoration, and decreased deforestation and that are combined with carbon sink trading. It is most appropriate to choose afforestation area as land input [31]. Artificial forestation refers to sowing, planting seedlings, and sub-planting on other suitable forest land such as barren hills and wasteland. Fly-sown afforestation is planted by aircraft and supplemented by appropriate artificial measures to form forests or shrubs and hawthorns. Mountain closure forestry is a encapsulate low-quality and low-efficiency forest land supplemented with artificial promotion methods to form Nailin or improve stand quality. Degraded forest restoration is to effectively reduce the degradation of shelter forest, improve stand quality, and restore forest function. Manual updates refer to reforesting by afforestation in burnt areas, etc. The above comprise all aspects of the afforestation area.
The out indicator consists of three main components, namely, “forest biomass sequestration”, “forest understory vegetation sequestration”, and “forest soil sequestration”, and the specific calculation method is based on the method proposed by Tingting Xi et al. [30]. This method uses a biomass conversion factor to calculate the carbon sequestration of forest understory vegetation and forest soil and finally calculates the total carbon sequestration of the whole forest.

3.3. Model Construction

In the study of mathematical economics, it is often necessary to introduce some axioms in order to study the structure of a system. Let the production possibilities set be:
T = { ( x , y ) | i n p u t s   x E + m   outputs   y E + m }
There are some axioms about producing the possible set T (Banker et al., 1984; Yu et al., 1996):
  • Axiom 1 (Convexity Axiom)
I f ( x , y ) T , ( x ^ , y ^ ) T , t h e n α [ 0 , 1 ] , h a v e   α ( x , y ) + ( 1 - α ) ( x ^ , y ^ ) T
  • Axiom 2 (Axiom of Nullity)
I f ( x , y ) T , x ^ x , y ^ y , t h e n ( x ^ , y ^ ) T
  • Axiom 3 (Plain Axiom)
( x j , y j ) T , j = 1 , 2 , , n
  • Axiom 4 (Conicity Axiom)
I f ( x , y ) T , α 0 , t h e n   α ( x , y ) T
According to the indicator system in Section 3.2, 30 provinces in China are selected as the decision-making unit (DMUs) (Tibet is not studied for the time being due to the serious lack of indicator data, and Hong Kong, Macao, and Taiwan are also not considered in this paper), each of which D M U j ( j = 1 , 2 , , 30 ) has 3 input variables, denoted as X j = ( X 1 j , X 2 j , X 3 j ) T , where labor input X 1 = ( X 11 , , X 1 j ) , capital input X 2 = ( X 21 , , X 2 j ) , land input X 3 = ( X 31 , , X 3 j ) , then X j constitutes a 3 × 30 3 × 30 matrix ( X 11 X 12 X 13 X 21 X 22 X 23 X 30   1 X 30   2 X 30   3 ) T ; 1 output variable, forest carbon sink, denoted as Y j = ( Y 1 j ) T , and Y j is a 1 × 30 vector ( Y 11 , Y 12 , , Y 1 j ) . The changed input variables are denoted as X j * = ( X 1 j * , X 2 j * , X 3 j * ) T . The efficiency of each of D M U j is denoted as φ j = ( φ 1 , φ 2 , , φ j ) , and the new efficiency obtained after the input change is denoted as φ j * = ( φ 1 * , φ 2 * , , φ j * ) .
When axioms 1–4 are satisfied, the above input–output indicators constitute the CCR model production possibility set (Chen and Wang, 2021):
P P S C = { ( X , Y ) | j = 1 n λ j X j X ; j = 1 n λ i Y j Y ; λ j 0 ; j = 1 , 2 , , n }
The new set of production possibilities obtained after the input change is expressed as:
P P S C * = { ( X , Y ) | j = 1 n λ j X j * X * ; j = 1 n λ i Y j Y ; λ j 0 ; j = 1 , 2 , , n }
The set of production possibilities based on the inverse DEA model [16] is denoted as:
P P S N = P P S N { ( X , Y ) | X α d ; Y β d }
Under the production possibility set P P S C , efficiency value ( φ j ) of each province can be obtained through model (2); when the input is adjusted, the production possible set of is changed from P P S C to P P S C * to get the new efficiency ( φ j * ) . Combining the two efficiency values φ j and φ j * . If the newly obtained efficiency increases, it means that the adjusted input indicators are in a better resource allocation compared with the pre-adjustment state. Then, in the inverse DEA model production possibility set P P S N , the output indicator should be reduced if we want to keep the efficiency level the same; if the efficiency decreases, it means that under the inverse DEA model production possibility set P P S N , output indicator volume in this resource allocation case will be increased as long as the rate is maintained, and so we have the following theorem:
Theorem 1.
Based on the two production possibility sets P P S C and P P S C * , the CCR efficiency of φ d and φ d * of the D M U d is measured according to model (1). If φ d > φ d * , then while keeping φ d constant, have ( X d * , Y d + Δ Y d ) P P S N where Δ Y d > 0 ; if φ d < φ d * , then while keeping φ d unchanged, we have ( X d * , Y d + Δ Y d ) P P S N where Δ Y d < 0 .
The model construction steps for the study of forest carbon sink increment are as follows.
Step 1: Apply the grey prediction model to measure the changed input variables X j * ;
Step 2: Combine the input variables before the change X j and the changed input variables X j * and the output variable Y j Substitute into model (1) and calculate the efficiency values under the two production possibility sets φ d and φ d * ;
Step 3: Compare the two efficiency values φ d and φ d * to filter out the provinces with reduced efficiency;
Step 4: The provinces with reduced efficiency are studied for the increase in their carbon sinks using the inverse DEA model; that is, the changes in the incremental carbon sinks are explored while keeping their efficiency constant.
The specific process is shown in Figure 1.

4. Analysis of Results and Discussion

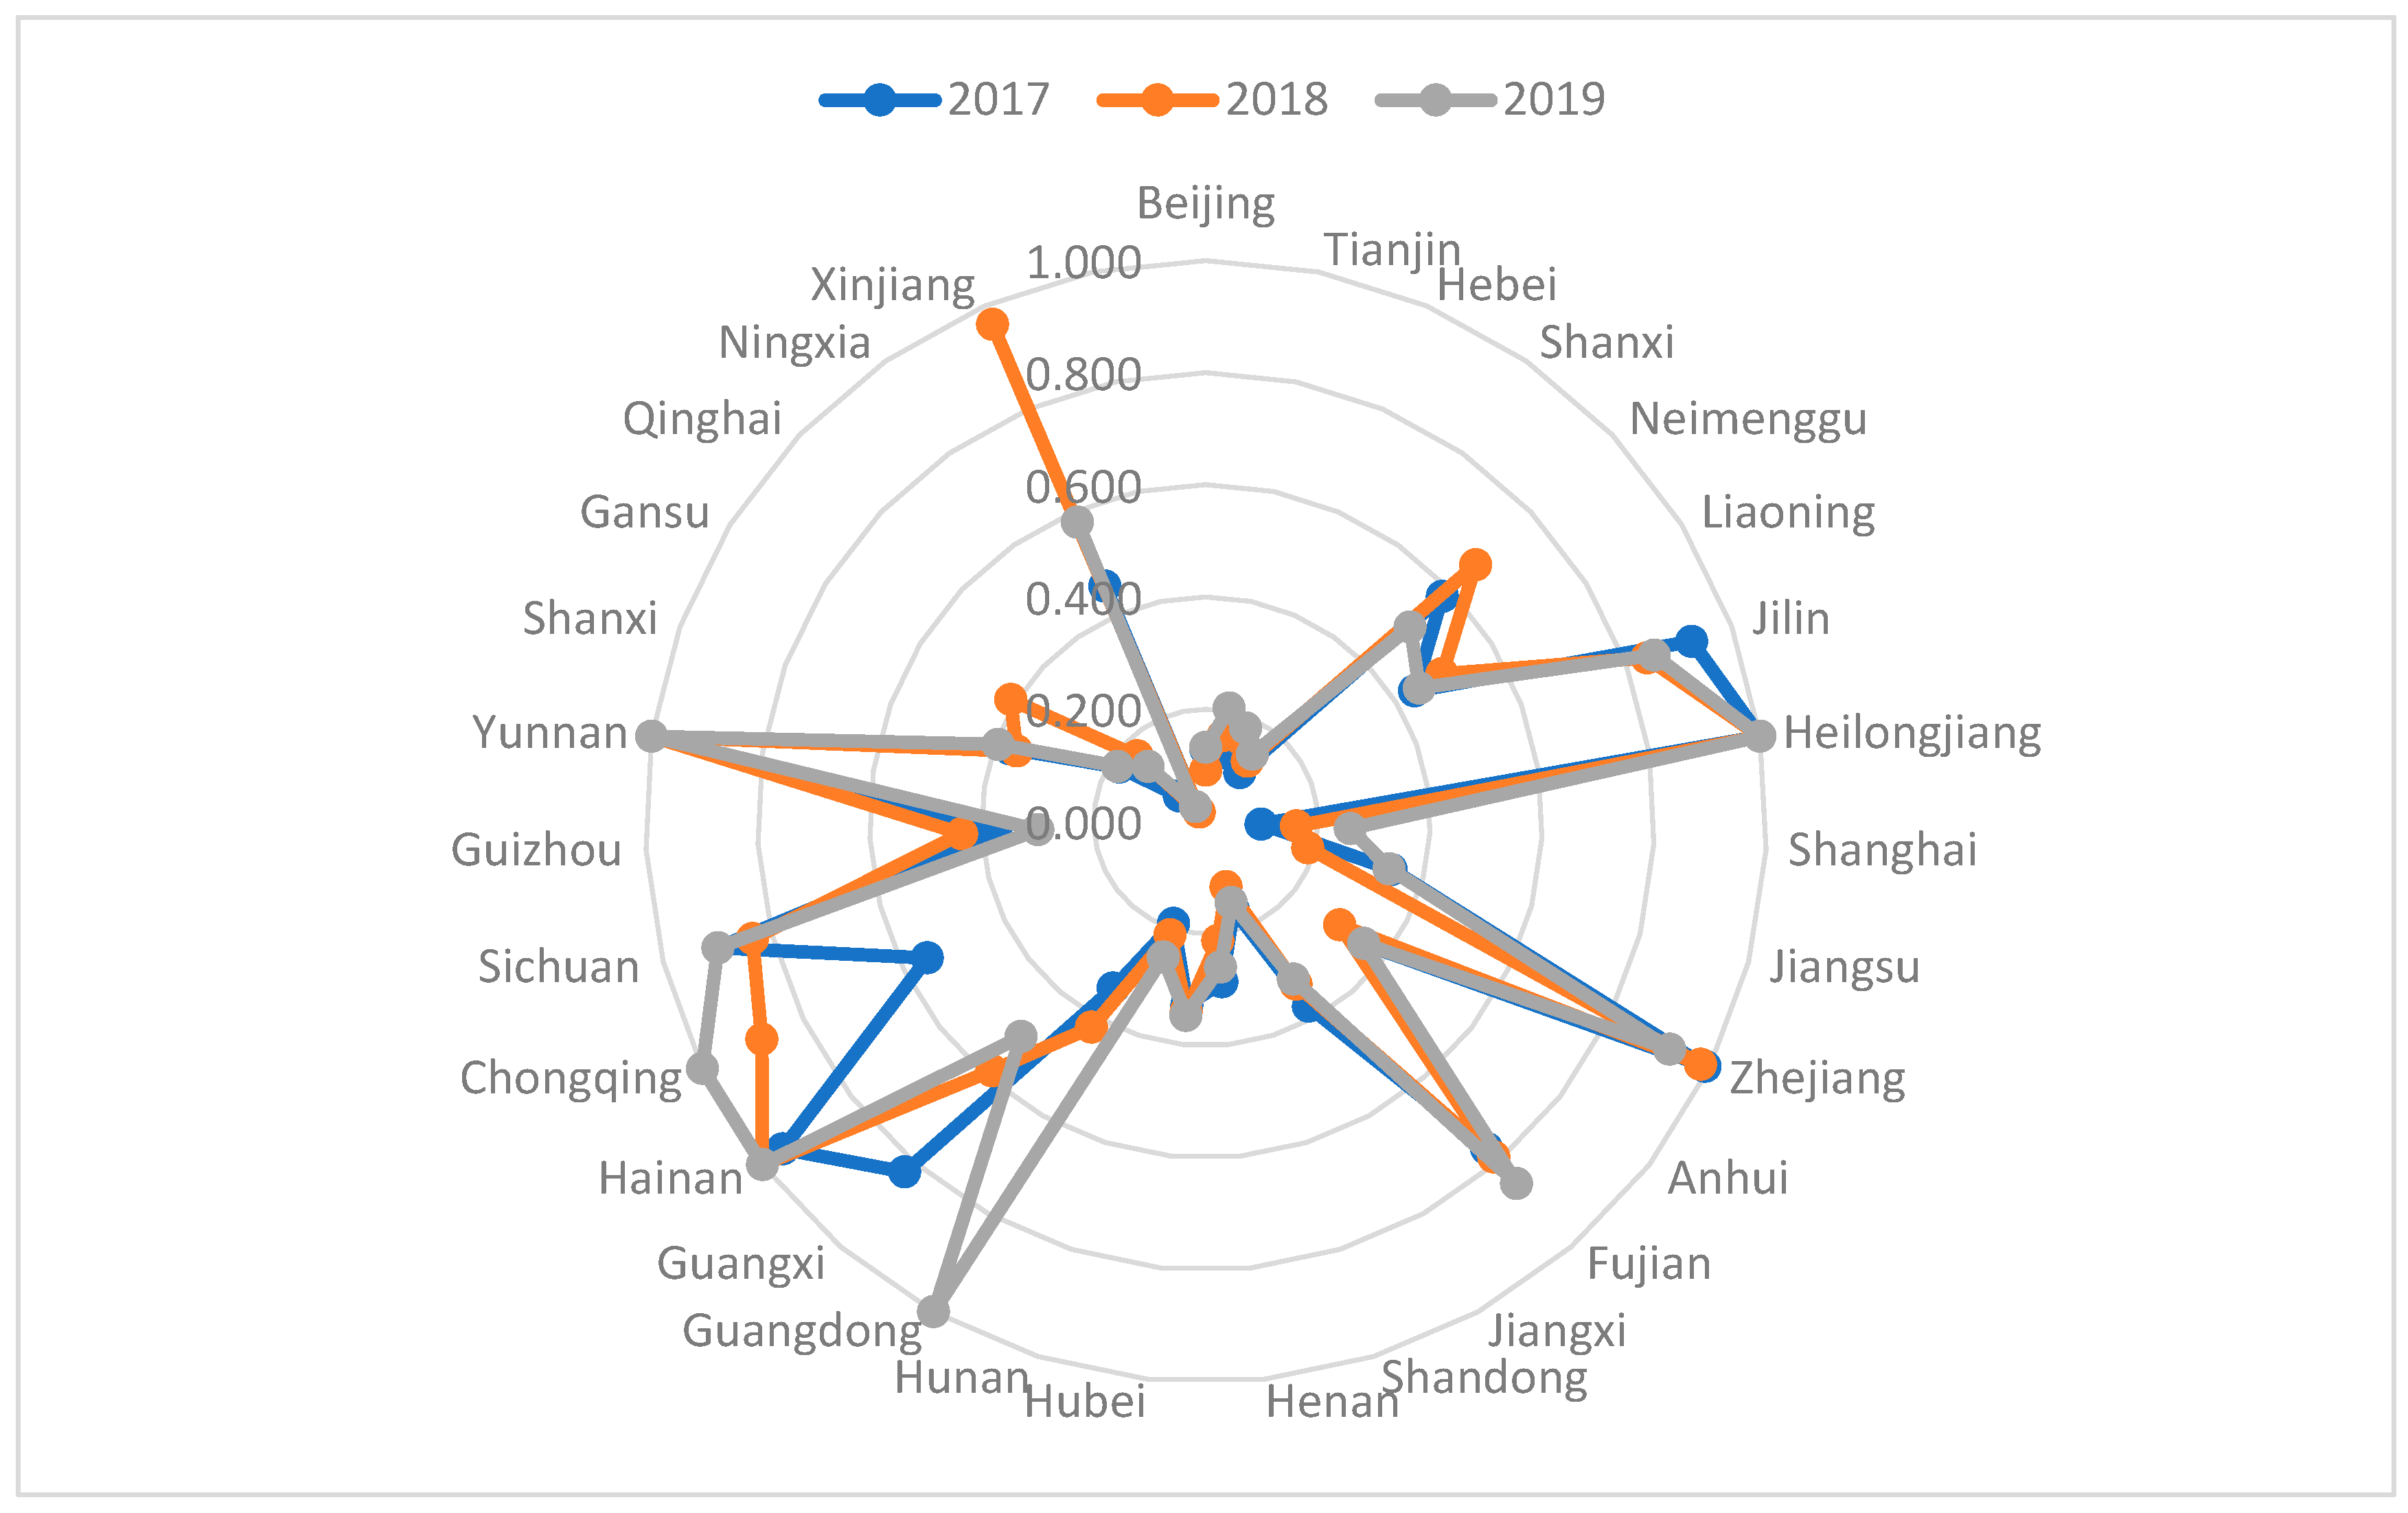
4.1. Empirical Results of DEA Model

The CCR efficiency is measured for 30 provinces (municipalities and autonomous regions) in China based on the data from 2017–2019, as shown in Figure 2. It can be seen that the provincial forest carbon sink efficiency in China presents a highly unbalanced state with large differences and polarization. The national average efficiency values for 2017–2019 are 0.446, 0.445, and 0.486, with a slight improvement in 2019 compared to the previous two years. Only Heilongjiang and Yunnan regions have a combined efficiency value of 1. The provinces on the efficiency frontier grew from the first two to four regions. We set a relatively high efficiency of ≥0.75, and the overall efficiency distribution of efficiency is shown in Table 2. From the distribution of values, the number of provinces with efficiency values in the 0–0.25 segment increased from 10 fewer in 2017 to 8 in 2019, the number of provinces in the 0.25–0.5 segment increased from 10 to 11, and the number of provinces in the 0.5–0.75 segment increased from 2 to 3. The 0.75–1 subparagraphs remain unchanged, and the efficiency has improved somewhat but not significantly in China.
Although forest carbon sinks have the unique characteristics of being relatively stable and showing little change, it can be seen from Table 2 that the overall forest carbon sink efficiency in China shows a slight upward trend. This may be due to the fact that several policies and measures on forest development in China have promoted the growth of carbon sinks; for instance, the State Forestry and Grassland Administration put forward the Opinions on Further Release of Collective Forest Management Rights in 2018, which is of great significance in promoting the implementation of rural revitalization strategy by releasing collective forest management rights and making good use of forestry resources, which is conducive to attracting social capital investment in forestry and promoting moderate-scale operation. Organic combinations of farmers and forestry modernization construction have thus introduced high technology into forestry development to improve forestry efficiency. Meanwhile, in the “2018 Forestry and Grassland Policies and Actions to Address Climate Change”, it is pointed out that all departments adhere to Xi Jinping’s thought on ecological civilization as a guide, practice the concept of green water and green mountains as the silver mountain of gold, focus on the “13th Five-Year Plan” to control greenhouse gas emissions, strive to improve the efficiency of forest carbon sinks, and solidly promote forestry to address the innovative development of climate change. It can be seen that the efficiencies of most provinces improved after the relevant policy opinions were put forward.

4.2. Input Indicator Volume

Considering the limited area of forest land in China and the small amount of change in land indicators, the average afforestation area from 2017 to 2019 was used as the land input indicator for the new production possibility set. To estimate the year-end number of forestry employees and forestry investment completion for the new production possibility set, a grey prediction model was used, and the year-end number of forestry employees was selected from 2000–2019 data as the original data. Since China only accounts for the completion of fixed assets before 2010, the completion of forestry investment appeared in the forestry statistical yearbook for the first time in 2011, so the completion of forestry investment was selected from 2011 to 2019 as the original data. The average post-test difference ratios of the year-end number of practitioners and estimated forestry investment completion results are less than 0.3 and 0.5, respectively, and the test results are good and qualified. New production may set P P S C * . The input indicators are shown in Table 3.

4.3. Empirical Results of the Inverse DEA Model

The forestry industry is characterized by a long development cycle and slow payoff of inputs. It can be assumed that the changes in forest carbon sink efficiency are subtle in the short term, and inverse DEA studies the incremental problem assuming constant efficiency, which is in line with the development of forestry and can well study the incremental situation. Based on the production possibility set P P S C and P P S C * , the CCR efficiency values of forest carbon sinks in each province were measured by model (1) φ d and φ d * as shown in Table 4.
According to Theorem 1, the provinces in different situations are classified considering the change in forest carbon sink at 2030. From the perspective of efficiency change, the efficiency is measured separately for two production possibility sets, as shown in Theorem 1. The efficiency change is used as the basis for province classification, and the results are shown in Table 4. The provinces with improved efficiency are Inner Mongolia, Liaoning, Jilin, Jiangsu, Zhejiang, Fujian, Jiangxi, Shandong, Hunan, Guangxi, Sichuan, and Xinjiang, totaling twelve provinces; the provinces with reduced efficiency are Beijing, Tianjin, Hebei, Shanxi, Shanghai, Anhui, Henan, Hubei, Guangdong, Chongqing, Guizhou, Shaanxi, Gansu, Qinghai, and Ningxia, totaling fifteen provinces. In this paper, based on the inverse DEA model, the incremental carbon sink after the change of inputs in the reduced efficiency regions was studied under the perspective of constant efficiency, and the measured results are shown in Table 5.
Since forest carbon sinks are affected by a series of factors such as resources and policies, China’s vast territory, different natural resources in each province, and different policies according to local conditions, the development of carbon sinks varies greatly and in different directions. Taking Beijing as an example, when the input increment is Δ X B e i j i n g = (3726, 540,924, −185) in 2030, the theoretical optimal increase in output indicator is obtained as Δ Y = 8240 under the condition that the comprehensive efficiency of forest carbon sink is maintained unchanged. This result shows that in Beijing, increasing the number of forestry employees by 3726, increasing the amount of forestry investment by CNY 5409.24 million, and decreasing afforestation area by 158 hectares would result in an increase in the output indicator forest carbon sink of 8240 megatons.
For Guangdong and Chongqing, where the overall efficiency is 1, it can be seen that in the future, in terms of personnel input, it can be kept constant or reduced appropriately. However, it is still necessary to ensure the increase in the amount of input funds, which is due to the fact that to maintain the efficiency at the optimal frontier surface, the development of science and technology is the most important, and the proportion of science and technology investment will increase significantly, so a large amount of funds is needed as a backup. Guangdong Province, from 2011 to 2021, increased the area of afforestation and forest cover, which shows that based on the geographical advantage of Guangdong Province, it still has unexplored forest land and can even continue to increase the area of afforestation through measures such as returning farmland to forest. Guangdong Province, through economic development and its own geographical advantage, will reach the largest increase in carbon sink in the country in 2030. Chongqing, as a mountain city, has a small base of forested area, and due to the demand of economic development, the increase in afforestation area has been slowing down or even decreasing in the past ten years. However, due to the rapid economic growth rate of Chongqing, its capital investment in forestry is maintaining a rapid growth trend, so it can still increase carbon sinks on the basis of the optimal frontier under the premise of continuous high investment.
For the three provinces of Tianjin, Anhui, and Qinghai, the forecast data show that the input indicators of one or two of them show a significant downward trend, for example, in 2030, Tianjin and Anhui decrease their personnel and capital investment, and Qinghai province decreases its afforestation area and capital investment. With most of the indicators decreasing, the low growth rate of carbon sinks can still be guaranteed under the current efficiency; this indicates that the current combined efficiency is actually much lower than the actual technical level that the two provinces can achieve, and the predicted carbon sink growth rate is at a lower level nationwide due to the too-low combined efficiency assumption. Therefore, this requires the optimal reallocation of resources through slack variables for each input indicator according to the technically effective production frontier at the current technological level, in order to seek a higher integrated efficiency and thus strive for a new high rate of carbon sink increment in 2030.
The predicted values of land input in five provinces of Hebei, Henan, Shaanxi, Shanxi, and Ningxia all show a decreasing trend, while labor and capital input are both on an increasing trend. Under the existing technology level, the decrease in land input and the appropriate increase in forestry personnel as well as capital can ensure that the carbon sink shows an increasing trend, which indicates that in these areas, the existing forest management level is low and the forest accumulation per unit area is not high. Therefore, if we can pay attention to the forest management level and improve the forest quality at this stage, the comprehensive efficiency of forest carbon sink can be greatly improved with the existing land investment. Under the premise of the higher comprehensive efficiency of forest carbon sink, if the existing afforestation area can be guaranteed, there will definitely be higher increment of carbon sink.
For provinces with increased efficiency, the study of their carbon sink increment requires changing the efficiency and studying the carbon sink increment under the perspective of efficiency change, which is not the focus of this paper; this will be considered in a subsequent study.
In summary, based on the inverse DEA model, the incremental amount of forest carbon sink is estimated on the basis of the prediction of input indicators, and the measurement of its incremental space is of practical significance for the study of the optimal resource allocation of forest carbon sink. In terms of capital input, there is more redundancy than with other input indicators, and the government should reasonably arrange the allocation of funds and channel various funds into the aspects that need to be developed. All regions have unreasonable input on indicators, and it is more important to increase the introduction of basic forestry staff and high-quality forestry talents to improve the science and professionalism of forestry development. The inverse DEA model can theoretically provide optimal input and output, and the increase or decrease amount of each indicator can be used as a reference.

5. Conclusions and Policy Implications

In this paper, through the construction of an evaluation indicator system of China’s forest carbon sink efficiency, DEA was used to portray China’s forest carbon sink efficiency, and a gray prediction model was used to estimate the change in the input indicator when China reaches peak carbon; finally, the inverse DEA model was used to study the increment of forest carbon sink in each province of China, draw conclusions, and give policy suggestions.

5.1. Research Findings

Referring to relevant research at home and abroad, this paper selects the index for evaluating China’s forest carbon sink efficiency, empirically analyzes the specific situation in this author’s country, and then estimates the change in input index through the gray prediction model. Finally, this paper introduced the inverse DEA model into the forest carbon sink and solved the two problems raised at the beginning of the article, that is, the efficiency of the new production possibility set is lower than the old production possibility set, and the carbon sink will increase immediately. China’s current forest resources technology is relatively mature, and forestry development has reached a bottleneck. The efficiency level is basically stable, so it is of practical significance to quantitatively analyze the inverse DEA model under the condition of constant efficiency, and two research conclusions are obtained.
(1) Based on Theorem 1, two production possibility sets are constructed with constant inputs and outputs, and the efficiency comparison is given according to the CCR model; Table 4 shows that 12 provinces have increased efficiency and 15 provinces have decreased efficiency. The decrease in efficiency means that the output indicator forest carbon sink will increase if the original efficiency is kept constant at the new input level. From the overall level, if the efficiency is not high, then the optimization of resource allocation is able to achieve the purpose of increasing carbon sinks by maintaining the current technology level. The provinces with lower efficiency can be broadly divided into two categories: rich in resources but they have not been fully exploited, and it is necessary to strengthen the development and utilization of resources or insufficient resources such that they can only improve the carbon sink increment by optimizing their own resource structures and giving full play to the advantages of the provinces and the characteristics of high technicians.
(2) Based on the characteristics of the inverse DEA model, the incremental carbon sink of each place is explored under the condition of constant efficiency, and the results match the actual ones to some extent. China is a vast country with different forest conditions in each province, but in general, the carbon sink increment is closely related to the current development. The conditions of forest carbon sink increase in 15 provinces are obtained. The optimal allocation of output indicator is calculated based on the inverse data envelopment analysis model. The largest increase in forestry carbon sink is 169,362 megatons in Guangdong, and the smalles is 619 megatons in Tianjin. From Table 5, we can see that areas with large forest scale and high coverage, such as Guangdong Province, are vigorously developing social economy, and most of the original forests have been exploited, but the lack of scientific and reasonable management leads to low productivity. Because of Guangdong’s superior natural conditions and development potential, there are still more unexploited forest resources, so if we can increase the afforestation area, then we can considerably increase carbon sinks. If we can increase the area of afforestation, we can increase the amount of carbon sink. In less developed areas, such as Qinghai and Gansu, the capital input and land input are lower, which requires more personnel input based on their existing forests to improve the carbon sink output per unit of forest area, thus improving the carbon sink efficiency. In areas with small forest size, the forest accumulation is small, the coverage is low, and the carbon sink itself is small, such as Shanghai, where the labor input and land input do not change much; in such places, it is necessary to increase the capital investment based on the regional advantages, and apply high technology in the field of forest carbon sink, so as to achieve the purpose of improving the carbon sink.

5.2. Policy Recommendations

China’s forest carbon sink efficiency still has more room for improvement: The development of each region is unbalanced and uncoordinated, while the waste of resources is more serious, which requires a better allocation of resources. Based on the findings of this paper, corresponding policy suggestions is given for different regions.
(1) For areas with insufficient forest resources in China, it is necessary to introduce high technology into forestry development and build a modern forestry development system. It is necessary to plan forestry development with innovative ideas, emphasize technological advantages, and take the road of modern forestry development with high efficiency. Strengthen the high-tech transformation of traditional forestry industry, strengthen high-tech technology supporting integration, improve the quality of forestry industry, and promote the quality and efficiency of forestry construction. Economically developed regions should vigorously promote the integration of high-tech and forestry industries, in order to improve the ability of independent scientific and technological innovation in forestry, accelerate the transformation of results, and further promote the efficient development of forestry. The economically backward regions should strengthen the connection with the high-tech sector, while government departments should establish incentive mechanisms; strengthen talent training and team structure; and increase the proportions of innovative, practical, professional, and technical talents in the forestry backbone team, so as to improve the overall level of forestry development under the existing conditions.
(2) For China’s forest resource-rich areas, traditional forestry development has reached a bottleneck, capital investment and land input have reached a high level, if the blind increase in capital and land input does not make the output level qualitatively improved but will make the allocation of resources out of proportion. Therefore, we must base on our own resource advantages and fully develop the value of existing forests. We should increase the introduction of basic forestry staff and high-quality forestry talents to improve the science and professionalism of forestry development.
(3) All places should continue to strengthen the protection of forestry ecology, implement accountability systems for damaging forestry ecological environment and security, and increase the punishment for malicious damage to forestry ecology. The government and forestry departments at all levels should take into account the local forestry situation, formulate guidelines with scientific and targeted approaches, make reasonable allocation of resources according to local conditions, and form a forestry development system with local characteristics. Finally, the structure of resource input indicators can be adjusted according to the efficiency evaluation results as well as the inverse DEA results, so that forestry departments at all levels can work together to optimize the allocation of resources and achieve the maximum utilization value under limited resources.

Author Contributions

Conceptualization, X.H. and Y.H.; methodology, Y.H.; software, X.H.; validation, X.H., L.C. and Y.H.; formal analysis, X.H. and L.C.; investigation, X.H. and L.C.; resources, Y.H.; data curation, X.H.; writing—original draft preparation, X.H. and Y.H.; writing—review and editing, Y.H. and L.C.; visualization, Y.H.; supervision, Y.H.; project administration, Y.H.; funding acquisition, Y.H. All authors have read and agreed to the published version of the manuscript.

Funding

This research was founded by [the National Natural Science Foundation of China] grant number [72001042], [the China Postdoctoral Science Foundation] grant number [2021M700781], [the Natural Science Foundation of Fujian Province] grant number [2019J01399] and [the Science and technology innovation special fund project of Fujian Agriculture and For-estry University (Social Sciences)] grant number [CXZX2021029].

Data Availability Statement

Not applicable.

Conflicts of Interest

The authors declare no conflict of interest.

References

  1. Xu, C.; Cheng, B.D.; Zhang, M.Z. Classification-based forest management program and farmers′ income: Evidence from collective forest area in southern China. China Agric. Econ. Rev. 2022, 14, 646–659. [Google Scholar] [CrossRef]
  2. Xu, C.; Li, L.C.; Cheng, B.D. The impact of institutions on forestland transfer rents: The case of Zhejiang province in China. For. Policy Econ. 2021, 123, 102354. [Google Scholar] [CrossRef]
  3. Diana, L. From Uncertain to Unequivocal. Environ. Sci. Policy Sustain. Dev. 2007, 49, 28–32. [Google Scholar]
  4. Luo, S.F.; Xue, L.F.; Li, Z.L. Evaluation of economic benefits of forestry carbon sink and regional coordination analysis. Stat. Decis. Mak. 2017, 2, 121–125. [Google Scholar]
  5. Xu, C.; Lin, F.L.; Li, C.Z.; Cheng, B.D. Effects of designating non-public forests for ecological purposes on farmer′s forestland investment: A quasi-experiment in southern China. For. Policy Econ. 2022, 143, 102804. [Google Scholar] [CrossRef]
  6. Luo, S.F.; Li, Z.L.; Li, R.R.; Xue, L.F. Study on the spatial and temporal differences of forestry productivity and its influencing factors in China. Arid. Zone Resour. Environ. 2017, 3, 95–100. [Google Scholar]
  7. Xu, W.; Bai, J.; Bao, Q.F. An empirical study on the extremely influential factors of technical efficiency of forestry production in Inner Mongolia: Based on stochastic frontier production function. For. Econ. 2017, 89–94. [Google Scholar]
  8. Zhang, Y.; Xiong, X. Evaluation of forestry eco-efficiency and empirical analysis of influencing factors in China in the context of green development: Based on DEA analysis perspective. J. Cent. South Univ. For. Sci. Technol. 2020, 4, 149–158. [Google Scholar]
  9. Jin, Z.L.; Cao, B.Y. Analysis of forestry investment efficiency in Hunan Province based on DEA model. J. Cent. South Univ. For. Sci. Technol. 2020, 2, 89–95. [Google Scholar]
  10. Tian, S.Y.; Xu, W.L. Evaluation of forestry input-output efficiency in China based on DEA model. Resour. Sci. 2012, 10, 1944–1950. [Google Scholar]
  11. Zhang, Y.; Yang, G.H.; Li, Z.W. Analysis of input-output efficiency of forestry in Beijing based on DEA model. J. Beijing For. Univ. 2016, 2, 105–112. [Google Scholar]
  12. Yang, M.H.; Xie, Y. A study of forestry input-output efficiency measurement based on super-efficient DEA-Malmquist. China For. Econ. 2021, 6, 7–10. [Google Scholar]
  13. He, F.D.; Huang, X.J. Tourism efficiency of forest parks in Fujian Province based on dynamic network DEA. For. Econ. Issues 2022, 42, 106–112. [Google Scholar]
  14. Xie, Y.; Chen, J.Q. Study on the development and diffusion effect of efficiency of forestry industry in China. Math. Pract. Underst. 2021, 51, 32–41. [Google Scholar]
  15. Zhang, X.Y.; Xu, D.Y. Assessing the eco-efficiency of complex forestry enterprises using LCA/time-series DEA methodology. Ecol. Indic. 2022, 142, 109166. [Google Scholar] [CrossRef]
  16. Yao, R.F.; Bian, W.Y.; Fan, H.L.; Guan, J. Evolutionary analysis of forest carbon sink efficiency in China′s provinces. For. Econ. Issues 2021, 41, 51–59. [Google Scholar]
  17. Wang, Y.H.; Wang, Y.R.; Yang, J.L.; Zhao, T.Y.; Zhang, D.H. Impact of Specialized and Diversified Agglomeration of Forestry Industry on Forestry Total Factor Productivity. Issues For. Econ. 2022, 42, 142–150. [Google Scholar]
  18. Ao, G.Y.; Wu, W.G.; Cao, X.L. Analysis of carbon sink bamboo forest production efficiency based on three-stage DEA model--empirical evidence from Anji, Zhejiang. J. Agric. For. Econ. Manag. 2019, 18, 656–666. [Google Scholar]
  19. Long, F.; Shen, Y.Q.; Wu, W.G. Carbon sink efficiency measurement and optimal design of regional forest land use process. J. Agric. Eng. 2013, 29, 251–261. [Google Scholar]
  20. Yin, S.W.; Gong, Z.W.; Gu, L.; Deng, Y.J.; Niu Yu, J. Driving forces of the efficiency of forest carbon sequestration production: Spatial panel data from the national forest inventory in China. J. Clean. Prod. 2022, 330, 129776. [Google Scholar] [CrossRef]
  21. Wei, Q.L.; Zhang, J.Z.; Zhang, X.S. An inverse DEA model for inputs/outputs estimation. Eur. J. Oper. Res. 2000, 121, 151–163. [Google Scholar] [CrossRef]
  22. Yan, H.; Wei, Q.L.; Hao, G. DEA models for resource reallocation and production input/output estimation. Eur. J. Oper. Res. 2002, 136, 19–31. [Google Scholar] [CrossRef]
  23. Saowanee, L.; Peerayuth, C.; Shu-Cherng, F. Inverse data envelopment analysis model to preserve relative efficiency values: The case of variable returns to scale. Comput. Ind. Eng. 2011, 61, 1017–1023. [Google Scholar]
  24. Sayar, T.; Ghiyasi, M.; Fathali, J. New inverse DEA models for budgeting and planning. RAIRO Oper. Res. 2021, 55, 1933–1948. [Google Scholar] [CrossRef]
  25. Gong, M. Evaluation and Optimization of Resource Allocation Efficiency of Preschool Education in China; Southwest University: Chongqing, China, 2019. [Google Scholar]
  26. Li, T. Analysis of Regional Energy Saving and Emission Reduction Measurement, Decomposition and Optimization Path in China; Zhejiang University of Technology and Industry: Hangzhou, China, 2018. [Google Scholar]
  27. Ge, H.X.; Wang, Y.R.; Chen, J.Z. A study on resource allocation of China′s provincial low-carbon economy based on inverse DEA model. Value Eng. 2018, 37, 12–16. [Google Scholar]
  28. Orisaremi, K.K.; Chan, F.T.S.; Chung, S.H.; Fu, X.W. A sustainable lean production framework based on inverse DEA for mitigating gas flaring. Expert Syst. Appl. 2022, 206, 117856. [Google Scholar] [CrossRef]
  29. Charnes, A.; Cooper, W.W.; Rhodes, E. Measuring the efficiency of decision-making units. Eur. J. Oper. Res. 1978, 2, 429–444. [Google Scholar] [CrossRef]
  30. Xi, T.T.; Li, S.L. Analysis of forest carbon sink potential in Heilongjiang Province. For. Econ. Issues 2006, 6, 519–522+526. [Google Scholar]
  31. Xu, S.S. Evaluation of forest carbon sink potential in China based on factor analysis. For. Resour. Manag. 2015, 2, 51–58+138. [Google Scholar]
  32. Xia, B.N.; Wen, M.; Ren, Y.K.; Chen, J.N.; Mi, X.Y.; Wang, P.; Tang, D.S. Evaluation of forest carbon sink development potential in Hunan Province based on hierarchical analysis method. J. Cent. South Univ. For. Sci. Technol. 2016, 36, 97–102. [Google Scholar]
  33. Wang, Q.; Meng, L.J. Total Factor Productivity Estimation of Agricultural Environment in the Middle East from the Perspective of Carbon Sink. J. Dalian Univ. Technol. (Soc. Sci. Ed.) 2014, 35, 6–11. [Google Scholar]
  34. Liu, M.; Chen, W.H.; Liu, Z.H. Green forestry economic evaluation framework for research and trial. J. For. Econ. 2016, 38, 3–10. [Google Scholar]
Figure 1. Flow chart of carbon sink inker.
Forests 13 01563 g001
Figure 2. Integrated efficiency value of forest carbon sink in China, 2017–204.
Forests 13 01563 g002
Table 1. Evaluation indicator system of forest carbon sinks development efficiency in China.
SystemThe SubsystemIndicatorsUnit
Labor inputnumber of forestry system employees at the end of the yearNumber of state-owned economic unitsPeople
Number of collective economic unitsPeople
Number of other economic unitsPeople
Capital InvestmentForestry investment completionEcological restoration and improvementmillion yuan
Forest products processing and manufacturingmillion yuan
Forestry services, security and public managementmillion yuan
Forestry Industry Developmentmillion yuan
Land inputAfforestation areaArtificial forestationhectares
Fly-sown afforestation Mountain Closure Forestryhectares
Fly-sown afforestation
Degraded forest restorationhectares
Manual updateshectares
OutputsForest carbon sinkForest carbon sinkMillions of tons
Table 2. Distribution of forest carbon sink efficiency in China, 2017–2019.
Efficiency Value Distribution Segment201720182019
NumberPercentageNumberPercentageNumberPercentage
0–0.251033.33%1240.00%826.67%
0.25–0.51033.33%826.67%1136.67%
0.5–0.7526.67%13.33%310.00%
0.75–1826.67%930.00%826.67%
Table 3. Estimated input indicators by region in 2030.
DMUNumber of Employees at the End of the Year (Number of People)Forestry Investment Completion
(Million Yuan)
Afforestation Area
(Hectare)
Beijing14,2132,929,361.529,794.0
Tianjin525399,726.910,054.3
Hebei22,1024,207,203.8555,196.0
Shanxi22,7541,200,342.2306,270.0
Inner Mongolia53,6701,955,766.1632,972.0
Liaoning20,65885,997.9151,546.3
Jilin59,7921,343,898.2144,533.3
Heilongjiang184,8901,340,881.495,743.0
Shanghai1874976,126.43268.0
Jiangsu11,486658,479.036,851.0
Zhejiang52651,372,514.254,448.3
Anhui14,093948,282.2137,153.7
Fujian10,5171,414,838.8218,551.0
Jiangxi33,1262,700,544.1293,370.0
Shandong14,0381,032,556.6145,453.3
Henan25,7635,345,893.6167,842.3
Hubei17,3509,499,127.9325,734.0
Hunan34,332168,168.1547,230.0
Guangdong18,4179,285,556.5282,151.3
Guangxi29,634378,863.0205,740.7
Hainan10,3845,362,297.312,632.0
Chongqing49721,978,886.4241,462.7
Sichuan22,1974,030,144.3554,572.7
Guizhou18,3364,360,092.6501,225.7
Yunnan30,3171,016,097.6419,468.3
Shaanxi30,5672,562,457.7326,840.7
Gansu38,917923,749.1347,925.3
Qinghai29,000275,192.4194,375.7
Ningxia8780865,615.189,941.3
Xinjiang20,663297,914.3263,358.3
Table 4. CCR efficiency and deviation in 2019 and 2030.
DMU20192030Bias
Beijing0.1320.110−0.022
Tianjin0.2060.149−0.057
Hebei0.1810.081−0.100
Shanxi0.1460.094−0.052
Inner Mongolia0.5030.5050.002
Liaoning0.4491.0000.551
Jilin0.8530.9020.049
Heilongjiang1.0001.0000.000
Shanghai0.2580.194−0.064
Jiangsu0.3380.3520.014
Zhejiang0.9221.0000.078
Anhui0.3560.351−0.005
Fujian0.8510.9260.075
Jiangxi0.3220.3530.031
Shandong0.1520.1670.015
Henan0.2610.253−0.008
Hubei0.3480.290−0.058
Hunan0.2540.8230.569
Guangdong1.0000.373−0.627
Guangxi0.5060.8760.370
Hainan1.0001.0000.000
Chongqing1.0000.553−0.447
Sichuan0.8991.0000.101
Guizhou0.3000.273−0.027
Yunnan1.0001.0000.000
Shaanxi0.3950.290−0.105
Gansu0.1850.151−0.034
Qinghai0.1420.083−0.059
Ningxia0.0320.023−0.009
Xinjiang0.5800.6560.076
Average0.4860.389−0.097
Table 5. Inverse DEA results for efficiency reduction areas.
DMUComprehensive EfficiencyΔx1
(Number of People)
Δx2
(Million Yuan)
Δx3
(Hectare)
Δy
(Megaton)
Beijing0.1323726540,924−1858240
Tianjin0.206−138−48,6581406619
Hebei0.18133912,775,971−45,76017,460
Shanxi0.146553125,665−33,8787270
Shanghai0.258452735,781855198
Anhui0.356−2225−108,656−13391490
Henan0.2615873,367,971−575424,868
Hubei0.348−76476,177,305−492328,100
Guangdong1.000−85069,156,93711,689169,362
Chongqing1.000831,213,134−28,54028,991
Guizhou0.300−14,4201,370,015154,5501060
Shaanxi0.39521301,420,887−21,25326,193
Gansu0.1854971−440,522−44,8402888
Qinghai0.14220,585−301,019−11,5281925
Ningxia0.0321231570,612−10,114746
Publisher’s Note: MDPI stays neutral with regard to jurisdictional claims in published maps and institutional affiliations.

