Article

Land-Use Change Depletes Quantity and Quality of Soil Organic Matter Fractions in Ethiopian Highlands

by
Iftekhar U. Ahmed
1,*,
Dessie Assefa
2 and
Douglas L. Godbold
1
1
Institute of Forest Ecology, Department of Forest and Soil Sciences, Universität für Bodenkultur (BOKU), Peter Jordan Strasse 82, 1190 Vienna, Austria
2
Department of Natural Resources Management, Bahir Dar University, Bahir Dar P.O. Box 5501, Ethiopia
*
Author to whom correspondence should be addressed.
Forests 2022, 13(1), 69; https://doi.org/10.3390/f13010069
Submission received: 27 November 2021 / Revised: 25 December 2021 / Accepted: 27 December 2021 / Published: 4 January 2022
(This article belongs to the Section Forest Ecology and Management)

Abstract

:
The depletion of soil organic matter (SOM) reserve after deforestation and subsequent management practices are well documented, but the impacts of land-use change on the persistence and vulnerability of storage C and N remain uncertain. We investigated soil organic C (SOC) and N stocks in a landscape of chrono-sequence natural forest, grazing/crop lands and plantation forest in the highlands of North-West Ethiopia. We hypothesized that in addition to depleting total C and N pools, multiple conversions of natural forest significantly change the relative proportion of labile and recalcitrant C and N fractions in soils, and thus affect SOM quality. To examine this hypothesis, we estimated depletion of SOC and N stocks and labile (1 & 2) and recalcitrant (fraction 3) C and N pools in soil organic matter following the acid hydrolysis technique. Our studies showed the highest loss of C stock was in grazing land (58%) followed by cropland (50%) and eucalyptus plantation (47%), while on average ca. 57% N stock was depleted. Eucalyptus plantation exhibited potential for soil C recovery, although not for N, after 30 years. The fractionation of SOM revealed that depletions of labile 1 C stocks were similar in grazing and crop lands (36%), and loss of recalcitrant C was highest in grazing soil (56%). However, increases in relative concentrations of labile fraction 1 in grazing land and recalcitrant C and N in cropland suggest the quality of these pools might be influenced by management activities. Also, the C:N ratio of C fractions and recalcitrant indices (RIC and RIN) clearly demonstrated that land conversion from natural forest to managed systems changes the inherent quality of the fractions, which was obscured in whole soil analysis. These findings underscore the importance of considering the quality of SOM when evaluating disturbance impacts on SOC and N stocks.

1. Introduction

Globally, deforestation is the dominant land-use change process, and results in severe impacts on the biogeochemical properties of soil. The impacts occur directly through changes in above and below-ground vegetative inputs, turnover of soil organic matter and soil erosion; and indirectly, through biodiversity loss [1,2]. All these processes have a regulatory influence on the storage of SOC and N, depending on various modifying factors such as climate, forest types, land and soil characteristics and post-conversion management activities. However, the magnitude and dimensions of soil organic matter depletion through multiple land conversions remain poorly understood. The quantifications of C and N pools after disturbance are site and context-specific; however, in general, it was estimated that 24–52% of SOC is lost due to the conversion of forest to crop land [1,3,4]. Globally, the climate feedback of these losses is enormous, but at the local scale, the quantity and quality of the remaining soil organic matter are also crucial for long-term C sequestration. Most previous studies considered organic C stocks in bulk soil, despite the fact that soil organic matter (SOM) is composed of several pools, with different degrees of stabilization, and hence turnover times ranging between a few days to several centuries [5]. Therefore, it necessary to evaluate the quality or biodegradability of the remaining organic matter as influenced by land-use change.
The Afromontane forests in the highlands of Ethiopia have high soil C stocks that are the result of thousands of years of accumulation, and are probably a consequence of the high species and trait diversities in the area [6]. However, due to deforestation, remnants of the original Afromontane forests are largely restricted to church forests and other sacred groves in a matrix of cropland and semiarid degraded grassland. In a recent study, Regasa et al. [7] reviewed the land-use changes in Ethiopia during past decade and showed that natural forest decreased by 19% and cropland increased by 32%, indicating many old growth forests were converted to agroecosystems. The size and quality of the soil carbon stocks in these ecosystems still remain highly uncertain. The removal of the tree cover and conversion to crop or grazing land and subsequent soil erosion result in loss of SOC, soil fertility and microbial stability [8]. Kassa et al. [9] reported 32 and 43% loss of soil C and N stocks, respectively, from deforested crop land in the White Nile Basin of Ethiopia. Amanuel et al. [10] estimated 36 and 28% more SOC stocks in natural mixed forest than cultivated land and eucalyptus plantation in the upper Blue Nile Basin, indicating improved soil conditions due to the establishment of tree plantation. These findings are highlighting the severity of land-use change impact on the depletion of soil C stock, but the sustainability of remaining C and N stocks is not clear, especially in terms of stability for climate change mitigation. It is well established that land use change modifies sources of organic matter inputs in soil and major biogeochemical processes; therefore, it is likely to reshape biochemical quality of soil organic matter after disturbance. Villarino et al. [11] reported 60 and 15% losses of particulate and mineral organic C, respectively, after 10 years of deforestation in a semi-arid region of Argentina. If the fractions of organic C are considered, Liu et al. [12] reported that the reduction of labile, semi-labile and recalcitrant organic C in different crop land soils compared to pastures in China. As deforestation and other land conversion are ubiquitous in Ethiopia, the estimation of the stability of soil organic matter is important in assessments of potential carbon storage.
Traditionally, the quality of soil organic matter refers to the capacity to provide nutrients/energy sources for microbial utilization during decomposition [13]. Low substrate quality indicates slow decay rates during microbial decomposition and forms the basis for chemically recalcitrant substances [14]. However, some recent studies showed that SOM stability is not only caused by the chemical recalcitrance of materials but also due to associated interactions with the physical, chemical and biological properties of the soil environment [15,16]. As soil organic matter is a mixture of highly heterogenous compounds of various molecular weights, functional complexities and biodegradability, the total amount is often portioned into pools of easily degradable labile and refractory substances [17,18,19]. This is the approach currently used for the parameterization of the major SOM dynamics models (i.e., Roth C, CENTURY). The labile part of organic matter includes simple sugars, amino acids, microbial biomass and metabolic compounds of plant and microbial origin, while the recalcitrant pools consist of high molecular weight compounds such as humus and lignin, and aliphatic or aromatic materials such as fatty acid, ester, wax and alkene [20,21]. This partitioning has important implications for nutrient availability and atmospheric emission, and is persistent in soil, and can therefore be used as a quality indicator of SOC and N stocks [22,23].
To quantify and assess the labile and recalcitrant forms of SOC and N, the acid hydrolysis method is extensively used as a simple procedure in ecological research [16,24,25,26,27]. The method is based on the fact that unhydrolyzed residues of soil organic matter are also resistant to enzymatic degradation, and consequently more biologically stable in the soil ecosystems [28]. In this method, the hydrolysable fraction includes easily degradable and young SOM, while non-hydrolysable residues consist of old and recalcitrant compounds, and thus the biochemical quality of SOM can be evaluated by measuring its hydrolysability [22]. Although acid hydrolysis is a widely used traditional approach in analyzing fiber (i.e., klason lignin), humus and the fractionation of SOM, recent studies showed two shortcomings in analyzing labile and recalcitrant pools: (a) volatilization loss of C upon heating during hydrolysis processes, creating unaccounted mass and (b) conversion of carbohydrates (hydrolysable) to nonhydrolyzable substances as “de novo synthesis” during acid hydrolysis, which may overestimate the recalcitrant pool [29]. The method was improved by lowering the temperature (~100 °C) and duration for hydrolysis [14]. Similarly, biphasic (two steps) hydrolysis could minimize artefacts by removing the labile carbohydrates from the system at initial stage of hydrolysis. Overall, in spite of some drawbacks, the method has been used to characterize soil organic matter quality in connection to long-term stability [16].
Our study location of Gelawdios, Ethiopia offers an ideal landscape position of chrono-sequence land-uses with natural forest-grazing and crop lands-eucalyptus plantation, to test the impacts of changes on soil C and N storage and stability. No doubt, historically, the entire area was under native forest and gradually cleared for grazing and crop field as a part of agricultural striving to support an ever-growing population. The patches of original forest still remain intact, allowing us to study and quantify these as reference conditions. After long-term intensive agricultural practices, parts of the degraded land were converted to exotic eucalyptus plantation. Obviously, these multiple changes in vegetation cover and management activities encompassed strong effects on soil biogeochemical conditions, particularly soil C and N dynamics [2]. Here, we studied storage of SOC and N and organic matter fractionation in relation to biodegradability and their quality in grazing and crop lands and eucalyptus plantation, and compared these with original natural forest to pursue the following objectives: (i) to estimate the severity of C and N losses in crop and grazing lands after land conversions and the potentiality of eucalyptus planation to restore the degradation; (ii) to estimate the stability of soil organic matter on the basis of biodegradability based on labile and recalcitrant C and N pools; and (iii) to evaluate the quality of labile and recalcitrant pools.

2. Materials and Methods

2.1. Location/Experiment Sites

The study sites were a natural remnant forest, adjacent grazing and crop lands and a plantation forest at Gelawdios (11°38′25″ N, 37°48′55″ E) in the Amhara National Regional State of Ethiopia (Figure 1). The altitude of the study area is about 2500 m a.s.l and the climate of the region is tropical monsoon with a mean annual temperature of 19 °C and annual precipitation of about 1353 mm [30]. The wet season, locally known as Kiremt, contributes 84% of the annual precipitation, while the main dry period, Bega, and a short medium rainy spell, Belg, together account for 16% of annual total rainfall. The soils are recognized as Cambisols, with basalt rocks below 50 cm depth (WRB 2014). The study areas include the historical Gelawdios church forest, which was built in 1500 A.D. The forest currently extends over 68 ha, is classified as an Afromontane dry tropical forest [31,32] and is adjacent to grazing and crop lands and a nearby eucalyptus plantation. Natural forest is dominated by evergreen native trees such as Chionanthus mildbraedii, Euphorbia abyssinica, Albizia gummifera and Apodytes dimidiata. In addition, the shrub species Teclea nobilis (evergreen) and Combretum molle (deciduous) dominate the bush layer. The adjacent grazing land is highly degraded due to erosion of the topsoil and is characterized by scattered grass and large patches of bare soil. Historically, the grazing land was natural forest but was converted approximately 50 years ago [8]. The plantation forest of Eucalyptus globulus was established on an abandoned crop/grazing land in 1985. This pattern of land conversion is a common practice in the Ethiopian highlands when grazing land becomes degraded [33].

2.2. Soil Sampling and Analysis

Soil samples were collected following a systematic sampling protocol during March 2014. Details of sampling, processing and routine analyses were presented in Assefa et al. [8]. Briefly, in the natural or plantation forests, soil samples were collected from five soil profiles (50 cm depth) at 50–100 m interval along a band transect with four vertical sampling layers viz. 0–10, 10–20, 20–30 and 30–50 cm. Similarly, five replicated profile sampling from grazing and crop lands each were carried out along the transect lines. We used a stainless-steel soil corer (70 cm long and 6.6 internal diameter; Vienna Scientific Instruments, Vienna, Austria) to extract an intact 50 cm soil monolith profile and then divided it into depth sections, processed separately. Soils were hand sorted, sieved through 2 mm mesh sieve and stored at 4 °C until further processing.

2.2.1. Soil pH and Organic Matter

Soil pH was determined in a 1:2.5 ratio of soil:water suspension using a pH meter (Orion 410A pH meter). Soil organic matter (SOM) was determined following the loss on ignition (LOI) method. Oven-dry (105 °C, WT1) samples were heated in a muffle furnace at 450 °C overnight (WT2, weight after combustion) and the per cent organic matter was calculated as follows:
SOM (%) = (WT1 − WT2)/WT1 × 100

2.2.2. Bulk Density

The bulk density of the soil was determined by the core method using stainless steel core (100 cm3). Samples were collected from different soil depths by the core sampler. Removing the extra soil and protruding roots, the soil contents was transferred to a pre-weighed aluminum cup and dried at 105 °C until constant mass. As the soils contained small stones (>2 mm), the soil was washed though a 2 mm sieve with flow of water and all stones were collected. The volume of the stones was estimated by water replacement using a measuring cylinder and the mass of the stones was recorded after oven drying. Bulk density was calculated from volume of the core and dry mass of soil with correction factor for stones.

The Particle Size

The particle size distribution was determined by a simplified method combining wet sieving and sedimentation processes [34]. In this method, soils were pre-treated with 30% H2O2 (2:1 ratio of Soil:H2O2) and mixed with 3% Calgon solution (sodium hexametaphosphate, (HMP, (NaPO3) n) at a ratio of 1:3 and shaken on a horizontal shaker for 2 h. The soil slurry was then passed through a 0.053 mm sieve to collect the sand fraction. The suspension (with silt and clay) was stirred in a 800 mL beaker thoroughly and allowed to settle at room temperature (at 20 °C) for a period of >1.5 to <6 h. After the sedimentation period, the suspended clay fraction was siphoned off, leaving behind the settled silt particles. The silt fraction was then dried in the beaker at 105 °C to constant weight.

Acid Hydrolysis

We used acid hydrolysis technique to separate recalcitrant and labile pools of soil organic matter. Most of the labile parts (carbohydrates and proteins) of soil organic matter are released during acid hydrolysis, whereas the recalcitrant organic polymers are resistant to acid hydrolysis and thus separate as the residual [22]. In brief, labile soil C fractions (1 & 2) were extracted by two-step hydrolysis treatments using 2.5 M and 13 M H2SO4. To extract C fractions, 0.5 g of homogenized, air-dried soil was mixed with 2.5 M H2SO4 and warmed in a digestion block for 30 min. After cooling, the hydrolysate was centrifuged, and the clear supernatant was collected. The residue was washed and added to the hydrolysate and kept in glass bottle at 4 °C as fraction 1. Unhydrolyzed residues were further extracted with 13 M H2SO4, shaken overnight, diluted with distilled water and hydrolyzed for 3 h at 100 °C. The clear hydrolysate was decanted after centrifugation as before and the residues were washed twice, added with hydrolysate and stored as fraction 2. C and N concentrations in hydrolysates 1 and 2 were measured by a TOC-V-TN analyzer (Shimadzu Corp., Kyoto, Japan). After second hydrolysis, the un-hydrolyzed residual C was termed as recalcitrant pool (fraction 3) and was estimated by deducting the summed of labile fractions from total organic C and N content of the soil [35].

Organic Carbon and Total Nitrogen

Total C and N in soil were measured by dry combustion technique using a CN analyzer (TruSpec® CN, LECO Inc., St. Joseph, MI, USA). Interference due to inorganic carbonates may cause error in the estimation in calcareous soil. However, soil pH is a good indicator for calcium carbonates and the pH range from 7.8 to 8.2 indicates the presence of inorganic forms of C. As a safety measure, a pH of 7.4 is considered as the limit above which the sample should be treated to remove carbonates [36]. The pH of our soil samples ranged 5.4–6.3, hence no carbonates were present.

Stock Calculation

Calculation of C storage: Soil C storage was calculated using the following equation:
Soil C storage (g m−2) = [C × (100−R) × D × 100]/BD
where, C = % Carbon in soils, R = Volume of rocks in soils (% of soil volume), D = Soil depth (cm), BD = Bulk density of soils (g cm−3).
C storage in 50 cm soil profile (g m−2) = ∑ (D1........D4)

Recalcitrance Index

Recalcitrance indexes for C and N (RIC and RIN, respectively) were calculated using the following equations [22]:
  • RIC (%) = unhydrolyzed C/total organic C × 100
  • RIN (%) = unhydrolyzed N/total N × 100

2.3. Statistical Analysis

The normality and homogeneity of variables’ data were checked using the Kolmogorov–Smirnov (K–S) and Levene’s tests, respectively. To examine the effects of land-use types, soil depths and the interaction of these two (land-use × depth) on C and N fractions, two-way ANOVA was conducted with SPSS 16.0 (SPSS Inc., Chicago, IL, USA) and the further post hoc Tukey’ HSD test was used to explore exactly which combination differs significantly. To explore the significant variations of the C:N ratio of different C fractions and recalcitrant indices along land-use types, one-way ANOVA was used. The level of significance p < 0.05 was accepted in all cases. Principal component analysis (PCA) was performed to assess the relationships between soil C and N and their fractions under four land-use types using Canoco (version 5.0, Microcomputer Power, Ithaca, NY, USA).

3. Results

3.1. Variations in C and N Stocks along Soil Depth

The physico-chemical characteristics of top soil in four land-use types showed a substantial variation in SOM after conversions of land-uses in the experiment sites (Table 1). Depletion of total soil C storage (0–50 cm) was highest in grazing land (58%), followed by cropland (50%) and eucalyptus plantation (47%), when compared with forest soil (Figure 2). The vertical distribution of organic C showed that a reduction in C stock decreased with increasing depth in soils of crop and grazing lands; however, top soil (0–10 cm) of eucalyptus plantation showed significantly lower reduction in C stocks than the other two land use types (p = 0.016 and 0.017 in comparison with crop and grazing lands, respectively). The conversion of natural forest to grazing and crop lands and eucalyptus plantation caused similar reductions of soil N stocks (on average ca. 58% less soil N in other land-uses than forest) along a 0–50 cm soil profile. The highest N stock loss was from 0–10 cm of crop land (65%) and the lowest from 30–50 cm (28%). Unlike soil C stock, no significant variation in N stock of top layers were observed between eucalyptus plantation soil and crop and grazing lands (Figure 2).

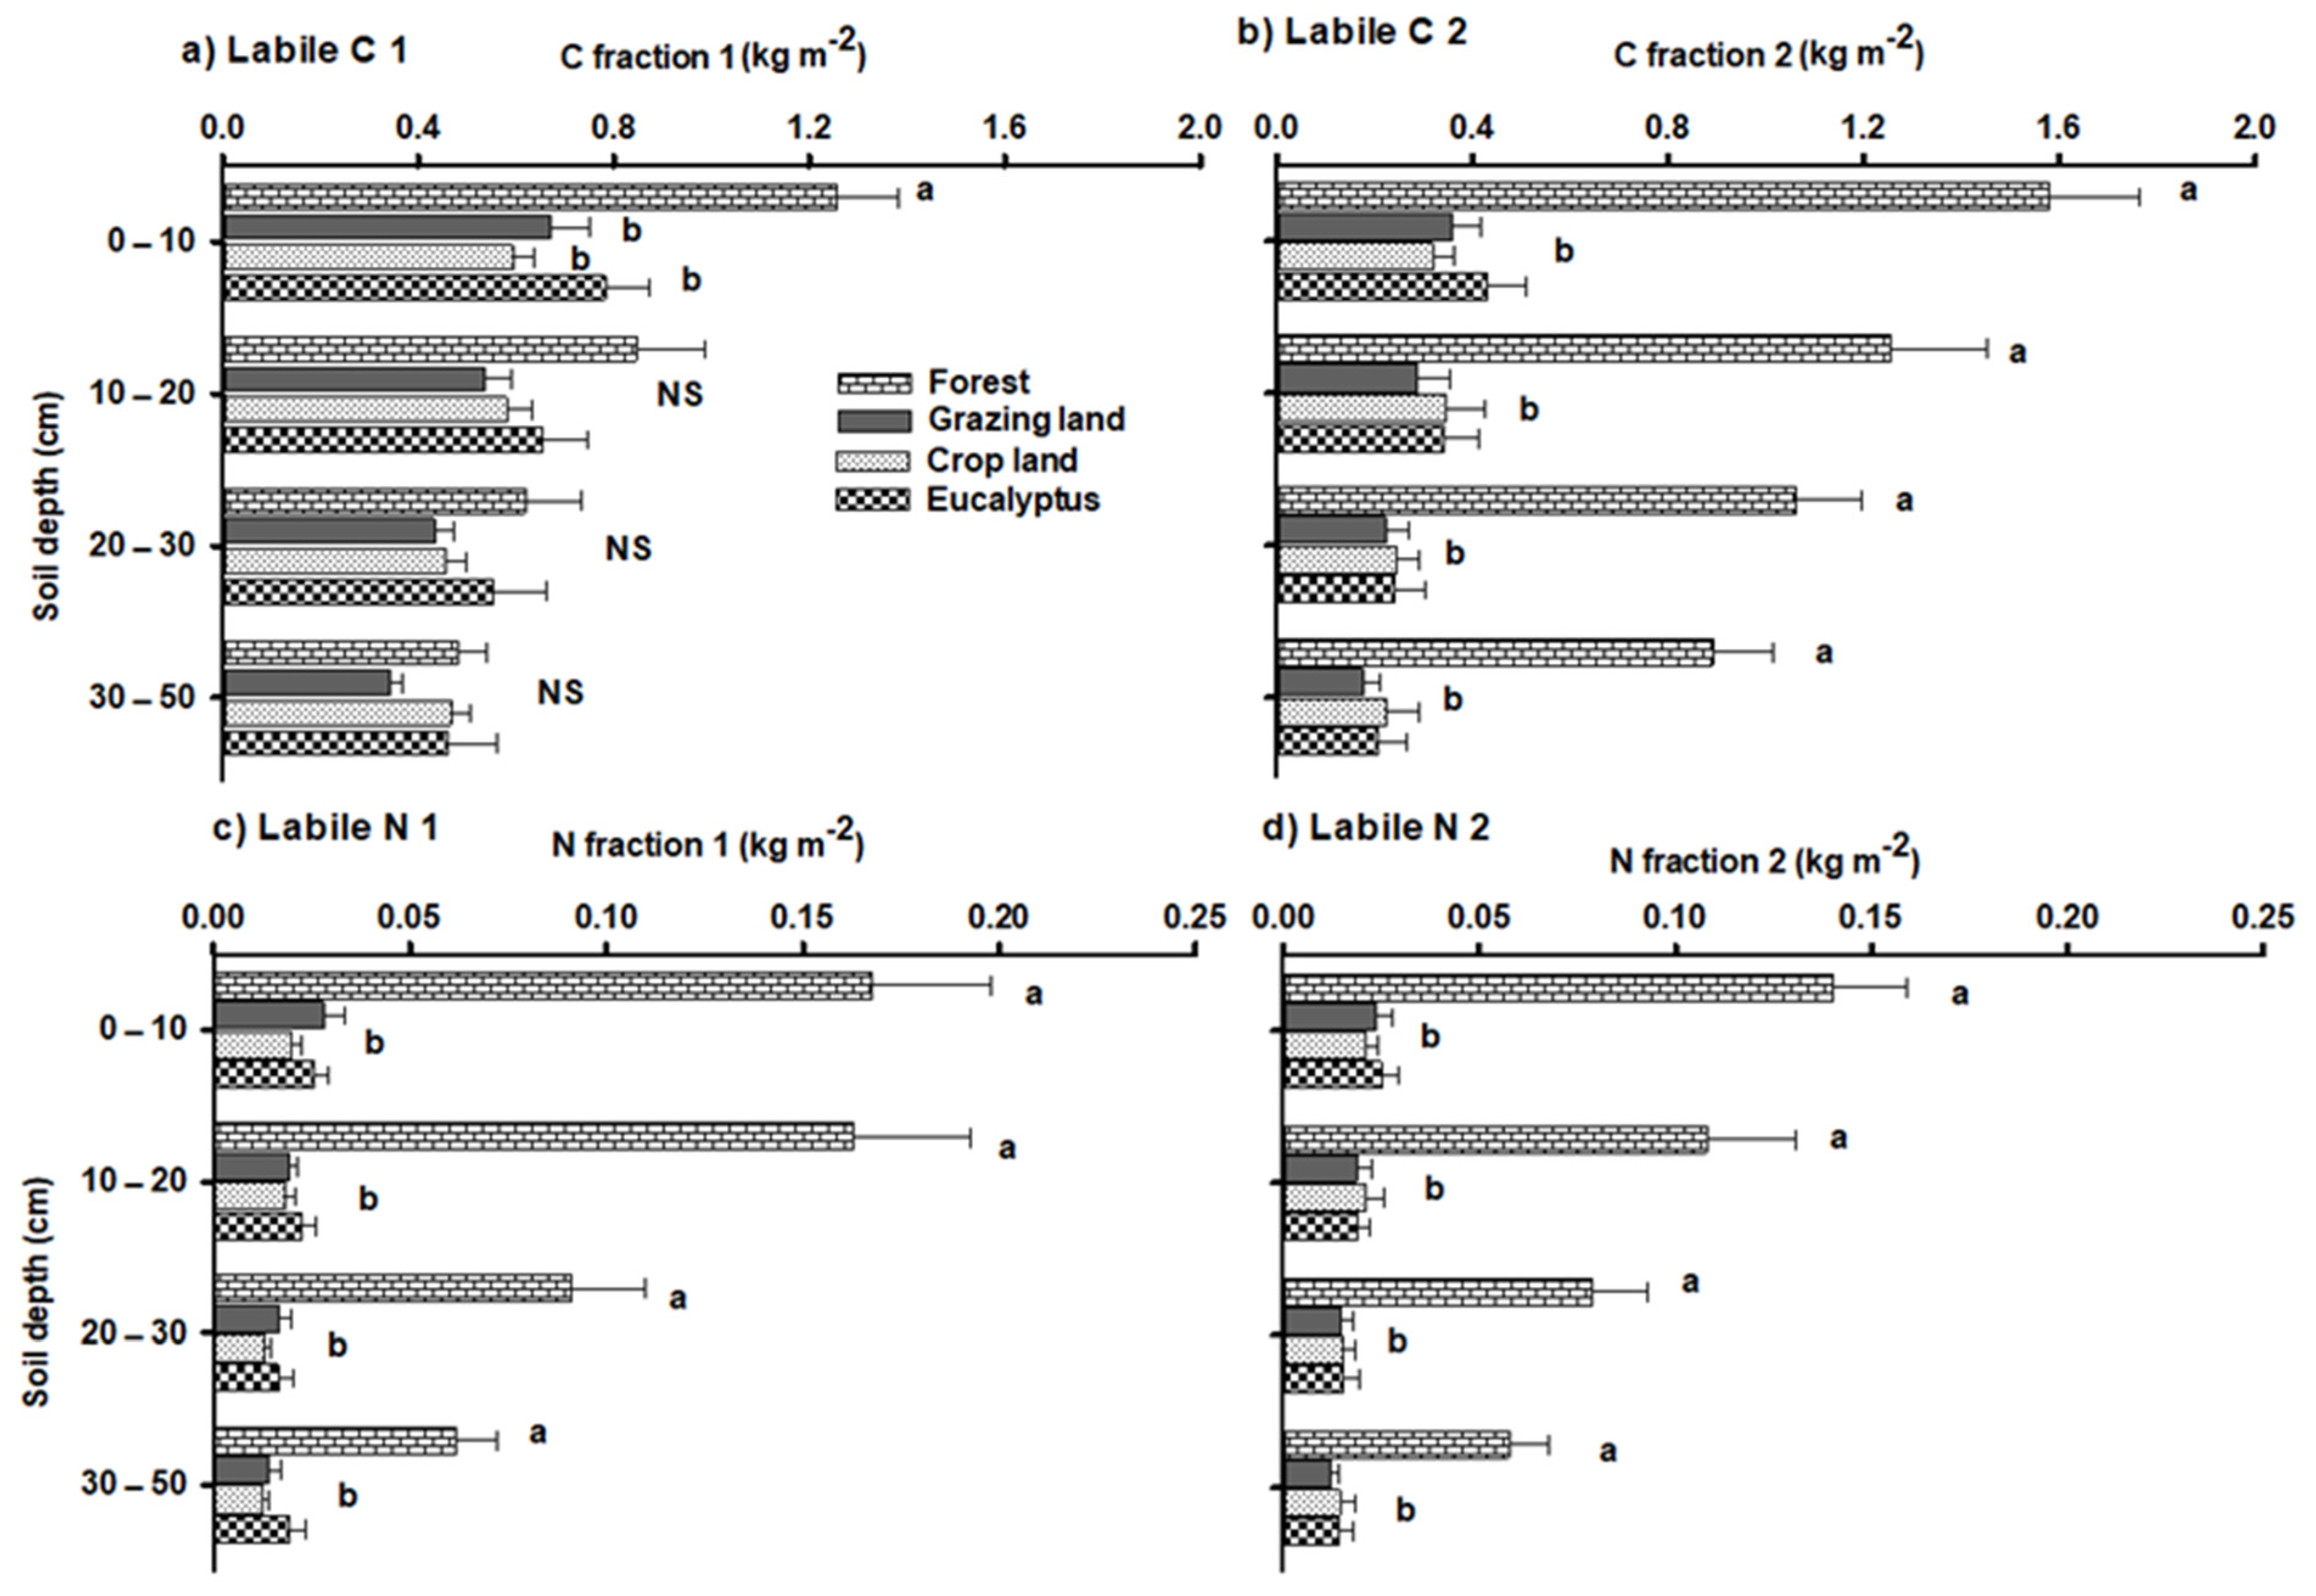
3.2. Labile C and N Stocks in Different Land-Use Types

The storage of labile C fraction 1 (putative carbohydrates and polysaccharides) in top soil layer (0–10 cm) under different land uses followed the order natural forest > eucalyptus plantation > grazing land > crop land, with significantly higher levels in natural forest soil than the soils of other land-use types. However, the variations between all land uses were not significant along other soil depths (Figure 3).
Labile 1 stock in 0–50 cm soil profile of grazing, crop lands and eucalyptus soils were 38, 34 and 23% lower than forest soil, indicating a major depletion of available energy sources due to land use change. In contrast, labile C fraction 2 (putatively cellulose containing materials) in forest soil was significantly higher than other land uses in all four soil layers (Figure 3b). The average depletion of C fraction 2 in crop and grazing lands and eucalyptus plantation was ca. 76% of the old-growth forest. Although our results indicated significant reduction of C fraction 1 and 2 due to land use change and soil depth, no interaction effect was observed between these two factors (Table 2).
The stock of labile N fraction 1 and 2 in soil exhibited a similar response after the conversion from forest to the other land uses (Figure 3c,d). The depletions of soil-labile N were 83 and 80% for fraction 1 and 2, respectively, as compared to natural forest. The vertical distribution of these N fractions showed a similar pattern of reduction in soils of crop and grazing lands and eucalyptus plantation. However, two-way ANOVA revealed no significant interactions between land-use and soil depths (Table 2).

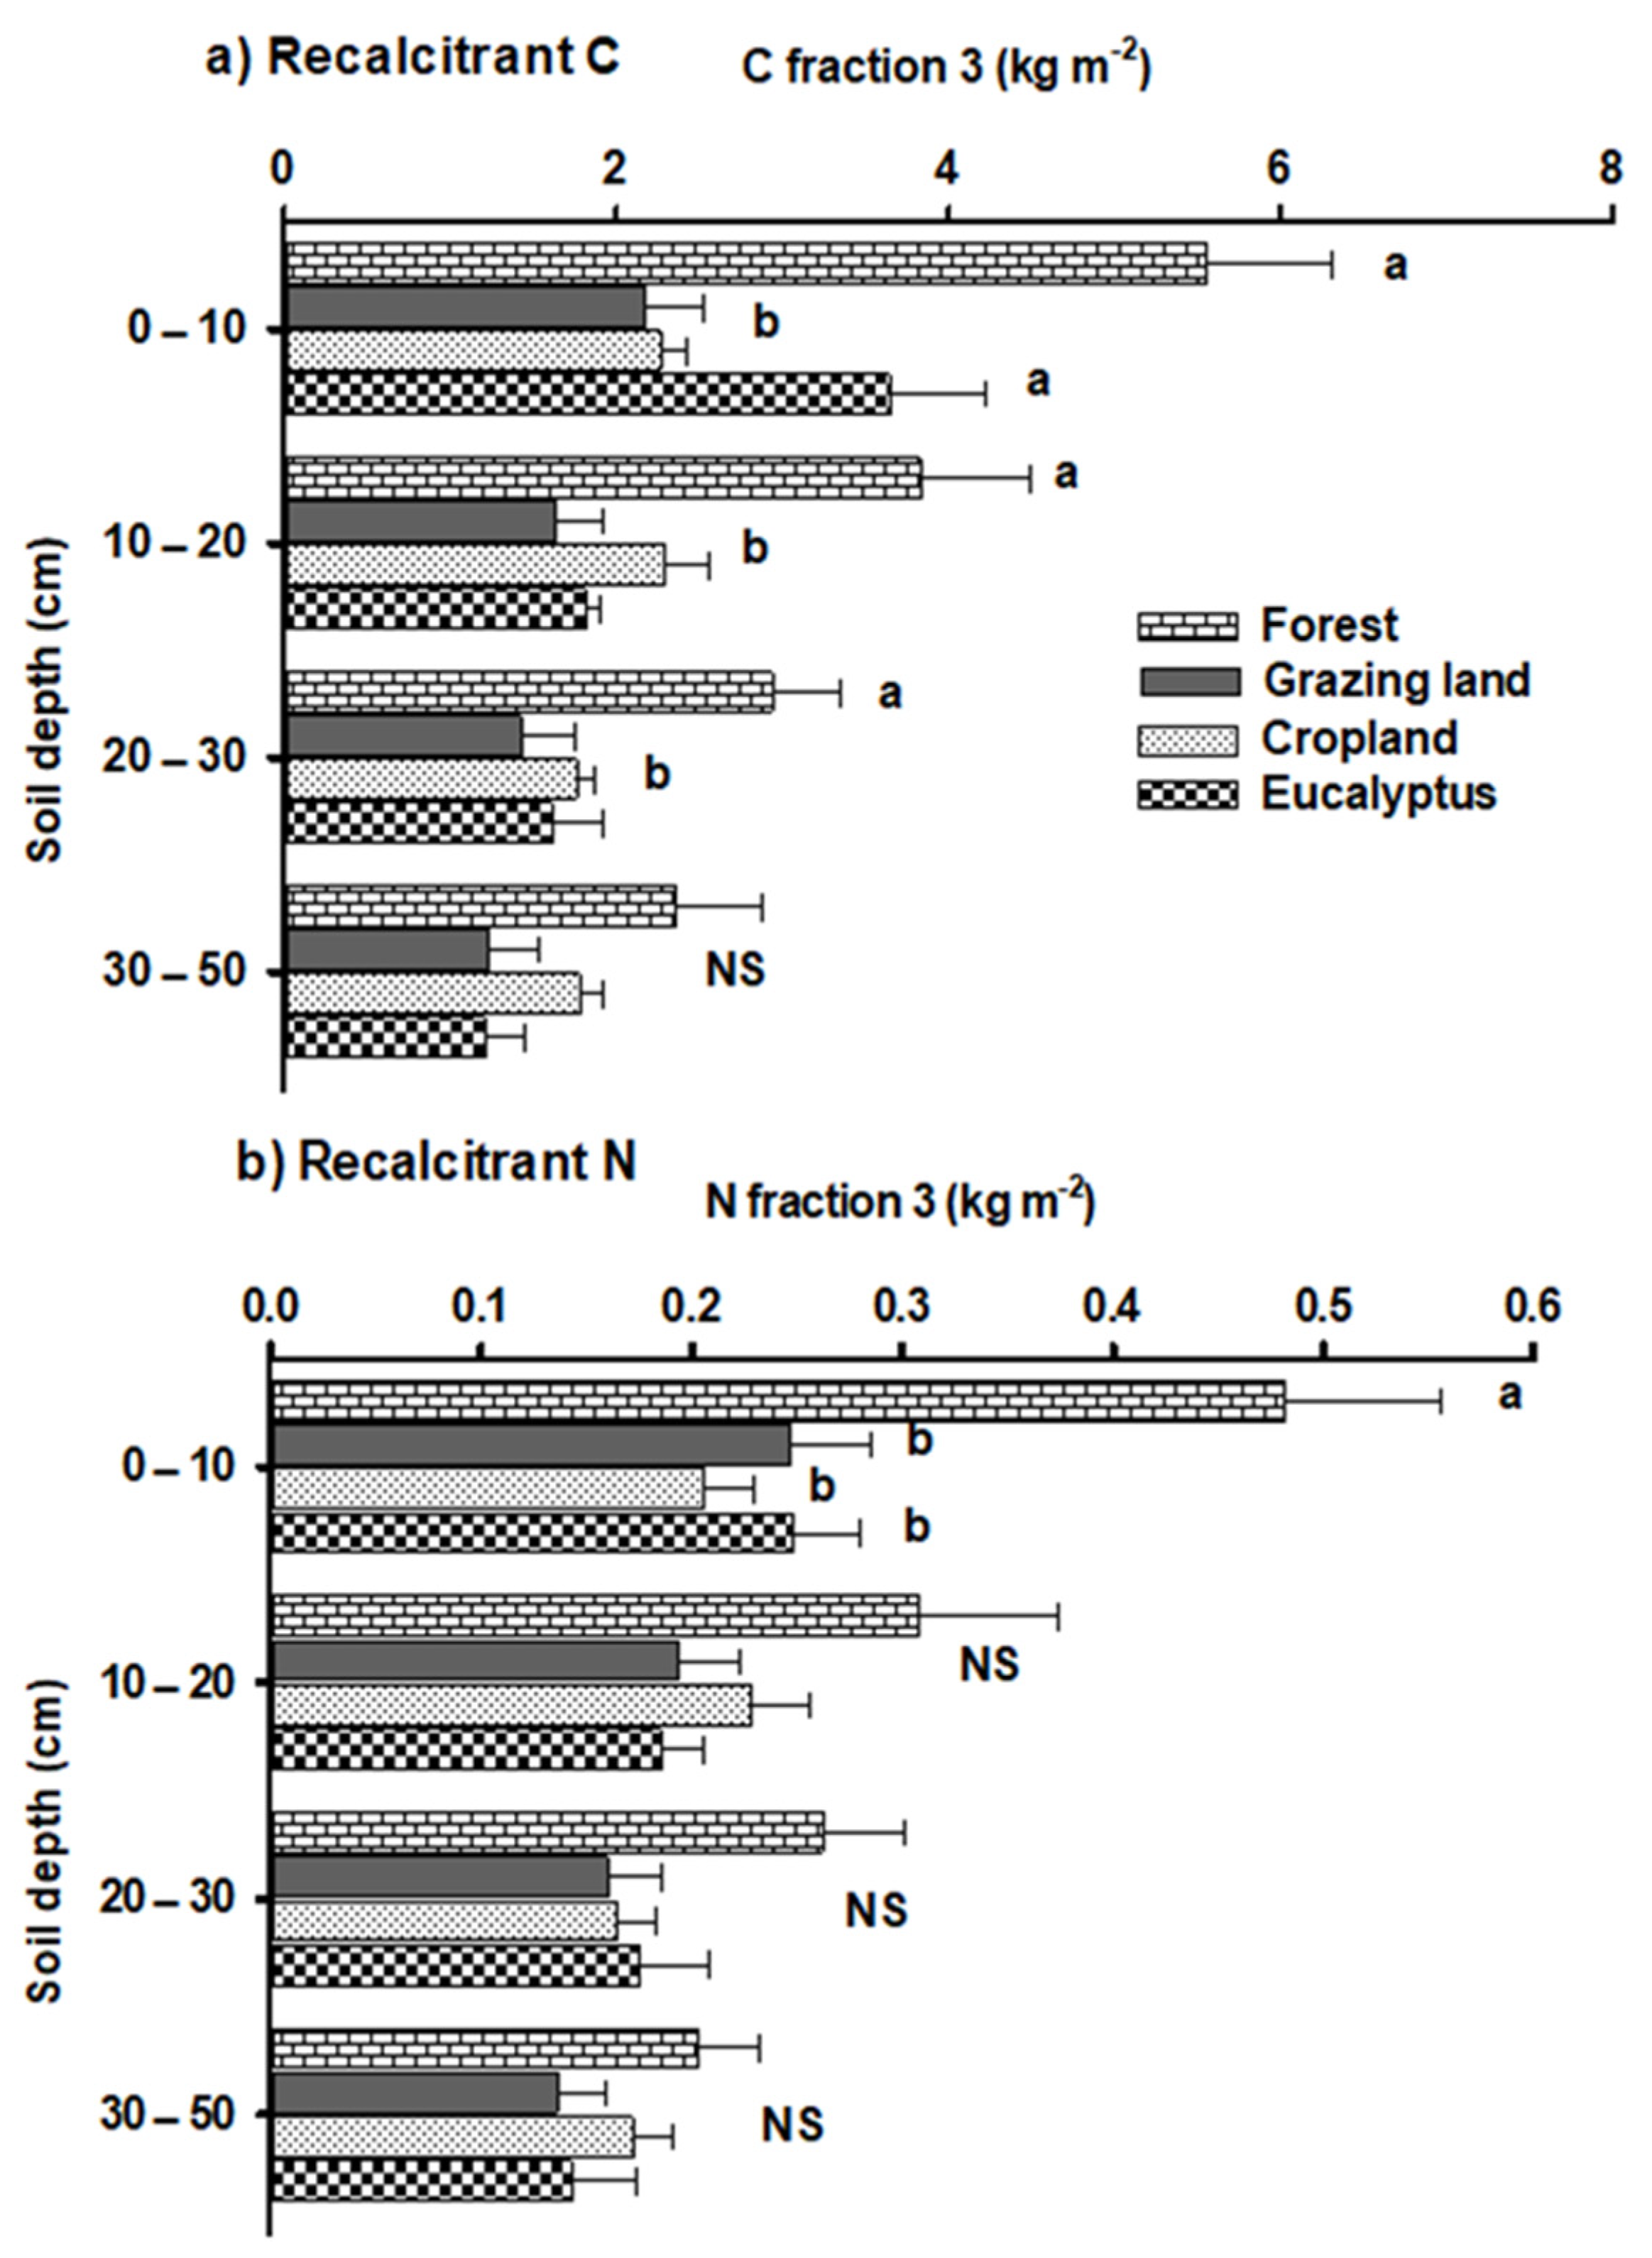
3.3. Recalcitrant C and N Stocks after Land-Use Change

The residual organic matter after extraction, potentially representing the most recalcitrant C, was significantly reduced in grazing land and crop land (Figure 4a). Natural forest and eucalyptus plantation soils possessed the highest quantities of recalcitrant C in the top soil (0–10 cm), followed by crop and grazing land soils (52% less than natural forest). However, in the deeper layers, only forest soil accumulated the highest recalcitrant C. Recalcitrant C stock in 0–50 cm soil profile of grazing land was reduced by 56% of undisturbed natural forest, followed by crop land and eucalyptus soil (44–45% reduction). The stock of non-hydrolysable N was higher in top soil of natural forest (on average 58% higher than the other land use types). Unlike recalcitrant C, no significant variation in storage of recalcitrant N in deeper soil horizons was observed (Figure 4b). Although recalcitrant C and N (fraction 3) stocks varied along different land-uses and soil depths, no interactions between these two factors was found (Table 2). In addition to stocks of three C fractions, relative concentration of fraction 1, 2 and 3 were shown in Table 3.

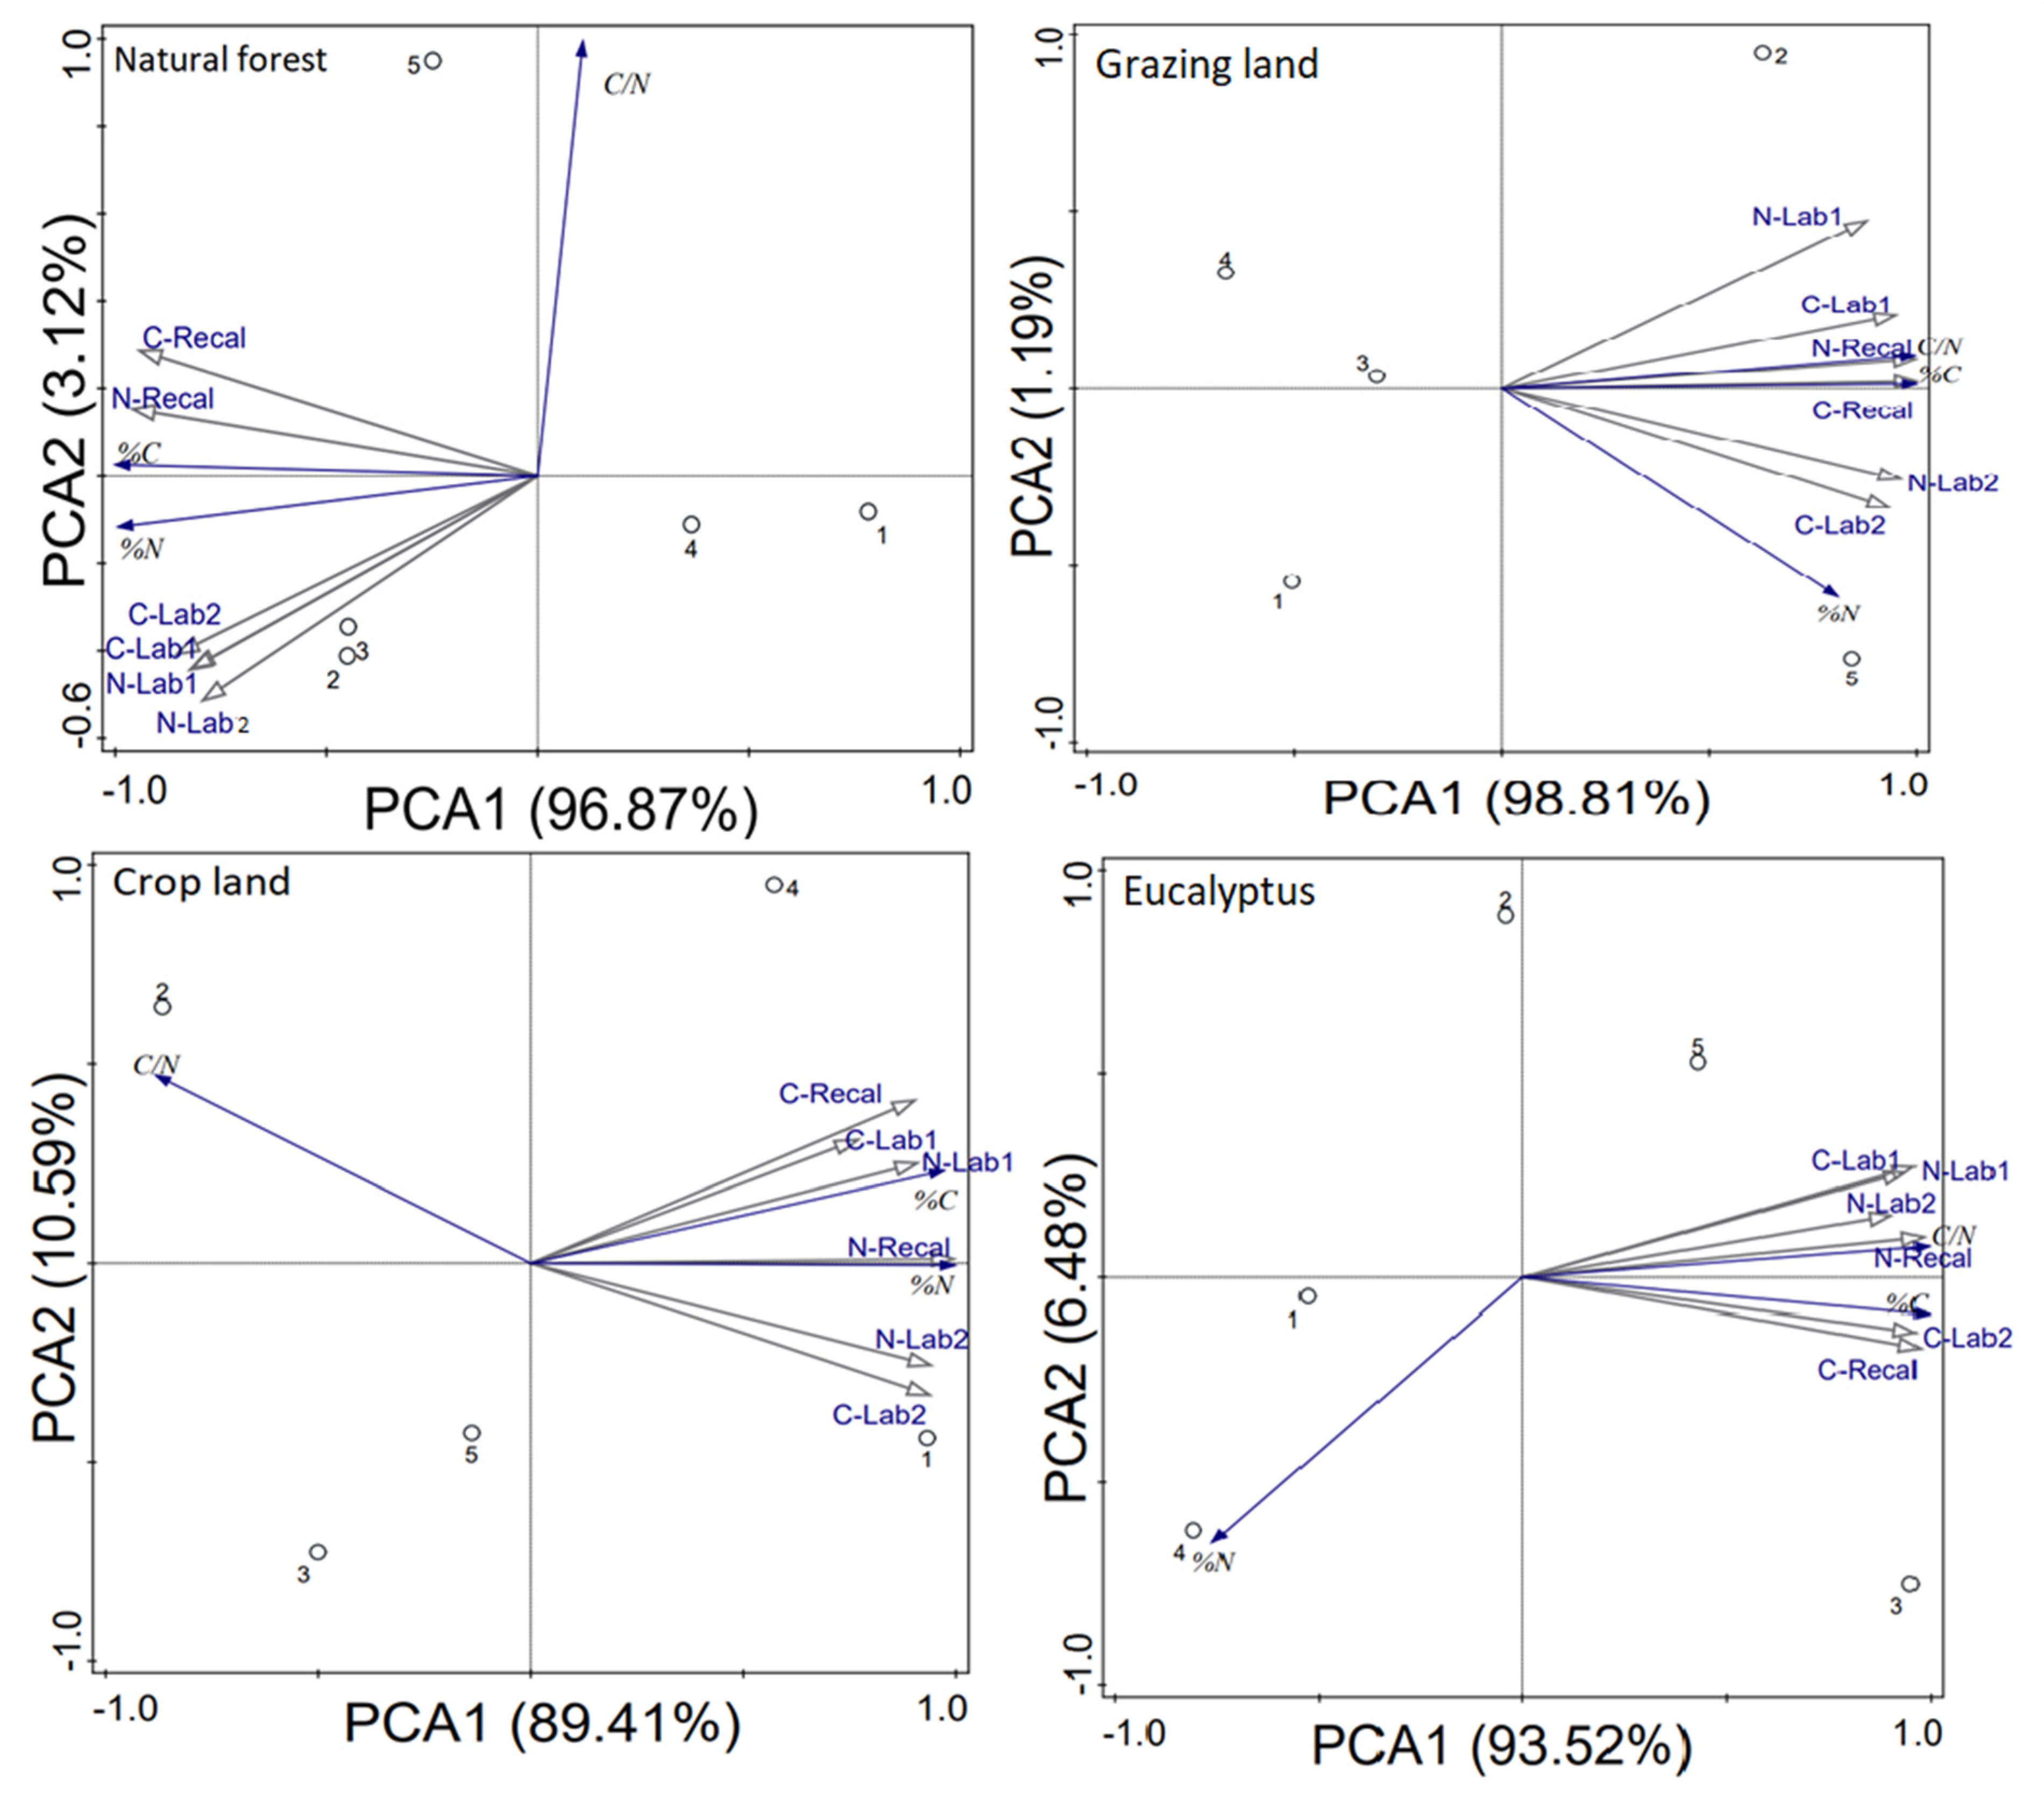
3.4. Effects of Land-Use on SOM Quality

3.4.1. Recalcitrant C and N Index

The recalcitrance C index (RIC) ranged between 39% and 56% (Table 4). The significantly higher RIC in eucalyptus soil and cropland compared to natural forest (p = 0.001, and 0.04 respectively) indicated a difference in C quality, although total C was higher in forest soil. The recalcitrant N index (RIN) showed significant variations between land uses along a vertical distribution of soil organic N. RIN was much lower in forest soil than soils of other land use types (35% in forest in compare to 70% of other land-uses), indicating the strong influence of land-use types on N recalcitrance in 0–50 soil profile (Table 4).

3.4.2. C:N Ratio of Soil Organic Matter Fractions

Although for the whole soil, the CN ratio of 0–50 cm profile varied only slightly (ranged 11 to 13) between land-use types, the organic matter fractionations revealed substantial variations in the CN ratio of different fractions due to land uses. The CN ratio of labile fraction 1 in cropland and eucalyptus soils ranged between values of 25 to 38 in comparison to 6.5 to 8 in natural forest soil (Table 5). For the labile fraction 2, the CN ratio showed less difference between land-use types, although that of the forest was significantly lower than that of the cropland. The CN ratio of recalcitrant fraction in grazing land was significantly lower than the soils of other land uses.

4. Discussions

4.1. Depletion of SOC and N Pools

Natural forest, grazing and crop lands and eucalyptus plantation plots of the present study are located in the immediate vicinity of the area, indicating the chrono-sequence order of land use changes. Local sources confirmed that the conversion of natural forest to cropland/grazing land and the establishment of eucalyptus plantation on degraded grazing land occurred within the last ca. 50 and 30 years, respectively [8]. Therefore, the reduction of SOC and N stocks in cropland and grazing land in comparison to adjacent forest are attributed to the major changes in vegetation and new management activities [37]. However, the direction and magnitude of SOC loss after land conversion might be influenced by some other factors. Guo and Gifford [4] reported 59 and 42% loss of soil C from pasture and cropland, respectively, after conversion from natural forests, by reviewing data from Australia, Brazil, New Zealand and the USA. Climate is generally considered a major factor that influences the C pool size after land-use change. For example, the conversion of forest to farmland caused a decline of soil C storage by 52, 41 and 31% in temperate, tropical and boreal regions, respectively [38]. In a recent study, Abegaz et al. [39] found a 65% loss of SOC stocks due to conversion of pristine forest to intensive croplands along a chrono-sequence land-use in Ethiopian highland. In our study, the loss of 50–58% C after conversion of natural forest to crop/grazing lands could be attributed to (i) lack of organic matter inputs through litterfall, dead wood, root, microbes and mycorrhizal turnover as exist in the forest ecosystems; (ii) very limited litter inputs from crop residues (mainly Eragrostis tef and Eleusine coracana roots) and grasses, as most of the aboveground biomass are grazed or used as fuel; (iii) erosion and removal of top soil, accelerated by tillage and over grazing; and (iv) depletion of soil organic matter exposed by ox-ploughing up to 30 cm soil depth, which was originally protected from microbial attack [8,40]. The grazing land in the present study was severely degraded due to intensive livestock browsing, with total loss of vegetative cover. Ethiopia has the largest livestock population in Africa, with more than 85 million animals [41], 75% of which are concentrated in the highland regions. The free grazing of such a large number of animals has caused substantial damage to top soil due to the effect of trampling. These findings agree with the studies by Adimassu et al. [42], who estimated a 7.8% higher surface runoff in grazing land than crop land in the central highlands of Ethiopia. After 30 years of plantation, eucalyptus soil accumulated higher SOC than crop and grazing lands, indicating formation of soil organic matter after initial losses during the establishment phase of plantation [43].
The storage of soil N in deforested land is regulated mainly by the legacy of previous land-use and the balance between input and output from new vegetation and management, as we observed in the case of SOC. However, total N stocks in cropland are affected by additional processes such as uptake by plants, leaching loss and use of manures and fertilizes. Similarly, total N storage in soil of eucalyptus plantation was influenced by N uptake by the fast-growing plants. Thus, the magnitude of N depletion in three deforested land types was influenced by management activities. Berihu et al. [40] reported consistent patterns of 51 and 38% reduction in total N in crop and grazing land soils, respectively, in comparison with natural dense forest in the highlands of the Tigray region of Ethiopia. Principal component analysis (PCA) showed a stronger relationship between SOC and N concentrations in natural forest than any other land uses, while grazing land showed the strongest relationship between SOC stock and recalcitrant C (Figure 5). The strong relationship between SOC and N concentrations in natural forest indicates that C allocation in forest soil is limited by N availability; however, disturbances weakened this relationship considerably in grazing and eucalyptus soils. Our analysis evidenced the severe impacts of deforestation on SOC and N stocks, enhancing climatic vulnerability and degradation of soil fertility.

4.2. Labile C and N under Various Land Uses

It is clear from our previous discussions that the deforestation of natural woodland leads to enormous loss of SOC and N stocks; however, further changes in the quality and quantity of active and passive fractions of these stocks due to subsequent management activities need to be assessed. The stability of storage C and N is crucial for soil C sequestration and soil fertility through release or fixation of these two elements [44,45], and lability of SOC indicates rapid flux from soil to elevate atmospheric CO2 concentration [46]. The sources of labile fraction 1 includes a wide range of compounds that are derived from the initial stage of litter decomposition [16], microbial tissues [47], soluble compounds of throughfall [48] and forms carbohydrates, protein, amino acids, nucleic acid and other non-cellulosic polysaccharides. Obviously, natural and plantation forests have larger sources of labile 1 than crop and grazing lands, due to the continuous flow of huge biomass production. Thus, there is a strong linear relationship between biomass and labile C, as reported by some authors [35,49]. Another important source of labile 1 might be the older, stable C, which can release easily degradable C, and initial hydrolysate includes this portion [50]. Old C might be major source of labile 1 C in degraded grazing land in our study, which was almost bare land. The absolute amount (labile 1 stock, kg m−2) in grazing, crop lands and eucalyptus plantation doesn’t reveal the effect of land use change; rather, the relative amount (mg g−1) showed a significantly higher proportion of labile 1 C in grazing land than natural forest (Table 3), indicating land use change decreased the stability of organic C by enhancing lability. The results also suggested that the re-establishment of vegetation cover, such as eucalyptus plantation, can slowly improve C quality by decreasing relative proportion of unstable labile fraction 1. These changes were attributed to destroying soil aggregates and increasing reduction of exposed organic matter due to new management such as overgrazing and tillage [51]. The practical implications of increased labile 1 C, as a component of dissolved organic C (DOC) are utilization by microbes and plants, release to atmosphere, and contamination of ground and underground water bodies [52].
The second hydrolysate (labile fraction 2) contains mainly cellulosic compounds and also carbohydrates coated by lignin, which are slower to biodegrade than labile fraction 1 due to the complex crystalline structure of cellulose [22,52]. It has been suggested that the higher recalcitrance nature of these compounds results in a slower degradation rate than labile fraction 1 [53,54]. In the second step of hydrolysis with concentrated sulfuric acid, the cellulosic fraction was subjected to dissolution in liquefied ionic medium (sulfate and hydronium ions) by breaking down of hydrogen bonds between hydroxyl groups [55]. Thus, our analysis of labile organic fraction 2 represents the relatively less available form of C and N in soil organic matter. While deforestation significantly reduced this C fraction in our study, the management activities after land-use change indicated faster biodegradation of cellulosic materials in soils with less vegetation cover. Consistent results were suggested by Chmolowska et al. [56]—that cellulose biodegradation is faster in fallow soil than in soil with high floristic composition and diversity, probably due to less competition for available nutrients.
Labile N fraction 1 and 2 drastically reduced after conversion of natural forest, which, however, showed more or less similar magnitudes in three subsequent land uses. Similar result of 46% reduction of total nitrogen stocks was reported, due to conversion of natural forest to agricultural land in Brazil [57]. The analytical methods applied in this study provide the estimation of readily biodegradable N in organic matter as labile N 1 and 2, which mostly includes dissolved organic N such as free amino acids, amino sugars, proteins, nucleic acids, microbial byproducts and humic substances [22,58]. Therefore, dramatic depletion of these forms in crop and grazing land soils could be due to the influence of new managements, such as tillage [59] and over-grazing [60]. The consequences of these activities enhance the loss and removal of dissolved labile N from soils. We expected higher labile N in plantation soil than crop and grazing lands; however, as severely degraded crop land was converted to eucalyptus plantation, soil N level was not increased compared to the previous state (crop land). Presumably, most of the labile N has been utilized by eucalyptus plants, thus impoverishing the soils, as reported in a study with eucalyptus plantation in the local highland areas [61].

4.3. Impacts on Recalcitrant C and N

Land-use types showed significant quantitative variations in recalcitrant C and N nitrogen fractions in soil organic matter. Although recalcitrant C and N stocks in natural forest were the largest pool in all land-use types, higher relative concentration of this fraction in cropland and eucalyptus plantation (Table 3) than forest indicates that both qualitative and quantitative changes occurred. The quantitative depletion of recalcitrant C and N fraction due to conversion of native forest have been reported in previous studies [12,62], as we found in the present study. The crucial significance of “recalcitrant C” in soil is attributed to the potential stability, as C sink contributing climate change mitigation. However, the concept of recalcitrant material as “a chemical substance with specific molecular structure and inherently resistant to microbial decay” have been criticized, because some of the so called “recalcitrant” materials have been found in rapid degradation, and so far, no recalcitrant compound with specific chemical structure has been detected by advanced analytical techniques [15,63]. Here, we argue that “recalcitrant C” may not be a distinct entity but “recalcitrance” can be considered a quality of soil organic matter that develops through the interactions of chemical, microbial and mineralogical processes. The gradual modification in structures of SOC components during the long-term formation mechanisms that results in an incredible level of complexity might be the contributions of thousands of compounds without any specific single structure [64]. In the present study, the recalcitrant residual organic matter was isolated as a non-hydrolysable fraction, based on the assumption that organic fractions resistant to acid hydrolysis are also resistant to enzymatic and microbial biodegradation [29,65].
Recalcitrant pools constitute the majority of the soil C and N stocks, irrespective of land-use types, but crop land and degraded grazing are much lower than natural forest, indicating a severe decrease of recalcitrant C fraction due to land-use change. This recalcitrant stock reduction was obviously associated with overall depletion of organic C due to a lack of continuous input of organic matter, higher oxidation and decomposition of SOC due to tillage practices [66] and accelerated soil erosion by increasing exposure to wind and rain. Therefore, the lowering of recalcitrant C in crop land soil is presumably due to conversion of forest to arable land. There are several mechanisms for the reduction of C stock, and the most prominent one is the physical erosion of top soil. The cultivation of the hilly and undulating landscapes of our cropland sites might be the cause of more decrease in recalcitrant C compared with other locations. Decreasing C input and/or increasing decomposition of soil organic matter due to deforestation might be another important factor [67]. The physical protection of recalcitrant C through aggregate formation is a common attribute to stability of soil C, which might be destroyed due to continuous cultivation of cropland resulting in the enhanced depletion of recalcitrant C. Consistent results of lower recalcitrant C pool in cropland soil when compared to grassland and woodland have been reported by some investigators [12,68]. The accumulation of stable SOM, favored by recalcitrant compounds of crop residues (straw and roots), have been reported by some investigators [69,70] but it was not likely in our experiment site, as the removal of crop residues for domestic use is a common practice (personal communication). Therefore, deforestation causes the destruction of recalcitrant C fraction that is crucial for long-term SOC sequestration in our study area.
After 30 years, eucalyptus plantation seemed to replenish the lost recalcitrant C, presumably due to the plant species’ identity and the age of the plantation. The significant contribution of first-growing eucalyptus on belowground C accumulation was reported by Viera and Rodríguez-Soalleiro [71]. In addition to leaf and root litter, mycorrhizal fungi associated with eucalyptus roots can provide recalcitrant C compounds such as melanin, chitin and lignin with nonhydrolyzable structures [72,73]. The vertical distribution of recalcitrant C and N stocks showed different patterns along land-use changes, with larger C stocks in all soil layers of forest soil, and larger N stock only in top soil layer, compared to other land-use types. These results indicate that management activities and degradation processes which generally affect surface soil severely are major factors for C and N re-organization in converted landscapes. Long-term tillage, land preparation, irrigation, use of chemical fertilizers, etc. can enhance depletion of old C, deposited during previous land-use through disruption of aggregates which exposed recalcitrant organic matter to decomposers [74,75]. However, the loss of recalcitrant C from deep soil layers might be stimulated by fresh labile organic C (priming mechanism) after land-use change [76], but available N in these layers may reduce the mineralization of SOM, resulting in no change in recalcitrant N pools in comparison to natural forest [77].

4.4. Quality of SOC and N Stocks

The quality of SOM is often described as how easily it can be decomposed on the basis of chemical properties of various components it is comprised of. Therefore, the proportion of labile and recalcitrant materials in SOM stocks can be a proxy for quality. As expected, we found significant decreasing trends of labile and recalcitrant C and N stocks (absolute amount), which was obviously a consequence of overall depletion of total organic C and N after land use-change. Our results on C concentration, i.e., relative quantity (Table 3), C:N ratio of labile and recalcitrant pools and recalcitrance index (RIC and RIN) showed that land-use changes modified the quality of soil C and N stocks, and not only the quantity of these fractions. Labile 1 C stocks in subsoil layers exhibited no significant variation after conversion, but the quality of these stocks (labile-1 expressed as C concentration) was higher than natural forest, indicating more mineralizable C after land-use change. In contrast, although recalcitrant C stocks in top soil decreased in cropland and grazing land and increased in eucalyptus plantation, the concentration of this fraction was higher in crop and eucalyptus soils than natural forest, indicating the stocks are less vulnerable to microbial decay [78].
C:N ratio is extensively used as an indicator of quality of soil organic matter, biogeochemical cycles in ecosystems, microbial community and composition and diversity and provision of ecosystem services, including soil productivity and C sequestration [79]. Many previous studies confirmed that deforestation and subsequent disturbances altered the C:N ratio of soil [80,81], but there is no generalized pattern, because typically, soil organic matter needs years of decadal scale to reach equilibrium after disturbance, and the casual regulators of soil C and N can be affected by continuous management activities, as in case of our study sites. The concept of the C:N ratio of soil organic matter assumes that SOM is a homogenous pool, but in reality, it consists of a variety of chemical compounds with contrasting structures and turnover rates. Accordingly, we observed significantly higher C:N ratios of labile fractions 1 & 2 in grazing/crop than natural forest, indicating a change in the decomposability of soil organic fraction after disturbance. Similarly, the C:N ratio of recalcitrant fraction in grazing soil was decreased significantly after land-use change from natural forest, whilst the whole soil C:N ratios were not varied. The lower C:N ratio of recalcitrant pool than labile fraction was consistent with others [26,82] but decreased C:N ratio in degraded grazing land in our site was likely due to lack of organic matter input from herbaceous vegetation and grass at one hand and heavy grazing induced trampling and fragmenting particulate organic matter on the other [83]. These findings clearly demonstrated that the whole soil C:N ratio does not adequately interpret the real influences of land-use change on stability of SOM, rather the stoichiometric ratios of labile and recalcitrant pools should be considered for explicit prediction and understanding of disturbances impacts [84].
The relative abundance of recalcitrant pool, expressed as recalcitrant index (RIC or RIN) has been proposed as an indicator of SOM quality by some investigators [22,23]. Since the longevity and persistence of SOM are largely governed by microbial decay processes, substances that are resistance to decomposition due to either physical protection or chemical recalcitrance could serve as an important indication of long-term SOC stability and nutrient release. Here, we examined these indices to assess impacts of land-use changes on SOM quality based on the amount of recalcitrant SOM, obtained by the acid hydrolysis approach. Because changes in substrate quality during decomposition closely related to the ratio of unhydrolyzed pools and total. RIC and RIN in the forest soil of our studies (39–43% and 32–35%, respectively) were consistent with the reported ranges (20–70% and 16–38% respectively) in pine and hardwood forests [85,86]. However, the influence of land-use change on these indexes were rarely examined. In the present study, RIC showed a progressive change at top soil along successive land conversions from natural forest to eucalyptus plantation suggesting the influence of various management activities on SOM quality. On the other hand, the response of recalcitrant N after conversion of natural forest was stronger than C and consistent along soil depth indicating modification of inherent soil fertility which eventually extend to subsoil layers. Olson and Lowe [87] reported that proportion of unhydrolyzable N increased by 19% after 40 years of intensive cultivation in vegetable producing area. The exact mechanism of higher RIN values after land-use change in the current studies is not clear, however, lower mineralization of the recalcitrant N in absence of fresh nutrient sources might be contributed to decrease N quality of soil organic matter [88]. In addition, increased recalcitrant organic compounds in cropland could be attributed to application of nitrogenous fertilizers through the formation of phenolic and lignin-bound N at one hand and formation of organic N complexes, with Fe and Al clays on the other [89]. Paré et al. [90] reported increased quantity of unhydrolyzable N from animal manure compost supporting the finding of higher RIN in grazing land than natural forest in the current study. Together C:N ratio and recalcitrant indexes clearly demonstrated that land-use changes not only modify the total stocks of SOC and N but also the quality of stored organic materials that can regulate long term storage and release of these elements. Our findings support a comprehensive approach in investigating land-use impacts on SOM fractionation compare to considering only total SOC and N. Thus, the exhaustive scenarios of disturbed landscapes may have implications for soil quality assessment and monitoring for better land management strategies.

5. Conclusions

A landscape with four chrono-sequence land-use types viz. natural forest, grazing/crop lands and eucalyptus plantation was examined for storage and quality of SOC and N as influenced by land conversions in Ethiopian highlands. Grazing land and cropland showed the highest loss of C and N stocks, respectively, compare to soils of original natural forest. Plantation of eucalyptus exhibited potential for soil C recovery, although not for soil N, after 30 years of plantation. Intensive grazing in post-deforested land caused severe land degradation, as our C and N stock analyses revealed. Further chemical fractionation of soil organic matter through acid hydrolysis has elucidated the impacts of land-use changes on the stability and quality of organic matter. The absolute amounts of labile and recalcitrant C and N decreased in crop and grazing lands, which correspond to the decreases in total pools, but increases in relative concentrations of labile fraction 1 in grazing land and recalcitrant C and N in cropland, suggesting the quality of these pools might be influenced by land management activities. The C:N ratio of C fractions and recalcitrant index (RIC and RIN) clearly demonstrated that land conversion from natural forest to managed systems changes the inherent quality of the recalcitrant fractions of soil organic matter. Overall, deforestation and subsequent land-use change severely deplete SOC and N stocks and alter the biodegradability of soil organic matter through modifications of labile and recalcitrant fractions.

Author Contributions

Data curation, Dessie Assefa; Formal analysis, I.U.A.; Methodology, D.A.; Supervision, D.L.G.; Writing—original draft, I.U.A.; Writing—review & editing, D.L.G. All authors have read and agreed to the published version of the manuscript.

Funding

The study was carried out under the project “Carbon storage and soil biodiversity in forest landscapes in Ethiopia: Knowledge base and participatory management (Carbo-part)”, financed by the Austrian Ministry of Agriculture, Forestry, Environment and Water Management (Grant Agreement No BMLFUW-UW.1.3.2/0122-V/4/2013).

Data Availability Statement

All data used in the article were primarily generated by the authors and can be made available from the corresponding author.

Acknowledgments

We thank Marcel Hirsch and Frauke Neumann, IFE Laboratory, BOKU for their assistance during analytical activities in the laboratory. We are grateful to two anonymous reviewers for helpful comments that improved the quality of the manuscript.

Conflicts of Interest

The authors declare no conflict of interest.

References

  1. Smith, P.; House, J.I.; Bustamante, M.; Sobocká, J.; Harper, R.; Pan, G.; West, P.C.; Clark, J.M.; Adhya, T.; Rumpel, C.; et al. Global change pressures on soils from land use and management. Glob. Chang. Biol. 2016, 22, 1008–1028. [Google Scholar] [CrossRef]
  2. Ito, A.; Hajima, T. Biogeophysical and biogeochemical impacts of land-use change simulated by MIROC-ES2L. Prog. Earth Planet Sci. 2020, 7, 1–15. [Google Scholar] [CrossRef]
  3. Don, A.; Schumacher, J.; Freibauer, A. Impact of tropical land-use change on soil organic carbon stocks-a meta-analysis. Glob. Chang. Biol. 2011, 17, 1658–1670. [Google Scholar] [CrossRef] [Green Version]
  4. Guo, L.B.; Gifford, R.M. Soil carbon stocks and land use change: A meta-analysis. Glob. Chang. Biol. 2002, 8, 345–360. [Google Scholar] [CrossRef]
  5. Sierra, C.A.; Hoyt, A.M.; He, Y.; Trumbore, S.E. Soil organic matter persistence as a stochastic process: Age and transit time distributions of carbon in soils. Glob. Biogeochem. Cycles 2018, 32, 1574–1588. [Google Scholar] [CrossRef]
  6. Beyene, B.; Pötzelsberger, E.; Sisay, K.; Assefa, D.; Hasenauer, H. The Carbon Dynamics of Dry Tropical Afromontane Forest Ecosystems in the Amhara Region of Ethiopia. Forests 2018, 9, 18. [Google Scholar] [CrossRef] [Green Version]
  7. Regasa, M.S.; Nones, M.; Adeba, D.A. Review on Land Use and Land Cover Change in Ethiopian Basins. Land 2021, 10, 585. [Google Scholar] [CrossRef]
  8. Assefa, D.; Rewald, B.; Sandén, H.; Rosinger, C.; Abiyu, A.; Yitaferu, B.; Godbold, D.L. Deforestation and land use strongly effect soil organic carbon and nitrogen stock in Northwest Ethiopia. Catena 2017, 153, 89–99. [Google Scholar] [CrossRef]
  9. Kassa, H.; Dondeyne, S.; Poesen, J.; Frankl, A.; Nyssen, J. Impact of deforestation on soil fertility, soil carbon and nitrogen stocks: The case of the Gacheb catchment in the White Nile Basin, Ethiopia. Agric. Ecosyst. Environ. 2017, 247, 273–282. [Google Scholar] [CrossRef] [Green Version]
  10. Amanuel, W.; Yimer, F.; Karltun, E. Soil organic carbon variation in relation to land use changes: The case of Birr watershed, upper Blue Nile River Basin, Ethiopia. J. Ecol. Environ. 2018, 42, 16. [Google Scholar] [CrossRef]
  11. Villarino, S.H.; Studdert, G.A.; Baldassini, P.; Cendoya, M.G.; Ciuffoli, L.; Mastrángelo, M.; Piñeiro, G. Deforestation impacts on soil organic carbon stocks in the Semiarid Chaco Region, Argentina. Sci. Total Environ. 2017, 575, 1056–1065. [Google Scholar] [CrossRef] [Green Version]
  12. Liu, X.; Chen, D.; Yang, T.; Huang, F.; Fu, S.; Li, L. Changes in soil labile and recalcitrant carbon pools after land-use change in a semi-arid agro-pastoral ecotone in Central Asia. Ecol. Ind. 2019, 110, 105925. [Google Scholar] [CrossRef]
  13. Menichetti, L.; Ågren, G.I.; Barré, P.; Moyano, F.; Kätterer, T. Generic parameters of first-order kinetics accurately describe soil organic matter decay in bare fallow soils over a wide edaphic and climatic range. Sci. Rep. 2019, 9, 20319. [Google Scholar] [CrossRef] [Green Version]
  14. Rovira, P.; Romanyà, J.; Duguy, B. Long-term effects of wildfires on the biochemical quality of soil organic matter: A study on Mediterranean shrublands. Geoderma 2012, 179–180, 9–19. [Google Scholar] [CrossRef]
  15. Schmidt, M.W.; Torn, M.S.; Abiven, S.; Dittmar, T.; Guggenberger, G.; Janssens, I.A.; Kleber, M.; Kogel-Knabner, I.; Lehmann, J.; Manning, D.A.C.; et al. Persistence of soil organic matter as an ecosystem property. Nature 2011, 478, 49–56. [Google Scholar] [CrossRef] [Green Version]
  16. Chen, Y.; Cao, J.; Zhao, J.; Wu, J.; Zou, X.; Fu, S.; Zhang, W. Labile C dynamics reflect soil organic carbon sequestration capacity: Understory plants drive topsoil C process in subtropical forests. Ecosphere 2019, 10, e02784. [Google Scholar] [CrossRef]
  17. Lehmann, J.; Hansel, C.M.; Kaiser, C.; Kleber, M.; Maher, K.; Manzoni, S.; Nunan, N.; Reichstein, M.; Schimel, J.P.; Torn, M.S.; et al. Persistence of soil organic carbon caused by functional complexity. Nat. Geosci. 2020, 13, 529–534. [Google Scholar] [CrossRef]
  18. Ukalska-Jaruga, A.; Smreczak, B.; Klimkowicz-Pawlas, A. Soil organic matter composition as a factor affecting the accumulation of polycyclic aromatic hydrocarbons. J. Soils Sediments 2019, 19, 1890–1900. [Google Scholar] [CrossRef] [Green Version]
  19. Gregorich, E.G.; Gillespie, A.W.; Beare, M.H.; Curtin, D.; Sanei, H.; Yanni, S.F. Evaluating biodegradability of soil organic matter by its thermal stability and chemical composition. Soil Biol. Biochem. 2015, 91, 182–191. [Google Scholar] [CrossRef]
  20. von Lützow, M.; Kögel-Knabner, I.; Ekschmitt, K.; Flessa, H.; Guggenberger, G.; Matzner, E.; Marschner, B. SOM fractionation methods: Relevance to functional pools and to stabilization mechanisms. Soil Biol. Biochem. 2007, 39, 2183–2207. [Google Scholar] [CrossRef]
  21. Zhang, D.; Wu, J.; Yang, F.; Chen, Q.; Feng, J.; Li, Q.; Zhang, Q.; Wang, W.; Cheng, X. Linkages between soil organic carbon fractions and carbon-hydrolyzing enzyme activities across riparian zones in the Three Gorges of China. Sci. Rep. 2020, 10, 8433. [Google Scholar] [CrossRef]
  22. Rovira, P.; Vallejo, V.R. Labile and recalcitrant pools of carbon and nitrogen in organic matter decomposing at different depths in soils an acid hydrolysis approach. Geoderma 2002, 107, 109–141. [Google Scholar] [CrossRef]
  23. Ferraz de Almeida, R.; Rodrigues Mikhael, J.E.; Oliveira Franco, F.; Fonseca Santana, L.M.; Wendling, B. Measuring the Labile and Recalcitrant Pools of Carbon and Nitrogen in Forested and Agricultural Soils: A Study under Tropical Conditions. Forests 2019, 10, 544. [Google Scholar] [CrossRef] [Green Version]
  24. Xu, G.; Jiang, H.; Zhang, Y.; Korpelainen, H.; Li, C. Effect of warming on extracted soil carbon pools of Abies faxoniana forest at two elevations. For. Ecol. Manag. 2013, 310, 357–365. [Google Scholar] [CrossRef]
  25. Dou, C.; Ewanick, S.; Bura, R.; Gustafson, R. Post-treatment mechanical refining as a method to improve overall sugar recovery of steam pretreated hybrid poplar. Bioresour. Technol. 2016, 207, 157–165. [Google Scholar] [CrossRef] [Green Version]
  26. Feyissa, A.; Yang, F.; Feng, J.; Wu, J.; Chen, Q.; Cheng, X. Soil labile and recalcitrant carbon and nitrogen dynamics in relation to functional vegetation groups along precipitation gradients in secondary grasslands of South China. Environ. Sci. Pollut. Res. Int. 2020, 27, 10528–10540. [Google Scholar] [CrossRef]
  27. Guo, X.; Luo, Z.; Sun, O.J. Long-term litter type treatments alter soil carbon composition but not microbial carbon utilization in a mixed pine-oak forest. Biogeochemistry 2021, 152, 327–343. [Google Scholar] [CrossRef]
  28. Krull, E.S.; Swanston, C.W.; Skjemstad, J.O.; McGowan, J.A. Importance of charcoal in determining the age and chemistry of organic carbon in surface soils. J. Geophys. Res. 2006, 111, G04001–G04009. [Google Scholar] [CrossRef]
  29. Greenfield, L.G.; Gregorich, E.G.; van Kessel, C.; Baldock, J.A.; Beare, M.H.; Billings, S.A.; Clinton, P.W.; Condron, L.M.; Hill, S.; Hopkins, D.W.; et al. Acid hydrolysis to define a biologically-resistant pool is compromised by carbon loss and transformation. Soil Biol. Biochem. 2013, 64, 122–126. [Google Scholar] [CrossRef]
  30. Taye, M.; Zewdu, F.; Ayalew, D. Characterizing the climate system of Western Amhara, Ethiopia: A GIS approach. Am. J. Res. Commun. 2013, 1, 319–355. [Google Scholar]
  31. Cardelús, C.L.; Scull, P.; Hair, J.; Baimas-George, M.; Lowman, M.D.; Eshet, A.W. A preliminary assessment of Ethiopian sacred grove status at the landscape and ecosystem scales. Diversity 2013, 5, 320–334. [Google Scholar] [CrossRef]
  32. Wassie, A.; Sterck, F.J.; Teketay, D.; Bongers, F. Effects of livestock exclusion on tree regeneration in Church forests of Ethiopia. For. Ecol. Manag. 2009, 257, 765–772. [Google Scholar] [CrossRef]
  33. Meseret, D. Land Degradation in Amhara Region of Ethiopia: Review on Extent, Impacts and Rehabilitation Practices. J. Environ. Earth Sci. 2016, 6, 120–130. [Google Scholar]
  34. Kettler, T.A.; Doran, J.W.; Gilbert, T.L. Simplified method for soil particle-size determination to accompany soil-quality analyses. Soil Sci. Soc. Am. J. 2001, 65, 849–852. [Google Scholar] [CrossRef] [Green Version]
  35. Belay-Tedla, A.; Zhou, X.H.; Su, B.; Wan, S.Q.; Luo, Y.Q. Labile, recalcitrant, and microbial carbon and nitrogen pools of a tallgrass prairie soil in the US Great Plains subjected to experimental warming and clipping. Soil Biol. Biochem. 2009, 41, 110–111. [Google Scholar] [CrossRef]
  36. Schumacher, B.A. Methods for the Determination of Total Organic Carbon (TOC) in Soils and Sediments; U.S. Environmental Protection Agency: Las Vegas, NV, USA, 2002.
  37. Vesterdal, L.; Leifeld, J. Land-use change and management effects on soil carbon sequestration: Forestry and agriculture. COST 639 project: Greenhouse-gas budget of soils under changing climate and land use (BurnOut). COST Action 2007, 639, 25–32. [Google Scholar]
  38. Wei, X.; Shao, M.; Gale, W.; Li, L. Global pattern of soil carbon losses due to the conversion of forests to agricultural land. Sci. Rep. 2014, 4, 4062. [Google Scholar] [CrossRef]
  39. Abegaz, A.; Tamene, L.; Abera, W.; Yaeko, T.; Hailu, H.; Nyawira, S.S.; Da Silva, M.; Sommer, R. Soil organic carbon dynamics along chrono-sequence land-use systems in the highlands of Ethiopia. Agric. Ecosyst. Environ. 2020, 300, 106997. [Google Scholar] [CrossRef]
  40. Berihu, T.; Girmay, G.; Sebhatleab, M.; Berhane, E.; Zenebe, A.; Sigua, G.C. Soil carbon and nitrogen losses following deforestation in Ethiopia. Agron. Sustain. Dev. 2017, 37, 1. [Google Scholar] [CrossRef] [Green Version]
  41. Shapiro, B.I.; Gebru, G.; Desta, S.; Negassa, A.; Nigussie, K.; Aboset, G.; Mechale, H. Ethiopia livestock sector analysis. In Proceedings of the ILRI Project Report 2017; International Livestock Research Institute (ILRI): Nairobi, Kenya, 2017. [Google Scholar]
  42. Adimassu, Z.; Tamene, L.; Degefie, D.T. The influence of grazing and cultivation on runoff, soil erosion, and soil nutrient export in the central highlands of Ethiopia. Ecol. Process 2020, 9, 23. [Google Scholar] [CrossRef]
  43. Zhang, H.; Xiong, X.; Wu, J.; Zhao, J.; Zhao, M.; Chu, G.; Hui, D.; Zhou, G.; Deng, Q.; Zhang, D. Changes in Soil Microbial Biomass, Community Composition, and Enzyme Activities After Half-Century Forest Restoration in Degraded Tropical Lands. Forests 2019, 10, 1124. [Google Scholar] [CrossRef] [Green Version]
  44. Bossio, D.A.; Cook-Patton, S.C.; Ellis, P.W.; Fargione, J.; Sanderman, J.; Smith, P.; Wood, S.; Zomer, R.J.; von Unger, M.; Emmer, I.M.; et al. The role of soil carbon in natural climate solutions. Nat. Sustain. 2020, 3, 391–398. [Google Scholar] [CrossRef]
  45. Dynarski Katherine, A.; Bossio Deborah, A.; Scow Kate, M. Dynamic Stability of Soil Carbon: Reassessing the “Permanence” of Soil Carbon Sequestration. Front. Environ. Sci. 2020, 8, 218. [Google Scholar] [CrossRef]
  46. Zhang, L.; Chen, X.; Xu, Y.; Jin, M.; Ye, X.; Gao, H.; Chu, W.; Mao, J.; Thompson, M.L. Soil labile organic carbon fractions and soil enzyme activities after 10 years of continuous fertilization and wheat residue incorporation. Sci. Rep. 2020, 10, 11318. [Google Scholar] [CrossRef]
  47. De Graaff, M.; Classen, A.; Castro, H.; Schadt, C. Labile soil carbon inputs mediate the soil microbial community composition and plant residue decomposition rates. N. Phytol. 2010, 188, 1055–1064. [Google Scholar] [CrossRef] [Green Version]
  48. Lombardo, L.; Trujillo, C.; Vanwalleghem, T.; Gómez, J.A. Organic carbon fluxes by precipitation, throughfall and stemflow in an olive orchard in Southern Spain. Plant Biosyst. 2018, 152, 1039–1047. [Google Scholar] [CrossRef]
  49. Leavitt, S.W.; Follett, R.F.; Paul, E.A. Estimation of slow and fast cycling soil organic carbon pools from 6N HCl hydrolysis. Radiocarbon 1997, 38, 231–239. [Google Scholar] [CrossRef] [Green Version]
  50. Delelegn, Y.T.; Purahong, W.; Blazevic, A. Yitaferu, B.; Wubet, T.; Göransson, H.; Godbold, D.L. Changes in land use alter soil quality and aggregate stability in the highlands of northern Ethiopia. Sci. Rep. 2017, 7, 13602. [Google Scholar] [CrossRef] [Green Version]
  51. Benjamin, P.; Sandra, M.-G.; Daniel, L.; Jarone, P. Labile Dissolved Organic Matter Compound Characteristics Select for Divergence in Marine Bacterial Activity and Transcription. Front. Microbiol. 2020, 11, 2365. [Google Scholar] [CrossRef]
  52. Baldrian, P.; Valaskováa, V. Degradation of cellulose by basidiomycetous fungi. FEMS Microbiol. Rev. 2008, 32, 501–521. [Google Scholar] [CrossRef] [Green Version]
  53. Pulidindi, I.N.; Kimchi, B.B.; and Gedanken, A. Can cellulose be a sustainable feedstock for bioethanol production? Renew. Energy 2014, 71, 77–80. [Google Scholar] [CrossRef]
  54. Snajdr, J.; Cajthaml, T.; Valaskova, V.; Merhautová, V.; Petránková, M.; Spetz, P.; Leppänen, K.; Baldrian, P. Transformation of Quercus petraea litter: Successive changes in litter chemistry are reflected in differential enzyme activity and changes in the microbial community composition. FEMS Microbiol. Ecol. 2011, 75, 291–303. [Google Scholar] [CrossRef] [Green Version]
  55. Chang, J.K.; Xavier, D.; Véronique, B.; Hassan, Z.; Lavoie, J. Two-step thermochemical cellulose hydrolysis with partial neutralization for glucose production. Front. Chem. 2018, 6, 117. [Google Scholar] [CrossRef] [Green Version]
  56. Chmolowska, D.; Hamda, N.; Laskowski, R. Cellulose decomposed faster in fallow soil than in meadow soil due to a shorter lag time. J. Soils Sediments 2017, 17, 299–305. [Google Scholar] [CrossRef] [Green Version]
  57. Maia Andrade, E.; Valbrun, W.; de Almeida, A.M.; Rosa, G.; da Silva, A.G.R. Land-Use Effect on Soil Carbon and Nitrogen Stock in a Seasonally Dry Tropical Forest. Agronomy 2020, 10, 158. [Google Scholar] [CrossRef] [Green Version]
  58. Yang, X.; Wei, X.; Xu, X.; Zhang, Y.; Li, J.; Wan, J. Characteristics of Dissolved Organic Nitrogen in the Sediments of Six Water Sources in Taihu Lake, China. Int. J. Environ. Res. Public Health 2019, 16, 929. [Google Scholar] [CrossRef] [Green Version]
  59. Nie, X.J.; Zhang, H.B.; Su, Y.Y. Soil carbon and nitrogen fraction dynamics affected by tillage erosion. Sci. Rep. 2019, 9, 16601. [Google Scholar] [CrossRef]
  60. Stamati, F.; Nikolaidis, N.; Venieri, D.; Psillakis, E.; Kalogerakis, N. Dissolved organic nitrogen as an indicator of livestock impacts on soil biochemical quality. Appl. Geochem. 2011, 26. [Google Scholar] [CrossRef]
  61. Chanie, T.; Collick, A.S.; Adgo, E.; Lehmann, C.J.; Steenhuis, T.S. Ecohydrological impacts of eucalyptus in the semi humid Ethiopian highlands: The Lake tana plain. J. Hydrol. Hydromech. 2013, 61, 21–29b. [Google Scholar] [CrossRef] [Green Version]
  62. Nath, A.J.; Brahma, B.; Sileshi, G.W.; Das, A.K. Impact of land use changes on the storage of soil organic carbon in active and recalcitrant pools in a humid tropical region of India. Sci. Total Environ. 2018, 624, 908–917. [Google Scholar] [CrossRef]
  63. Kleber, M.; Nico, P.S.; Plante, A.; Filley, T.; Kramer, M.; Swanston, C.; Sollins, P. Old and stable soil organic matter is not necessarily chemically recalcitrant: Implications for modeling concepts and temperature sensitivity. Glob. Chang. Biol. 2011, 17, 1097–1107. [Google Scholar] [CrossRef] [Green Version]
  64. Olk, D.C.; Bloom, P.R.; De Nobili, M.; Chen, Y.; McKnight, D.M.; Wells, M.J.M.; Weber, J. Using humic fractions to understand natural organic matter processes in soil and water: Selected studies and applications. J. Environ. Qual. 2019, 48, 1633–1643. [Google Scholar] [CrossRef] [Green Version]
  65. Rovira, P.; Vallejo, V.R. Labile and recalcitrant and inert organic matter in Mediterranean forest soils. Soil Biol. Biochem. 2007, 39, 202–215. [Google Scholar] [CrossRef]
  66. Zhen, Y.; Lu, C.; Hennessy, D.A.; Feng, H.; Tian, H. Impacts of tillage practices on soil carbon stocks in the US corn-soybean cropping system during 1998 to 2016. Environ. Res. Lett. 2020, 15, 014008. [Google Scholar]
  67. Guillaume, T.; Damris, M.; Kuzyakov, Y. Losses of soil carbon by converting tropical forest to plantations: Erosion and decomposition estimated by δ13C. Glob. Chang. Biol. 2015, 21, 3548–3560. [Google Scholar] [CrossRef]
  68. Sahoo, U.K.; Singh, S.L.; Gogoi, A.; Kenye, A.; Sahoo, S.S. Active and passive soil organic carbon pools as affected by different land use types in Mizoram, Northeast India. PLoS ONE 2019, 14, e0219969. [Google Scholar] [CrossRef] [Green Version]
  69. Abril, A.; Casado-Murillo, N.; Vázquez, C.; Olivera, P. Labile and Recalcitrant Carbon in Crop Residue and Soil under No-Till Practices in Central Region of Argentina. Open Agric. J. 2013, 7, 32–39. [Google Scholar] [CrossRef] [Green Version]
  70. Ghafoor, A.; Poeplau, C.; Kätterer, T. Fate of straw- and root-derived carbon in a Swedish agricultural soil. Biol. Fertil. Soils 2017, 53, 257–267. [Google Scholar] [CrossRef] [Green Version]
  71. Viera, M.; Rodríguez-Soalleiro, R.A. Complete Assessment of Carbon Stocks in Above and Belowground Biomass Components of a Hybrid Eucalyptus Plantation in Southern Brazil. Forests 2019, 10, 536. [Google Scholar] [CrossRef] [Green Version]
  72. Kögel-Knabner, I. The macromolecular organic composition of plant and microbial residues as inputs to soil organic matter. Soil Biol. Biochem. 2002, 34, 139–162. [Google Scholar] [CrossRef]
  73. Frey, S.D. Mycorrhizal Fungi as Mediators of Soil Organic Matter Dynamics. Annu. Rev. Ecol. Evol. Syst. 2019, 50, 237–259. [Google Scholar] [CrossRef]
  74. Compton, J.E.; Boone, R.D. Long-term impacts of agriculture on soil carbon and nitrogen in New England forests. Ecology 2000, 81, 2314–2330. [Google Scholar] [CrossRef]
  75. Zheng, H.; Liu, W.; Zheng, J.; Luo, Y.; Li, R.; Wang, H.; Qi, H. Effect of long-term tillage on soil aggregates and aggregate-associated carbon in black soil of Northeast China. PLoS ONE 2018, 13, e0199523. [Google Scholar] [CrossRef]
  76. Lyu, M.; Xie, J.; Ukonmaanaho, L.; Jiang, M.; Li, Y.; Chen, Y.; Yang, Z.; Zhou, Y.; Lin, W.; Yang, Y. Land use change exerts a strong impact on deep soil C stabilization in subtropical forests. J. Soils Sediments 2017, 17, 2305–2317. [Google Scholar] [CrossRef]
  77. Hicks, L.C.; Meir, P.; Nottingham, A.T.; Reay, D.S.; Stott, A.W.; Salinas, N.; Whitaker, J. Carbon and nitrogen inputs differentially affect priming of soil organic matter in tropical lowland and montane soils. Soil Biol. Biochem. 2019, 129, 212–222. [Google Scholar] [CrossRef]
  78. Zhang, H.; Zhou, Z. Recalcitrant carbon controls the magnitude of soil organic matter mineralization in temperate forests of northern China. For. Ecosyst. 2018, 5, 17. [Google Scholar] [CrossRef]
  79. Batjes, N.H. Total carbon and nitrogen in the soils of the world. Eur. J. Soil Sci. 2014, 65, 10–21. [Google Scholar] [CrossRef]
  80. Veldkamp, E.; Schmidt, M.; Powers, J.S.; Corre, M.D. Deforestation and reforestation impact on soils in the tropics. Nat. Rev. Earth Environ. 2020, 1, 590–605. [Google Scholar] [CrossRef]
  81. Tolessa, T.; Senbeta, F. The extent of soil organic carbon and total nitrogen in forest fragments of the central highlands of Ethiopia. J. Ecol. Environ. 2018, 42, 20. [Google Scholar] [CrossRef]
  82. Fan, J.; Zhang, C.; Jin, H.; Zhang, J.; Han, G. Grazing accelerates labile and recalcitrant soil carbon loss driving by rare microbial taxa in a desert steppe. Land Degrad. Dev. 2021, 1–13. [Google Scholar] [CrossRef]
  83. Loke, P.F.; Kotzé, E.; Du Preez, C.C.; Twigge, L. Cross-rangeland comparisons on soil carbon dynamics in the Pedoderm of semi-arid and arid South African commercial farms. Geoderma 2021, 381, 114689. [Google Scholar] [CrossRef]
  84. Pineiro, G.; Oesterheld, M.; Batista, W.B.; Paruelo, J.M. Opposite changes of whole-soil vs. pools C:N ratios: A case of Simpson’s paradox with implications on nitrogen cycling. Glob. Chang. Biol. 2006, 12, 804–809. [Google Scholar] [CrossRef]
  85. Silveira, M.L.; Comerford, N.B.; Reddy, K.R.; Cooper, W.T.; El-Rifai, H. Characterization of soil organic carbon pools by acid hydrolysis. Geoderma 2008, 144, 405–414. [Google Scholar] [CrossRef]
  86. Rovira, P.; Jorba, M.; Romanyà, J. Active and passive organic matter fractions in Mediterranean forest soils. Biol. Fertil. Soils 2010, 46, 355–369. [Google Scholar] [CrossRef]
  87. Olson, B.M.; Lowe, L.E. Effects of intensive vegetable production on the hydrolyzable carbon, nitrogen and sulphur of a British Columbia humisol. Can. J. Soil Sci. 1989, 70, 621–628. [Google Scholar]
  88. Fang, S.; Xie, B.; Zhang, H. Nitrogen dynamics and mineralization in degraded agricultural soil mulched with fresh grass. Plant Soil 2007, 300, 269–280. [Google Scholar] [CrossRef]
  89. Mahal, N.K.; Osterholz, W.R.; Miguez, F.E.; Poffenbarger, H.J.; Sawyer, J.E.; Olk, D.C.; Archontoulis, S.V.; Castellano, M.J. Nitrogen Fertilizer Suppresses Mineralization of Soil Organic Matter in Maize Agroecosystems. Front. Ecol. Evol. 2019, 7, 59. [Google Scholar] [CrossRef] [Green Version]
  90. Paré, T.; Dinel, H.; Schnitzer, M.; Dumontet, S. Transformations of carbon and nitrogen during composting of animal manure and shredded paper. Biol. Fertil. Soils 1998, 26, 173–178. [Google Scholar] [CrossRef]
Figure 1. Location of study area: Gelawdios, Ethiopia. Four chrono-sequence land-use types in one landscape.
Forests 13 00069 g001
Figure 2. Loss of C and N after conversion of natural forest to grazing and crop lands and eucalyptus plantation. (a) Percent loss of SOC stocks in compare with original natural forest, (b) Percent loss of soil N stock in compare with natural forest. Losses were estimated four vertical soil layers from 0–50 cm soil depth. Mean % of forest stocks (± SE).
Forests 13 00069 g002
Figure 3. Vertical distributions of labile C and N stocks in soils of natural forest, grazing and crop lands and eucalyptus plantation. (a) Labile C fraction 1, (b) labile C fraction 2, (c) labile N fraction 1 and (d) labile N fraction 2. Labile fraction 1 represent easily biodegradable fraction, i.e., carbohydrate, amino acids, while labile fraction 2 constitutes cellulosic compounds. Bar means stock (n = 5, ±SE), bars without same alphabet are statistically significant (p 0.05). NS, non-significant.
Forests 13 00069 g003
Figure 4. Vertical distributions of recalcitrant C and N (fraction 3) in soils of natural forest, grazing and crop lands and eucalyptus plantation. (a) Recalcitrant C stock and (b) recalcitrant N stock, representing unhydrolyzed fractions of soil organic matter from acid hydrolysis. Bar means stock (n = 5, ± SE), bars without same alphabet are statistically significant (p ≤ 0.05), NS, non-significant.
Forests 13 00069 g004
Figure 5. Principal component analysis (PCA) using soil C and N concentrations (% C & % N), C:N ratio, labile C and N (C-Lab1 & C-Lab 2, N-Lab 1 & N-Lab2) and recalcitrant C and N fractions (C-Recal & N-Recal). Each variable is represented by an arrow and showing the correlations between variables. In all four land-use types, two principle components (PCA1 & PCA2) explained all of the variances (100%).
Forests 13 00069 g005
Table 1. General characteristics of soils (0–10 cm) in different land-use types under study.
Land-Use
Natural ForestGrazing LandCrop LandEucalyptus Planta
Sand-Silt-clay (%)9-39-5224-48-283-50-4610-41-49
Textural classClayClay loamSilty claySilty clay
Bulk density (g cm−3)0.74 ± 0.011.22 ± 0.061.23 ± 0.031.2 4 ± 0.03
pH (H2O)6.26 ± 0.085.95 ± 0.125.99 ± 0.056.12 ± 0.15
pH (CaCl2)5.94 ± 0.115.37 ± 0.075.13 ± 0.065.08 ± 0.13
Organic matter (%)(loss on ignition)20.9 ± 3.610.5 ± 0.69.3 ± 0.711.5 ± 0.4
C (%)11.3 ± 1.42.7 ± 0.42.7 ± 0.24.0 ± 0.6
N (%)1.07 ± 0.130.24 ± 0.030.21 ± 0.020.3 ± 0.04
C:N Ratio10.6 ± 0.116.2 ± 1.113.3 ± 1.110.8 ± 0.2
Vegetation
(dominant species)
Albizia gummifera, Dombeya torrida, Croton macrostachusBare land with sparse grass tuftsTeff
(Eragrostis tef)
Eucalyptus globulus
(with few understory shrubs)
Table 2. ANOVA results of soil labile (fraction 1 and 2) and recalcitrant (fraction 3) C and N at different soil depths and various land-uses and land-use × depth interactions.
SourcesC Fraction 1C Fraction 2C Fraction 3
dfMean SquareF ValueSig.Mean SquareF ValueSig.Mean SquareF ValueSig.
Corrected Model150.085.64**0.50511.736**0.1826.502**
Intercept146.543266.01**15.633363.60**7.526268.83**
Land-use30.128.50**2.17250.511**0.45616.273**
Depth30.2315.86**0.3317.696**0.37713.483**
Land-use × Depth90.021.28NS0.0070.157NS0.0260.918NS
Error640.02 0.043 0.028
N fraction 1N fraction 2N fraction 3
Corrected Model150.7019.53**0.60215.756**0.1003.610**
Intercept1197.525516.73**208.4395456.02**39.7241427.06**
Land-use33.0986.38**2.65269.428**0.2187.843**
Depth30.339.14**0.3358.768**0.2388.550**
Land-use × Depth90.030.71NS0.0070.195NS0.0150.552NS
Error640.04 0.038 0.028
** Significant (p < 0.001), NS = non-significant.
Table 3. Relative concentration of difference SOM fractions under different land-use. C and N fractions at each depth were comparable along four land-use types. Values equal mean (n = 5, ± SE). Different alphabets indicate variations between two land-use types are statistically significant (p ≤ 0.05).
C Fraction (mg g−1 C)N Fraction (mg g−1 N)
Soil Depth (cm)Natural ForestGrazing LandCrop LandEucalyptusNatural ForestGrazing LandCroplandEucalyptus
Fraction 1
0–10152 ± 7 a213 ± 13 b187 ± 10 ab164 ± 11 a218 ± 34 a92 ± 7 b81 ± 4 b85 ± 5 b
10–20145 ± 13a226 ± 17 b184 ± 14 ab229 ± 18 b288 ± 44 a85 ± 5 b70 ± 6 b96 ± 7 b
20–30132 ± 13 a228 ± 26 b184 ± 8 ab227 ± 19 b207 ± 20 a87 ± 4 b67 ± 3 b75 ± 9 b
30–50134 ± 15 a218 ± 31 b190 ± 12 ab240 ± 23 b192 ± 20 a88 ± 8 b63 ± 5 b126 ± 29 ab
Fraction 2
0–10190 ± 9 a113 ± 8 b99 ± 11 b87 ± 5 b178 ± 10 a79 ± 5 b83 ± 5 b82 ± 6 b
10–20212 ± 2 a112 ± 8 b103 ± 15 b119 ± 17 b182 ± 7 a79 ± 4 b76 ± 7 b83 ± 7 b
20–30236 ± 28 a106 ± 6 b99 ± 15 b104 ± 18 b187 ± 27 a75 ± 6 b78 ± 10 b72 ± 8 b
30–50252 ± 35 a101 ± 4 b85 ± 20 b108 ± 14 b181 ± 24 a74 ± 3 b68 ± 9 b84 ± 13 b
Fraction 3
0–10658 ± 15 a674 ± 11 ab713 ± 15 b748 ± 11 b604 ± 41 a829 ± 3 b836 ± 5 b833 ± 10 b
10–20643 ± 14 a661 ± 12 a713 ± 14 a657 ± 32 a529 ± 40 a837 ± 3 b854 ± 8 b820 ± 7 b
20–30632 ± 37 a666 ± 27 a718 ± 20 a669 ± 16 a608 ± 44 a837 ± 4 b855 ± 12 b854 ± 10 b
30–50614 ± 50 a681 ± 30 a725 ± 20 a652 ± 18 a627 ± 44 a838 ± 5 b868 ± 10 b790± 41 b
Fraction 1, 2 and 3 indicate labile 1, labile 2 and recalcitrant substances, respectively.
Table 4. Recalcitrant index of SOC and N in different soil depths in forest, grazing and crop lands and eucalyptus plantation.
Depth (cm)ForestGrazing LandCrop LandEucalyptus
Recalcitrant C Index (RIC)
0–1043 ± 2 a45 ± 1 ab51 ± 2 bc56 ± 2 c
10–2041 ± 2 a44 ± 2 a51 ± 2 a43 ± 4 a
20–3040 ± 5 a45 ± 4 a52 ± 3 a45 ± 2 a
30–5039 ± 6 a47 ± 4 a53 ± 3 a43 ± 2 a
Recalcitrant N Index (RIN)
0–1032 ± 2 a68 ± 1 b70 ± 1 b69 ± 2 b
10–2032 ± 1 a70 ± 1 bc73 ± 1 b67 ± 1 c
20–3033 ± 4 a70 ± 1 b73 ± 2 b73 ± 2 b
30–5035 ± 4 a70 ± 1 b75 ± 2 b63 ± 6 b
Values with same alphabets are not significantly different (p ≤ 0.05) between land use types.
Table 5. C:N ratio of the whole soil and three fractions of SOM (labile 1 and 2 and recalcitrant 3). C:N ratio of 0–50 cm soil profile of each land-use types expressed as mean of four soil layers. Mean C:N ratios (n = 5, ± SE) without same alphabet along land-use types are statistically significance (p ≤ 0.05).
Land-Use & Soil Depth (cm)C:N Ratio
Whole SoilFraction 1Fraction 2Fraction 3
Natural Forest
0–1011 ± 0.16.5± 0.111.4 ± 0.211.7 ± 0.5
10–2010 ± 0.26.6 ± 0.212.1 ± 0.613.1 ± 1.6
20–3010 ± 0.26.9 ± 0.214.0 ± 1.011.3 ± 0.3
30–5012 ± 0.67.9 ± 0.315.9 ± 1.011.2 ± 0.8
Mean11 ± 0.3 a7.0 ± 0.2 a13.3 ± 0.5 a11.8 ± 0.4 a
Grazing Land
0–1011 ± 0.325.6 ± 2.015.4 ± 0.58.8 ± 0.1
10–2011 ± 0.128.2 ± 0.915.0 ± 0.48.4 ± 0.3
20–3010 ± 0.227.6 ± 2.615.0 ± 0.48.5 ± 0.7
30–5011 ± 0.526.6 ± 3.214.3 ± 0.58.6 ± 0.7
Mean11 ± 0.3 a26.0 ± 1.0 b15.0 ± 0.2 ab8.6 ± 0.2 b
Crop Land
0–1012 ± 1.030.8 ± 2.315.4 ± 0.211.4 ± 1.1
10–2013 ± 0.832.3 ± 1.916.1 ± 1.210.2 ± 0.6
20–3013 ± 0.536.7 ± 2.416.3 ± 0.711.1 ± 1.0
30–5013 ± 0.438.0 ± 2.014.8 ± 2.110.5 ± 0.4
Mean13 ± 0.4 b34.3 ± 1.1 c15.6 ± 0.6 b10.8 ± 0.4 a
Eucalyptus
0–1014 ± 1.031.3 ± 1.117.3 ± 1.114.6 ± 1.2
10–2012 ± 1.030.1 ± 1.818.0 ± 2.410.2 ± 1.2
20–3013 ± 2.035.6 ± 2.716.0 ± 1.09.0 ± 0.8
30–5012 ± 1.025.4 ± 5.114.5 ± 0.69.5 ± 1.3
Mean 13 ± 1.0 b30.6 ± 1.5 bc16.4 ± 0.7 b10.8 ± 0.7 a
Fraction 1,2 & 3 indicate labile 1, labile 2 and recalcitrant substances respectively.
Publisher’s Note: MDPI stays neutral with regard to jurisdictional claims in published maps and institutional affiliations.

