Abstract
Wood is an anisotropic material, the mechanical properties of which are strongly influenced by its microstructure. In wood, grain compression strength and modulus are the weakest perpendicular to the grain compared to other grain directions. FE (finite element) models have been developed to investigate the mechanical properties of wood under transverse compression. However, almost all existing models were deterministic. Thus, the variations of geometry of the cellular structure were not considered, and the statistical characteristic of the mechanical property was not involved. This study aimed to develop an approach to investigate the compression property of wood in a statistical sense by considering the irregular geometry of wood cells. First, the mechanical properties of wood under radial perpendicular to grain compression was experimentally investigated, then the statistical characteristic of cell geometry was extracted from test data. Finally, the mechanical property of wood was investigated using the finite element method in combination with the Monte Carlo Simulation (MCS) techniques using randomly generated FE models. By parameter sensitivity analysis, it was found that the occurrence of the yield points was caused by the bending or buckling of the earlywood axial tracheid cell wall in the tangential direction. The MCS-based stochastic FE analysis was revealed as an interesting approach for assessing the micro-mechanical performance of wood and in assisting in understanding the mechanical behavior of wood based on its hierarchical structure.
1. Introduction
Wood exhibits a hierarchical architecture and at all structural levels, it is an anisotropic porous material []. On the mesoscale, wood is a cellular solid, as illustrated in Figure 1. As early as 1928, Price [] investigated the relationship between the anisotropic mechanical properties of wood and its microstructure. The physical and mechanical properties of wood are thought to strongly depend on the material and shape of the cells [].
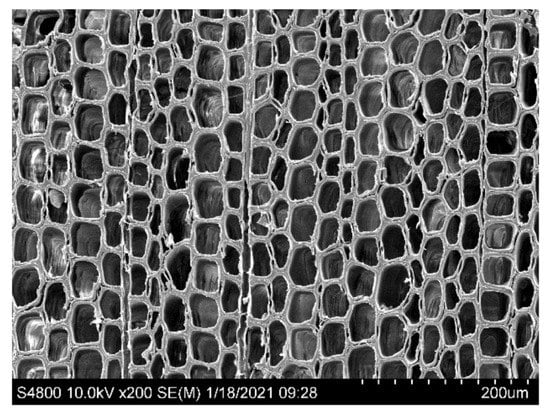
Figure 1.
Example of cellular cross section structure of softwood [Masson pine (Pinus massoniana Lamb.), shot via Hitachi S-4800@10 kV, WD = 8 mm].
Wood is widely used as a structural material. The perpendicular to grain direction, also called the transverse direction, is the structural weakest direction of wood []. While designing timber structures, compression perpendicular to the grain is not preferred but cannot be fully avoided. Compression perpendicular to the grain extensively exists in situations such as dowel-type connections, beam supports, longhouse, etc. In some cases, the large deformation ability under compression perpendicular to the grain is exploited by using wood as cushion materials, bottle stoppers, etc. Under perpendicular to grain compression, wood presents a three-stage load-displacement curve [,,], and the corresponding modulus of elasticity and yield strength are rather small. For example, the compression strength perpendicular to the grain of black spruce (Picea mariana Mill.) with a moisture content of 12% is only approximately 3.8 MPa, while the corresponding compression strength in the longitudinal direction is 41.1 MPa []. The modulus of elasticity of wood perpendicular to the grain is only about 1/30th of what it is parallel to grain [].
Some theoretical models have been developed to explain the mechanical property of wood under compression perpendicular to the grain in the mesoscale. Kanaya and Yamada [] took a T-shaped tipple element, part of the cellular structure of wood, and worked out the tangential elastic modulus of wood based on the geometry and material properties of the cell wall. Subsequently, Gillis [] adopted a similar model and calculated the six moduli and Poisson’s ratio as a function of the geometry and the isotropic properties of the cell wall. Following this, the Gillis model [] was extended by Koponen et al. [] to estimate the elastic and shrinkage properties of wood by considering the orthotropic properties of the cell wall. Besides the triple element model, wood was often viewed as a honeycomb structure []. Gibson et al. [] investigated the structure of cork and explained the moduli difference in different directions by considering the cork as closed hexagonal prisms with linear elastic isotropic cell walls. Easterling et al. [] investigated the compression behavior of balsa wood by scanning microscopy. Via the honeycomb model, it was found that the moduli, strength, and anisotropy of balsa and other wood are determined by the properties of the cell wall material and the dimensions and shape of the cells. Ando and Onda [,] investigated the deformation mechanism of coniferous wood under scanning microscopy and analyzed the first breaking stress by viewing the wood as a hexagonal-prim structure. They concluded that the first break of the radial cell wall was due to the buckling of the radial cell wall. Watanabe et al. [,,] extended the honeycomb theory by introducing more parameters such as the variation of cell wall thickness, the inclined angle of the cell to the loading direction, etc. The cell walls of wood are made up of four basic building blocks: cellulose, hemicellulose, lignin and pectin. The mechanical models based on the microstructure of wood were reviewed by Gibson [] and Maaβ et al. []. In recent years, advanced imaging techniques were more frequently used to study the geometric properties of wood in relation to its mechanical properties [], which helps bridge the information of wood in different scales together.
FE (finite element) models were also developed to investigate the mechanical behavior of wood under transverse compression. The hierarchical modelling of micro-structural effects on the mechanical properties of wood was reviewed by Hofstetter and Gamstedt [] and Mishnaevsky and Qing []. Here we concentrate on modeling of wood in mesoscale. De Magistris and Salmen [] modeled the mechanical properties of wood under transverse compression. The cellular structure was modeled with anisotropic one-layer cell walls and orthotropic multi-layer cell walls. Interestingly, it was found that the deformation behavior seemed independent of the material properties of the cell wall but depended more on the geometry of cells. Fortino et al. [] developed an FE model that included the geometrical and material nonlinearity where five layers of the cell wall were modeled by designating different material properties and local martial coordinates. One problem in modeling wood is the large variation in the geometry of cells. To solve this problem, Persson [] introduced the irregularity of cell geometry to the FE model by modifying the position of the connection point between adjacent cells. He also tried to model wood based on the real cell microstructures obtained from the experiment. To develop a model based on real dimensions, the material point method (MPM) was introduced by Nairn [] to model the behavior of wood where the details of wood anatomy have been used.
Most FE models were based on the ‘repeating unit cell’ (RUC) method. It provides a very good framework for the analysis of the mechanical behavior of wood at the mesoscale. However, nearly all the models were deterministic models, where the variations of geometry of cells were not considered. Even in some models, the irregularity of cell geometry was included, the sample size was too small to evaluate the statistical characteristics of the mechanical property of wood. Considering the large variation in the geometry of cells, a stochastic model would be better for this case. Thus, the aim of this study was to develop an approach to investigate the compression property of wood in a statistical sense by considering the irregular geometry of wood cells.
In this study, the behavior of wood under radial perpendicular to grain compression was experimentally investigated, and the deformation of cells was observed by a scanning electron microscope (SEM). The statistical characteristics of cell geometry were extracted from the test data and used to generate FE models. The uncertainty of the behavior of wood was investigated via the finite element method in combination with the Monte Carlo Simulations (MCS) techniques. The MCS-based stochastic FE analysis was revealed as an interesting approach for assessing the micro-mechanical performance of wood and assisting in understanding the behavior of wood based on the hierarchical structure.
2. Materials and Methods
2.1. Materials
The wood material used in this study was cut from 5 Masson pine (Pinus massoniana Lamb.). This species was chosen because it is a typical coniferous commercial species, and it is also a main commercial plantation species used in south China. The Masson pine was grown in Chongzuo City, Guangxi Province (21°59′50″ N, 107°2′2″ E). The diameter at the breast height of the trees was approximately 24 cm. The material used for the quantitative wood anatomy research was from disks with a thickness of 7–10 cm collected at the breast height of 1.3 m. The material of the compression test was log segments from stems at a height of 1.5–2.5 m, and the mature part of the wood was chosen. All specimens were conditioned at 20 °C under 65% relative humidity for 2 weeks, and the moisture content was adjusted to approximately 12.8%. The density was 0.58 ± 0.04 g/cm3.
The quantitative anatomy-related method and the results were delineated in Meng et al. [].
2.2. Compression Test
The compression test was performed on the universal testing machine (Instron 5582). Five cuboid specimens with dimensions of 20 mm (R) × 20 mm (T) × 30 mm (L) were manufactured by a skilled technician via an electric saw and planer. They were tested under radial loading because the performance of wood under radial and tangential compression is quite different for coniferous species due to the alternate structure of earlywood and latewood. The tangential compression involves phenomena such as the buckling of annual rings and cracks between earlywood and latewood, while wood under radial compression presents uniform deformation. Thus, radial compression was studied firstly, and the tangential compression will be studied later. The specimens were loaded at a rate of 0.5 mm/min. The force-displacement curves of specimens were recorded. Stress–strain curves were also derived. Young’s Modulus (MOE) was determined using the linear regression method on the initial linear part of the stress–strain curve.
To observe the deformation of cells at the yield point, matched specimens were tested. Loading was stopped at the yield point, then the wood blocks with a section of roughly 8 mm × 8 mm were cut from these specimens for SEM observation. The surfaces of these wood blocks were prepared in a sliding microtome (Leica SM2010R) using a diamond knife. The surface was then sputter-coated with gold, and the vacuum was applied before testing. It was observed by SEM (Hitachi S-4800) under a high vacuum (Accelerating voltage = 10.0 kV, Working distance = 8 mm). Both the upper and lower detectors were used. The upper detector detects secondary electrons (SE), low angle backscattered electrons (BSE-L) and high angle backscattered electrons (BSE-H), while the lower detector detects secondary electrons and very low angle backscattered electrons.
2.3. Numerical Study
The mesoscale cell network of wood was modeled in the finite element software ABAQUS (Dassault Systèmes Simulia Corp., Providence, RI, USA). The input file for analysis, which is a text file containing the complete description of the numerical model such as the geometry, the material property, interaction, meshing, loading condition, etc., was generated via the ABAQUS Scripting Interface Scripts, which were Python scripts. R scripts were also used in this study to generate the random data based on the statistical parameters.
To simulate the compression property of wood, a six-by-six cell network was modeled, with three layers of earlywood and three layers of latewood, respectively. All the cells, with the primary and secondary cell walls modelled integrally, were connected to a frame modeling the middle lamella that separated every cell. Based on Wang’s measurement [], the cell of earlywood was assumed to be a round-cornered square with an outer side of about 45 μm, and the dimension of latewood was 45 μm × 38 μm. The inner side, depending on the wall thickness, varied between each cell. The thickness of the middle lamella between latewood was 0.93 μm, while the thickness of the middle lamella between earlywood was 0.22 μm. The fillets of the cells were 3 μm or 1/6 of the inner side for earlywood and latewood, respectively. In each model, 4 nodes and 3 nodes of 2D plane stress elements CPS4R and CPS3 were used to model the geometry. The geometry was meshed based on a global seed of approximately 1 μm; around 35,000 elements were generated in one model.
In the model, the y axis corresponded to the radial direction, while the x-axis corresponded to the tangential direction. The linear isotropic material was used for the middle lamella (M), while the orthotropic model was used for the cell walls, including the primary wall (P) and the secondary wall (S). The material properties of different layers in the cell wall were reported []. Accordingly, the material properties of the middle lamella were E = 1144 MPa and υ = 0.35 []. The modulus of elasticity of the cell wall was calculated based on an approximate volume fraction of each secondary wall as 1:8:1, the finally calculated properties were ER = ET = 3300 MPa, υ = 0.7, GLR = GLT = 850 MPa, and GRT = 938 MPa.
The bottom edge of the model was restricted, and controlled vertical displacement was applied to the top edge. The reaction force, stress, stain, etc., were outputted to the result database. To avoid instability, geometric nonlinearity was considered, and an explicit solver was used.
The FE model is illustrated in Figure 2, and some generated FE models with random cell wall thicknesses are shown in Figure 3 to display the variation of the cell geometry.
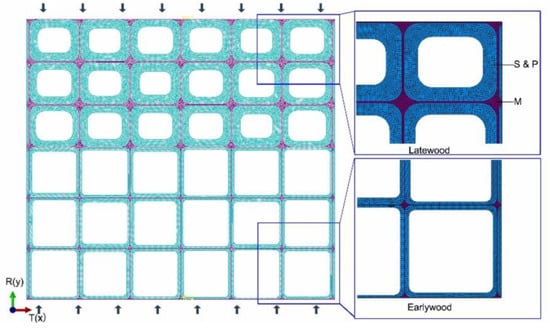
Figure 2.
Schematic of the finite element model (S means the secondary wall; P means the primary wall; M means the middle lamella; R(y) means the y axis is the radial direction; T(x) means the x axis is the tangential direction).
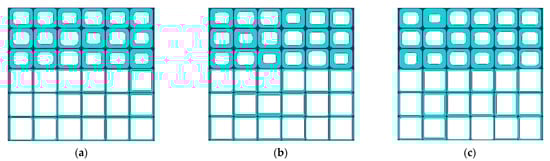
Figure 3.
Generated FE models with random cell wall thicknesses: (a) Model 1; (b) Model 2; (c) Model 3.
3. Results and Discussions
3.1. The Statistical Information of the Cell Geometry
The geometry data of axial tracheid of Masson pine were obtained by Meng et al. []. In this study, the radial and tangential cell wall thickness information of mature wood were analyzed. The Kolmogorov–Smirnov (KS) goodness-of-fit test was carried out for three possible distribution types of Normal, Lognormal, and two parameters Weibull distribution. The fitted parameters and the KS test statistic D and corresponding p-values are listed in Table 1. The probability density distribution curves of the test data and fitted distributions are shown in Figure 4. It was found that the Lognormal distribution fit the test data best among the three possible distribution types. As stated in Section 2.3, the random thickness data was generated by the fitted parameters as per Lognormal distribution.

Table 1.
Fitted parameters and KS test statistics (Unit: μm).
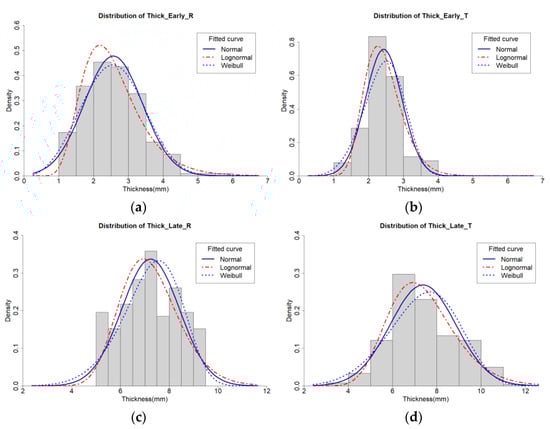
Figure 4.
Distribution of cell wall thickness of earlywood and latewood in radial and tangential directions: (a) Distribution of thickness of radial earlywood cell wall; (b) Distribution of thickness of tangential earlywood cell wall; (c) Distribution of thickness of radial latewood cell wall; (d) Distribution of thickness of tangential latewood cell wall.
3.2. Convergence of the MCS FE Analysis
With the increase of simulation number, the mean and variance of the simulated yield force of the finished model were calculated. Convergence of the mean and variance was used as a metric to evaluate whether the sample size was large enough. The mean and variance of yield force versus the number of simulations are shown in Figure 5. It was found that both the mean and variance of yield force converged when the simulation number exceeded 120; thus, a sample size of 200 was sufficient to evaluate the statistical information of the specimens.
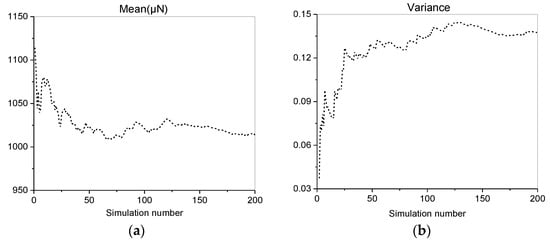
Figure 5.
The mean and variance of yield force versus the number of simulations: (a) Mean of yield force; (b) Variance of yield force.
3.3. Simulation and Experimental Results
The force-displacement curves of each model were extracted from the output database and shown in Figure 6. Significant variation was observed in the force-displacement curves.
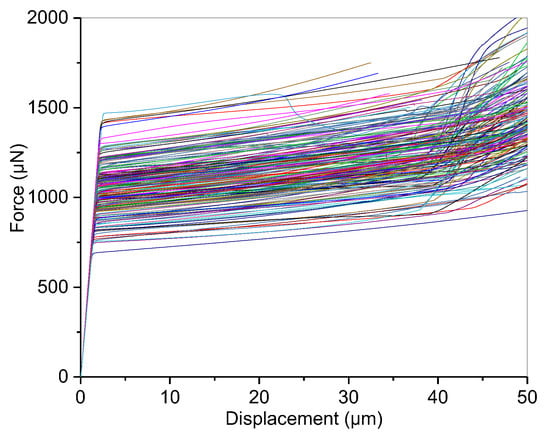
Figure 6.
The force-displacement curves of each model.
The yield force and stiffness of each model are shown in Figure 7. Both the yield force and stiffness fluctuated with the simulation number, indicating that the geometry of cells influences the mechanical property of wood.
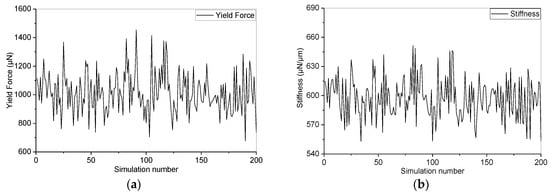
Figure 7.
The yield force and stiffness for each simulation: (a) Yield force. (b) Stiffness.
The statistical characteristic of the simulation-derived yield force and stiffness were analyzed. The probability density distribution curves of the fitted distributions of the yield force and stiffness are shown in Figure 8. A KS test was also carried out to inspect which distribution fitted the data best. It was found that the yield force and stiffness also complied with the Lognormal distribution best, where the KS statistic D were 0.035 and 0.042 for yield force and stiffness, respectively.
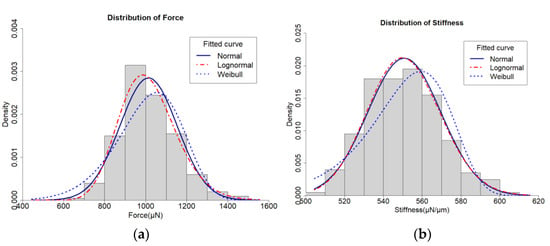
Figure 8.
Distribution of the simulated yield force and stiffness: (a) Yield force; (b) Stiffness.
To compare the deformation behavior between simulation and experiment, the deformed cell network and the SEM picture of the specimen are displayed in Figure 9. The cell wall bending or buckling of earlywood was clearly seen in both experiments and simulation. The normal stress in the radial direction at the yield point and larger compression strain (0.2) are also displayed. It was found that the maximum stress was located at the inner side of the tracheid of earlywood. At larger compression strain, the earlywood cell wall began to touch each other, resulting in a hardening behavior as introduced before. It was found that the occurrence of the yield point was generally caused by the sudden change in the cellular structure, i.e., the bending or buckling of the earlywood axial tracheid cell wall.
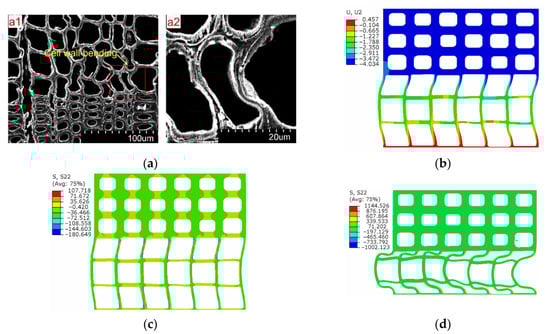
Figure 9.
The deformation mode and stress distribution of cell network and SEM picture: (a1) SEM of cell deformation; (a2) bending or buckling of the earlywood cell wall; (b) deformation mode of the FE model at yield point; (c) Normal stress in the radial direction at yield point; (d) Normal stress in the radial direction at larger deformation.
The stress–strain curves for the simulated and tested specimens are displayed in Figure 10, where the simulation results are presented in the form of an expected region area. The expected region area is the envelope of all the stress–strain curves of the 200 FE models. In addition, displayed in the figure is the mean response of the FE simulations. It was found that all the yield points of experimental curves located in the expected region, and the linear part region, agreed well with the test results, except for one test curve. It was found that the tested stiffness after yield point was larger than the simulation results. This indicated that more details, such as the parenchyma cell and ray tracheid, should be taken into consideration to simulate the post-yield behavior of wood under compression.
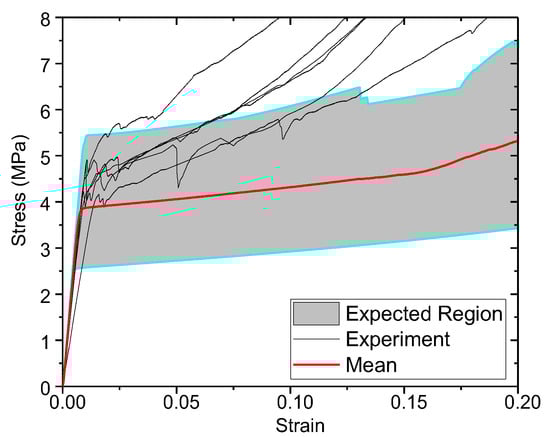
Figure 10.
The stress–strain curves extracted from the FE model and tested specimens.
Young’s modulus was calculated using the data of the linear part of the stress–strain curve. Figure 11 display the numerically and experimentally derived Young’s moduli and yield stress. Error bars are used to display the bounds of the expected region. Five experimental results are reported. It was found that almost all the tested yield stress was located within the expected region. However, the predicted Young’s modulus was a little bit higher than the experiment results. This might be due to the idealization of wood cells as a rectangular shape which introduced fewer geometry imperfections into the FE model than actual.
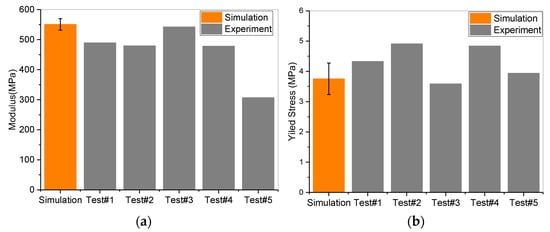
Figure 11.
The Young’s modulus and yield stress from simulation and test: (a) Modulus; (b) Yield stress.
Overall, the numerical models exhibited a good agreement with the experiments.
3.4. The Parameter Sensitivity Analysis
The Pearson linear correlation was used to evaluate the parameter sensitivities based on the correlation coefficients between the input parameters and the output variables. The Pearson linear correlation coefficient between two variables x and y is [],
In this study, the input parameters were separated into two groups: the cell wall thickness information of earlywood and latewood, respectively. In each group, the randomly generated cell wall thickness was sorted from smallest to largest. Then the sum of the cell wall thickness of the least thin n cells was calculated, respectively. The number n ranged from 1 to 36, n = 1 means only the cell wall data in the radial or tangential direction of the thinnest cell was used, and n = 36 means all of cell wall thickness data were used.
The correlation coefficient between the thickness data of the least n cells and the yield force were calculated and shown in Figure 12. It was found that the correlation coefficients between the cell wall thickness of latewood and the yield force were between −0.1 and 0, indicating that the yield stress had no or very weak correlation with the cell wall thickness of latewood. For earlywood, the correlation coefficients increased rapidly with the increase of the number of thin cells; however, the correlation coefficients decreased when the number of cells exceeded 32. In General, the correlation coefficients between yield force and the thickness data of earlywood cell wall information were larger than 0.3 for cases where seven or more cells were used. Thus, the yield force was affected by the geometry of the earlywood cells.
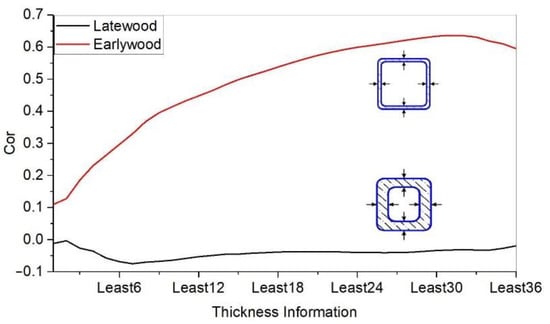
Figure 12.
The correlation coefficient between yield force and the thickness data of the cell walls of earlywood and latewood.
The correlation coefficient between the thickness data of the least n earlywood cells in radial and tangential direction and the yield force were calculated further, respectively. As shown in Figure 13, it was found that the correlation coefficients between the cell radial wall thickness of earlywood and the yield force were between 0 and 0.2, indicating a weak correlation. While the correlation coefficients between the cell tangential wall thickness of earlywood and the yield force were between 0.35 and 0.75, indicating a moderate positive correlation.
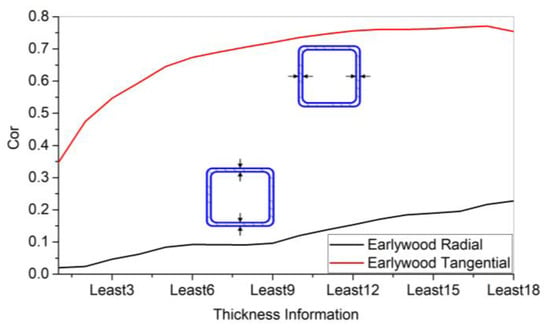
Figure 13.
The correlation coefficient between yield force and the thickness data of cell walls in the radial and tangential direction of earlywood.
Thus, the yield force was strongly affected by the geometry of the earlywood cells. This echoed with the founding from the SEM observation of the cellular structure and the simulated deformation and stress distribution of cell network from the FE simulation, i.e., the occurrence of the yield points was caused by the bending or buckling of the earlywood axial tracheid cell wall in the tangential direction.
4. Conclusions
A new approach was developed for studying the mechanical properties of wood under compression perpendicular to the grain. The wood compression property was investigated using the Monte Carlo Simulation technique in combination with FE analysis on models generated using measured mesoscale wood statistical data. The main conclusion includes:
The FE model predicted the bending or buckling of the earlywood cell wall as observed in compression tests. The simulated stress–strain curves and the derived yield stress and Young’s modulus agreed well with the test results. In this way, the developed model can precisely simulate the mechanical property of wood under compression perpendicular to the grain.
The random nature of cell geometry has been a primary cause of the variability of wood mechanical property. By parameter sensitivity analysis, it was found that the occurrence of the yield points was caused by the bending or buckling of the earlywood axial tracheid cell wall in the tangential direction.
The straightforward implementation of Monte Carlo Simulation techniques combined with finite element modelling provided more information than the deterministic numerical models based on idealized geometries. This provided insight into how the mechanical property of wood correlated with the geometry information of cell structure and can be used to evaluate the statistical characteristics of mechanical properties.
Further work is still required to understand the effect of other features on the mechanical property and to evaluate the reliability of the wood, such as the variations of material property, ray and the resin canal, etc. It should be noted that there was a lamination of this study and only radial compression was investigated; thus, the behavior of wood under tangential compression is to be investigated further. The current findings are based on one species; thus, experiments on other wood species will be carried out in the future.
Author Contributions
Conceptualization, G.W.; methodology, G.W.; formal analysis, Y.S.; investigation, G.W.; resources, J.G. and F.F.; data curation: G.W. and J.G.; writing—original draft preparation, G.W.; writing—review and editing, J.G., Y.S. and H.R.; visualization, G.W.; supervision, H.R.; project administration, H.R.; funding acquisition, F.F., G.W. and J.G. All authors have read and agreed to the published version of the manuscript.
Funding
This work was funded by the Chinese Academy of Forestry Fundamental Research Fund (Grant No. CAFYBB2020ZA003) and the National Natural Science Foundation of China (Grant No. 31890772).
Institutional Review Board Statement
Not applicable.
Informed Consent Statement
Not applicable.
Data Availability Statement
The data used to support the findings of this study are available from the authors upon request.
Conflicts of Interest
The authors declare no conflict of interest.
References
- Gindl, W.; Müller, U.; Teischinger, A. Effects of cell anatomy on the plastic and elastic behaviour of different wood species loaded perpendicular to grain. IAWA J. 2003, 24, 117–128. [Google Scholar] [CrossRef]
- Price, A.T. A Mathematical discussion on the structure of wood in relation to its elastic properties. Philos. Trans. R. Soc. Lond. 1929, 659, 1–62. [Google Scholar] [CrossRef]
- Mishnaevsky, L., Jr.; Qing, H. Micromechanical modelling of mechanical behaviour and strength of wood: State-of-the-art review. Comp. Mater. Sci. 2008, 44, 363–370. [Google Scholar] [CrossRef]
- Thelandersson, S.; Larsen, H.J. Timber Engineering; John Wiley & Sons: West Sussex, UK, 2003. [Google Scholar]
- Gibson, L.J.; Ashby, M.F. Cellular Solids: Structure and Properties; Pergamon Press: New York, NY, USA, 1988. [Google Scholar]
- Bodig, J. The effect of anatomy on the initial stress-strain relationship in transverse compression. Forest Prod. J. 1965, 15, 197–202. [Google Scholar]
- Tabarsa, T.; Chui, Y.H. Characterizing microscopic behavior of wood under transverse compression. Part II. Effect of species and loading direction. Wood Fiber Sci. 2001, 33, 223–232. [Google Scholar] [CrossRef]
- Forest Products Laboratory. Wood Handbook-Wood as an Engineering Material; General Technical Report FPL-GTR-113; U.S. Department of Agriculture, Forest Service, Forest Products Laboratory: Madison, WI, USA, 1999. [Google Scholar]
- ANSI/APA. Standard for Performance-Rated Cross-Laminated Timber (PRG 320); APA-The Engineered Wood Association: Tacoma, WA, USA, 2018. [Google Scholar]
- Kanaya, N.; Yamada, T. The relation between the elastic modulus and the porosity of wood. Wood Res.-Slovak. 1964, 33, 47–55. [Google Scholar]
- Gillis, P.P. Orthotropic elastic constants of wood. Wood Sci. Technol. 1972, 6, 138–156. [Google Scholar] [CrossRef]
- Koponen, S.; Toratti, T.; Kanerva, P. Modelling elastic and shrinkage properties of wood based on cell structure. Wood Sci. Technol. 1991, 25, 25–32. [Google Scholar] [CrossRef]
- Gibson, L.J.; Easterling, K.E.; Ashby, M.F. The structure and mechanics of cork. Proc. R. Soc. Lond. A Math. Phys. Sci. 1981, 377, 99–117. [Google Scholar] [CrossRef]
- Easterling, K.E.; Harrysson, R.; Gibson, L.J.; Ashby, M.F. On the mechanics of balsa and other woods. Proc. R. Soc. Lond. A Math. Phys. Sci. 1982, 383, 31–41. [Google Scholar] [CrossRef]
- Ando, K.; Onda, H. Mechanism for deformation of wood as a honeycomb structure I: Effect of anatomy on the initial deformation process during radial compression. J. Wood Sci. 1999, 45, 120–126. [Google Scholar] [CrossRef]
- Ando, K.; Onda, H. Mechanism for deformation of wood as a honeycomb structure II: First buckling mechanism of cell walls under radial compression using the generalized cell model. J. Wood Sci. 1999, 45, 250–253. [Google Scholar] [CrossRef]
- Watanabe, U.; Norimoto, M.; Ohgama, T.; Fujita, M. Tangential Young’s modulus of coniferous early wood investigated using cell models. Holzforschung 1999, 53, 209–214. [Google Scholar] [CrossRef]
- Watanabe, U.; Norimoto, M.; Morooka, T. Cell wall thickness and tangential Young’s modulus in coniferous early wood. J. Wood Sci. 2000, 46, 109–114. [Google Scholar] [CrossRef]
- Watanabe, U.; Fujita, M.; Norimoto, M. Transverse Young’s moduli and cell shapes in coniferous early wood. Holzforschung 2002, 56, 1–6. [Google Scholar] [CrossRef]
- Gibson, L.J. The hierarchical structure and mechanics of plant materials. J. R. Soc. Interface 2012, 9, 2749–2766. [Google Scholar] [CrossRef] [PubMed]
- Maaβ, M.H.; Saleh, S.; Militz, H.; Volkert, C.A. The Structural origins of wood cell wall toughness. Adv. Mater. 2020, 32, 1907693. [Google Scholar] [CrossRef] [Green Version]
- Toumpanaki, E.; Shah, D.U.; Eichhorn, S.J. Beyond what meets the eye: Imaging and imagining wood mechanical–structural properties. Adv. Mater. 2021, 33, 2001613. [Google Scholar] [CrossRef]
- Hofstetter, K.; Gamstedt, E.K. Hierarchical modelling of microstructural effects on mechanical properties of wood. A review COST Action E35 2004–2008: Wood machining–micromechanics and fracture. Holzforschung 2009, 63, 130–138. [Google Scholar] [CrossRef]
- De Magistris, F.; Salmén, L. Finite Element modelling of wood cell deformation transverse to the fibre axis. Nord. Pulp. Pap. Res. J. 2008, 23, 240–246. [Google Scholar] [CrossRef]
- Fortino, S.; Hradil, P.; Salmén, L.; De Magistris, F. A 3D micromechanical study of deformation curves and cell wall stress-es in wood under transverse loading. J. Mater. Sci. 2015, 50, 482–492. [Google Scholar] [CrossRef]
- Persson, K. Micromechanical Modelling of Wood and Fibre Properties. Ph.D. Thesis, Lund University, Lund, Sweden, 2000. [Google Scholar]
- Nairn, J.A. Numerical simulations of transverse compression and densification in wood. Wood Fiber Sci. 2006, 38, 576–591. [Google Scholar] [CrossRef]
- Meng, Q.; Fu, F.; Wang, J.; He, T.; Jiang, X.; Zhang, Y.; Yin, Y.; Li, N.; Guo, J. Ray traits of juvenile wood and mature wood: Pinus massonia and Cunninghamia lanceolata. Forests 2021, 12, 1277. [Google Scholar] [CrossRef]
- Wang, D. Wood Fracture Mechanisms under Longitudinal Tensile and Bend Loading. Ph.D. Thesis, Chinese Academy of Forestry, Beijing, China, 2020. [Google Scholar]
- Profillidis, V.A.; Botzoris, G.N. Modeling of Transport Demand: Analyzing, Calculating, and Forecasting Transport Demand, 1st ed.; Elsevier: Amsterdam, The Netherlands, 2018. [Google Scholar]
Publisher’s Note: MDPI stays neutral with regard to jurisdictional claims in published maps and institutional affiliations. |
© 2021 by the authors. Licensee MDPI, Basel, Switzerland. This article is an open access article distributed under the terms and conditions of the Creative Commons Attribution (CC BY) license (https://creativecommons.org/licenses/by/4.0/).