Article

Understanding 34 Years of Forest Cover Dynamics across the Paraguayan Chaco: Characterizing Annual Changes and Forest Fragmentation Levels between 1987 and 2020

1
Earth Observation Center (EOC) of the German Aerospace Center, DLR, Oberpfaffenhofen, 82234 Wessling, Germany
2
Faculty of Engineering (FIUNA), National University of Asunciónn, San Lorenzo 910, Paraguay
3
Faculty of Agrarian Sciences (FCA), National University of Asunción, San Lorenzo 910, Paraguay
*
Author to whom correspondence should be addressed.
Forests 2022, 13(1), 25; https://doi.org/10.3390/f13010025
Submission received: 3 November 2021 / Revised: 17 December 2021 / Accepted: 21 December 2021 / Published: 24 December 2021
(This article belongs to the Section Forest Ecology and Management)

Abstract

:
Over the past 40 years, Paraguay has lost the majority of its natural forest cover, thus becoming one of the countries with the highest deforestation rates in the world. The rapid expansion of the agricultural frontier, cattle ranching, and illegal logging between 1987 and 2012 resulted in the loss of 27% of original forest cover, equivalent to almost 44,000 km2. Within this context, the present research provides the first yearly analysis of forest cover change in the Paraguayan Chaco between the years 1987 and 2020. Remote sensing data obtained from Landsat images were applied to derive annual forest cover masks and deforestation rates over 34 years. Part of this study is a comprehensive assessment of the effectiveness of protected areas, as well as an analysis of the degree of fragmentation of the forest. All classification results obtained accuracies above 80% and revealed a total forest cover loss of approximately 64,700 km2. Forest clearing within protected areas was not frequent; however, some natural reserves presented losses of up to 25% of their forest cover. Through the consideration of several landscape metrics, this study reveals an onward fragmentation of forest cover, which endangers the natural habitat of numerous species.

1. Introduction

Tropical and subtropical forest ecosystems around the world are immensely important for regulating climate, preserving biological diversity, and balancing biochemical cycles, leading to rising concerns regarding their future and conservation [1,2,3,4]. Twenty-five percent of the carbon in the terrestrial biosphere is contained in tropical forest ecosystems, accounting for more than 33% of net carbon biomass production [1,4,5,6]. However, continuous threats from deforestation and degradation processes have compromised their continuity [4,5,7]. According to Curtis et al. [8], over the last 25 years, almost 125 million ha of forest has been deforested on a global scale. Between the years 2015 and 2020, South America lost more than 15 million ha of forest, becoming the second most deforested region in the world [9]. Historically, numerous studies and institutes have monitored the advance of deforestation based on remote sensing data [7,10,11,12,13,14,15,16,17]. Although forest cover dynamics have been frequently documented in Latin America, most studies focus on the Amazon rainforest, neglecting several neighboring regions that are equally vulnerable [18]. The latest analyses conducted at regional [16] and global scale [7] have identified Paraguay as a hot spot of deforestation. Nevertheless, a scarce number of studies has attempted to characterize the changes in forest cover over time [16]. Within this context, this research aims to provide a comprehensive analysis of the forest cover dynamics in the Paraguayan Chaco region, with a special emphasis on forest conservation. The complete area of the South America Chaco is a subtropical forest region that stretches across Argentina (62.19%), Paraguay (25.43%), and Bolivia (11.61%) and into Brazil (0.77%), comprising a total area of 1,066,000 km2 [16]. The eco-region comprises high levels of biodiversity, hosting over 34,000 plant species, 500 birds, 150 mammals, and 220 reptiles and amphibians. Furthermore, the Gran Chaco contains a variety of ecosystems, including savannas, grasslands, wetlands, and one of the largest dry forests in the world [19]. Prior to 1987, much of the original Paraguayan Chaco natural dry forest remained undisturbed, covering more than 78% (almost 18,900 km2) of the western region of the country. However, by the year 2012, the rapid expansion of the agriculture frontier, in particular cattle-ranching activities, had resulted in the loss of more than 27% of the original forest cover [16].
Regardless of the existence of several deforestation reports from national (e.g., National Forest Service (INFONA), Guyra, Paraguay) and international organizations (e.g., Food and Agriculture Organization (FAO) of the United Nations, the World Wildlife Fund (WWF), and the United States Agency for International Development (USAID)), only a handful of scientific studies has considered a systematic analysis of the changes in the Paraguayan Chaco forest [16]. For instance, Baumann et al. [16], Mereles and Rodas [20] and Caldas et al. [21] applied MODIS and Landsat images acquired between 1987 and 2014 in order to analyze variations in the forest cover. Nevertheless, these articles mainly focused on understating deforestation processes through coarse temporal resolutions, whereas changes on annual bases remain understudied. De La Sancha et al. [17], on the other hand, analyzed the embeddedness of the Gran Chaco forest by incorporating connectivity metrics based on a two-stage temporal analysis between 2000 and 2019. However, the study neither generated its own forest mask nor considered well-known statistical metrics to provide a comprehensive analysis of the fragmentation levels. Therefore, the objectives of this research are to:
  • evaluate annual forest cover changes of the Paraguayan Chaco between 1987 and 2020;
  • study the effectiveness of protected areas and natural reserves;
  • evaluate the degree of fragmentation of the Paraguayan Chaco, with a special emphasis on forest conservation

2. Materials and Methods
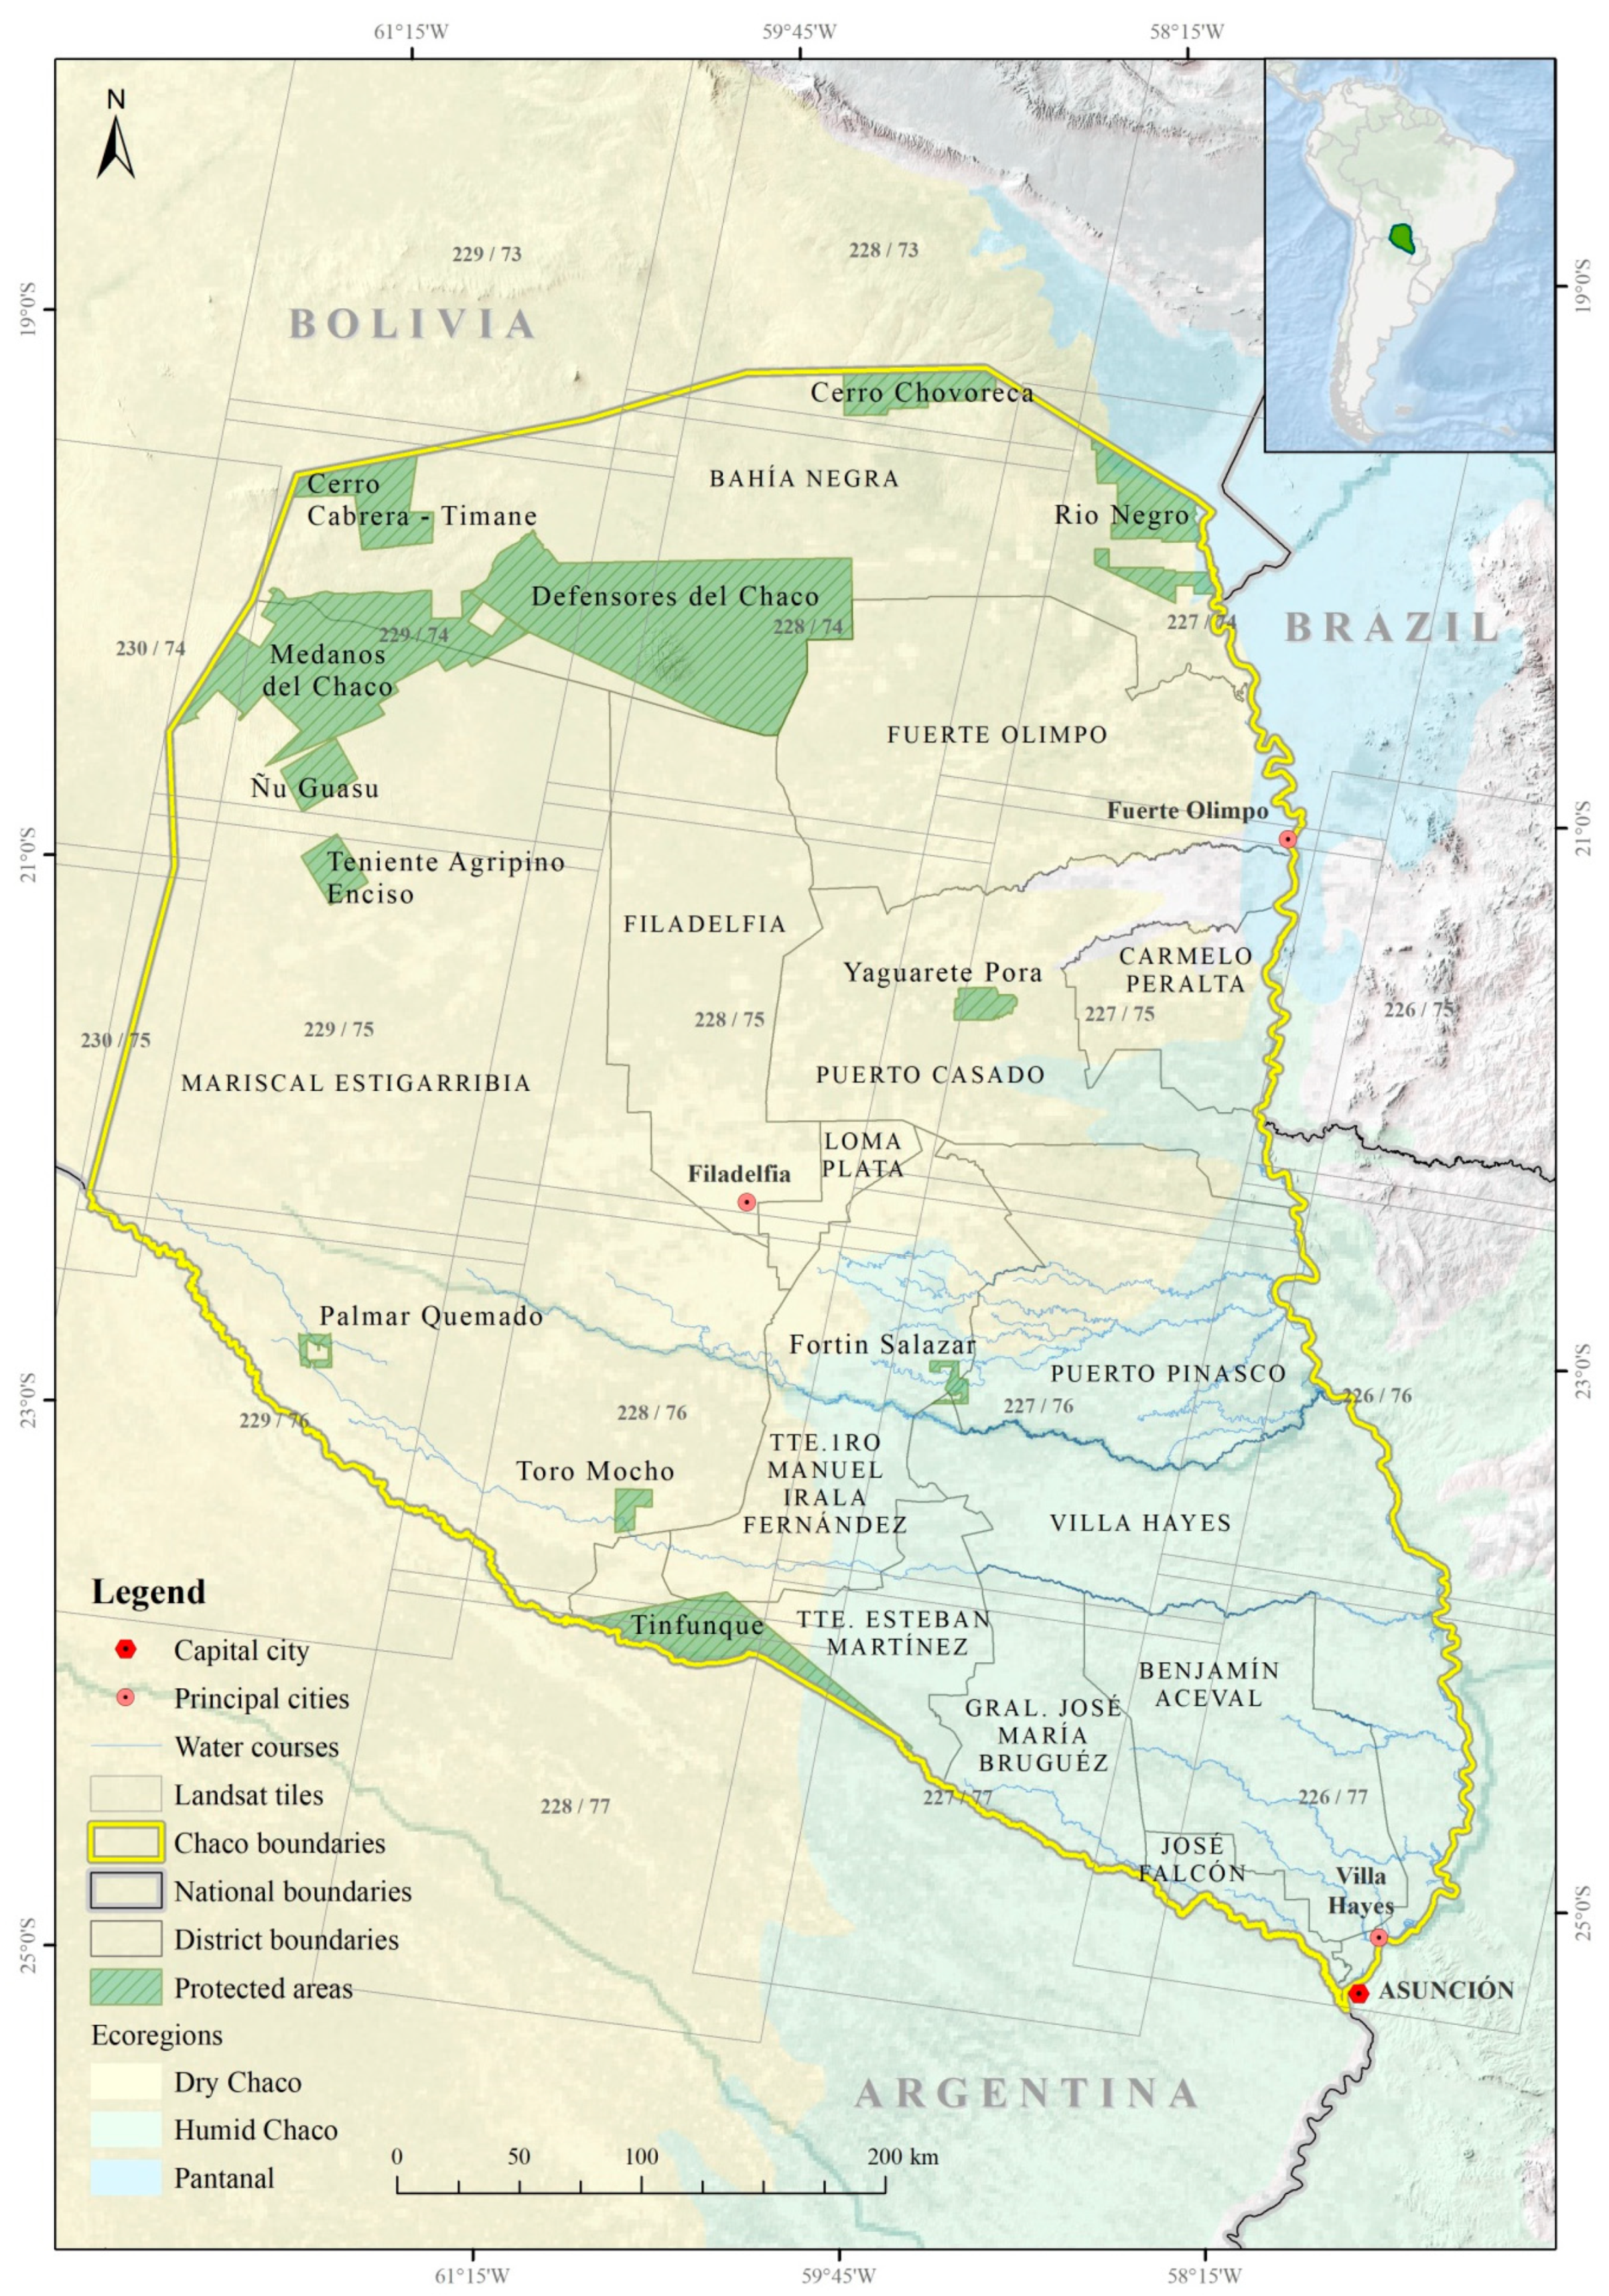
2.1. Study Area

The present study was conducted in the Paraguayan Chaco (see Figure 1), located in the western region of Paraguay. It is divided into three departments and 14 districts, with a total surface area of approximately 250,000 km2, constituting over 60% of the whole of Paraguay [17,21]. The biological richness of the Paraguayan Chaco is distributed among five main eco-regions: Dry Chaco, Humid Chaco, Medanos (continental sand dunes), Pantanal, and Cerrado [20]. The vegetation of the region is characterized by a mosaic of vegetation types composed by woodlands and dry forest (xerophilous to subxerophilous forests), combined with riparian vegetation, savannas, and grasslands [20].
More specifically, vegetation develops within the context of the climate; denser woodland areas occur in regions with precipitation ranging between 800 and 1300 mm/year, while scrublands with different densities appear where the precipitation is below 800 mm/year [20]. The climate is characterized as being extremely warm in summer and mild in winter, with scarce precipitation [22]. Due to the occurrence of significant thermal amplitude, the average temperature during the summer season normally over exceeds 50 °C. [22]. Despite the vast ecological richness and extent of the Chaco, less than 5% of the Paraguayan population is located in the region; these populations are comprised mainly by the indigenous peoples of various ethnic groups, followed by Mennonite immigrants, who first settled in the region during the 1920s [19,20]. Poor soil conditions, extended dry seasons, and floods have delayed potential economic growth over the last decades. Nevertheless, in recent years, the Paraguayan Chaco has steadily gained relevance in international agricultural markets [16].
Cattle-ranching activities have increased in the area, becoming one of the country’s economic backbones. Rising meat prices worldwide have generated a higher demand for pasture cultivation. Artificial pastures have continuously replaced natural vegetation, increasing the fragmentation of the forest in the Paraguayan Chaco [16,20]. The fragmentation of natural ecosystems in the Paraguayan Chaco has severely diminished the wildlife habitat in the region [16,17]. In fact, the reduction in the habitat and fragmentation process are separate phenomena that, nonetheless, occur simultaneously [21]. The pressure of anthropological activities on natural areas means that pristine habitats are being reduced in size and that the last remnants of forest are being turned into isolated islands. This endangers biodiversity as the possibility to move between reserves gradually declines. [17]. Between the years 2000 and 2019, more than 29% of natural forest cover was lost [17]. Species such as the Panthera onca (less than 300 species remain in the area), the Chacoan peccary (Catagonus wagneri), and the Maned wolf (Chrysocyon brachyurus) are currently close to extinction, without proper management regimes to ensure the preservation of the reaming population [20].

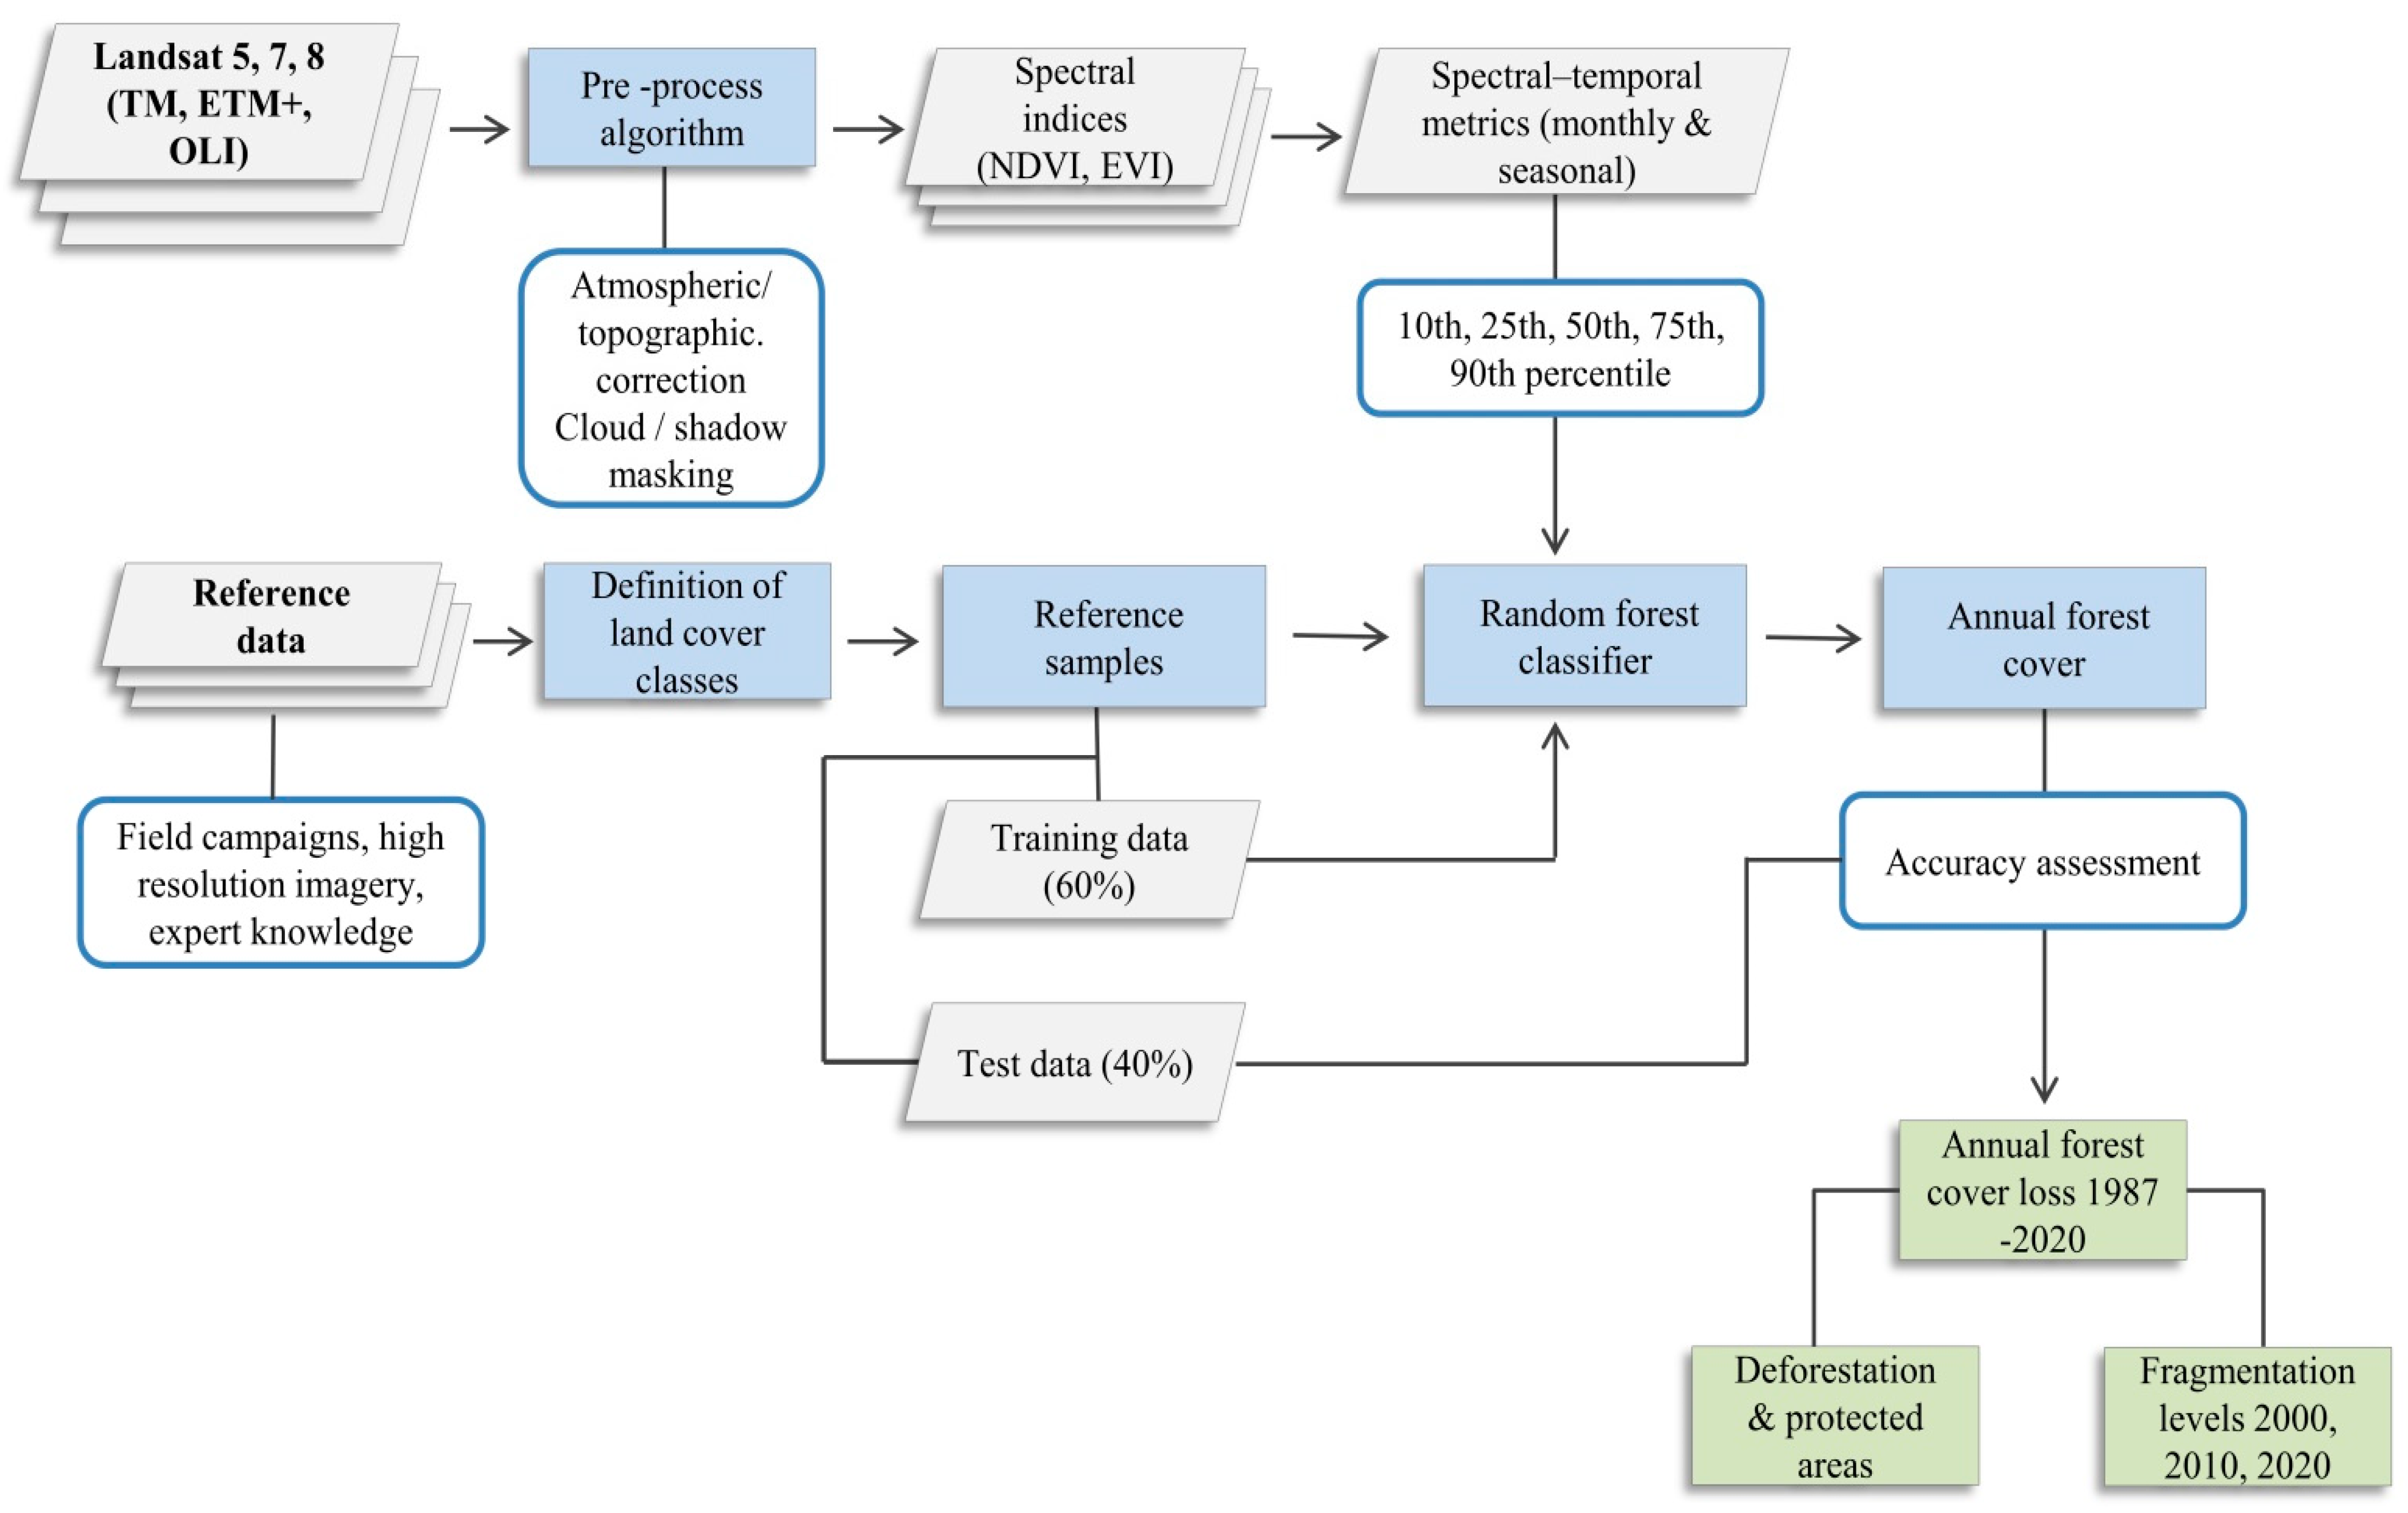
2.2. Image Acquisition and Pre-Processing

For this study, Landsat 5 (L5) Thematic Mapper (TM), Landsat 7 (L7) Enhanced Thematic Mapper Plus (ETM+), and Landsat 8 (L8) Operational Land Imager (OLI) data were obtained between the reference years of 1987 and 2020. Landsat images were selected for this research, taking into consideration the high temporal and spatial resolution of the Landsat sensor. A total of 11,880 terrain-corrected (L1T) images (L5–8625 images, L7–6019 images and L8–2797 images) with cloud cover ranging between 30 and 50% were obtained from the Unites Stated Geological Survey (USGS) archives. The L1T processing level delivers high methodological, geometric, and radiometric precision by incorporating ground-control points and integrating digital elevation models (DEM) for topographic corrections [23]. Similarly to Da Ponte et al. [23] and Wohlfart et al. [24], each Landsat scene was atmospherically corrected by converting the original digital-number (DN) values in order to obtain physically comparable surface reflectance while also integrating topographic (elevation and slope) information from the shuttle radar topography mission (SRTM) (see Figure 2). Furthermore, resembling Knauer et al. [25] and Gebhardt et al. [11], clouds and cloud shadows were detected and masked from Landsat images, considering the spectral and textural features through probabilistic scores [26]. Since the Landsat scenes were processed at the 1T level, no additional geometric rectification was required.

2.3. Spectral-Temporal Landsat Time-Series Metrics

The application of continuous spectral-temporal metrics has been broadly used as a reliable approach for separating land cover/use classes [7,15,27,28], as well as for solving problems related to data gaps (e.g., as a consequence of clouds). A vast number of spectral-temporal metrics were calculated from annual cloud- and cloud-shadow-free Landsat image stacks, characterizing main land-cover classes based on the most relevant spectral information. The process follows the methodology described by Da Ponte et al. [23] and Wohlfart et al. [24]. For this study, several statistical image metrics were estimated (percentiles 10, 25, 50, 75, and 90%) from Landsat (TM, ETM+ and OLI) observations, considering each reflectance value of the five bands (blue, green, red, near-infrared, and short-wave infrared). Percentiles of 0% (min value) and 100% (max value) were omitted to decrease any noise and further outliers. For every band, the percentile differences (90% minus 10% and 75% minus 25%) were calculated as well. In addition, the percentiles from the normalized vegetation index (NDVI), enhanced vegetation index (EVI), and normalized water index (NDWI) were computed [24]. Overall, a total of 58 multi-temporal spectral features were considered as input variables for the classification models.

2.4. Estimation of Annual Forest Cover between 1987 and 2020

For each reference year between 1987 and 2020, forest/non–forest maps were obtained by employing a random forest (RF) classifier [29] in order to generate annual thematic-change maps based on multi-temporal spectral metrics (see Figure 2). For every reference year, training samples were randomly distributed over the entire Paraguayan Chaco area, totaling a set of at least 100 training points for each of the 8 land-use land-cover classes: forest, water bodies, artificial grasslands, dry savannas, flooded savannas, marshlands, wetlands, and urban areas.
Both training and validation samples were evenly dispersed over the study area in order to obtain the most representative coverage of the land cover/use of the Paraguayan Chaco. Following the proceedings of Da Ponte et al. [23], visual interpretation of high-resolution images (obtained from Google Earth historical archives between 1987 and 2020) was conducted in order to define the classes of training and validation samples. In addition to visual interpretation, the knowledge of local experts in the area, as well as the forest mask from 1986 generated by the Paraguayan National Forest Institute (INFONA), was considered.
The RF classification algorithm has been extensively used for land-cover mapping due to its good performance, user friendliness, and computational competence [30,31]. The RF classifier is a decision-tree algorithm that randomly selects subsets of learning samples and variables to generate multiple (standard value of 500) independent decision trees. Such models were built and tailored by applying the RF package of the statistical software R (version 4.1.1) [32]. The pixelwise classification approach incorporates a majority rule of combined decision trees to identify the final category. In this study, 500 independent RF models were built for each reference year, resulting in a total of 34 models.
Standard values for the mrty parameters were applied, which is frequently p , where p represents the number of predictors in the data set. The RF models were trained with 60% of the reference data sets, and the remaining 40% of the samples were incorporated as a validation set. The quality of each classified image was depicted through overall accuracy, producer’s and user’s accuracy, and the Kappa coefficient resulting from the error matrix [33]. Similarly to Baumann et al. [16], confidence intervals were also estimated at 95% for each annual forest map.
Subsequently, a binary forest and non-forest mask was created by grouping all classes except for the forest class into a single uniform, non-forest class. Considering the forest definition established by FAO [2], forest patches with areas smaller than 0.5 ha were excluded from the analysis. In order to study long-term differences of forest cover in protected areas, a bitemporal analysis was conducted comparing forest-classification results of the periods between 2000 and 2020. Most of the protected areas were established around the year 2000; therefore, forest cover between the years 1987 and 1999 was not considered for the assessment of the effectiveness of protected areas. Moreover, only large, continuous forest blocks (>100 km2) are capable of enduring environmental changes while maintaining the integrity of so-called umbrella species [34]. As a result, forest cover change inside protected areas was exclusively estimated for natural reserves with areas larger than 100 km2, which resembles the minimum area required to ensure the continuity of large mammals (e.g., puma (Puma concolor) and jaguar (Panthera onca)) [35]. Studies from Da Ponte et al. [34] and Huang et al. [36] revealed that changes in the forest cover due to anthropological activities increased when approaching the boundaries of protected areas, thus comprising the integrity of the forest by leaving large, intermittent patches. In order to investigate such tendencies, forest cover loss was additionally estimated within three buffer zones of increasing distance (5 km, 10 km, 15 km) from the conservation-area borders.

2.5. Fragmentation Analysis

Forest fragmentation was studied by applying a set of well-known statistical metrics for landscape analyses. Additional information regarding the calculated metrics, the addressed ecological topics, and further definitions can be found in [37] and Table A1. The calculations were conducted by applying the vector-based landscape-analysis tools (V-Late 2.0), an ArcGIS extension created by Lang and Tide [38], which, in turn, is derived from the FGRASTATS software [37]. The FRAGSTATS program is regularly applied to analyze spatial trends and quantify landscape structure at three main levels: landscape, patch, and class level.
Since this study solely aims to provide a detailed understanding of the forest landscape, consideration at the class level is not necessary, and fragmentation analysis was addressed only at landscape and patch levels. Similarly to the protected-areas analysis, forest fragmentation was only assessed for the years 2000, 2010, and 2020. According to previous studies, changes in the Paraguayan Chaco forest cover were less prominent between the years 1987 and 1999 [16,20,21].
First, structural changes in the forest cover were analyzed on a landscape level to clarify the main effects of deforestation on forest fragmentation. The landscape-level metrics permit consideration of all patches within each forest mask in order to characterize intrinsic patterns in regards their distribution, composition, and configuration of the patches over the complete landscape [37]. At the landscape level, core-area metrics were assessed as a mean to characterize the most relevant forest patches in terms of biodiversity preservation. According to studies such as that by Broadbent et al. [39], numerous animal species evade bordering areas and prefer to remain inside the forest instead. For estimation of the core area, a search distance of 500 m to the border was selected. Fragmentation metrics, on the other hand, were estimated to identify both extremely fragmented and highly compacted areas, while the level of aggregation of patches was estimated trough subdivision metrics.
Changes in the forest structure that occurred in the boundaries of the patches were assessed by applying edge metrics; increments in edge effects result in higher biodiversity levels [34]. In a second step, fragmentation of the forest cover was studied on the patch level. The patch-level metrics describe the spatial characteristics and the context of patches, such as size, perimeter, and shape [37]. Additionally, a neighborhood assessment (at patch and landscape level) was conducted to recognize forest patches with respect to their embeddedness in the complete fragmented forest area. The obtained information permits identification of potential biological corridors in order to allow for movement and dispersion among species. Similarly to Da Ponte et al. [34], the proximity index was estimated for all patches, with a search radius of 100 m. The proximity index not only considers the distance to the closest neighboring patch but the sizes and distances of all adjacent patches within the search distance as well [40]. Similarly to previous studies conducted in the Paraguay for the entire fragmentation analysis, only patches larger than 10 ha were considered [34,41].

3. Results

3.1. Forest-Mask Classification Accuracy

In general, classification accuracy values obtained from Landsat between the years 1987 and 2020 fluctuated from 85 to 99%, with Kappa coefficients ranging from 0.71 to 0.99 (see Table 1). The combination of Landsat 5 and 7 data sets presented the highest value for overall maximum accuracy, of which over 99.7% of the pixels were correctly classified as forest. On the contrary, the lowest overall accuracy values were achieved in the Landsat 8 data sets, obtaining minimum values of 85%. Variations in the accuracies achieved could be attributed to the high spectral resemblances among the classes of forest areas, crops fields (e.g., artificial pastures), and natural vegetation (e.g., savannas and shrublands), in addition to the quality of Landsat scenes (e.g., high proportion of cloud cover). Additional information concerning accuracies can be found in Table A2.

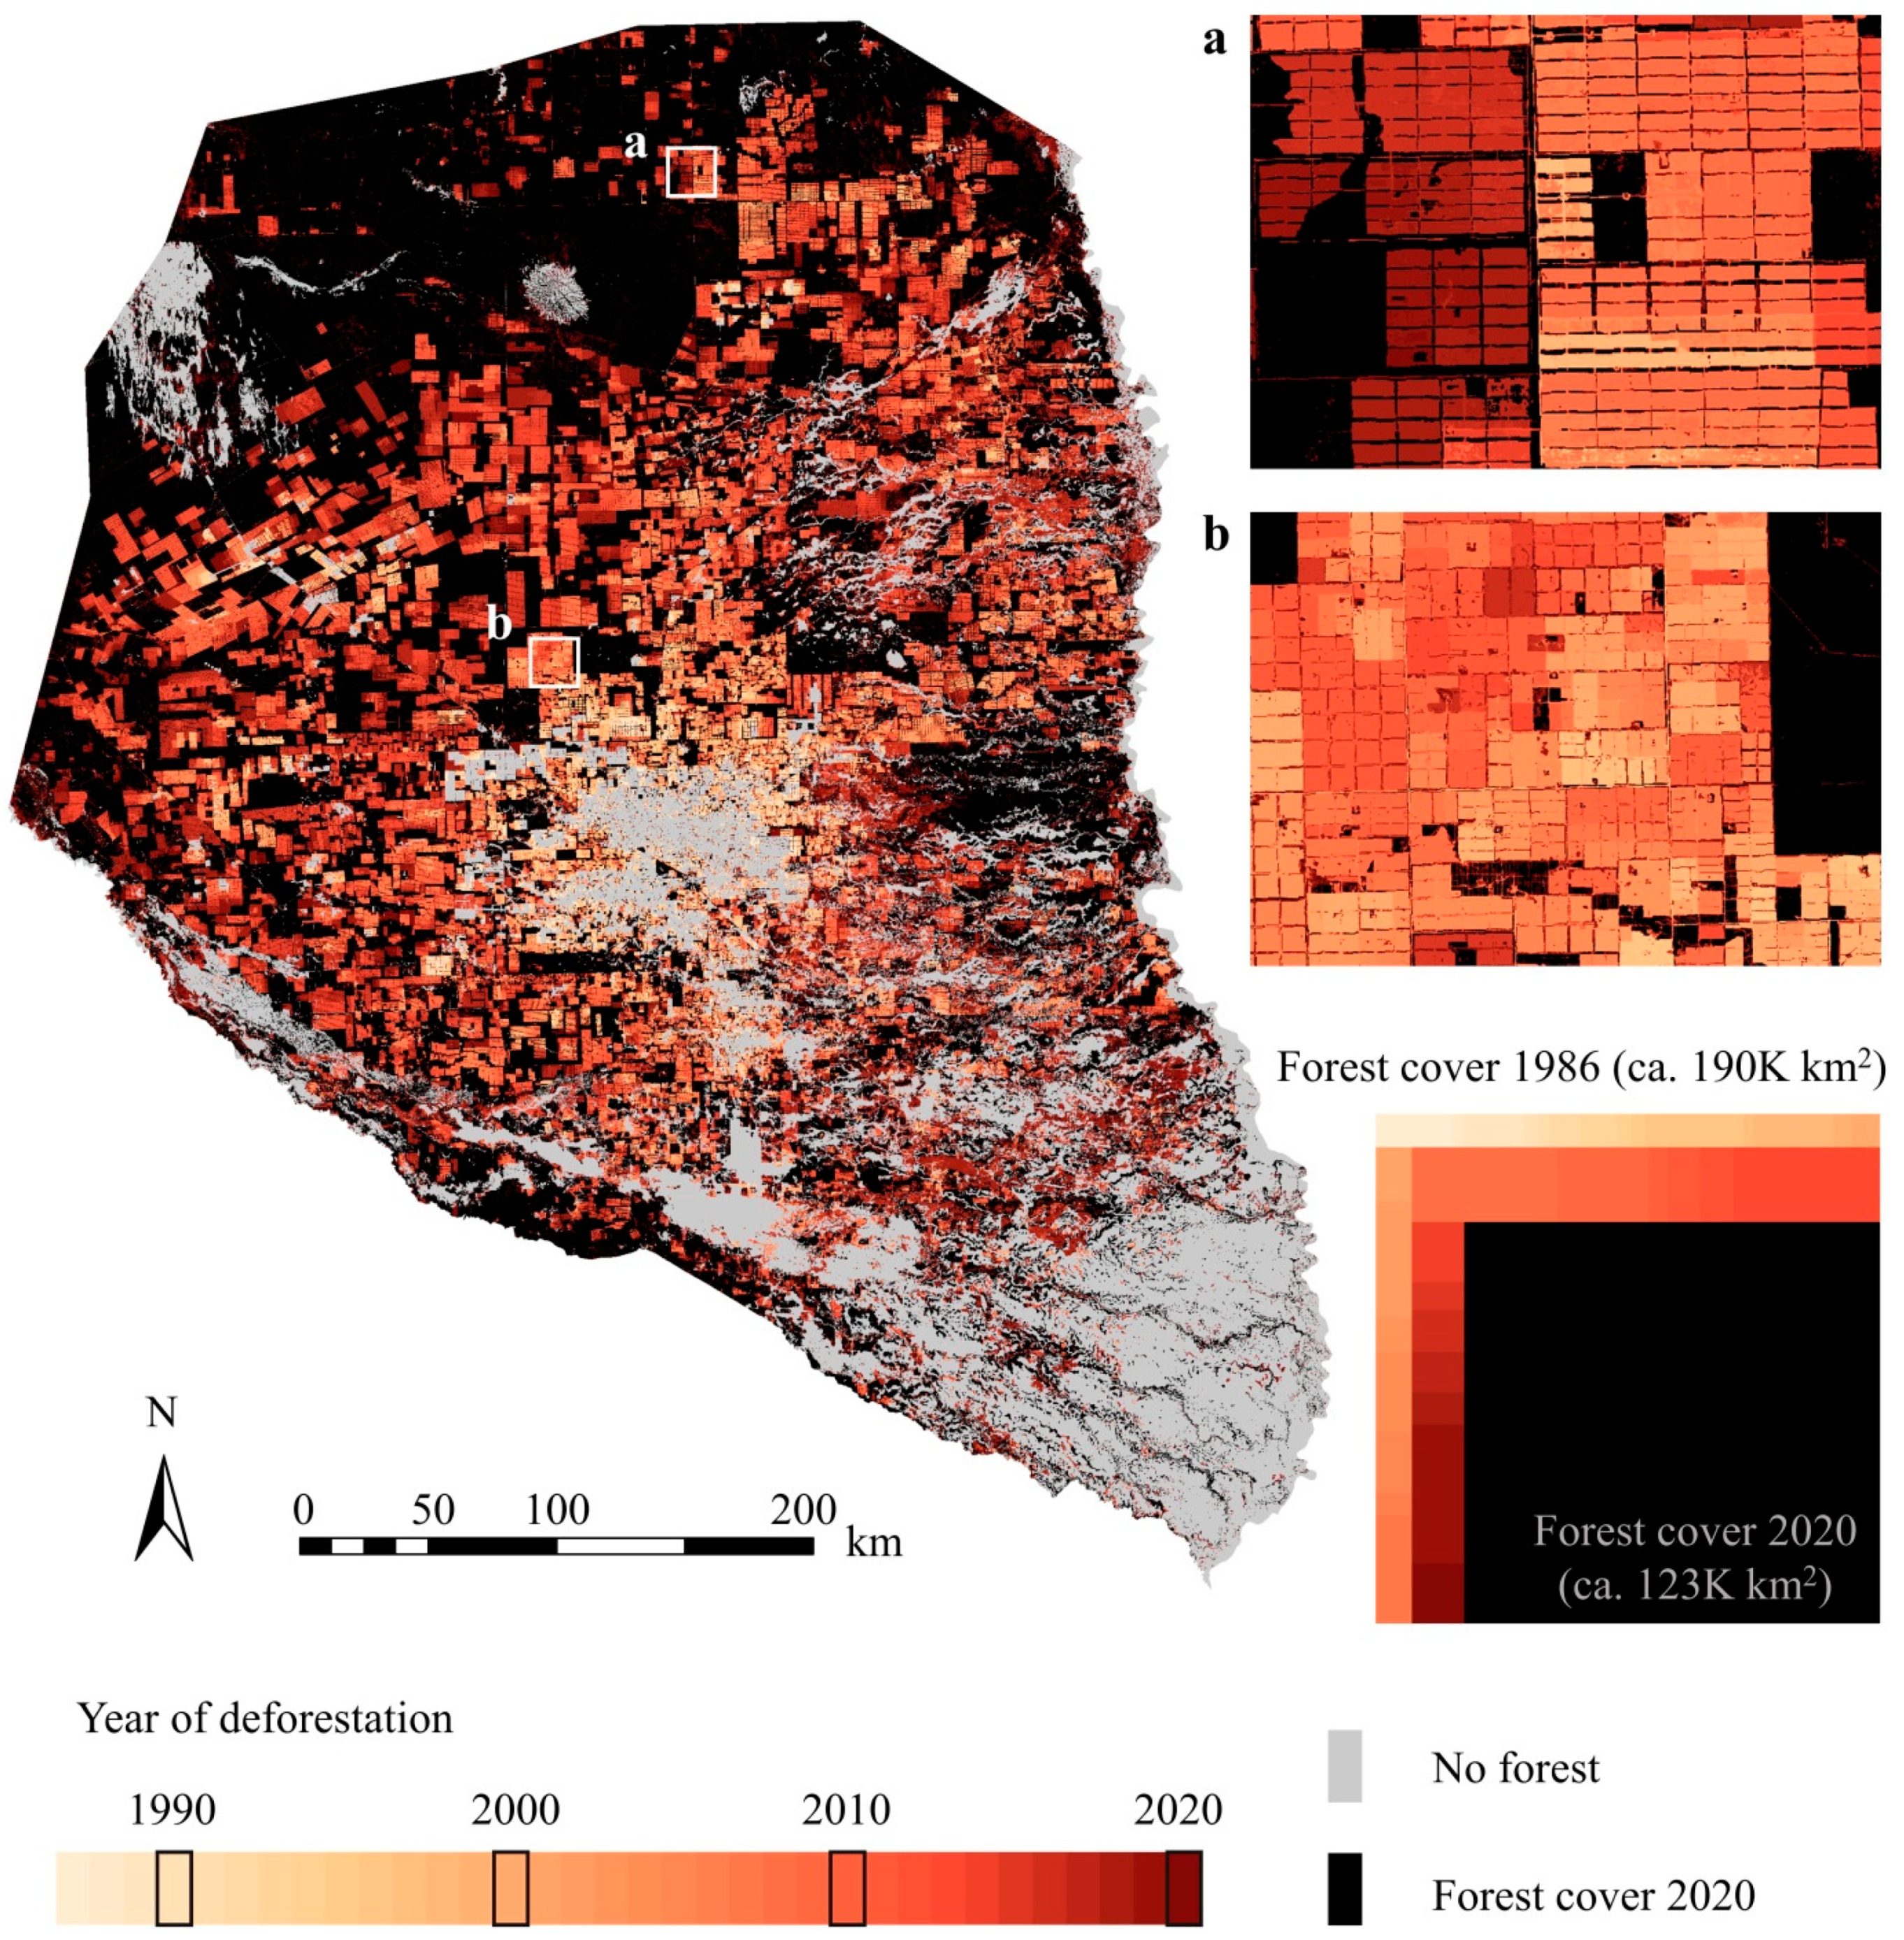
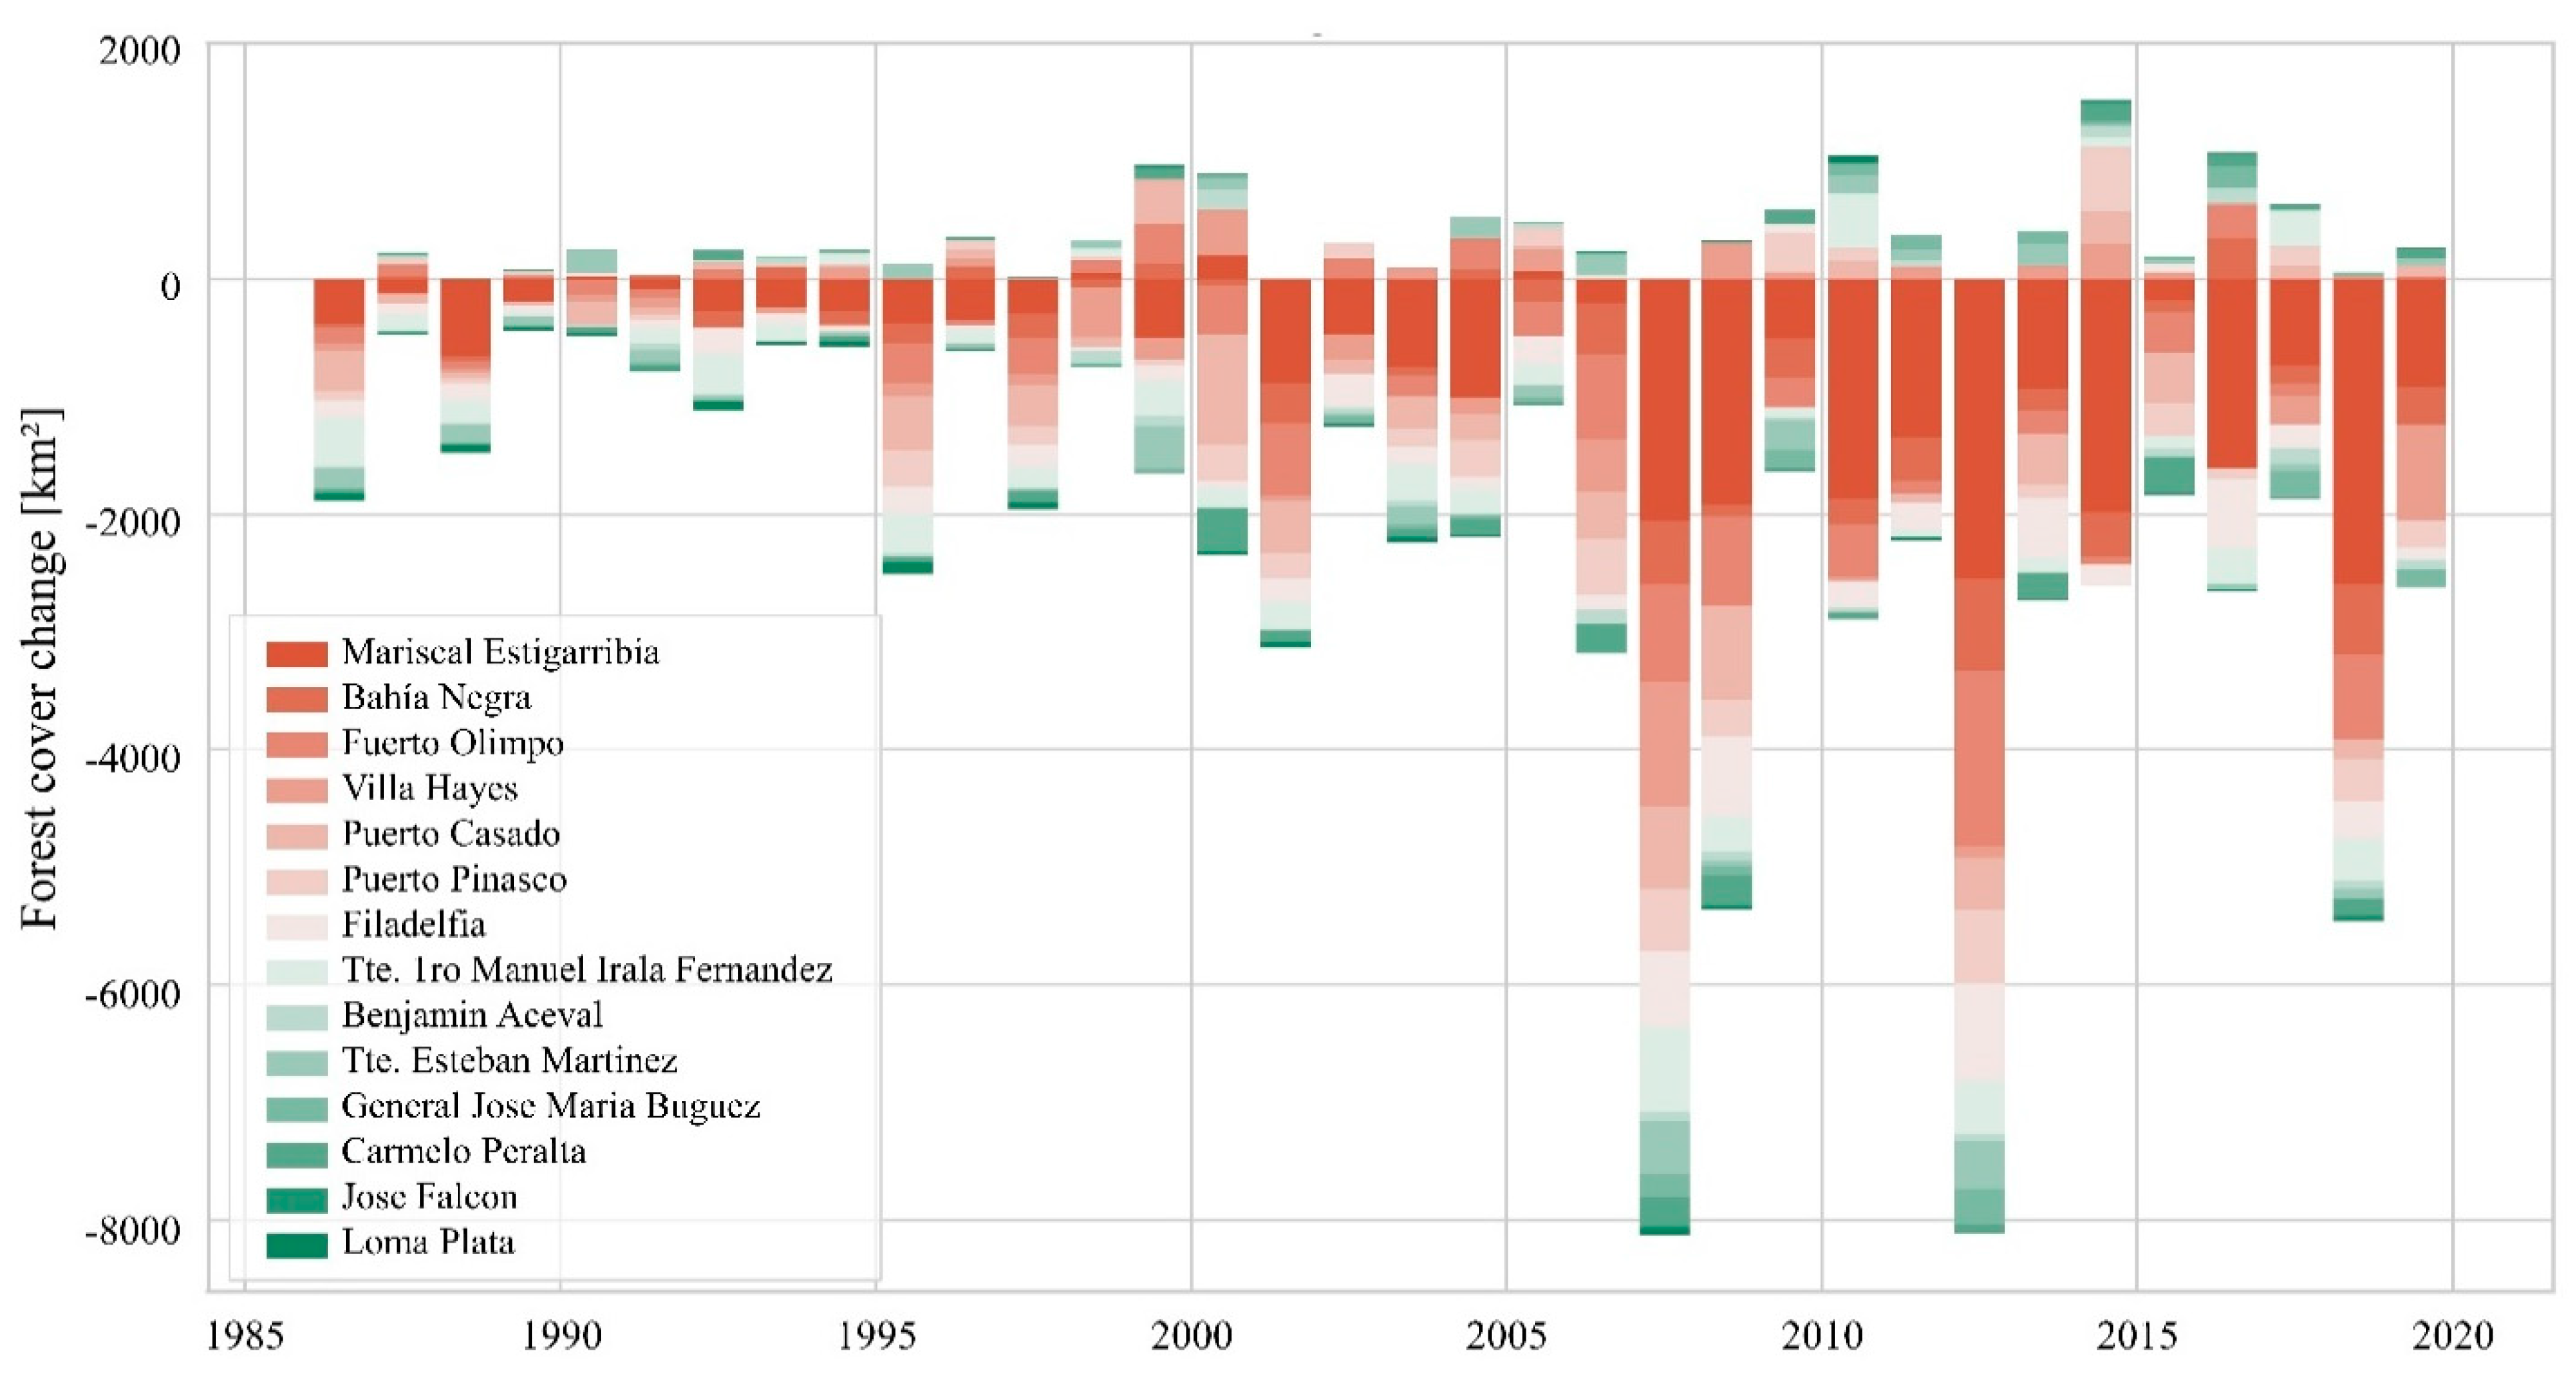
3.2. Deforestation Rates

In the year 1987, almost 78% (188,000 km2) of the Paraguayan Chaco region was covered by forest evenly distributed all over the western part of the country (Figure 3).
Trends in Figure 4 exhibit an increasing deforestation tendency throughout the study period. Between 1987 and 1995, approximately 820 km2 of forest was lost every year, which corresponds to an annual deforestation rate of 0.4% of the 1987 forest cover. Within the following 12 years, until 2007, the speed at which the forest was cut down doubled, reaching an annual deforestation of 1550 km2 (0.8%). This trend of an increasing speed of deforestation continues. In 2008, deforestation activities increased abruptly, resulting in a forest loss of 8100 km2 within only one year. The results in Figure 4 display an increasing deforestation rate over the subsequent years, with major increments in 2013 and 2019 comprising 8100 km2 and 5400 km2 of forest cover loss, respectively. Consideration of the annual forest loss between 2008 and 2020 reveals another duplication of the deforestation rate. In those 13 years, a yearly loss of 3200 km2 (1.7%) can be observed. The district of Mariscal Estigarribia, which is also the largest of all 14 districts, presented the highest forest loss over the 34 years of study. The district comprised more than 38% (25,900 km2) of the total area deforested, depleting at an annual rate of 1.2%. Furthermore, deforestation activities in Mariscal Estigarribia became more prominent between the years 2008 and 2020, with a drastically increased increment in 2013 and 2019, showing more than 2500 km2 of forest loss each year. However, there are smaller districts with much higher deforestation rates, e.g., Fuerte Olimpo (1.2%), Filadelfia (1.6%), Manuel Irala Fernández (1.6%), and Loma Plata (2.4%). Fuerte Olimpo and Filadelfia, together, account for 21% (14,300 km2) of the total area deforested.
The districts of José Falcón and Bahía Negra, on the contrary, exhibited the lowest deforestation rates, with less than 0.5% annual forest loss compared to 1987. Nevertheless, the two districts together account for 8% (5100 km2) of the total loss. The largest forest loss increments of approximately 400 km2 or more were observed in the districts of Villa Hayes, Manuel Irala Fernández, and Puerto Pinasco, particularly for the years 2001, 2011, and 2015.
With respect to the status of the protected areas (see Figure 5), overall results reveal two main findings. First, forest loss occurring inside the boundaries of protected areas comprised only 1% (550 km2) of the total area deforested in the Paraguayan Chaco for the period between 2000 and 2020. However, when comparing deforestation among protected areas, the reserves of Toro Mocho, Tinfunqué, Río Negro, and Fortin Salazar displayed a forest clearing of 25% (24 km2), 16% (268 km2), 15% (197 km2), and 14% (9 km2) of the 2000 forest cover, respectively.
Second, for most of the protected areas, forest cover loss tends to increase drastically outside the boundaries of protected areas, with rates varying between 8% and 60%. Furthermore, overall results show a slight gradient of clear forest with larger distances from the protected areas. For instance, the reserves of Palmar Quemado, Yaguareté Porá, Cerro Chovoreca, and Defensores del Chaco barely show forest clearing within their boundaries. Nevertheless, drastic forest loss increases in the 5 km buffer zone saw almost 67% (166 km2), 9% (32 km2), 12% (55 km2), and 17% (605 km2) of the forest cleared, correspondingly.

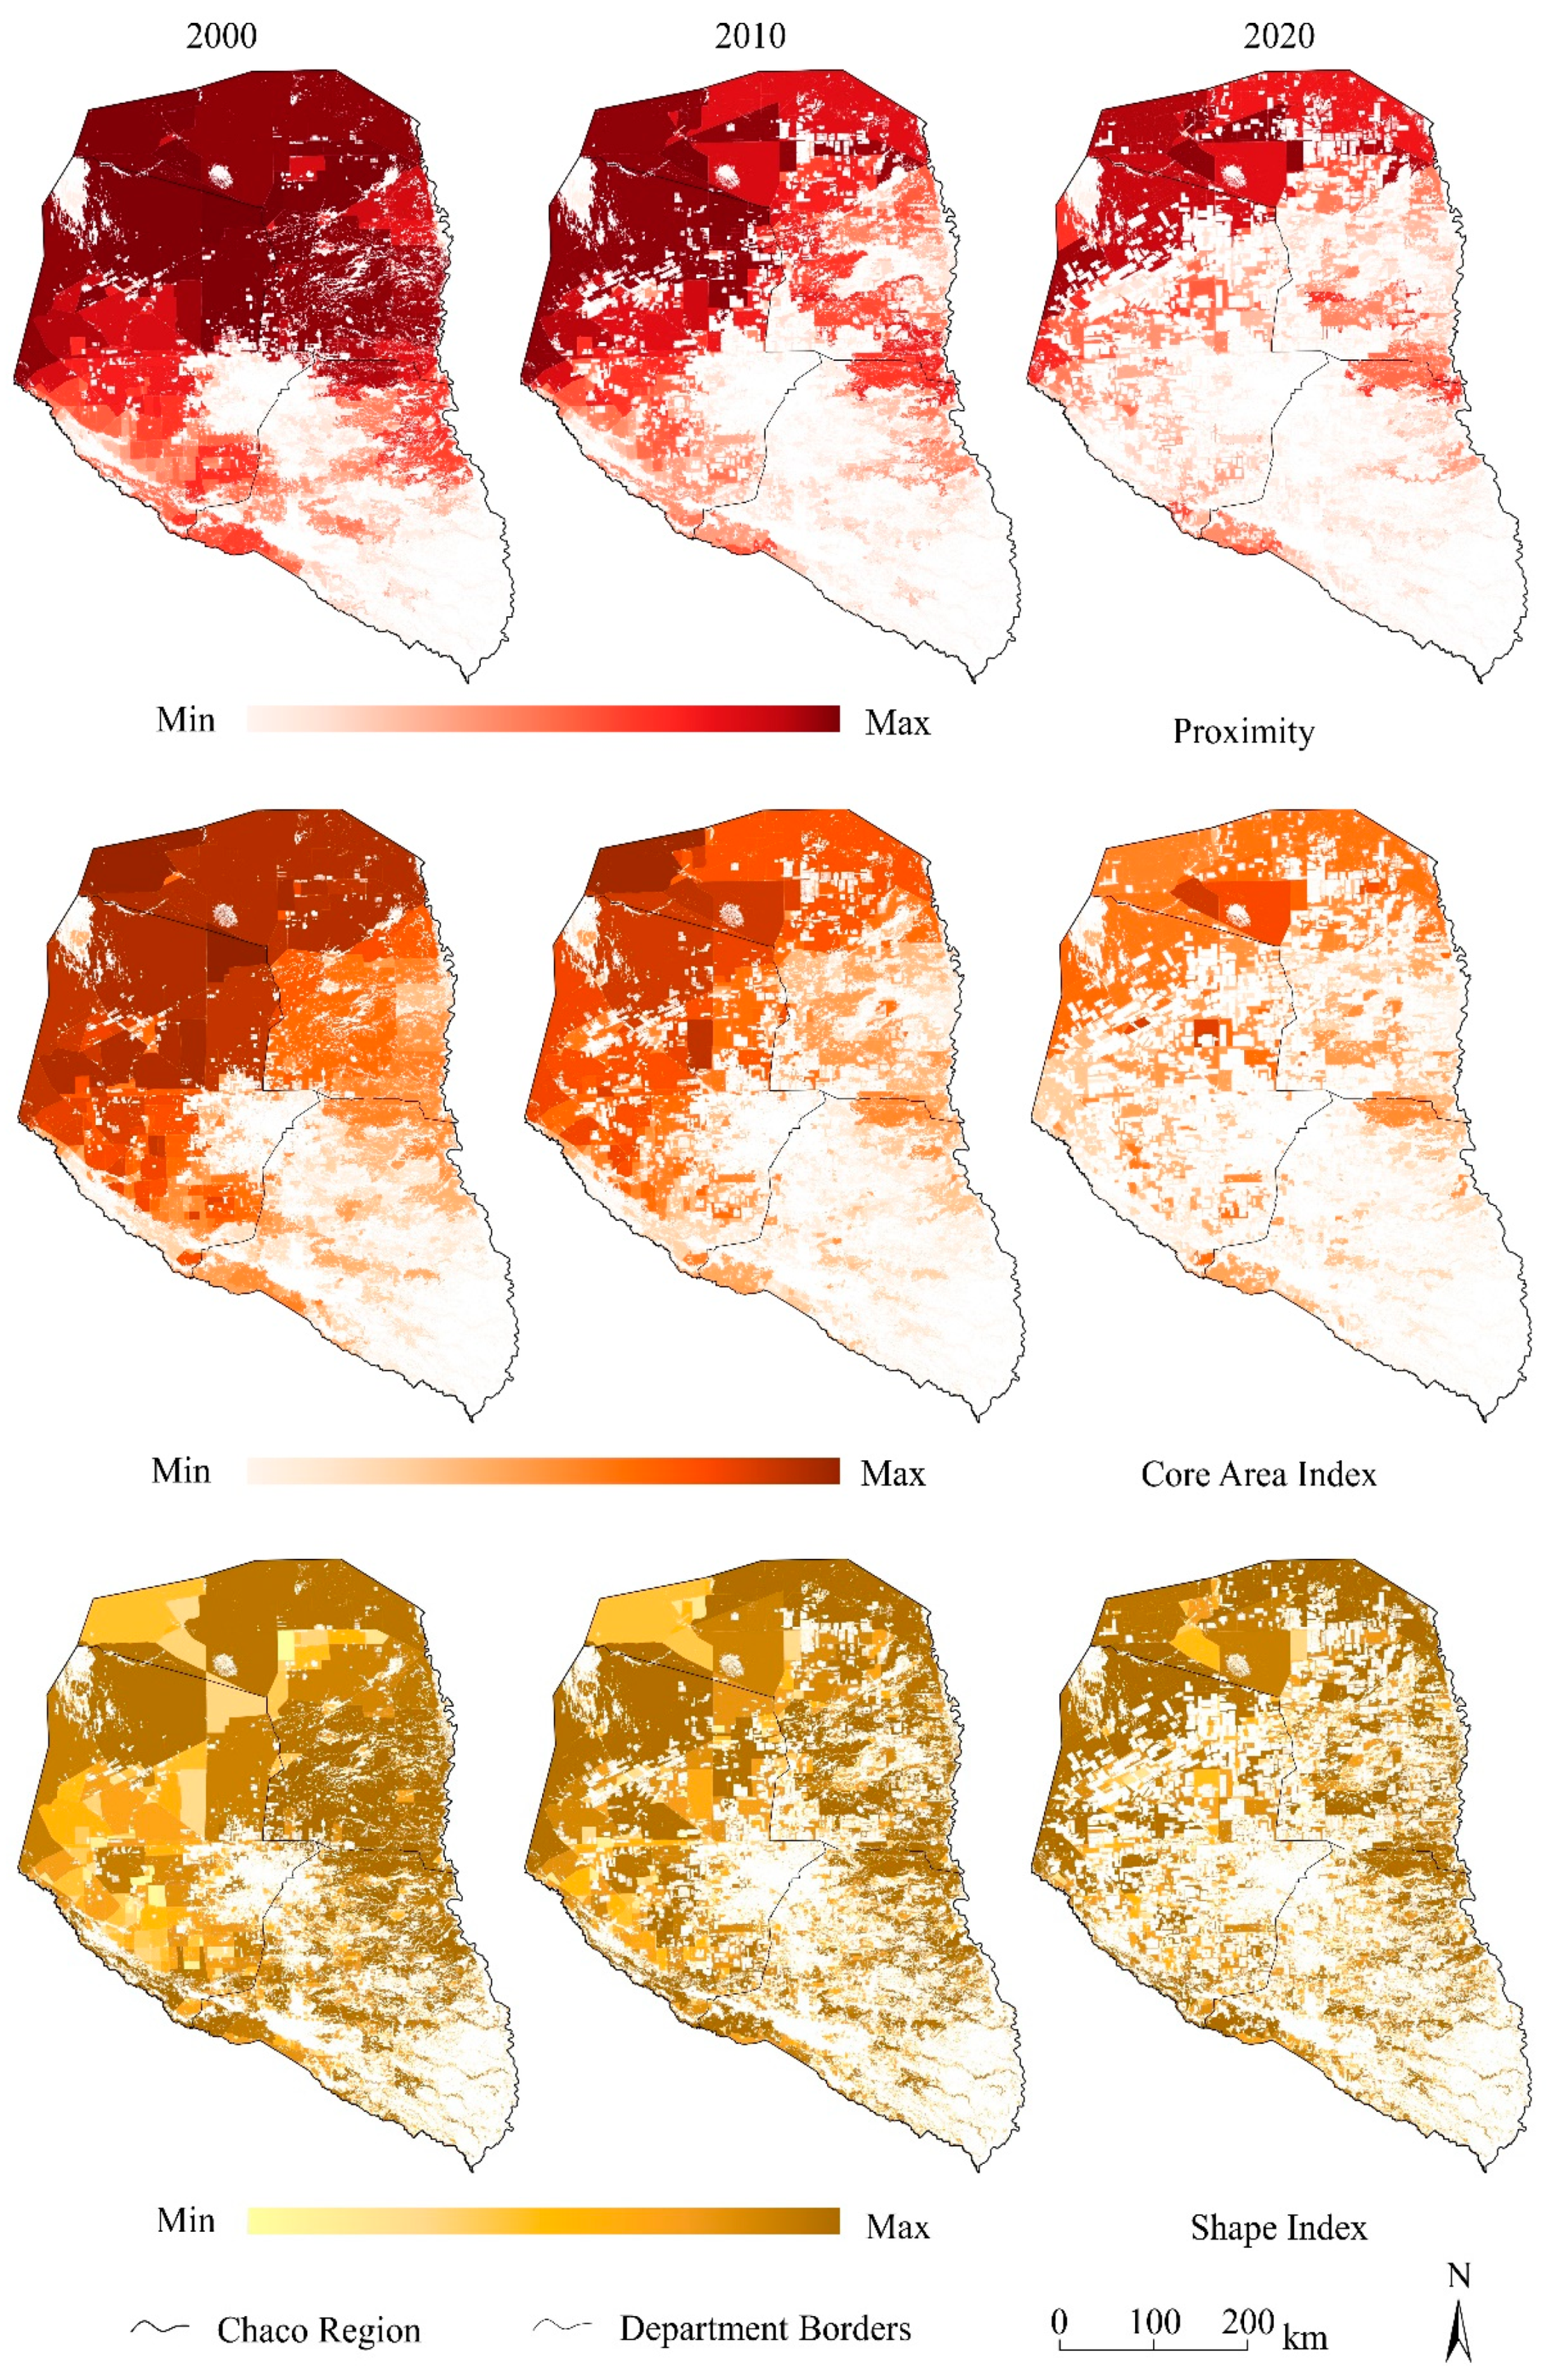
3.3. Forest Fragmentation

Analysis of the forest fragmentation was conducted both on a landscape and on a patch level. Figure 6 gives an overview over all landscape metrics estimated for the Paraguayan Chaco region. The most evident driver for fragmentation of continuous forests is its forest cover loss. In the period from 2000 to 2020, the total area covered by forest significantly decreased. In the first 10 years, about 28,100 km2 of forest was lost, and by the end of 2020, another 28,700 km2 had been cleared. The lower resulting total loss is due to the inclusion of forest areas of at least 10 ha. This loss is accompanied by a clear decrease in the core area and a doubling of the number of patches (12,010 in 2000 to 23,228 patches in 2020). Similarly to the total number of patches, also the number of patches with a core area doubled in the 20 years studied. However, this does not imply that the condition of the fragments is better in 2020 compared to 2000. The mean size of a forest patch decreased from 14 km2 in 2000 to 5 km2 in 2020, and the total core area was reduced by more than 60%, from 112,800 km2 in 2000 to only 43,800 km2 remaining in 2020.
As fragmentation worsens, the number of patches increases, but these fragments have a smaller areas, which consequently results in smaller core areas. However, the decline in core area is not proportional to the decline in forest area, which can also be seen in the development of the core area index, giving the mean proportion of core area to total forest cover.
While in 2000, 64% of the total forest cover was in the core area, this share fell to 52% in 2010. Furthermore, in 2020, the core area accounted for only 37% of the forest area. Total edge and edge density are two further parameters that are well-suited to characterize the landscape structure. It can be observed that the total border of all forest patches increased from 310,300 km in 2000 to 433,200 km in 2020, while the border length of an average forest patch decreased at the same time. The combination of a decreasing forest cover and mean patch edge and the simultaneously increasing total edge length emphasizes advancing fragmentation.
Division, split, and mesh size, together, describe the subdivision of the landscape, and all three indicate that fragmentation has increased, in particular between 2000 and 2010 but also in the following ten years. In 2000, 30 patches, each with a size of almost 6000 km2, were sufficient to characterize the division of the landscape. In 2020, 45 patches with a size of approximately 2600 km2 were needed. Proximity index measures the connectivity between neighboring forest patches, which is especially important for a variety of animal species. Large patches close to one another show a high proximity and form a continuous landscape, whereas a smaller size of forest patches or a larger distance have a negative effect on this index. During the study period, this index has also declined, which is consistent with the progressive fragmentation shown in all previously mentioned parameters. It is striking that a clear trend is emerging across all metrics, as there is no metric that shows a contrary development between 2000 and 2010 and between 2010 and 2020. Regarding some of the metrics (e.g., mean patch edge, number of patches, split, proximity), it seems like the negative trend is slightly slowing down because these metrics show larger changes in the first study period than in the second study period. On the other hand, the total loss of forest area has increased in that time. This suggests that even though in the period between 2010 and 2020, more forest was destroyed, it affected the continuity of the forest stand less than the deforestation between 2000 and 2010. Figure 7 shows the spatiotemporal evolution of proximity, core area, and forest shapes on a patch level.
We see that large parts of the Paraguayan Chaco, especially the north, are continuously covered by forest in 2000. Only towards the south and in the center, around the city of Filadelfia, are there larger areas without forest. In the period from 2000 to 2010, the deforestation continued to spread, mostly from the center, while in the following 10 years, the deforestation pattern became more diffuse. Large parts of the Paraguayan Chaco became crisscrossed by deforested areas. Only the northern part can still be consider a contiguous forest stand. Nevertheless, it can also be observed in the north that both proximity and core area index decreased sharply. In the decade between 2000 and 2010, many new roads were built in the northern and northeastern part of the study area. This encroachment on nature is directly reflected in the decreasing proximity in these areas. The red coloring in Figure 7, indicating proximity becomes lighter in 2010 in many parts of the area, and newly created patches are visible (northern region).
Patches with a large proportion of core area have disappeared in the 20 years of study, leaving only one region with a large core area index in the north (72–80%). This region is the Defensores del Chaco conservation area. The surrounding patches show a much smaller proportion of core area (50–60%), such that the conservation area looks like an isolated island. This development had already started in the first decade of this century and further progressed over the second decade. One reason for a lower core area index could be an increasing complexity of the shape (i.e., higher shape index). We can observe that there has indeed been a trend toward more complex shapes (dark yellow). While there were still many large patches with a low shape index (i.e., close to a rectangular shape) in 2000, the complexity, especially of the large patches in the western part of the Paraguayan Chaco, has increased. Except for parts of the Defensores del Chaco conservation area, there were nearly no large and compact forest patches left by the end of 2020.

4. Discussion

4.1. Forest Cover Change Assesment

This study emphases detection and characterization of annual changes in Paraguayan Chaco forest cover between the years 1987 and 2020. In addition, the status of the forest was assessed based on a comprehensive fragmentation analysis conducted at a landscape and patch level. Previous studies in the region have only considered up to three temporal steps. In this way, it was not possible to identify clear trends and to determine in which years forest clearance was most prominent. If the objective is to encourage the preservation of natural resources and to ensure forest continuity, comprehension of the historical distribution of the forest, as well as its current state, is relevant. To our knowledge, there have been no studies that address forest cover changes in the Paraguayan Chaco on an annual basis. In this work, annual changes in the forest cover were studied using a multi-temporal analysis approach. For this purpose, forest cover was mapped by applying an RF classifier incorporating spectral-temporal metrics from dense sets of Landsat imagery (TM, ETM + and OLI).
Overall classification accuracies ranged between 85% and 99%. Change-detection analysis revealed a total forest cover loss of 34% (64,700 km2) between 1987 and 2020, with annual deforestation rate of 1% (1960 km2), principally caused by the expansion of artificial pastures for livestock production. When comparing the obtained results with other studies conducted for the region, discrepancies were found. For instance, Baumann et al. [16] reported higher deforestation rates for the period of 1987 and 2012, resulting in 27% (almost 44,000 km2) of Paraguayan Chaco forest lost. This study, on the contrary, found a total of 22,000 km2 (21%) of forest cleared for the same time period. Mereles and Rodas [20], on the other hand, reported almost 40,000 km2 (27%) of forest cover loss between the years 1990 and 2013. However, this study revealed higher deforestation rates, comprising almost 47,000 km2 (25%) of the Paraguayan Chaco forest cleared for the same years. When comparing deforestation figures from global forest products, Hansen et al. [7], for instance, revealed a total forest cover loss of 25% (49360 km2) between 2000 and 2019, whereas this study accounted 52,125 km2 (29%) of forest cleared for the same period of analysis. With regards to the extent of forest cover, the resultant outcomes from this study present discrepancies with other studies. For example, INFONA generated a forest cover mask for the years 1986, 2000, 2011, 2015, 2016, 2017, and 2018 based on Landsat data sets [42]. INFONA applied the methodological framework of the REDD Plus program in order to derive reference levels of carbon emissions for the country [42]. The institute reported a total forest cover in the Paraguayan Chaco of approximately 140,000 km2 (57% of the total study area) for the year 2018, whereas in this study, a smaller area was characterized: forest comprising over 130,000 km2 (54% of the total study area) in the same year. Distinct from INFONA, the Paraguayan non-governmental organization (NGO) Guyra Paraguay, under the initiative MapBiomas Chaco, reported a higher forest extent for the year 2018, reaching almost 180,000 km2 (74% of the total study area). Overall differences in the findings could be a product of the definition of forest, minimum mapping unit, methodological approach, or differentiation/inclusion of all woody classes (e.g., bushland areas, savannas, secondary woody vegetation). For instance, similarly to Baumann et al. [16], this study applied similar temporal metrics from Landsat images, as well as sample points, to characterize the forest. Nevertheless, additional variables, such vegetation indices (e.g., NDVI, EVI, NDWI), along with their respective percentiles, were also included to enhance the spectral separability among the classes. INFONA did not only apply a different classification algorithm (classification and regression trees (CART)) but also included manual post-processing in their approach to enhance the quality of the final product [42]. Differently from this study, INFONA, Baumann et al. [16], and Hansen et al. [7] applied a wall-to-wall change-mapping approach, omitting the use of the sample points to characterize the forest cover.
A detailed assessment of the time series revealed a tendency toward increasing forest loss between the 1987 and 2020. Deforestation rates abruptly increased in 2008, 2013, and 2019, reaching levels four to five times higher than previous years. Such trends can be classified both as a direct consequence of global agricultural-commodity prices and Paraguay’s incorporation into the world market [16]. Increased revenues from agricultural production have resulted in greater economic incentives for agricultural expansion in the region [16]. In addition, a logging ban implemented in the eastern region of Paraguay since 2004 may have shifted the agricultural-expansion pressure to the Chaco [16,17,20]. The small increases in forest cover that were observed in some districts can most likely be attributed to misclassifications. Such variation often occurs in districts (e.g., Villa Hayes, Puerto Pinasco, and Manuel Irala Fernandez) close to water streams located in the humid Chaco. Following significant precipitation, secondary vegetation has similar spectral firms as forest and is therefore incorrectly classified as such. In this regard, the use of active sensors, such as lidar and SAR (synthetic aperture radar) could provide valuable inputs to mask out such conflict areas.
A deeper analysis of forest cover loss at the district level reveals that the expansion of deforested areas started from the more populated centers of the Paraguayan Chaco and spread to its border. It is frequently observed that first forest interventions started close to settlements before moving further away into undisturbed areas [34]. Such trends explain the higher deforestation rates shown within the central districts of the study area (e.g., Filadelfia (1.6%), Manuel Irala Fernandez (1.6%), and Loma Plata (2.4%)). On the contrary, bordering districts, such as Jose Falcon and Bahía Negra, presented relatively low deforestation rates, comprising only 0.5% of forest-area loss. It is important to remark that Bahía Negra occupies a vast area in the norther region, where most of the protected areas are located. Therefore, it can be inferred that forest in this area presents certain level of protection, which prevents deforestation activities from occuring. As opposed to Bahia Negra, forest cover in Jose Falcon was already not prominent in the early 1990s; hence, forest loss was scarce.
The analysis of forest clearings within and in the buffer zones of protected areas has shown the effectiveness of forest preservation to a certain extent. Although half of the protected areas assessed presented low deforestation rates of between 0.5 and 7%, there are forest reserves where up to 25% of the forest was cleared between the years 2000 and 2020. On the contrary, a different trend was found in the eastern region of the country, were deforestation rates within protected areas vary one between 3 and 5% [34]. Forest clearings in the 5–15 km buffer increased drastically, with forest loss ranging between 8 and 65%. Studies from Huang et al. [37] and Da Ponte et al. [34] revealed that such trends apply to all the protected areas in Paraguay since similar trends were found in the east, where forest clearing increased in buffer zones, up to 55%. As opposed to the results of from studies [34,43] protected areas, forest area has not increased in the Chaco. Poor soil conditions, lack of proper infrastructure, and the poor availability of water in particular hamper the establishment of forest plantations in the Chaco region. Therefore, most restoration and reforestation activities occur in the eastern part of the country [34].

4.2. Forest Fragmentation Analysis

Forest fragmentation assessment in the Paraguayan Chaco region was conducted by applying a variety of landscape metrics at a patch and landscape level. The analysis at landscape level permitted multitemporal comparisons of landscape characteristics. All considered metrics revealed an increment in the fragmentation process between 2000 and 2020. Forest cover loss was accompanied by a decrease in the total core area and an increase in the number of patches. Several studies that addressed forest fragmentation analysis presented similar outcomes, where agricultural lands extended over natural areas, therefore interrupting the continuity of the forest and increasing the level of isolation of forest patches [17,34,39,44]. The patch-level assessment, on the other hand, permitted a spatial comparison of the forest landscape between 2000, 2010, and 2020.
The complexity of shapes gradually increased between 2000 and 2010, as reflected in higher fragmentation of larger patches, an increment of branches, and higher edge lengths. The analysis related to proximity indexes permitted identification of priority patches for nature conservation. The connectivity of forest patches has been frequently considered as one of the most relevant factors influencing population dynamics [17]. The ability of species to colonize forest fragments is anti-proportional to their distance from one another. Therefore, a high embeddedness of forest patches and large core areas are essential to ensuring the conservation and persistence of species and their natural habitat.
Outcomes from this study reveal that a high connectivity of forest patches is still present in the northern region of the Paraguayan Chaco, where the largest protected areas are settled. Forest clearings took place from the center to the outskirts of the Chaco, still leaving large forest remnants well-connected to one another, which is in contrast to other eco-regions in Paraguay, e.g., the Upper Parana Atlantic Forest. However, it is important to remark that none of the protected areas in the center or in the south of the Chaco forms part of the best-connected areas with a high core area index. The increasing number of isolated forest islands suggests a strong threat from continuous deforestation activities. The pressure exerted by the constant advance of artificial pastures for livestock production continues to be a major threat to the natural forest in the Paraguayan Chaco [16,17].
Finally, it is important to establish certain recommendations that could enhance the outcomes of future investigations in the region. Further studies should consider bordering areas within neighboring countries since deforestation activities in the northern Chaco, in particular due to illegal logging or intentional fires, could be better explained. Furthermore, the incorporation of additional parameters, such as distance to roads or settlements, would be worth exploring to understand the impact of urbanization on the natural landscape. Moreover, the inclusion of additional classes in the study would significantly improve the fragmentation results. When considering the landscape metrics at a class level, the relationship between the different land uses (e.g., forest patches located in natural savannas, marshlands, or neighboring artificial pastures fields) and the forest can be estimated, and thus, the interaction between the classes can be derived. Additional research should be conducted in the Paraguayan Chaco forest using concrete information concerning the requirements of different animal species that live in the area. For instance, the fragmentation analysis of this study was conducted by applying different exemplary values: a 500 m distance for core areas or a 100 m search radius to estimate the proximity of patches. Therefore, the outcomes of this study may not be equally applicable to all the species in the Paraguayan Chaco.

5. Conclusions

This article comprises an extensive analysis of forest loss in the Paraguayan Chaco region, with a specific focus on landscape fragmentation. A detailed evaluation of yearly forest clearings between 1987 and 2020 was provided, along with the assessment of the fragmentation at a landscape and patch level. An identification of main forest remnants for biodiversity conservation was provided, as well as the connectivity among them. Additionally, forest dynamics within and outside protected areas was assessed to estimate the pressure exerted by anthropogenic activities on conservation zones. Lastly, a summary of the most relevant outcomes was presented and subsequently discussed, along with research gaps and further recommendations. From the results and discussion in this study, the major conclusion are as follows:
  • The forest characterization based on Landsat data and the subsequent change-detection analysis revealed a forest cover loss of 64,700 km2 between 1987 and 2020, resulting in an annual deforestation rate of 1960 km2. The years between 2013 and 2019 presented the highest values of forest clearings. In the respective years, more than 8000 km2 were lost, which is about four times as much as the average loss in the Chaco region.
  • The districts most affected by deforestation activities over the 34-year study period were Mariscal Estigarribia, Fuerte Olimpo, and Filadelfia, accounting for 39%, 11% and 10% of the total area cleared, respectively.
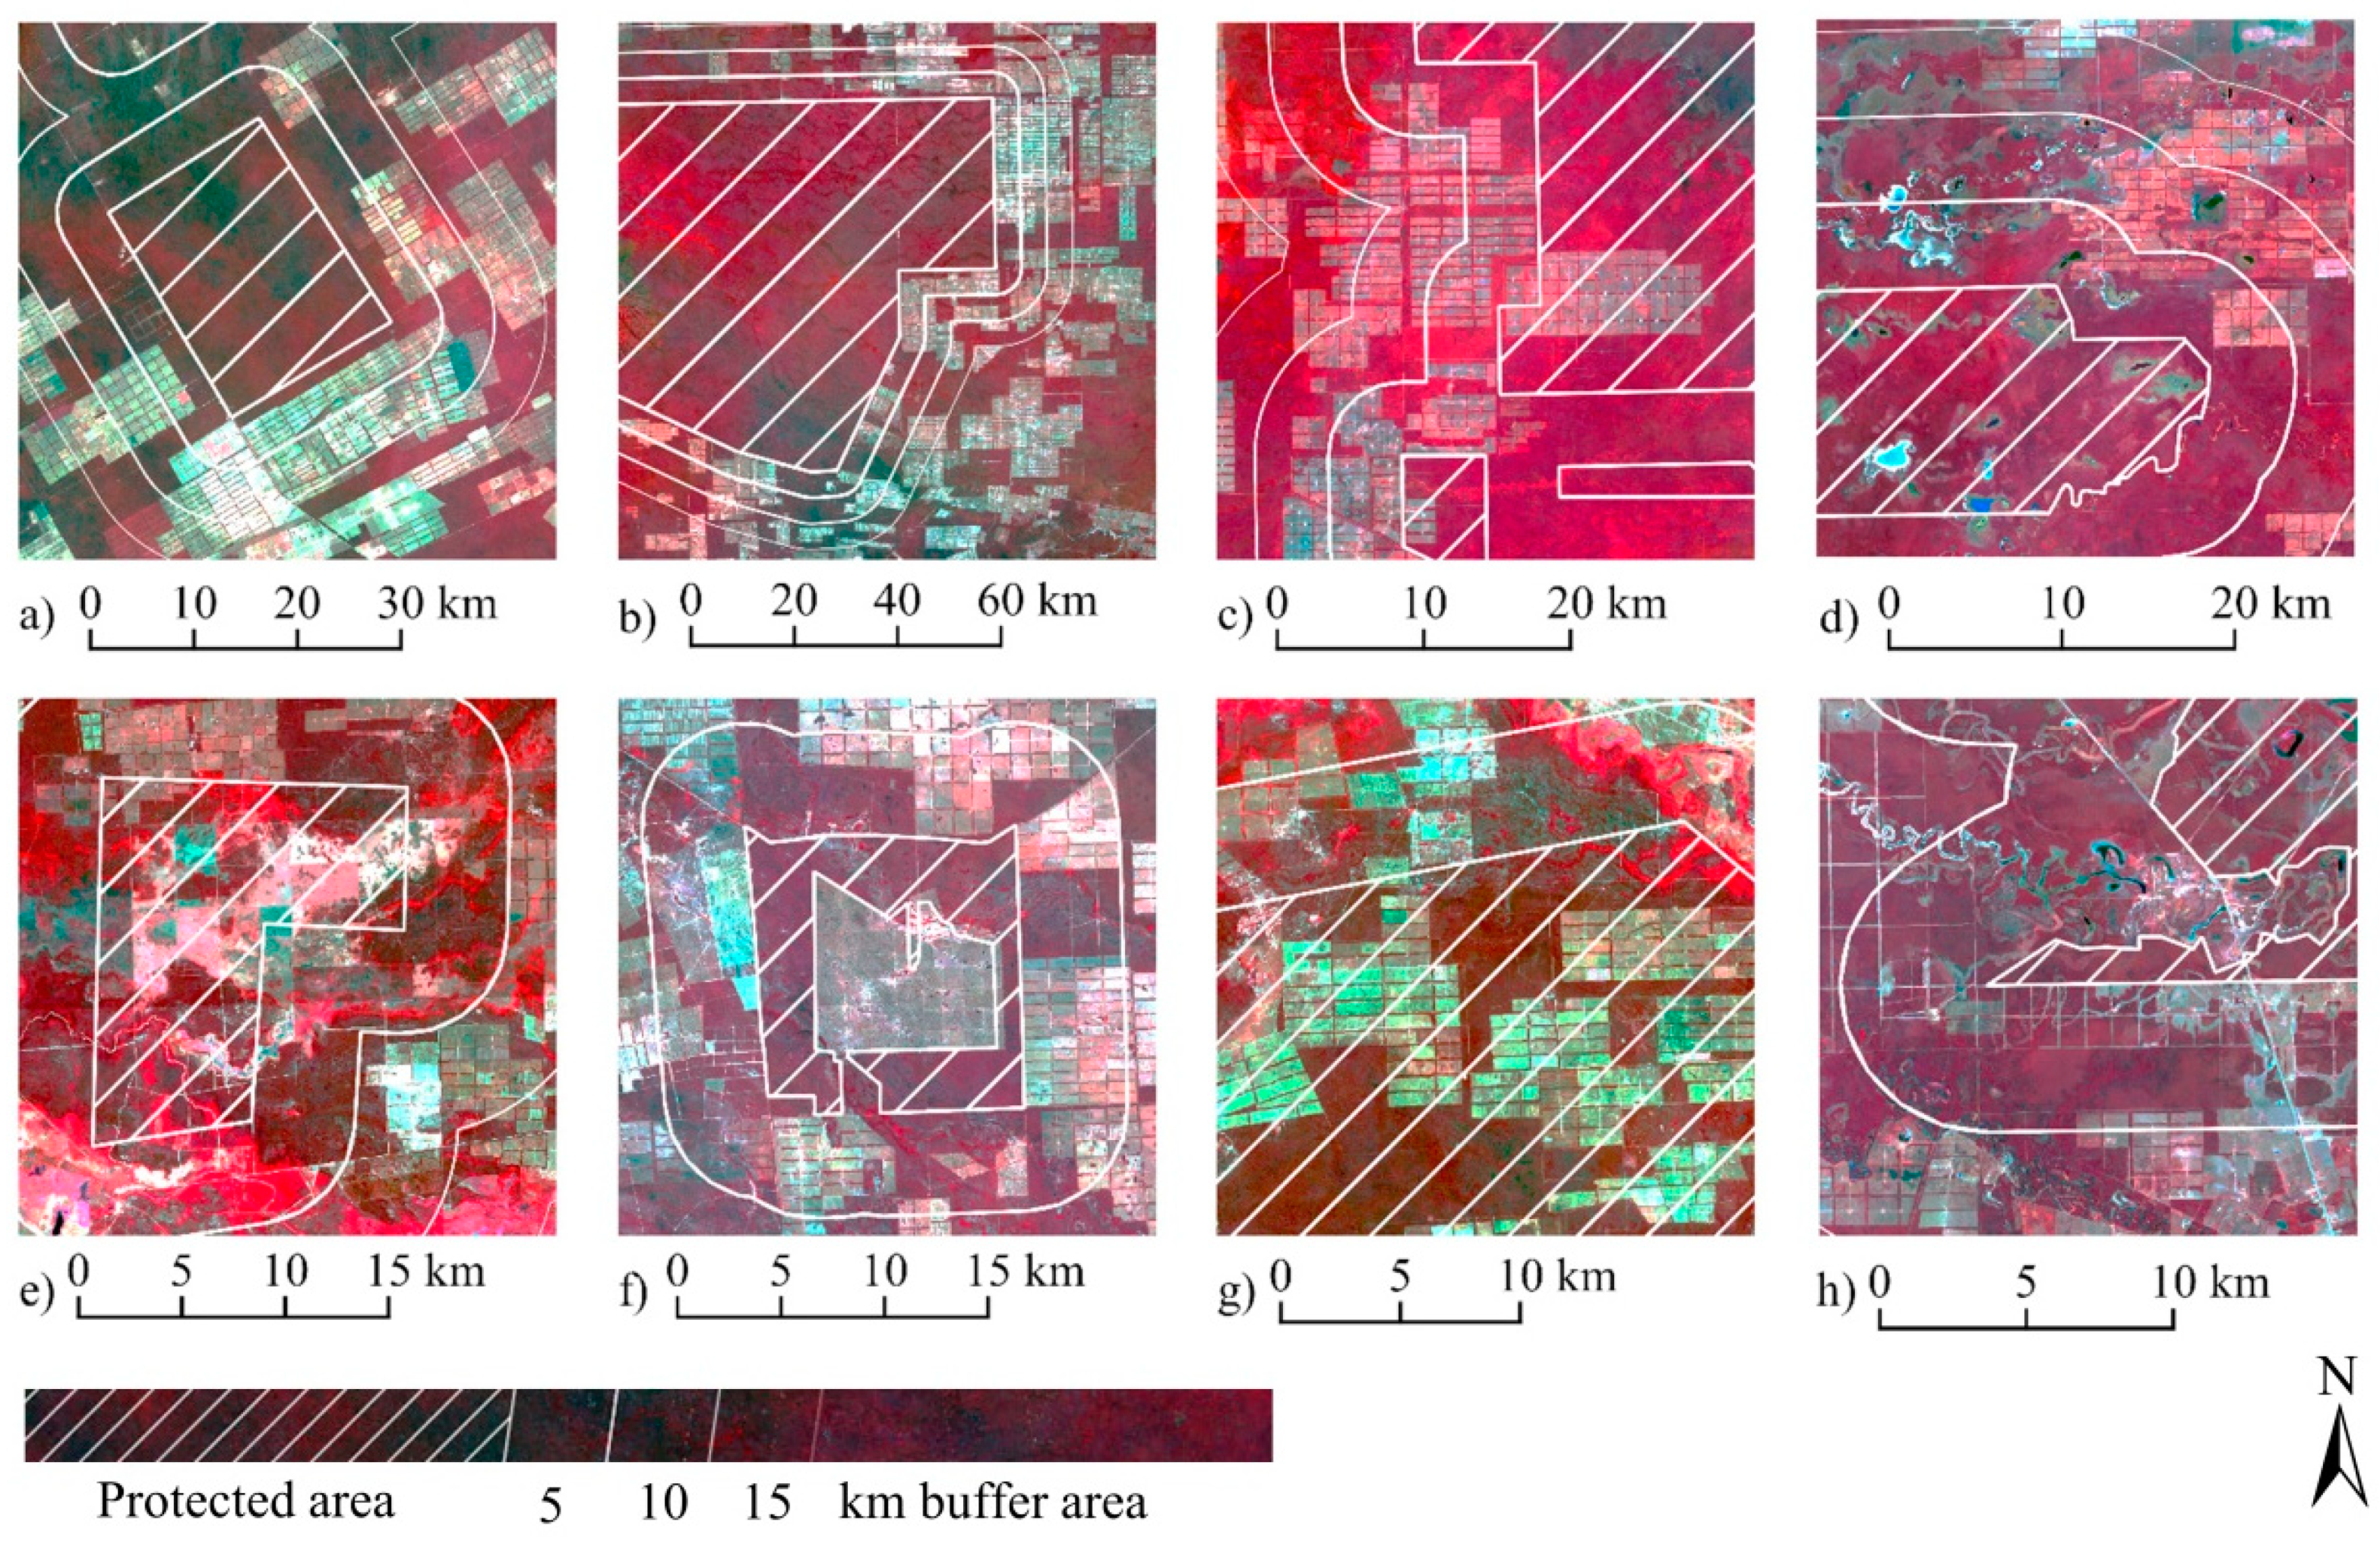
  • The results in this study demonstrate a sound effectivity of most protected areas to preserve the forest. However, the natural reserves of Toro Mocho, Tinfunqué, Río Negro, and Fortin Salazar exhibited severe deforestation rates, varying from 14 up to 25%. Moreover, a drastic increment of forest loss was observed in the buffer zones of 5, 10, and 15 km, with values ascending up to 65%. These trends indicate that there is a constant pressure on protected areas, which therefore reveals the necessity of stronger law-enforcement strategies to successfully protect these natural sites.
  • Ongoing deforestation activities increase forest fragmentation and compromise biodiversity conservation in the Paraguayan Chaco region. Levels of fragmentation increase in larger patches. While a certain connectivity between forest patches still remains, particularly in the north, a continuous decrease in forest cover would result in the generation of forest islands, which would dramatically endanger the possibility of animals to moving between the main reserves.
  • Whereas this study analyzes forest fragmentation based on exemplary values obtained from previous regional studies, concrete figures must be defined for each main group of species from the Paraguayan Chaco. As an example, while birds can easily migrate along patches, additional effort is required by other invertebrates. Therefore, the distance between patches might not have an equal significance to bird populations as it does for other species.

Author Contributions

E.D.P. was involved in the writing of the majority of the manuscript, research design, methodological guidance for data processing, and analysis; M.G.-C. was involved in manuscript writing and data analysis; J.K. contributed to fragmentation data analysis, deforestation rates, manuscript writing, discussion, and critical revision; N.C. contributed to protected-area data analysis; L.P.d.M. provided expert knowledge on the study area; M.A., A.C., A.G., V.G., L.M., M.R., and A.S. generated annual forest masks. All authors have read and agreed to the published version of the manuscript.

Funding

This work was conducted under the project GeoForPy ‘Understanding forest cover structure for biodiversity conservation in the Paraguayan Chaco’ executed by the German Aerospace Center (DLR) and supported by funds of the Federal Ministry of Food and Agriculture (BMEL) based on a decision of the Parliament of the Federal Republic of Germany via the Federal Office for Agriculture and Food (BLE).

Institutional Review Board Statement

Not applicable.

Informed Consent Statement

Not applicable.

Data Availability Statement

Landsat 5 (L5) Thematic Mapper (TM), Landsat 7 (L7) Enhanced Thematic Mapper Plus (ETM+), and Landsat 8 (L8) Operational Land Imager (OLI) data terrain-corrected (L1T) images were obtained from the GEE data catalog.

Conflicts of Interest

The authors declare no conflict of interest.

Appendix A

Table A1. Fragmentation metrics (adapted from McGarical & Marks, 1995 and McGarigal et al. 2012) applied to forest patches.
ScaleMetric [Units]DescriptionLevel
Area MetricsTotal Area (TA) [km2] Total area of the forest classLandscape
Core Area (CA) [km2] The sum of areas within patch beyond some specified edge distance or buffer (500m).Landscape
Core Area Index (CAI) [%]Percentage of the patch that is comprised of core area.Landscape, patch
Number of patches (NP) Number of patches in the forest class.Landscape
Edge MetricsTotal Edge (TE) [km] Measure of total edge length of a particular patch type (class level) or of all patch types (landscape level).Landscape
Mean Patch Edge [km] Measures the average edge length of a forest patch.Landscape
Form Metrics(Mean) Shape Index (MSI) Measures the average patch shape for a particular patch type (class) or for all patches in the landscape.Landscape (mean), patch
Mean Perimeter-Area Ratio (MPAR)Measures the average Perimeter-Area Ratio for a particular patch type (class) or for all patches in the landscape.Landscape
Mean Fractal Dimension (MFRACT)Mean of the fractal dimension index of all patches belonging to a class.Landscape
Nearest Neighbor Metrics:(Mean) Proximity Index (PROX)Measures the degree of isolation and fragmentation of the corresponding patch type.Landscape (mean), patch
Subdivision MetricsDivision Refers to the degree to which the landscape is broken up into separate patches.Landscape
Split Number of patches one gets when dividing the total landscape into patches of equal size.Landscape
Mesh [km2] Size of the patches one gets when dividing the total landscape into patches of equal size.Landscape
Table A2. Complete accuracy forest classification overview between the years 1987–2020.
YearClassOAProducers AccuracyUser AccuracyKappa Coefficient
1987Forest0.930.970.940.84
No Forest0.850.92
1988Forest0.920.970.930.74
No Forest0.720.87
1989Forest0.900.920.940.79
No Forest0.870.84
1990Forest0.950.980.950.89
No Forest0.890.96
1991Forest0.960.990.960.87
No Forest0.830.97
1992Forest0.970.990.970.88
No Forest0.860.94
1993Forest0.960.980.960.89
No Forest0.870.95
1994Forest0.950.980.960.87
No Forest0.860.93
1995Forest0.930.980.930.83
No Forest0.810.94
1996Forest0.940.970.950.86
No Forest0.880.92
1997Forest0.880.910.890.76
No Forest0.830.87
1998Forest0.880.920.890.76
No Forest0.840.87
1999Forest0.970.980.980.92
No Forest0.940.93
2000Forest0.950.970.970.87
No Forest0.900.90
2001Forest0.950.960.970.85
No Forest0.900.87
2002Forest0.991.000.990.98
No Forest0.971.00
2003Forest0.1.001.000.99
No Forest1.000.99
2004Forest0.981.000.980.95
No Forest0.940.99
2005Forest0.991.000.990.98
No Forest0.981.00
2006Forest0.900.790.870.78
No Forest0.890.82
2007Forest0.910.850.890.84
No Forest0.920.95
2008Forest0.950.990.990.91
No Forest0.990.99
2009Forest0.950.810.980.89
No Forest0.960.93
2010Forest0.940.920.910.88
No Forest0.940.91
2011Forest0.940.720.910.90
No Forest0.950.99
2012Forest0.940.940.960.90
No Forest0.970.90
2013Forest0.910.950.910.81
No Forest0.850.91
2014Forest0.920.960.920.84
No Forest0.860.94
2015Forest0.920.930.940.84
No Forest0.910.89
2016Forest0.940.960.950.91
No Forest0.850.94
2017Forest0.970.980.970.95
No Forest0.940.96
2018Forest0.960.970.960.93
No Forest0.950.97
2019Forest0.910.950.880.82
No Forest0.870.94
2020Forest0.850.890.810.70
No Forest0.810.89

References

  1. Mittermeier, R.A.; Myers, N.; Mittermeier, C.G. Hotspots: Earth’s Biologically Richest and Most Endangered Terrestrial Ecoregions; CEMEX: Washington, DC, USA, 1999. [Google Scholar]
  2. Fao. Global Forest Resources Assessment 2010. Main Report; FAO Forestry Paper 163; FAO: Rome, Italy, 2010; Volume 163, 350p. [Google Scholar]
  3. Houghton, R. Tropical Deforestation as a Source of Greenhouse Gas Emissions; Amazon Institute for Environmental Research: Pará, Brazil, 2005. [Google Scholar]
  4. WWF. Paraguay Extends Zero Deforestation Law to 2018; WWF: Grand, Switzerland, 2013. [Google Scholar]
  5. Arino, O.; Gross, D.; Ranera, F.; Leroy, M.; Bicheron, P.; Brockman, C.; Defourny, P.; Vancutsem, C.; Achard, F.; Durieux, L.; et al. GlobCover: ESA service for Global land cover from MERIS. In Proceedings of the 2007 IEEE International Geoscience and Remote Sensing Symposium, Barcelona, Spain, 23–28 July 2007; pp. 2412–2415. [Google Scholar]
  6. Joseph, S.; Murthy, M.S.R.; Thomas, A.P. The progress on remote sensing technology in identifying tropical forest degradation: A synthesis of the present knowledge and future perspectives. Environ. Earth Sci. 2011, 64, 731–741. [Google Scholar] [CrossRef]
  7. Hansen, M.C.; Potapov, P.V.; Moore, R.; Hancher, M.; Turubanova, S.A.; Tyukavina, A.; Thau, D.; Stehman, S.V.; Goetz, S.J.; Loveland, T.R.; et al. High-resolution global maps of 21st-century forest cover change. Science 2013, 342, 850–853. [Google Scholar] [CrossRef] [PubMed] [Green Version]
  8. Friedl, M.A.; McIver, D.K.; Hodges, J.C.F.; Zhang, X.; Muchoney, D.; Strahler, A.H.; Woodcock, C.E.; Gopal, S.; Schneider, A.; Cooper, A.; et al. Global land cover mapping from MODIS: Algorithms and early results. Remote Sens. Environ. 2002, 83, 287–302. [Google Scholar] [CrossRef]
  9. FAO. Global Forest Resource Assesment; FAO: Rome, Italy, 2020. [Google Scholar]
  10. Fernández, G.; Obermeier, W.; Gerique, A.; Sandoval, M.; Lehnert, L.; Thies, B.; Bendix, J. Land Cover Change in the Andes of Southern Ecuador—Patterns and Drivers. Remote Sens. 2015, 7, 2509–2542. [Google Scholar] [CrossRef] [Green Version]
  11. Gebhardt, S.; Wehrmann, T.; Ruiz, M.A.M.; Maeda, P.; Bishop, J.; Schramm, M.; Kopeinig, R.; Cartus, O.; Kellndorfer, J.; Ressl, R.; et al. MAD-MEX: Automatic wall-to-wall land cover monitoring for the mexican REDD-MRV program using all landsat data. Remote Sens. 2014, 6, 3923–3943. [Google Scholar] [CrossRef] [Green Version]
  12. Giri, C.; Long, J. Land Cover Characterization and Mapping of South America for the Year 2010 Using Landsat 30 m Satellite Data. Remote Sens. 2014, 6, 9494–9510. [Google Scholar] [CrossRef] [Green Version]
  13. Hightower, J.; Butterfield, A.; Weishampel, J. Quantifying Ancient Maya Land Use Legacy Effects on Contemporary Rainforest Canopy Structure. Remote Sens. 2014, 6, 10716–10732. [Google Scholar] [CrossRef]
  14. Shimada, M.; Itoh, T.; Motooka, T.; Watanabe, M.; Shiraishi, T.; Thapa, R.; Lucas, R. New global forest/non-forest maps from ALOS PALSAR data (2007–2010). Remote Sens. Environ. 2014, 155, 13–31. [Google Scholar] [CrossRef]
  15. Griffiths, P.; Kuemmerle, T.; Baumann, M.; Radeloff, V.C.; Abrudan, I.V.; Lieskovsky, J.; Munteanu, C.; Ostapowicz, K.; Hostert, P. Forest disturbances, forest recovery, and changes in forest types across the Carpathian ecoregion from 1985 to 2010 based on Landsat image composites. Remote Sens. Environ. 2014, 151, 72–88. [Google Scholar] [CrossRef]
  16. Baumann, M.; Volante, N.; Kuemmerle, T.; Jose, G.G.; Gavier-pizarro, G. Deforestation and cattle expansion in the Paraguayan Chaco. Reg. Environ. Chang. 2017, 17, 1179–1191. [Google Scholar] [CrossRef]
  17. De Sancha, U.; Boyle, S.A.; Mcintyre, N.E.; Brooks, D.M.; Yanosky, A.; Cuellar, E.; Mereles, F.; Camino, M.; Stevens, R.D. The disappearing Dry Chaco, one of the last dry forest systems on earth. Landsc. Ecol. 2021, 36, 2997–3012. [Google Scholar] [CrossRef]
  18. Da Ponte, E.; Fleckenstein, M.; Leinenkugel, P.; Parker, A.; Oppelt, N.; Kuenzer, C. Tropical forest cover dynamics for Latin America using Earth observation data: A review covering the continental, regional, and local scale. Int. J. Remote Sens. 2015, 36, 3196–3242. [Google Scholar] [CrossRef]
  19. Gill, A.; Da Ponte, E.; Insfran, K.; Gonzales, L.; World Wildlife Fund; German Aesrospace Center. Atlas del Chaco Paraguayo; Musa, K., Ed.; Asuncion-Paraguay, WWF: Grand, Switzerland, 2020. [Google Scholar]
  20. Mereles, M.F.; Rodas, O. Assessment of rates of deforestation classes in the Paraguayan Chaco (Great South American Chaco) with comments on the vulnerability of forests fragments to climate change. Clim. Chang. 2014, 127, 55–71. [Google Scholar] [CrossRef]
  21. Caldas, M.M.; Goodin, D.; Sherwood, S.; Campos Krauer, J.M.; Wisely, S.M. Land-cover change in the Paraguayan Chaco: 2000–2011. J. Land Use Sci. 2013, 10, 1–18. [Google Scholar] [CrossRef]
  22. Direccion Nacional de Encuestas y Estadisticas (DGEEC). Atlas censal del Paraguay; Asuncion-Paraguay; 2002; Volume 1, p. 143. Available online: http://www.dgeec.gov.py/ (accessed on 14 October 2021).
  23. Da Ponte, E.; Mack, B.; Wohlfart, C.; Rodas, O.; Oppelt, N.; Dech, S.; Kuenzer, C. Assessing Forest Cover Dynamics and Forest Perception in the Atlantic Forest of Paraguay, Combining Remote Sensing and Household Level Data. Forests 2017, 8, 389. [Google Scholar] [CrossRef] [Green Version]
  24. Wohlfart, C.; Mack, B.; Liu, G.; Kuenzer, C. Multi-faceted land cover and land use change analyses in the Yellow River Basin based on dense Landsat time series: Exemplary analysis in mining, agriculture, forest, and urban areas. Appl. Geogr. 2017, 85, 73–88. [Google Scholar] [CrossRef]
  25. Knauer, K.; Gessner, U.; Fensholt, U.; Kuenzer, C. Agricultural Expansion in Burkina Faso over 14 Years with 30 m Resolution Time Series: The Role of Population Growth and Implications for the Environment. Remote Sens. 2017, 9, 132. [Google Scholar] [CrossRef] [Green Version]
  26. Zhu, Z.; Woodcock, C.E. Object-based cloud and cloud shadow detection in Landsat imagery. Remote Sens. Environ. 2012, 118, 83–94. [Google Scholar] [CrossRef]
  27. Müller, H.; Griffiths, P.; Hostert, P. Long-term deforestation dynamics in the Brazilian Amazon—Uncovering historic frontier development along the Cuiabá–Santarém highway. Int. J. Appl. Earth Obs. Geoinf. 2016, 44, 61–69. [Google Scholar] [CrossRef]
  28. Mack, B.; Leinenkugel, P.; Kuenzer, C.; Dech, S. A semi-automated approach for the generation of a new land use and land cover product for Germany based on Landsat time-series and Lucas in-situ data. Remote Sens. Lett. 2017, 8, 244–253. [Google Scholar] [CrossRef]
  29. Breiman, L. Random forests. Mach. Learn. 2001, 45, 5–32. [Google Scholar] [CrossRef] [Green Version]
  30. Gislason, P.O.; Benediktsson, J.A.; Sveinsson, J.R. Random Forests for land cover classification. Pattern Recognit. Lett. 2006, 27, 294–300. [Google Scholar] [CrossRef]
  31. Schneider, A. Monitoring land cover change in urban and peri-urban areas using dense time stacks of Landsat satellite data and a data mining approach. Remote Sens. Environ. 2012, 124, 689–704. [Google Scholar] [CrossRef]
  32. Liaw, A.; Wiener, M. Classification and regression by randomForest. R News 2002, 2, 18–22. [Google Scholar]
  33. Lillesand, T.; Kiefer, R.W.; Chipman, J. Remote Sensing and Image Interpretation, 6th ed.; Sons, J.W., Ed.; Wiley: New York, NY, USA, 2008; Volume 6. [Google Scholar]
  34. Da Ponte, E.; Roch, M.; Leinenkugel, P.; Dech, S.; Kuenzer, C. Paraguay’s Atlantic Forest cover loss–Satellite-based change detection and fragmentation analysis between 2003 and 2013. Appl. Geogr. 2017, 79, 37–49. [Google Scholar] [CrossRef]
  35. Nielsen, C.; Thompson, D.; Kelly, M.; Lopez-Gonzalez, C.A. Puma concolor. The IUCN Red List of Threatened Species 2015; Global Biodiversity Information Facility: Copenhagen, Denmark, 2015. [Google Scholar]
  36. Huang, C.; Kim, S.; Song, K.; Townshend, J.R.G.; Davis, P.; Altstatt, A.; Rodas, O.; Yanosky, A.; Clay, R.; Tucker, C.J.; et al. Assessment of Paraguay’s forest cover change using Landsat observations. Glob. Planet. Chang. 2009, 67, 1–12. [Google Scholar] [CrossRef]
  37. McGarical, K.; Marks, B.J. FRAGSTATS: Spatial Pattern Analysis Program for Quantifying Landscape Structure; Gen. Tech. Rep. PNW-GTR-351. US; U.S. Department of Agriculture, Forest Service, Pacific Northwest Research Station: Portland, OR, USA, 1994; Volume 97331, p. 134.
  38. Lang, S.; Tiede, D. vLATE Extension für ArcGIS—Vektorbasiertes Tool zur quantitativen Landschaftsstrukturanalyse. In Proceedings of the Esri European User Conference 2003, Innsbruck, Austria, 8–10 October 2003; pp. 1–10. [Google Scholar]
  39. Broadbent, E.N.; Asner, G.P.; Keller, M.; Knapp, D.E.; Oliveira, P.J.C.; Silva, J.N. Forest fragmentation and edge effects from deforestation and selective logging in the Brazilian Amazon. Biol. Conserv. 2008, 141, 1745–1757. [Google Scholar] [CrossRef]
  40. Benchimol, M.; Peres, C. Predicting local extinctions of Amazonian vertebrates in forest islands created by a mega dam. Biol. Conserv. 2015, 187, 61–72. [Google Scholar] [CrossRef]
  41. Roch, M. Revealing Forest Cover Loss in Paraguay’s Atlantic Forest Region—A Remote Sensing and GIS Based Forest Monitoring. Master’s Thesis, Universität Salzburg, Salzburg, Austria, 2014. [Google Scholar]
  42. Programa Nacional Conjunto (ONU-REDD + Paraguay). Metodología de Elaboración de Mapas de Cambio de Uso de la Tierra en el Paraguay: Informe del Equipo Técnico. Available online: http://www.infona.gov.py/application/files/5314/3092/8338/Presentacion_IFN_PARAGUAY_06.05.2015.pdf (accessed on 14 October 2021).
  43. Huang, C.; Kim, S.; Altstatt, A.; Townshend, J.R.G.; Davis, P.; Song, K.; Tucker, C.J.; Rodas, O.; Yanosky, A.; Clay, R.; et al. Rapid loss of Paraguay’s Atlantic forest and the status of protected areas—A Landsat assessment. Remote Sens. Environ. 2007, 106, 460–466. [Google Scholar] [CrossRef]
  44. Marsik, M.; Stevens, F.R.; Southworth, J. Amazon deforestation: Rates and patterns of land cover change and fragmentation in Pando, northern Bolivia, 1986 to 2005. Prog. Phys. Geogr. 2011, 35, 353–374. [Google Scholar] [CrossRef]
Figure 1. Overview of the study area and Landsat footprints (base layer provided by Natural Earth Community and Conservation International (Earth, 2013; International, 2011)).
Forests 13 00025 g001
Figure 2. Workflow of remote-sensing- and GIS-based forest-classification procedures (source: adapted from Da Ponte et al. [23].
Forests 13 00025 g002
Figure 3. General overview of 34 years of forest cover loss in the Paraguayan Chaco.
Forests 13 00025 g003
Figure 4. Forest cover loss per district in the Paraguayan Chaco between 1987 and 2020. All districts are displayed and sorted by their size, from largest (red) to smallest district (green).
Forests 13 00025 g004
Figure 5. Forest cover inside and outside protected areas in the Paraguayan Chaco region based on Landsat images from 2020. (a) Teniente Agripino Enciso; (b) Defenosres del Chaco; (c) Río Negro; (d) Yaguarete´ Porá; (e) Toro Mocho; (f) Palmar Quemado; (g) Tinfunqué; (h) Fortin Salazar.
Forests 13 00025 g005
Figure 6. Landscape metrics applied to the forest for the years 2000, 2010, and 2020.
Forests 13 00025 g006
Figure 7. Spatial representation of proximity index, core area index, and shape index of forest patches for the years 2000, 2010, and 2020.
Forests 13 00025 g007
Table 1. Landsat data and number of processed scenes used in this study.
Landsat Image Data SetsValueOverall Accuracy (%)User’s Accuracy
(%)
Producer’s Accuracy
(%)
Kappa
Statistics (%)
ForestNon-ForestForestNon-Forest
Landsat 5 (1987–1998)Min88.4489.1784.4291.8172.650.74
Max97.0497.4297.7399.5489.040.89
Mean93.6594.2792.0096.7884.760.83
Landsat 5 & 7 (1999–2012)Min89.8186.7182.071.7389.000.77
Max99.71100.00100.0100.0100.00.99
Mean95.5895.6294.1092.3094.560.90
Landsat 8
(2013–2020)
Min85.3381.8089.2189.2381.760.71
Max97.4297.5097.2398.5095.030.95
Mean92.0193.3694.4596.6086.450.84
Publisher’s Note: MDPI stays neutral with regard to jurisdictional claims in published maps and institutional affiliations.

