Article

Dwarf Mistletoe and Drought Contribute to Growth Decline, Dieback and Mortality of Junipers

by
Elisa Tamudo
1,
J. Julio Camarero
1,*,
Gabriel Sangüesa-Barreda
2 and
José Daniel Anadón
1
1
Instituto Pirenaico de Ecología (IPE-CSIC), 50059 Zaragoza, Spain
2
EiFAB-iuFOR, University of Valladolid, Campus Duques de Soria, 42004 Soria, Spain
*
Author to whom correspondence should be addressed.
Forests 2021, 12(9), 1199; https://doi.org/10.3390/f12091199
Submission received: 17 July 2021 / Revised: 29 August 2021 / Accepted: 1 September 2021 / Published: 3 September 2021
(This article belongs to the Special Issue Juniperus Species and Climate Change: Adaptations and Potentialities)

Abstract

:
Rising temperatures and aridification, combined with the stressing effect of some hemiparasitic plants such as mistletoes, may contribute to reduce vigour and growth of trees and shrubs leading to dieback and increasing mortality. This has been rarely explored in pioneer shrubs such as junipers, which are assumed to be more drought tolerant than coexisting trees. To test these ideas, we reconstructed radial growth patterns of common junipers (Juniperus communis L.) with different crown cover and infestation degree by dwarf mistletoe (Arceuthobium oxycedri (DC.) M. Bieb.) in two sites with contrasting aspect and water availability located in north-eastern Spain. We used dendrochronology to study the response of junipers’ radial growth to climatic factors (temperature, precipitation, and soil moisture), an index of drought severity, and mistletoe infestation. Juniper growth was constrained by elevated temperatures and low precipitation leading to drought during the growing season. Infestation by dwarf mistletoe contributed to a short-term growth decline in junipers. The interaction between low summer precipitation and high dwarf mistletoe infestation constrained juniper growth, particularly in the north-oriented wetter site, where hosts presented higher growth rates during wet periods. The negative impact of low summer precipitation on juniper growth overrides the effects due to dwarf mistletoe infestation. Aridification and mistletoe infestation could trigger dieback and mortality of shrubs slowing down successional dynamics and delaying shrub encroachment into former croplands and grasslands.

1. Introduction

Some regions of the Mediterranean Basin have experienced aridification trends after the 1950s due to increasingly warmer conditions [1]. According to tree-ring reconstructions of droughts in the Mediterranean Basin, the recent dry spells in the late 20th century and early 21st century were among the most severe of the past millennium [2]. Such severe and increasingly hotter and drier droughts have been linked to forest dieback episodes characterized by growth and productivity declines, rapid leaf shedding and rises in mortality rates [3,4].
It could be speculated that such forest dieback events would trigger a greater dominance of shrubs in the driest sites where tree establishment is hindered by aridification. Several pioneer, shade-intolerant shrub species dominate treeless, xeric sites in steppe and mountain Mediterranean regions (e.g., Genista Scorpius (L.) DC., Salvia rosmarinus (L.) Schleid., Thymus vulgaris L., etc.), where they are encroaching into grasslands as traditional land-use activities (pastures, extensive agriculture, etc.) cease or decrease their intensity [5]. This is the case of junipers, which are also vulnerable to drought stress because they are anisohydric species, i.e., they show a loose regulation of stomatal conductance rates as soil water decreases, and depend on shallow soil water sources [6,7,8]. These ecophysiological and anatomical features make junipers vulnerable to very high air temperatures leading to elevated vapor pressure deficit and to excessive water loss through leaves and low moisture levels in the uppermost soil, which explains recent drought-induced dieback and mortality events affecting species such as Juniperus phoenicea L. in southern and eastern Spain [9,10,11]. Therefore, increasingly drier and hotter conditions could lead to more widespread forest dieback but could also trigger de-shrubification events by promoting shrub dieback, slowing down successional dynamics [10].
Dieback has been attributed to two major mechanisms, namely hydraulic failure and carbon starvation [12]. However, biotic stressors (hemiparasites, pathogens, herbivores) may also amplify and contribute to dieback as has been documented across a diverse range of ecosystems and host-mistletoe combinations [13]; for instance, Scots pine (Pinus sylvestris L.) trees showing dieback were infected by the mistletoe (Viscum album L.), an aerial hemiparasitic plant [14]. Since mistletoes are xylem-tapping hemiparasites, which continue transpiring despite hosts close stomata, they amplify drought stress in the host [14,15,16]. This positive feedback between mistletoe infestation and drought stress, observed for instance in Scots pine [14,17], has not been investigated in shrub hosts.
The Mediterranean Basin is a climate change hotspot and also a biodiversity hotspot of juniper species [18]. Mediterranean junipers (mainly Juniperus oxycedrus L., Juniperus communis L. and J. phoenicea) are potential hosts of the dwarf mistletoe (Arceuthobium oxycedri (DC.) M. Bieb.) [19,20,21,22]. Dwarf mistletoes are perennial hemiparasitic plants that parasitize multiple species of shrubs and trees [20]. These species have been shown to reduce longitudinal and radial growth of host trees, particularly studied in North American timber tree species (pine, fir, Douglas-fir, spruce, hemlock) of the Pinaceae family [23,24,25,26,27]. Ecophysiological studies found a lower water-use efficiency of mistletoe-infected hosts, which showed a profuse water use at the leaf and tree scales, as well as higher crown transparency and a reduction in radial growth [28,29,30]. Dwarf mistletoes tap the host xylem and phloem and withdraw carbohydrates and mineral nutrients, as has been found in species from the Cupressaceae family [31,32]. If the dwarf mistletoe reduces the carbon availability by negatively impacting photosynthesis rates [16], this could lead to a reduction of carbon sources negatively impacting sinks such as the cambium and reducing radial growth. In addition, drought stress could reduce the turgor of cambial cells and constrain growth and leaf production in infected hosts [12]. However, the combined effects of dwarf mistletoe infestation and drought stress on the growth and health of juniper shrubs is still understudied. Furthermore, studying mistletoe-host interactions is relevant for land managers since synergistic effects of stressors (mistletoe infection, drought) might slow down succession dynamics from shrublands towards forests.
Here we aim to determine whether there is a relationship between changes in radial growth of common juniper (J. communis) as a function of variations in temperature, precipitation, soil moisture, an index of drought severity, and infestation degree by dwarf mistletoe (A. oxycedri) in two sites of north-eastern Spain, near the southernmost, xeric distribution limit of common juniper [18]. Since growth rates of host may depend on multiple factors (severity of infection, host vigour, local climatic situations, etc.) we reconstructed and compared growth changes in a dry vs. a wet site with contrasting slope aspects. We expect a stronger negative impact on juniper growth of severe mistletoe infestation and drought in the wettest site, where growth rates should be higher but should be more negatively impacted by the positive feedback between mistletoe infestation and drought stress.

2. Materials and Methods

2.1. Study Sites

Two sites located in the municipality of Aliaga (Teruel), southern Aragón, eastern Spain, were studied. In these sites junipers form populations (Figure 1) around abandoned pasture lands or formerly cultivated fields with scattered trees (P. sylvestris) and some shrubs (e.g., Amelanchier ovalis Medik., Berberis vulgaris L., Genista scorpius L.). The first site, called “Aliaga” (40°35′35″ N, 0°40′24″ W, 1316 m a.s.l.) is located on south-oriented gentle slopes (5–15°) and it is considered the drier site, while the second site, called “Ribazada” (40°34′22″ N, 0°39′41″ W, 1350 m a.s.l.) is situated on north-oriented slopes of similar steepness and it is considered the wetter site. In both sites, soils are calcareous.
The climate in the study area is continental Mediterranean, characterized by cold winters and dry, warm summers. According to local climate data from the “Alcalá de la Selva” station (40°22′ N, 0°43′ W, 1404 m a.s.l.; reference period 1950–2020), located ca. 32 and 30 km apart from the “Aliaga” and “Ribazada” study sites, respectively, annual precipitation is 572 mm and the mean annual temperature is 11.2 °C. The mean minimum and maximum monthly temperatures are −1.9 °C (January) and 25.5 °C (August), respectively.

2.2. Study Mistletoe and Host Species

The dwarf mistletoe (A. oxycedri) is a small (plant width varies 5–25 cm), dioecious, evergreen plant that can inhabit the same host over several generations and disperses through explosive seed discharges [19,33]. This dwarf mistletoe shows the widest distribution area of the 42 recognized species of Arceuthobium affecting juniper species over 100° of longitude from the western Mediterranean Basin (Spain and Morocco) to central Asia [20].
The common juniper (J. communis) is the most widely distributed gymnosperm species, being found across the whole Northern Hemisphere, in Eurasia and North America [18]. It is an evergreen, slow-growing, shade-intolerant, usually dioecious conifer appearing in harsh environments (continental or cold sites) over all types of soils, particularly on rocky substrates or on soils with low nutrient concentrations [18]. Its radial growth is reduced by low precipitation and soil water availability in dry Mediterranean areas and by low growing-season temperatures in cold boreal regions [34].

2.3. Field Sampling and Measurements of Ring-Width Series

Field sampling was carried out during April 2017 (Aliaga site) and August 2020 (La Ribazada site). Mature junipers with different mistletoe infestation and health class (crown cover percentage) were selected in each site. The crown cover and the infestation degree by mistletoe were visually estimated for each juniper and both were expressed as percentages. Declining junipers were defined as those presenting high infestation degree (5–100% of the crown covered by mistletoe individuals) and low crown cover (10–75%), whereas non-declining junipers presented low infestation degree (0–5% of the crown covered by mistletoe individuals) and high crown cover (80–100%) (Table 1). Recently dead junipers were completely defoliated and preserved bark and abundant remains of dwarf mistletoe. In Aliaga, 15 non-declining, 15 declining and 11 recently dead junipers were sampled. In Ribazada, 20 non-declining, 20 declining and 3 recently dead junipers were sampled (Table 1). The basal diameter and height of junipers were measured using tapes.
We took basal cross-sections of junipers using a hand saw. Wood samples were air dried and carefully sanded with sandpapers of progressively finer grain until annual rings were clearly visible. Then, they were scanned at a resolution of 2400 dpi using an Epson Expression 10000XL scanner (Epson, Suwa, Japan). Two radii per section were visually cross-dated and ring widths were measured to the nearest 0.001 mm from the pith to the bark using the CooRecorder and CDendro software [35]. The quality of the visual cross-dating was checked and controlled by using the software COFECHA (Univ. Arizona, Tucson, AZ, USA), which calculates correlations between ring-width series of the same and different individuals and the mean site series [36].

2.4. Processing Ring-Width Series

To compare growth trends and patterns, mean series of ring width were obtained for declining and non-declining junipers in each site. To calculate climate- and drought-growth relationships for the two juniper health classes (declining and non-declining junipers), ring-width data were detrended and standardized to remove long-term growth trends related to ontogeny or disturbances [37]. This was accomplished by using the software ARSTAN v.44 [38]. Detrending was conducted by fitting 67% cubic smoothing splines with a 50% cutoff frequency. Then, the detrended series were pre-whitened with low-order autoregressive models to remove growth persistence, which is necessary to calculate climate-growth relationships [37]. Individual series of ring-width indices were combined into two series for the two health classes in each site by using a bi-weight robust mean [37]. Dead junipers were not considered because of their low sample size in Ribazada.
To characterize the raw and detrended ring-width series several statistics were calculated including, mean ring width, first-order autocorrelation (a measure of year-to-year persistence in growth), mean sensitivity (a measure of relative changes in width between consecutive rings), and mean correlation among indexed ring-width series [39]. These statistics were calculated over the best-replicated periods (1950–2016 in Aliaga and 1950–2019 in Ribazada). According to the Expressed Population Signal (EPS), a statistic that measures the replication and coherence of mean indexed ring-width series (chronologies), these time spans may be considered well-replicated, since chronologies of the two health classes and sites showed EPS values over 0.85 [40].
To analyze growth responses to climate at the individual level, first ring-width data were transformed into basal area increment (BAI) data assuming concentric growth. This was performed using the bai.out function of the dplR package [41] of the R statistical software [42].

2.5. Climate Data and Drought Index

Since long and homogeneous series of local climate data were not available, we obtained a series of monthly climate data (mean maximum and minimum temperatures, total precipitation) gridded at 1.1 km2 resolution from the E-OBS v. 22.0e database and for the period 1950–2020 [43]. Estimated 0.5°-gridded soil moisture data, corresponding to the upper 10 cm and produced by the ERA-Interim reanalysis were also obtained for the period 1979–2016 [44].
To assess drought severity, we used the 1.1-km2 gridded Spanish database of the Standardized Precipitation and Evapotranspiration Index (SPEI) [45]. The SPEI is a multi-scalar drought index calculated at several temporal resolutions with low and high values corresponding to dry and wet conditions, respectively. Its calculation is based on monthly differences between precipitation and potential evapotranspiration, which depends on temperature [45].

2.6. Statistical Analyses

To compare variables (juniper size and age, ring width) between declining and non-declining junipers, Mann–Whitney tests were used [46]. These tests were also used to compare mean ring-width values between health classes for selected years or periods. Pearson (r) and Spearman (rs) correlations were used to assess relationships among variables. Spearman correlations were used because some variables (crown cover, mistletoe infestation) did not follow a normal distribution. To assess if the SPEI linear trend or slope differed from zero, we used a bootstrapping approach based on 1999 replicates of bootstrapped SPEI slope values, i.e., SPEI slopes calculated on year-SPEI regressions based on random sampling with replacement from the original sample. This allowed calculating approximate 95% bootstrapped confidence intervals of the SPEI slope.
To quantify climate-growth relationships, Pearson correlations were calculated by relating monthly climate variables and mean series of ring-width indices of the two health classes and considering the best-replicated periods (1950–2016 in Aliaga and 1950–2019 in Ribazada). Dead junipers were not included in this analysis because of their low sample size in Ribazada (Table 1). Correlations were calculated from the previous October to the current September and the 0.05 and 0.01 significance thresholds were plotted. Analogously, to calculate drought-growth relationships, Pearson correlations were calculated by relating monthly SPEI values for 1- to 20-month long periods and the four series of ring-width indices.
Since summer precipitation is a major driver of juniper growth in the study area [34], we also calculated moving correlations between the mean series of ring-width indices of the two health classes and summer precipitation considering 20-year intervals. The mean ring-width series of dead junipers were not considered in these analyses because they were not well replicated enough throughout the common period 1950–2016 in both study sites.
To evaluate how junipers’ growth responded to current-year summer precipitation and mistletoe infestation at the individual level, we fitted linear mixed-effects models [47] to log-transformed BAI data using the nlme package in the R software [48]. In these models of growth, individuals were included as a random factor, whilst mistletoe infestation, summer precipitation and their interaction were considered fixed factors. The effect of crown cover was not tested since this variable was inversely related to mistletoe infestation (see Section 3.2). Models were fitted in both sites through maximum-likelihood estimation by reducing the Akaike Information Criterion and considering a first-order (AR1) autocorrelation structure of BAI data [49].

3. Results

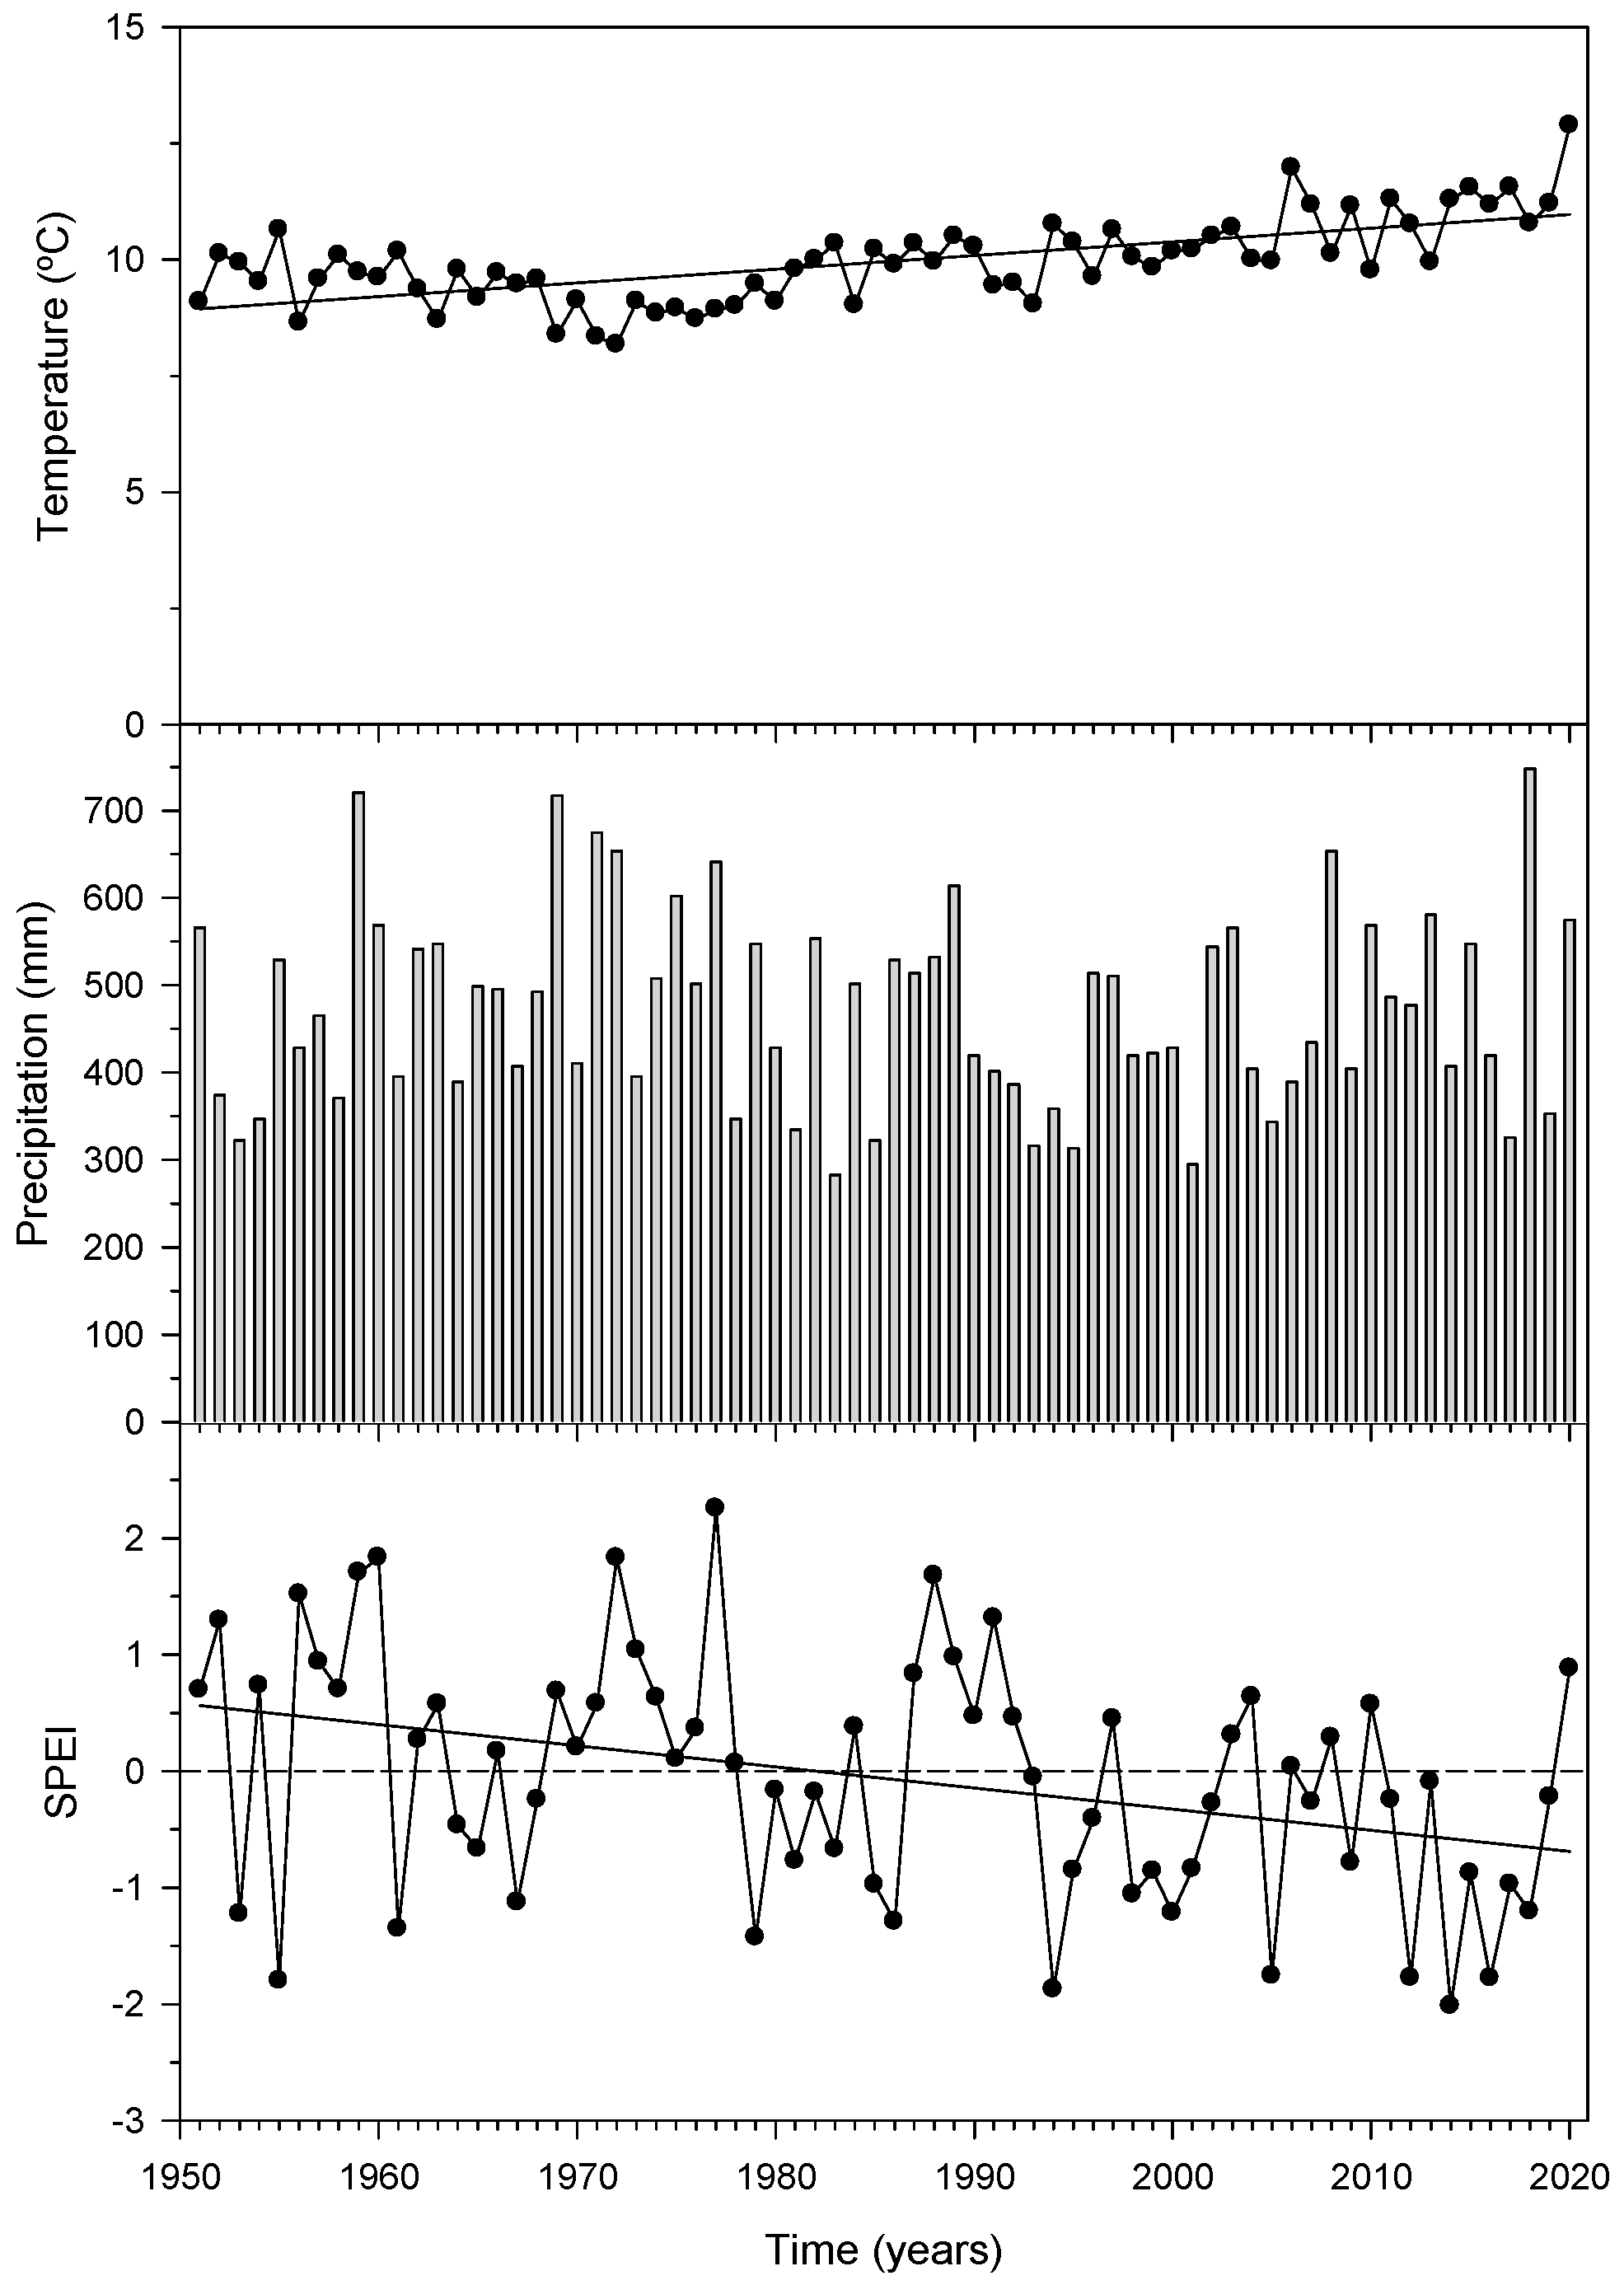
3.1. Temperature, Precipitation and Drought: Trends and Variability

Temperature has significantly risen (r = 0.66, p = 0.0001) in the study area since 1950 at a mean rate of +0.03 °C year−1 (Figure 2). However, precipitation showed a minor negative trend since 1950 onwards (−0.25 mm year−1), which was not significant (p = 0.695).
According to the SPEI, there was a significant negative association between time (years) and the 12-month July SPEI (r = −0.36, p = 0.002) with a mean SPEI trend of −0.018 year−1 (Figure 2), which differed from zero (trend slope 95% bootstrapped confidence intervals = −0.03, −0.01). There were severe droughts (considering those with a SPEI < −1.5), in: 1955 (SPEI = −1.80), 1994 (SPEI = −1.87), 2005 (SPEI = −1.76), 2012 (SPEI = −1.78), 2014 (SPEI = −2.02) and 2016 (SPEI = −1.78). Wet-cold periods with high SPEI values occurred from 1956 to 1960, from 1969 to 1978 and from 1987 to 1992, whereas dry-warm periods with low SPEI values occurred from 1979 to 1983, from 1993 to 1996, from 1998 to 2002, and from 2011 to 2019. The aridification trend (decrease in the SPEI) observed in the study area coincided with a warming trend.

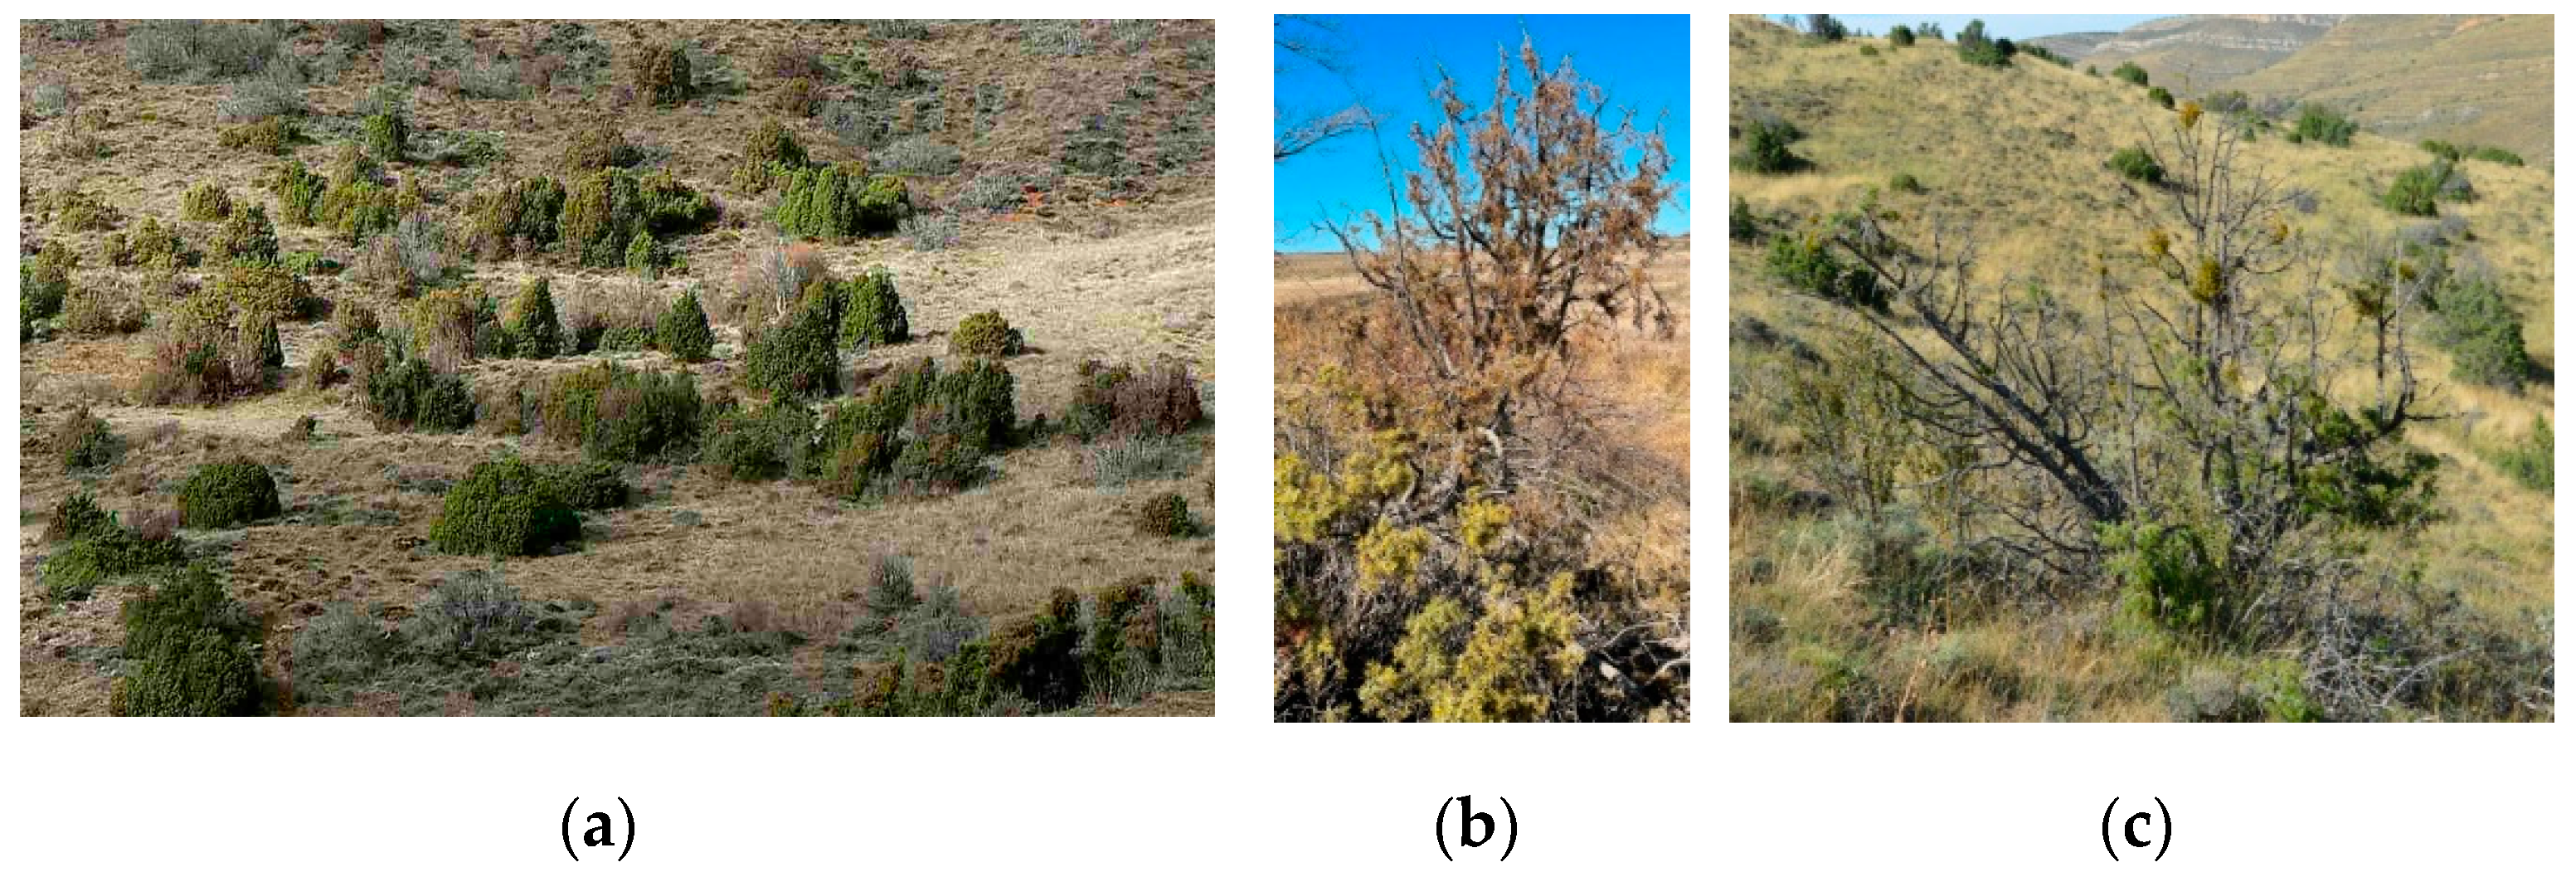
3.2. Junipers’ Features (Size, Health, Age, Growth Rate) and Dwarf Mistletoe Infestation

In both sites, the basal diameter and height of junipers were positively correlated (Aliaga, r = 0.43, p = 0.005, n = 41; Ribazada, r = 0.48, p = 0.002, n = 40). Juniper age was also tightly related to its basal diameter (Aliaga, rs = 0.439, p = 0.005; Ribazada, rs = 0.44, p = 0.004). Crown cover of junipers was inversely related to the dwarf mistletoe infestation (Aliaga, rs = −0.76, p < 0.001; Ribazada, rs = −0.81, p < 0.001). In Aliaga, juniper age and the relative abundance of dwarf mistletoe were positively related (rs = 0.36, p = 0.025); i.e., older junipers tended to be more infested.
In Aliaga and Ribazada the oldest individuals were 126 and 134 years old, respectively. In terms of juniper size or age, only considering the two health classes, we did not find significant differences between groups (Table 1). Neither growth rates (ring widths) nor dendrochronological statistics (first-order autocorrelation, mean sensitivity) differed among juniper health classes either in Aliaga or in Ribazada. In the case of the mean correlation of individual ring-width, it was higher in non-declining junipers from the Aliaga site, but lower in non-declining junipers from the Ribazada site (Table 1). The ring-width mean series of declining and non-declining junipers were well replicated since 1950 onwards, as already mentioned before.

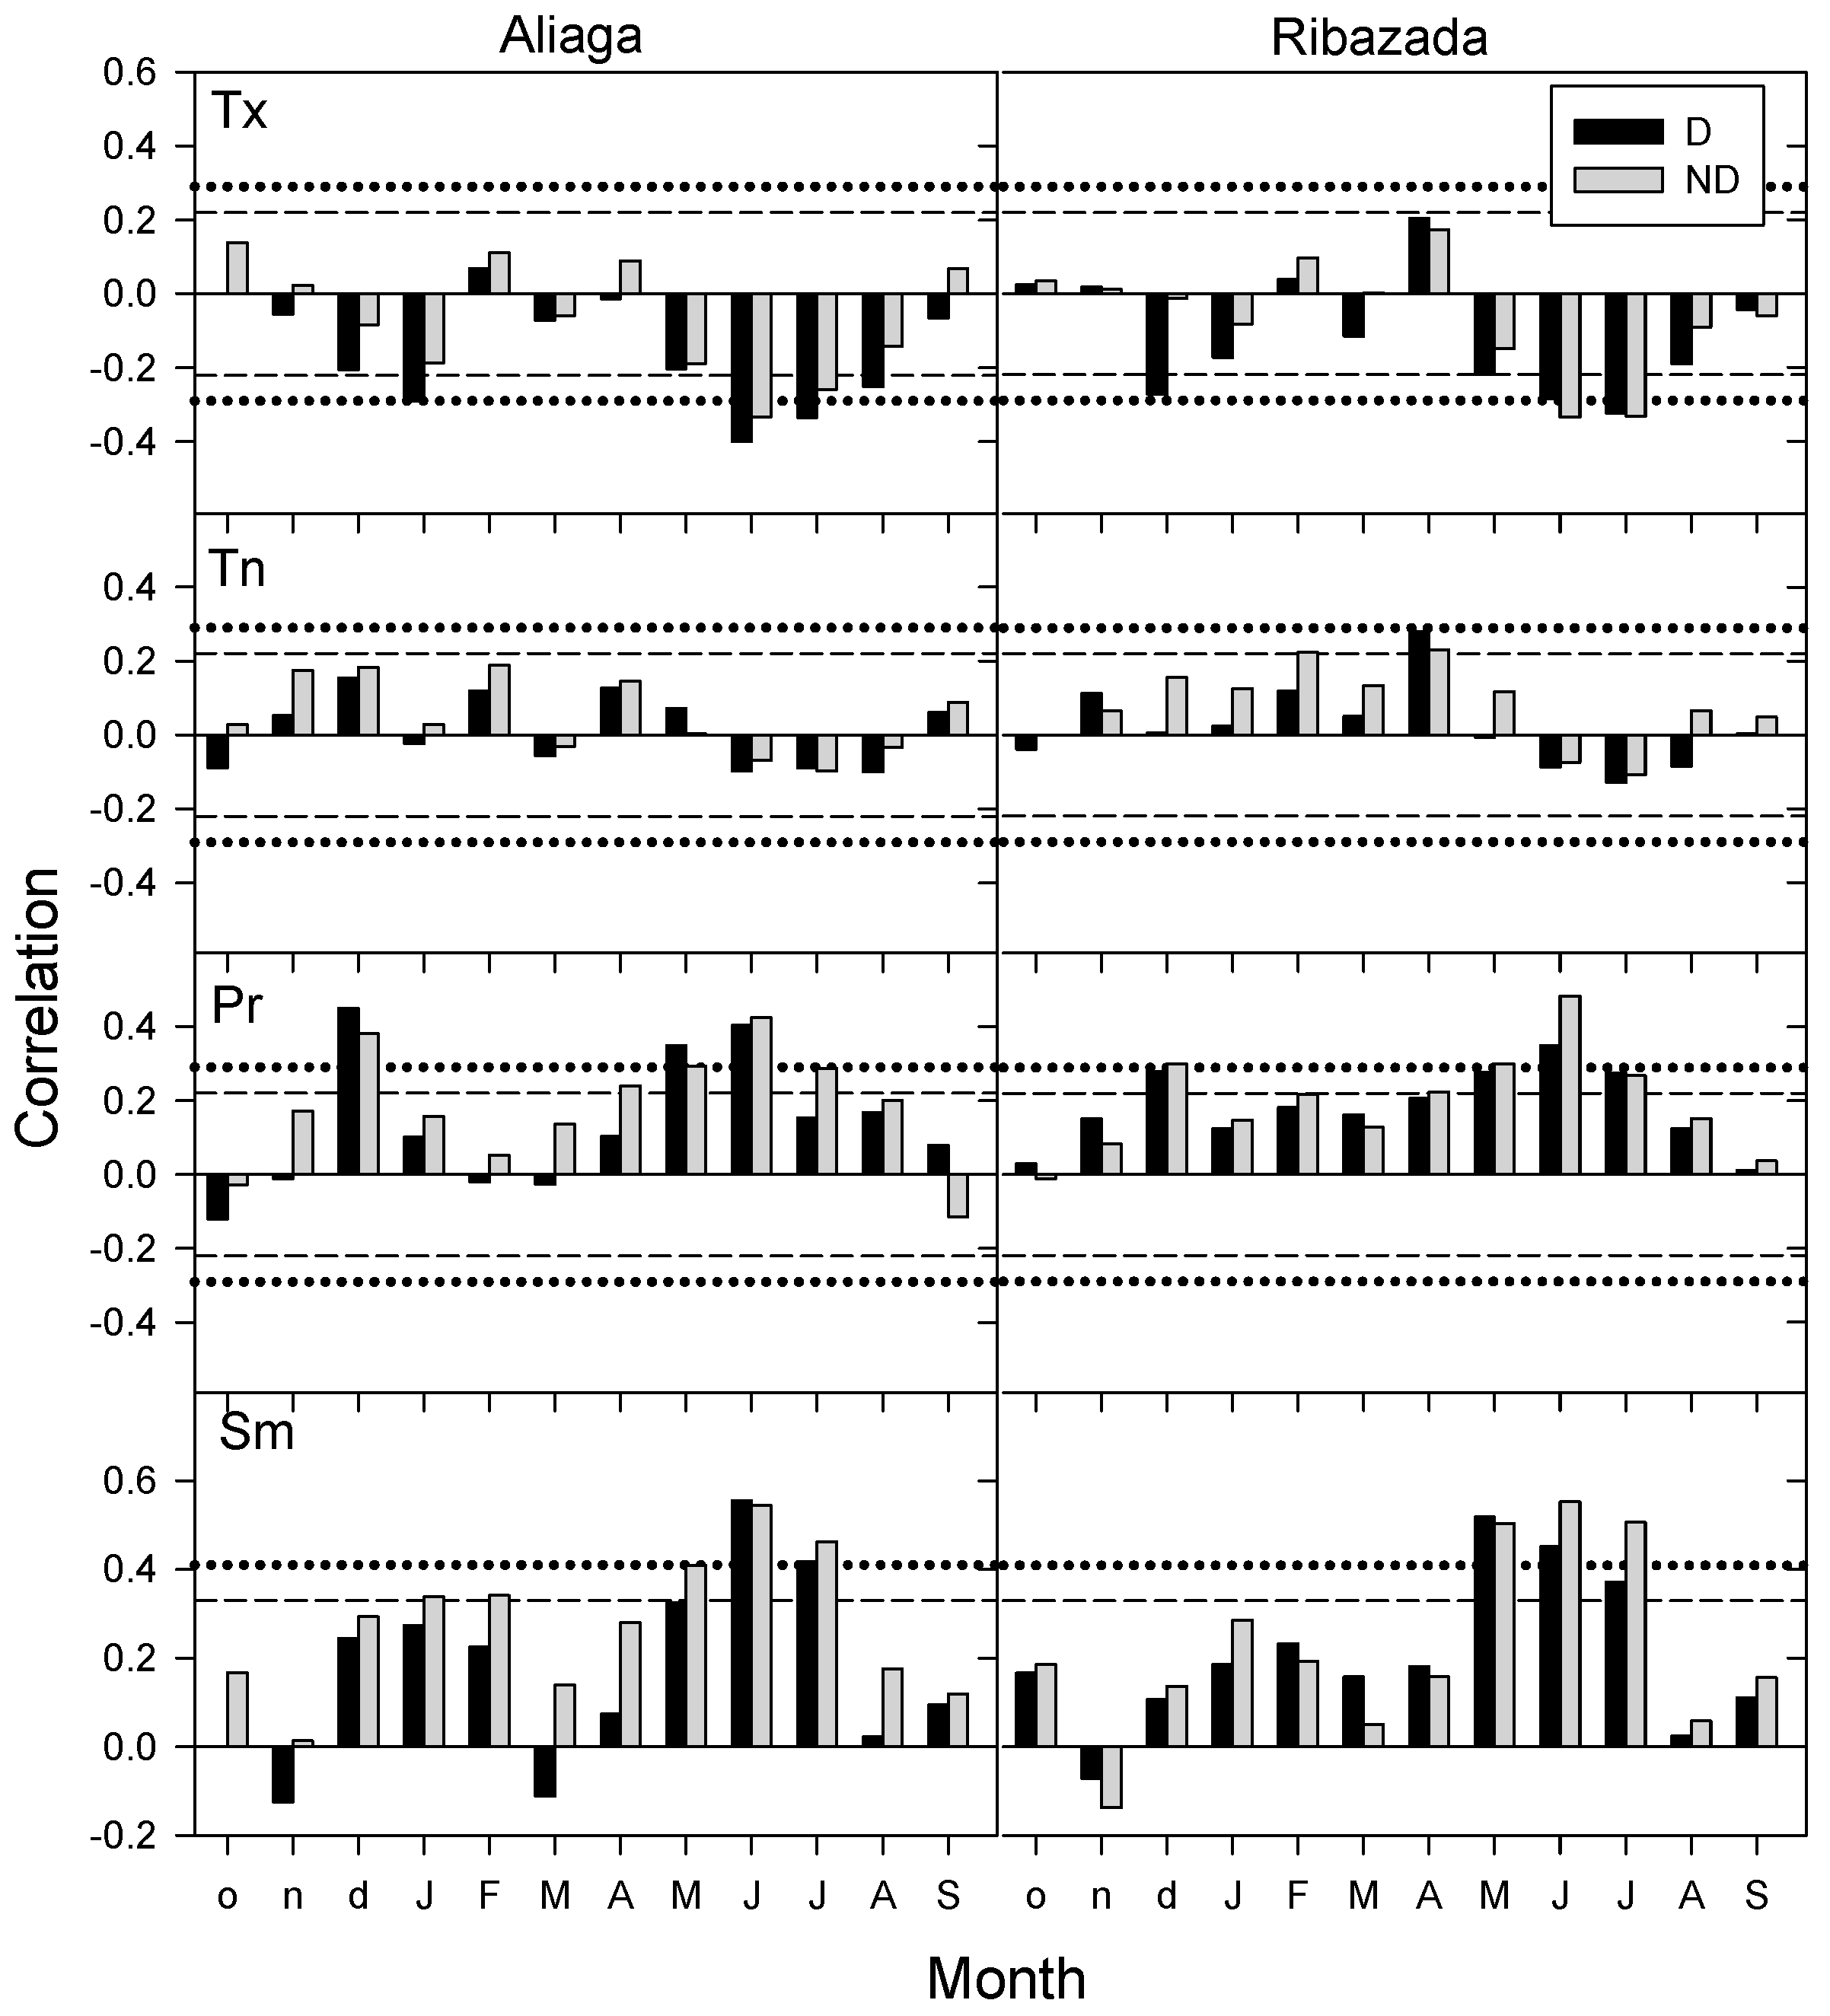
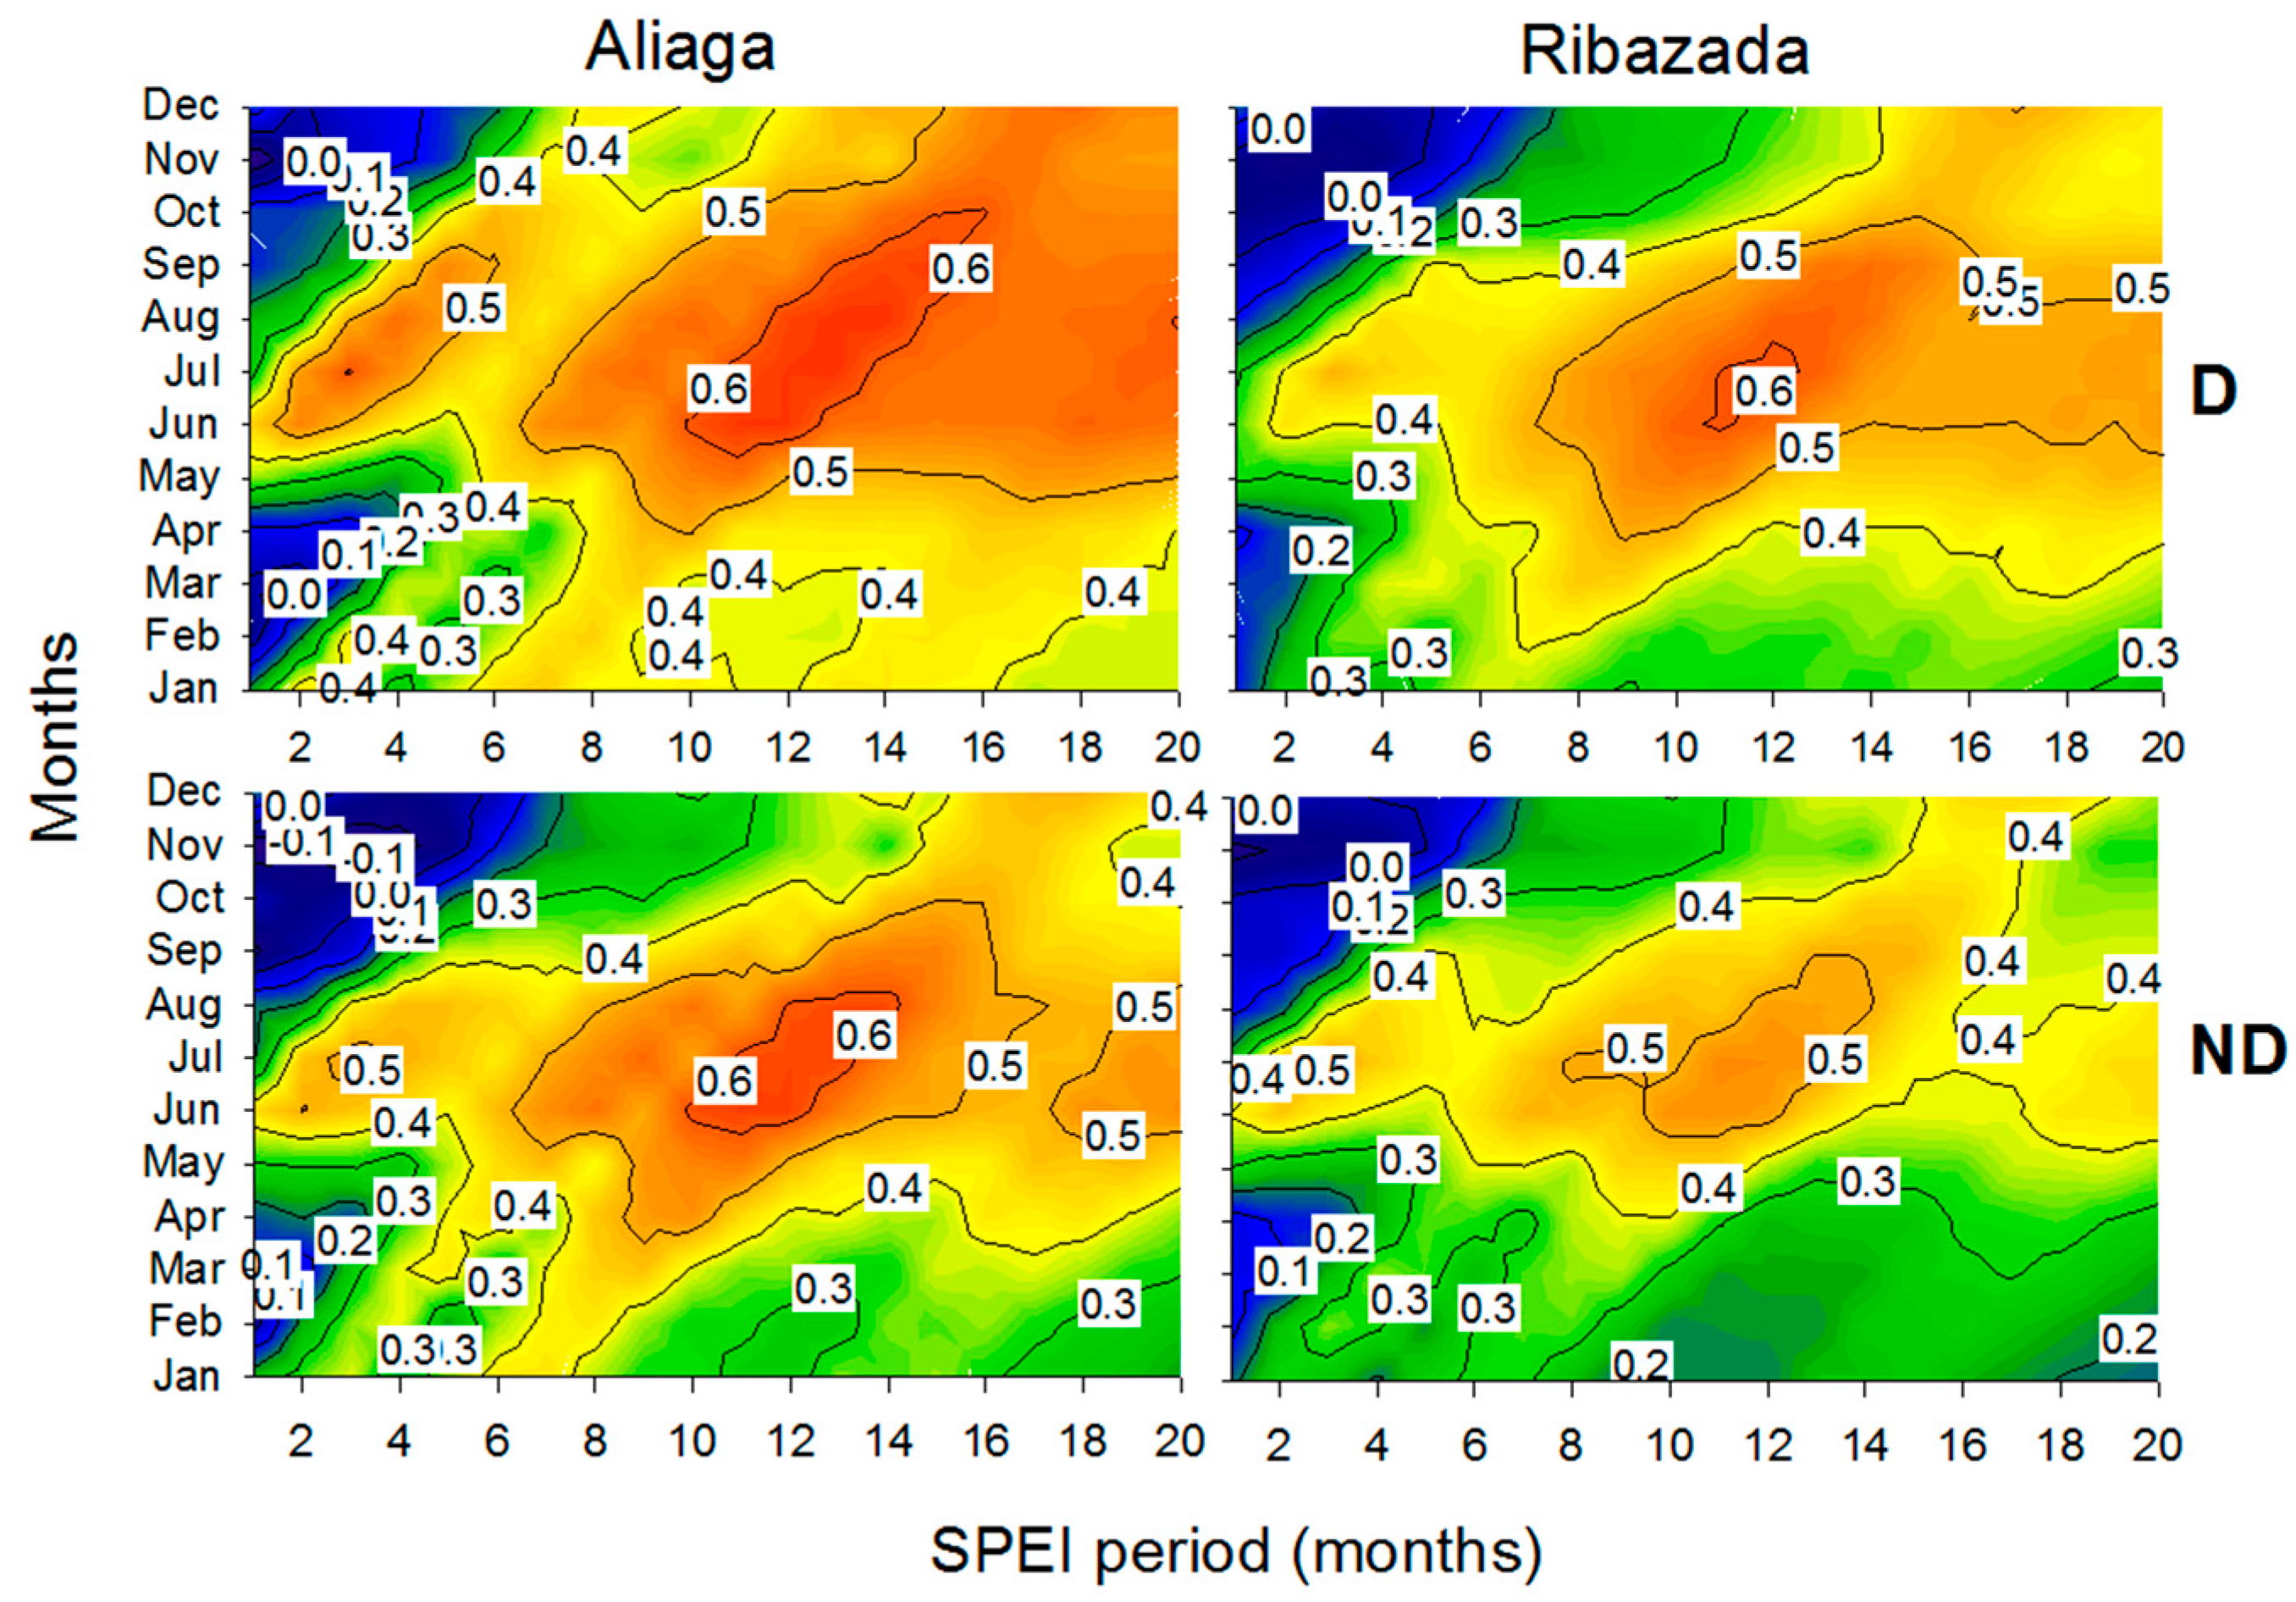
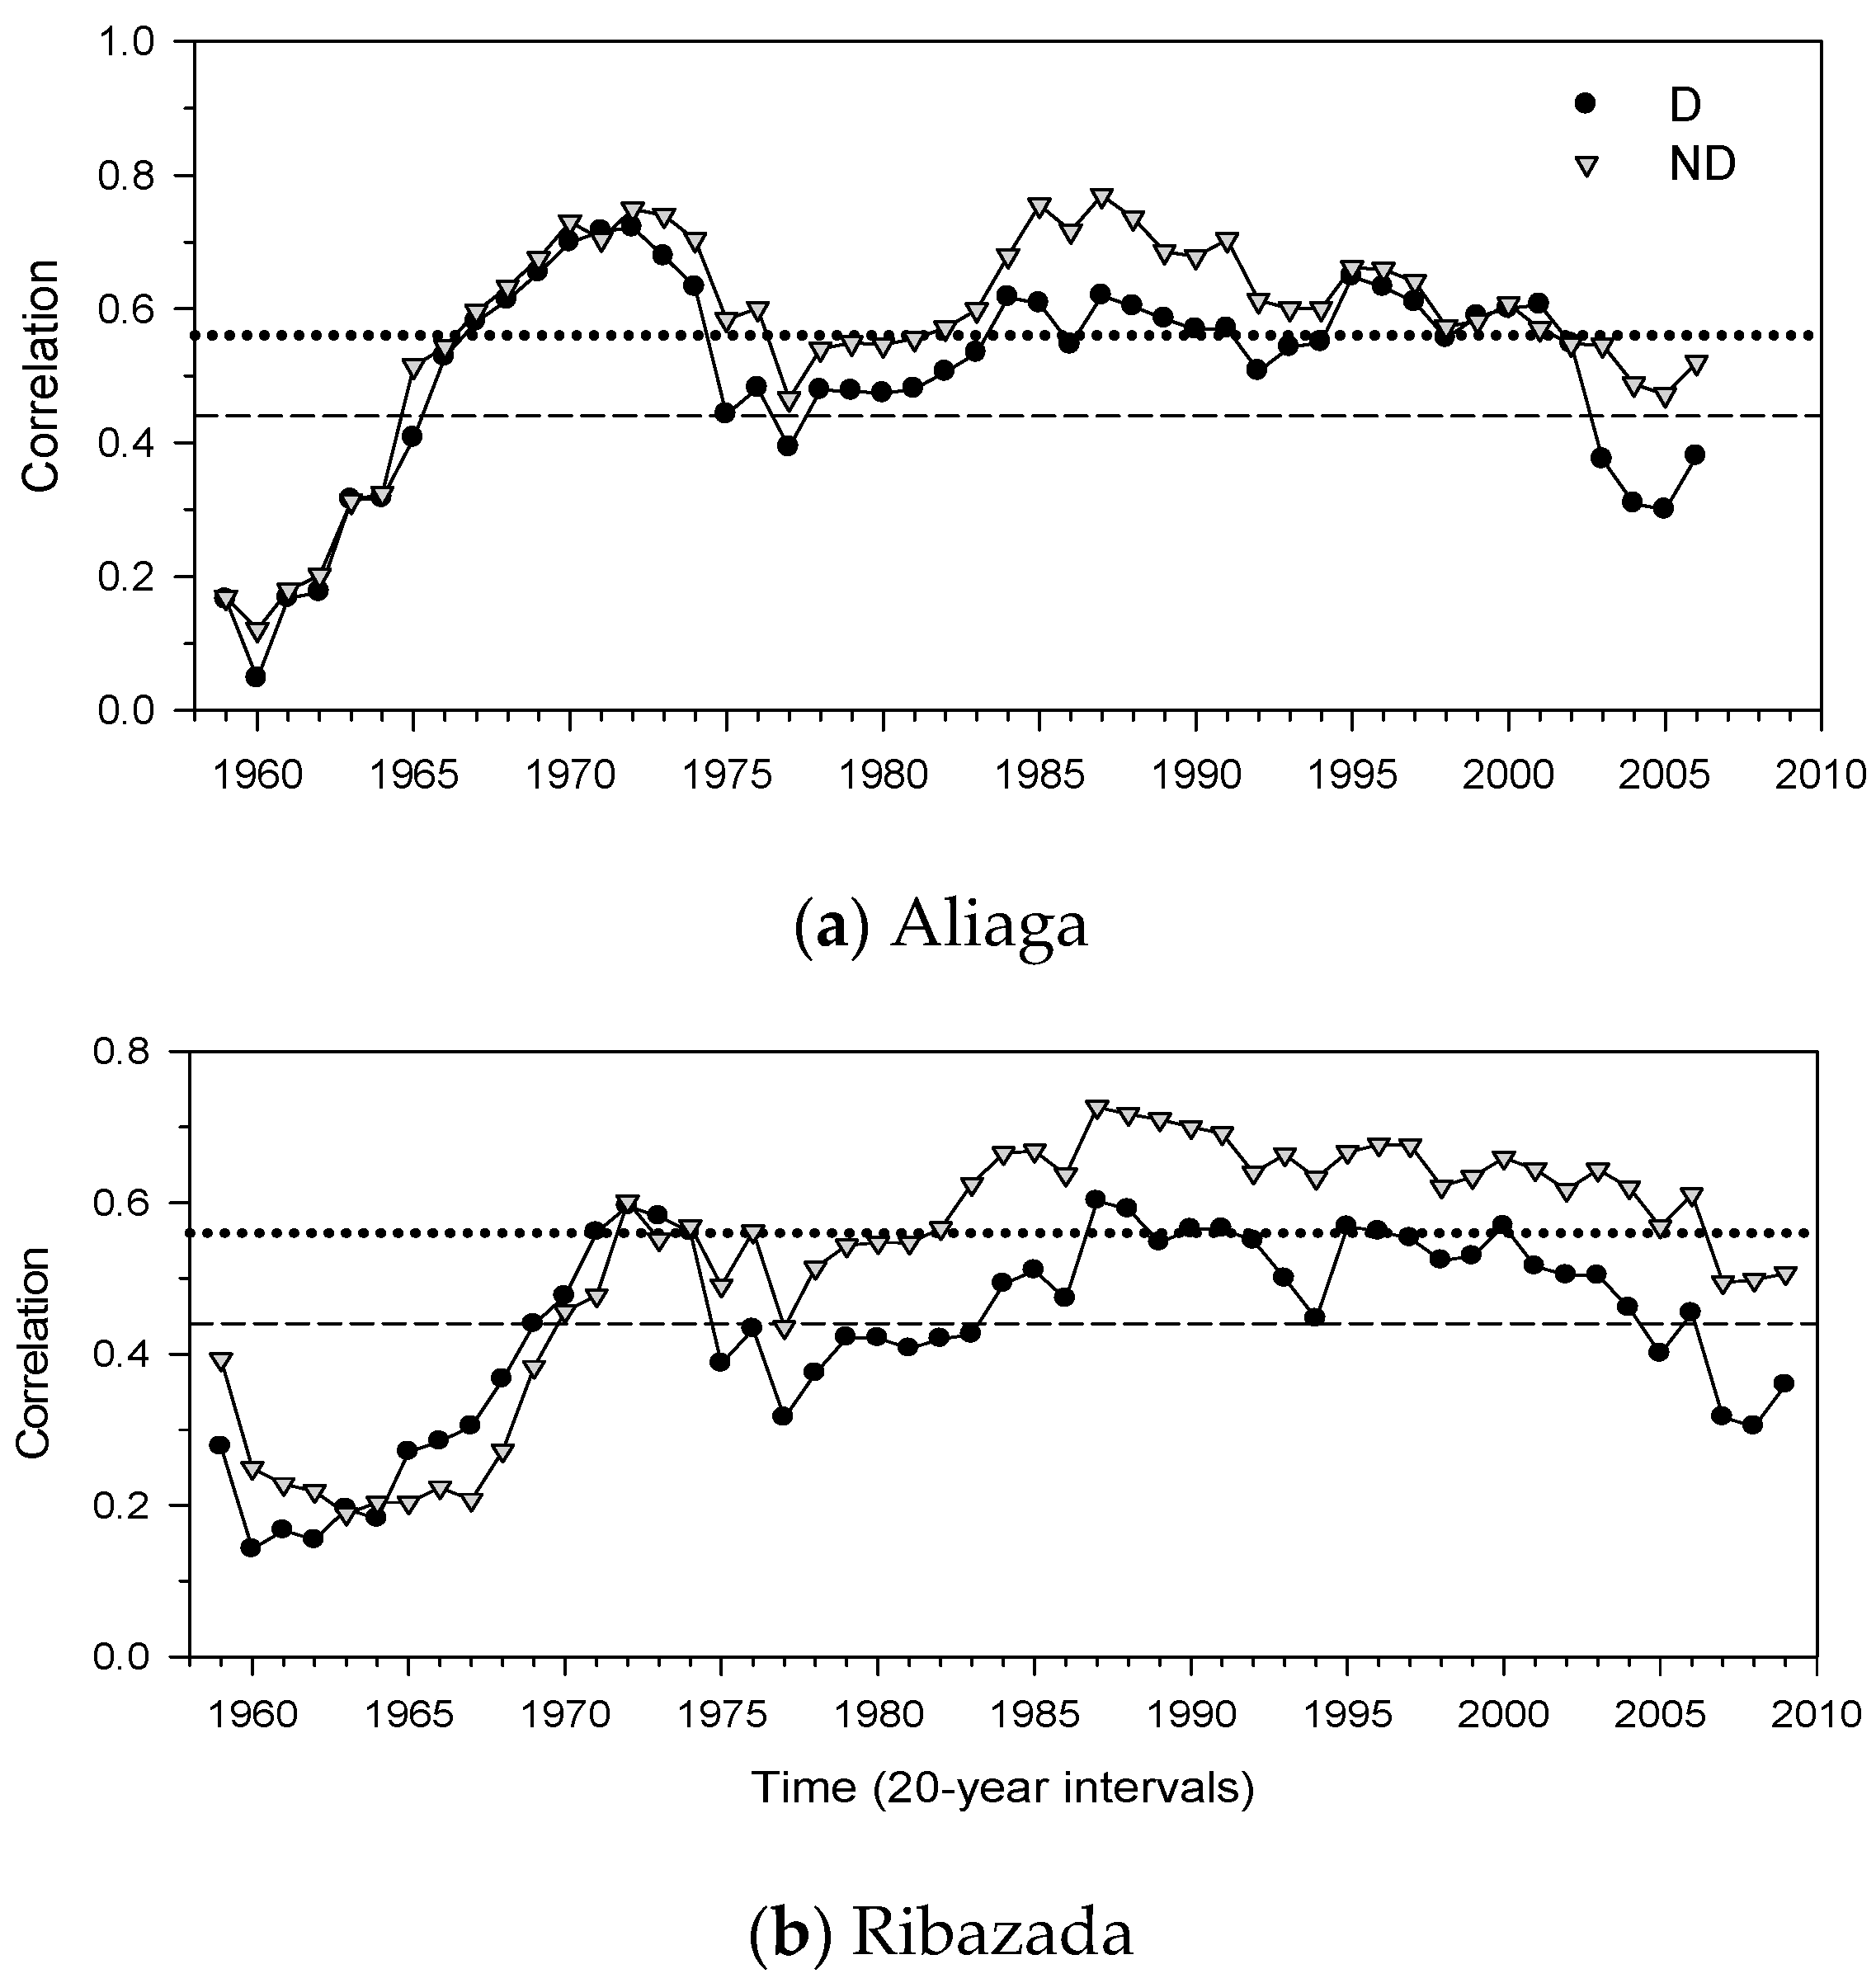
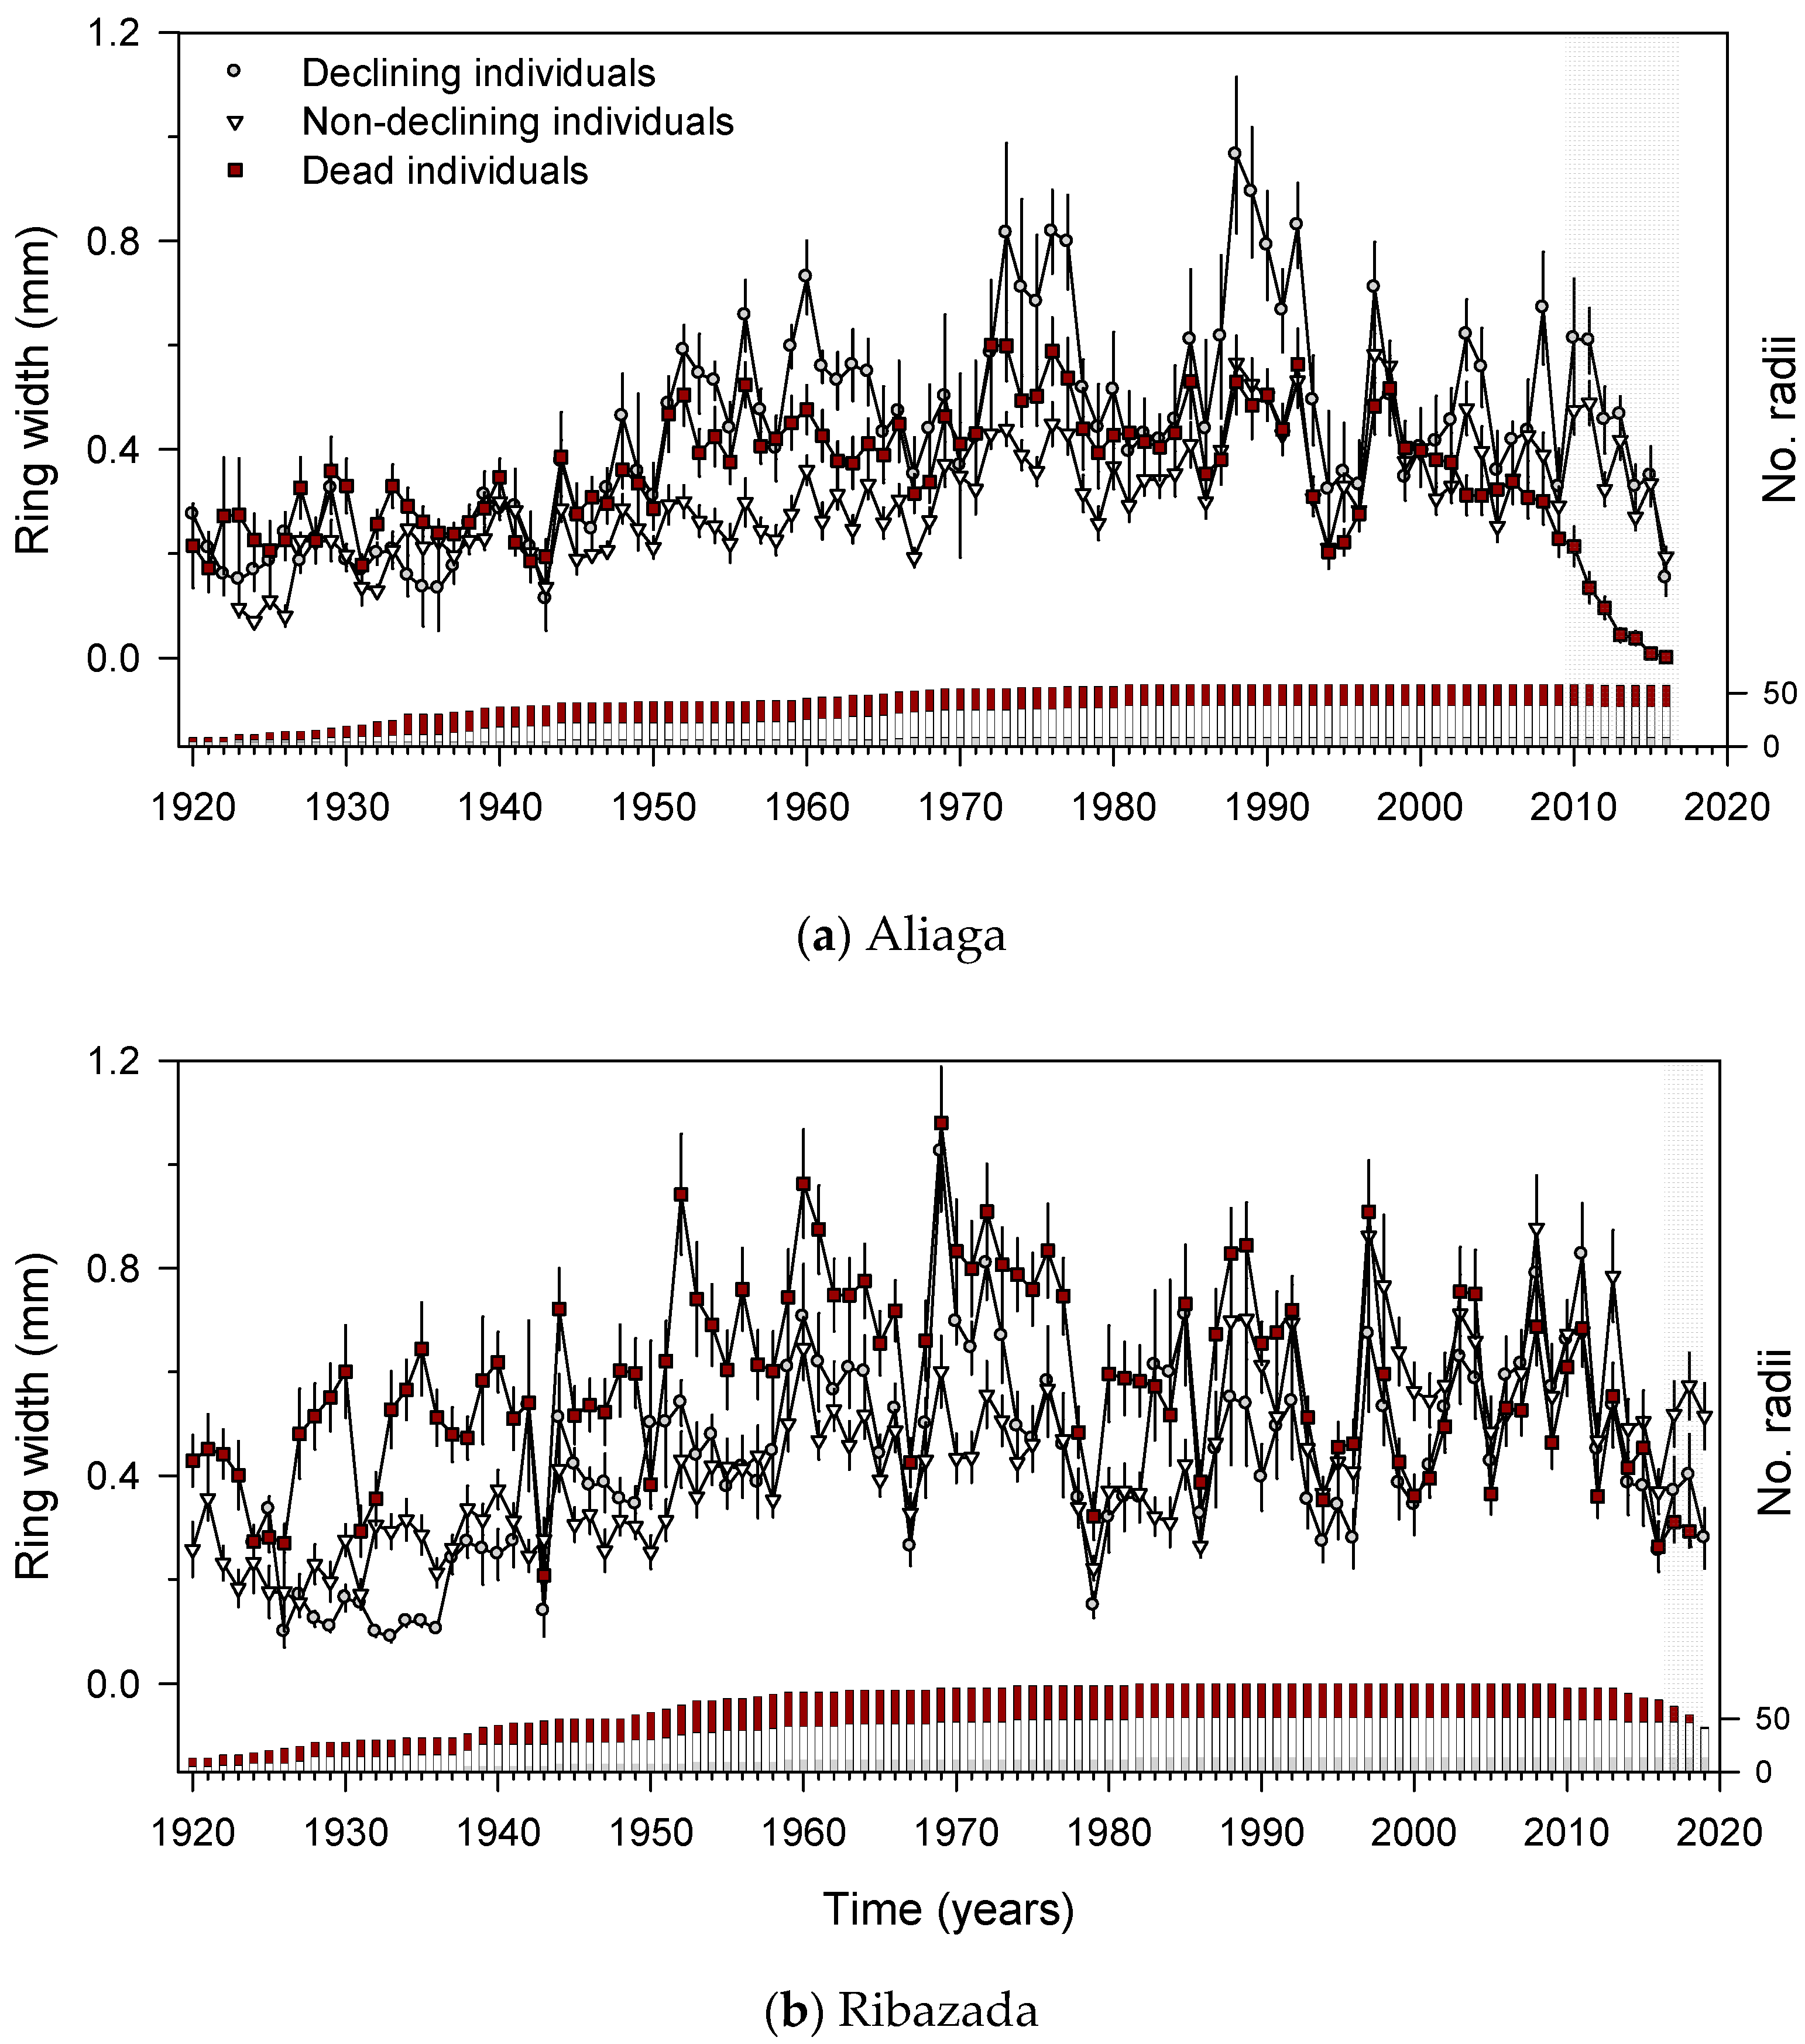
3.3. Growth Patterns and Climate-Growth Relationships

In Aliaga, non-declining junipers significantly (p < 0.05) grew less than declining and dead junipers during the wet 1950s and early 1960s. Then, there was a higher growth rate in declining than in non-declining or dead individuals during the wet 1987–1992 period. From 2010 onwards dead trees grew less than the others, and all junipers showed negative growth trends (Figure 3a). In Ribazada, dead junipers showed the highest growth rates in the past, and declining and dead junipers grew more than non-declining junipers in the early 1970s. Conversely, non-declining junipers grew more in the late 1990s and early 2000s. Finally, non-declining individuals showed a higher growth than declining and recently dead junipers from 2017 to 2019 (Figure 3b).
Cool and wet conditions from May to July, i.e., during the growing season, promoted juniper radial growth (Figure 4). Growth of declining junipers from the Aliaga site was more responsive to warm June-July conditions than in the case of non-declining junipers. Higher precipitation in the prior December and in the current May also enhanced growth more in declining than in non-declining junipers. Conversely, non-declining junipers responded more to higher soil moisture levels in the prior winter (December to February) and the growing season (May, July) than declining junipers.
In the Ribazada site, growth of non-declining junipers responded more to June precipitation and to June–July soil moisture than in the case of declining junipers. Declining junipers responded more positively to April minimum temperatures than non-declining conspecifics. Both in Aliaga and Ribazada, prior warm December–January conditions were associated with low growth rates of declining junipers.
Overall, the highest correlations between juniper growth rate and the SPEI drought index were found from June to September and for 10- to 15-month resolution (Figure 5). We found higher correlations between the SPEI and juniper growth rates in declining than in non-declining junipers in both sites, but the difference was more notable in the Aliaga site. The highest correlation between SPEI and the junipers growth rate (r = 0.65) was found for August considering a 14-month window in the case of declining junipers from the Aliaga site.
Moving correlations showed a higher dependence of juniper growth on summer (June to August) precipitation in non-declining than in declining individuals (Figure 6). In Ribazada, the correlations between summer precipitation and ring-width indices steadily increased since 1950 (p < 0.001). Correlations peaked from the 1980s to the 1990s in both sites.
In Aliaga, linear mixed-effect models showed higher summer precipitation was positively associated to higher juniper growth, whereas in Ribazada the interaction with mistletoe infestation was significant and negatively related to growth (Table 2, Figure 7). The association between higher mistletoe infestation and higher juniper growth in Ribazada could be explained by the higher growth rate of declining junipers in this site (Table 1). The year x infestation interaction also showed a significant negative effect in the Ribazada site meaning that mistletoe infestation reduced juniper growth recently. The infestation x summer precipitation interaction found in Ribazada could be interpreted as a juniper growth reduction as mistletoe infestation and summer precipitation increase (Figure 7). High summer precipitation had a positive effect on growth when mistletoe cover was low, and the negative influence of mistletoe cover on growth dominated any amount of summer precipitation once it exceeded 50%. This interaction was not observed in the drier Aliaga site, where mistletoe infestation alone had no significant effect on growth, and only summer precipitation affected growth.

4. Discussion

As expected, the strongest interactive impact on juniper growth of summer precipitation and mistletoe infestation was observed in the wetter, north-oriented Ribazada site, where juniper growth rates were higher than in the drier, south-oriented Aliaga site. Fast-growing junipers in wetter sites could be more prone to the impact of aridification and dwarf mistletoe infestation. Declining junipers from the drier Aliaga site showed the strongest impact of low summer precipitation on juniper growth and were very responsive to prior-winter and growing-season precipitation and soil moisture. The juniper response to the interaction between summer precipitation and dwarf mistletoe infestation observed in Ribazada suggests that elevated summer precipitation enhanced juniper growth if mistletoe cover was low enough, and the negative influence of mistletoe on radial growth was observed when the infestation degree was very high (above 50% of crown covered by mistletoe). Either declining (in Aliaga) or recently dead (in Ribazada) junipers showing recent infestation by dwarf mistletoe grew more in the past. These findings may be also linked to the higher mistletoe infestation observed in Ribazada and to the higher growth rates of declining vs. non-declining junipers observed in both study sites. The negative effect of low summer precipitation on growth overrides the effects due to mistletoe infestation. The impact of warmer and drier conditions on juniper growth is relevant in the study area where warming and aridification trends since the 1980s could impair shrublands productivity.
Interestingly, junipers showed similar ages in both sites but were larger in the wetter Ribazada site than in the drier Aliaga site. Therefore, fast-growing junipers from wet microsites could reach larger sizes (thicker diameter, taller and wider crowns) than slow-growing junipers from dry microsites, making the former more prone to mistletoe infestation (larger shrubs are able to contain larger populations of dwarf mistletoe). A similar positive interaction between the host size (tree height) and pine mistletoe (V. album) infestation was also observed in Scots pine [14]. Furthermore, it could be speculated that older junipers have also been more exposed to more continuous dwarf mistletoe infestations than younger junipers, but juniper age and mistletoe infestation were only positively related in Aliaga, and we found no differences in age between the two vitality groups. Hence, the positive association between higher mistletoe infestation and juniper size seems not to be mediated by the host age. However, the mistletoe−pine and the dwarf mistletoe−juniper cases are quite different because V. album is mainly dispersed by frugivorous birds and also by direct seed fall, and taller trees could act as better perching sites than shorter trees, whereas A. oxycedri is dispersed through explosive seed discharges [20,33]. In the case of dwarf mistletoe, a larger crown could have a higher probability of being colonized than a smaller crown because A. oxycedrus establishment and growth are favored by well-illuminated crowns, and lead to clustered spatial patterns of infested hosts [19].
The impacts of dwarf mistletoe on the growth of junipers were severe but they were especially observed in recent years, with dead (Aliaga) or declining and dead (Ribazada) junipers showing lower growth rates than non-declining junipers in the last 7 and 3 years, respectively. This recent divergence in growth between juniper health classes usually started after years with reduced growth, corresponding to droughts such as 2009 in Aliaga and 2016 in Ribazada. This post-drought divergence between host health classes and the observed negative association between crown cover and mistletoe infestation highlight again that both stressors act synergistically to reduce wood formation and health in junipers. The mechanisms of these negative impacts on radial growth can be related to the vulnerability of junipers to very warm summer conditions leading to high vapor pressure deficit and low soil moisture in the uppermost soil [6,7,8,9,10,11], the capacity of mistletoe to amplify such evaporative demand reducing the hosts’ water-use efficiency [15,16,28], and the withdrawal of carbohydrates and nutrients from the hydraulic system of infested hosts [32]. Mistletoe infestation can reduce carbon uptake of hosts, which may try to keep stable leaf to sapwood ratios [15] and shift carbon allocation through leaf shedding and branch dieback [29] or by reducing the resources used to build chemical and anatomical defenses [30].
Our analyses exhibit several shortcomings. First, the use of gridded climate data does not allow for a proper evaluation of growth responses to water availability and precipitation. However, long and robust precipitation records are scarce in the case of Mediterranean mountain areas, so using gridded datasets is often the best choice. Second, using a drought index such as the SPEI is based on the estimation of evapotranspiration based on temperature data and other variables. Therefore, considering summer rainfall in models of growth may be a simple but efficient way to deal with such uncertainty related to the SPEI calculation. Third, we used fixed categories of junipers based on their health status (declining, non-declining and dead individuals). However, non-declining individuals can become declining individuals through time, and it is not feasible reconstructing mistletoe infestation dynamics. We can reconstruct growth, but the exact year when infestation started in declining or dead individuals is unknown.
The responsiveness of juniper growth to long droughts and its sensitivity to soil moisture [34] make Mediterranean populations of common juniper prone to show widespread dieback and mortality events in response to warmer temperatures and drier conditions. Infestation by dwarf mistletoe in a wide spectrum of juniper species may exacerbate the negative impacts of drought, particularly in sites where hosts are large and grow more. The interactions between both stressors could trigger local de-shrubification processes or at least of the most abundant juniper species [10], slowing down or reverting successional dynamics in some places by stopping shrub encroachment into abandoned fields or grasslands. If drought and mistletoe infestation interact and slow down these succession dynamics, this would disrupt or even revert the conversion of those formerly managed and exploited landscapes into shrublands and forests. The dieback and death of shrubby junipers would benefit other drought-tolerant woody species such as small shrubs and sub-shrubs (e.g., A. ovalis, G. scorpius) and also widespread grasses (e.g., Brachypodium spp.). We argue that a better understanding of the interactions between increasing drought stress, dwarf mistletoe infestations and hosts’ performance (junipers) is needed to forecast how this hemiparasite could alter Mediterranean shrublands dynamics. This research should be undertaken under current and projected global-change scenarios characterized by warmer conditions and shifting land uses (abandonment of formerly cultivated or grazed lands, shrubland and forest encroachment into abandoned fields, expansion of wild ungulates, etc.). This will enable better management of affected shrub communities in the future.

5. Conclusions

The growth of common juniper in continental-Mediterranean sites was constrained by elevated temperatures and low precipitation leading to drought during the growing season. Infestation by dwarf mistletoe contributed to growth decline and canopy dieback, but the growth reduction was observed in the short term. The interaction between drought and dwarf mistletoe infestation constrained growth, particularly in the north-oriented wetter site, where hosts were larger and presented higher growth rates. Overall, our results indicate that the negative effect of drought on growth overrides the effects due to dwarf mistletoe infestation.

Author Contributions

Conceptualization, E.T., J.J.C., G.S.-B. and J.D.A.; methodology, E.T., J.J.C., G.S.-B. and J.D.A.; software, E.T., J.J.C., G.S.-B. and J.D.A.; validation, J.J.C.; formal analysis, E.T., J.J.C. and J.D.A.; data curation, E.T., J.J.C. and G.S.-B.; writing—original draft preparation, E.T., J.J.C., G.S.-B. and J.D.A.; writing—review and editing, all authors; funding acquisition, J.J.C. and J.D.A. All authors have read and agreed to the published version of the manuscript.

Funding

This research was funded by Ministerio de Ciencia y Tecnología, grant number RTI2018-096884-B-C31. GS-B was supported by a Spanish Ministry of Economy, Industry and Competitiveness Postdoctoral grant (IJC2019-040571-I; FEDER funds). J.D.A is currently supported by a “Ramón y Cajal” contract (RYC-2017-22783) co-funded by the Spanish Ministry of Science, the Agencia Estatal de Investigación and the European Social Fund.

Data Availability Statement

The data presented in this study are available on request from the corresponding author.

Acknowledgments

The authors thank Cristina Valeriano, Antonio Gazol and Pedro Joaquín Sangüesa for their help in laboratory, statistical and field tasks. We acknowledge the E-OBS dataset, and the data providers in the ECA&D project. We thank the constructive comments provide by two reviewers on a previous version of the manuscript.

Conflicts of Interest

The authors declare no conflict of interest. The funders had no role in the design of the study; in the collection, analyses, or interpretation of data; in the writing of the manuscript, or in the decision to publish the results.

References

  1. Giorgi, F.; Lionello, P. Climate change projections for the Mediterranean region. Glob. Planet. Chang. 2008, 63, 90–104. [Google Scholar] [CrossRef]
  2. Cook, B.I.; Anchukaitis, K.J.; Touchan, R.; Meko, D.M.; Cook, E.R. Spatiotemporal drought variability in the Mediterranean over the last 900 years. JGR Atmosph. 2016, 121, 2060–2074. [Google Scholar] [CrossRef] [PubMed]
  3. Sánchez-Salguero, R.; Camarero, J.J.; Gutiérrez, E.; González Rouco, F.; Gazol, A.; Sangüesa-Barreda, G.; Andreu-Hayles, L.; Linares, J.C.; Seftigen, K. Assessing forest vulnerability to climate warming using a process-based model of tree growth: Bad prospects for rear-edges. Glob. Chang. Biol. 2017, 23, 2705–2719. [Google Scholar] [CrossRef] [PubMed]
  4. Camarero, J.J.; Gazol, A.; Sangüesa-Barreda, G.; Oliva, J.; Vicente-Serrano, S.M. To die or not to die: Early-warning signals of dieback in response to a severe drought. J. Ecol. 2015, 103, 44–57. [Google Scholar] [CrossRef] [Green Version]
  5. Gazol, A.; Camarero, J.J. The performance of Mediterranean subshrubs depends more on microsite than on regional climate conditions. J. Veg. Sci. 2012, 23, 1062–1070. [Google Scholar] [CrossRef]
  6. Quero, J.L.; Sterck, F.J.; Martínez-Vilalta, J.; Villar, R. Water-use strategies of six co-existing Mediterranean woody species during a summer drought. Oecologia 2011, 166, 45–57. [Google Scholar] [CrossRef]
  7. Altieri, S.; Mereu, S.; Cherubini, P.; Castaldi, S.; Sirignano, C.; Lubritto, C.; Battipaglia, G. Tree-ring carbon and oxygen isotopes indicate different water use strategies in three Mediterranean shrubs at Capo Caccia (Sardinia, Italy). Trees 2015, 29, 1593–1603. [Google Scholar] [CrossRef]
  8. Baquedano, F.J.; Castillo, F.J. Drought tolerance in the Mediterranean species Quercus coccifera, Quercus ilex, Pinus halepensis and Juniperus phoenicea. Photosynthetica 2007, 45, 229–238. [Google Scholar] [CrossRef]
  9. Gazol, A.; Sangüesa-Barreda, G.; Granda, E.; Camarero, J.J. Tracking the impact of drought on functionally different woody plants in a Mediterranean scrubland ecosystem. Plant Ecol. 2017, 218, 1009–1020. [Google Scholar] [CrossRef]
  10. Camarero, J.J.; Gazol, A.; Sánchez-Salguero, R.; Sangüesa-Barreda, G.; Díaz-Delgado, R.; Casals, R. Dieback and mortality of junipers caused by drought: Dissimilar growth and wood isotope patterns preceding shrub death. Agric. For. Meteorol. 2020, 291, 108078. [Google Scholar] [CrossRef]
  11. Sánchez-Salguero, R.; Camarero, J.J. Greater sensitivity to hotter droughts underlies juniper dieback and mortality in Mediterranean shrublands. Sci. Tot. Environ. 2020, 721, 137599. [Google Scholar] [CrossRef] [PubMed]
  12. McDowell, N.; Pockman, W.T.; Allen, C.D.; Breshears, D.D.; Cobb, N.; Kolb, T.; Plaut, J.; Sperry, J.; West, A.; Williams, D.G.; et al. Mechanisms of plant survival and mortality during drought: Why do some plants survive while others succumb to drought? New Phytol. 2008, 178, 719–739. [Google Scholar] [CrossRef] [PubMed]
  13. Griebel, A.; Watson, D.; Pendall, E. Mistletoe, friend and foe: Synthesizing ecosystem implications of mistletoe infection. Environ. Res. Lett. 2017, 12, 115012. [Google Scholar] [CrossRef]
  14. Sangüesa-Barreda, G.; Linares, J.C.; Camarero, J.J. Drought and mistletoe reduce growth and water-use efficiency of Scots pine. For. Ecol. Manag. 2013, 296, 64–73. [Google Scholar] [CrossRef] [Green Version]
  15. Sala, A.; Carey, E.V.; Callaway, R.M. Dwarf mistletoe affects whole-tree water relations of Douglas fir western larch primarily through changes in leaf to sapwood ratios. Oecologia 2001, 126, 42–52. [Google Scholar] [CrossRef] [PubMed]
  16. Zweifel, R.; Bangerter, S.; Rigling, A.; Sterck, F.J. Pine and mistletoes: How to live with a leak in the water flow and storage system? J. Exp. Bot. 2012, 63, 2565–2578. [Google Scholar] [CrossRef] [Green Version]
  17. Dobbertin, M.; Rigling, A. Pine mistletoe (Viscum album ssp. austriacum) contributes to Scots pine (Pinus sylvestris) mortality in the Rhone valley of Switzerland. For. Pathol. 2006, 36, 309–322. [Google Scholar] [CrossRef]
  18. Adams, R.P. Junipers of the World: The Genus Juniperus; Trafford: Bloomington, IN, USA, 2014. [Google Scholar]
  19. Ramón, P.; De la Cruz, M.; Zavala, I.; Zavala, M.A. Factors influencing the dispersion of Arceuthobium oxycedri in Central Spain: Evaluation with a new null model for marked point patterns. For. Pathol. 2016, 46, 610–621. [Google Scholar] [CrossRef] [Green Version]
  20. Hawksworth, F.G.; Wiens, D. Dwarf mistletoes: Biology, Pathology, and Systematics; Agriculture Handbook No. 450; US Department of Agriculture, Forest Service: Washington, DC, USA, 1996.
  21. Watson, D.M. Mistletoe—a keystone resource in forests and woodlands worldwide. Ann. Rev. Ecol. Evol. Syst. 2001, 32, 219–249. [Google Scholar] [CrossRef] [Green Version]
  22. Ciesla, W.M.; Geils, B.W.; Adams, R.P. Hosts and geographic distribution of Arceuthobium oxycedri. (Revised 2004). RMRS-RN-11. Fort Collins, CO, U.S. Department of Agriculture, Forest Service, Rocky Mountain Research Station. 2002. Available online: http://www.fs.fed.us/rm/pubs/rmrs_rn11/ (accessed on 7 July 2021).
  23. Mathiasen, R.L. Dwarf mistletoes in forest canopies. Northwest Sci. 1996, 70, 61–71. [Google Scholar]
  24. Shaw, D.C.; Chen, J.; Freeman, E.A.; Braun, D.M. Spatial and population characteristics of dwarf mistletoe infected trees in an old growth Douglas-fir western hemlock forest. Can. J. For. Res. 2005, 35, 990–1001. [Google Scholar] [CrossRef] [Green Version]
  25. Quejeiro-Bolaños, M.; Cano-Santana, Z. Growth of Hartweg’s pine (Pinus hartwegii) parasitized by two dwarf mistletoe species (Arceuthobium spp.). Bot. Sci. 2016, 94, 51–62. [Google Scholar] [CrossRef] [Green Version]
  26. Epp, B.; Tardif, J.C. Effects of lodgepole pine dwarf mistletoe, Arceuthobium americanum, on Jack pine, Pinus banksiana, growth in Manitoba. Can. Field Nat. 2004, 118, 595–601. [Google Scholar] [CrossRef] [Green Version]
  27. González-Elizondo, M.; Flores-Villegas, M.Y.; Álvarez-Zagoya, R.; González-Elizondo, M.S.; Mérquez-Linares, M.A.; Quiñonez-Barraza, S.; Howell, B.E.; Mathiasen, R.L. Effects of Mexican dwarf mistletoe (Arceuthobium vaginatum subsp. vaginatum) on the grouth of Pinus cooperi in Durango, Mexico—A case study. For. Pathol. 2018, 49, e12473. [Google Scholar]
  28. Meinzer, F.C.; Woodruff, D.R.; Shaw, D.C. Integrated responses of hydraulic architecture, water and carbon relations of western hemlock to dwarf mistletoe infection. Plant Cell Environ. 2004, 27, 937–946. [Google Scholar] [CrossRef]
  29. Logan, B.A.; Huhn, E.R.; Tissue, D.T. Photosynthetic characteristics of eastern dwarf mistletoe (Arceuthobium pusillum Peck) and its effects on the needles of host white spruce (Picea glauca Voss). Plant Biol. 2002, 4, 740–745. [Google Scholar] [CrossRef]
  30. Klutsch, J.; Erbilgin, N. Dwarf mistletoe infection in Jack pine alters growth-defense relationships. Tree Physiol. 2018, 38, 1538–1547. [Google Scholar] [CrossRef]
  31. Wahid, H.A.; Khan Barozai, M.Y.; Din, M. Dwarf mistletoe (Arceuthobium oxycedri) and damage caused by dwarf mistletoe to family Cupressaceae. Pure Appl. Biol. 2015, 4, 15–23. [Google Scholar] [CrossRef]
  32. Rey, L.; Sadik, A.; Renaudin, S. Trophic relations of the dwarf mistletoe Arceuthobium oxycedri with its host Juniperus oxycedri. J. Plants Physiol. 1991, 138, 411–416. [Google Scholar] [CrossRef]
  33. Ríos-Insua, V. Contribución al estudio de la biología de Arceuthobium oxycedri (DC.) M. Bieb. Bol. San. Veg. Plagas 1987, 13, 53–62. [Google Scholar]
  34. Pellizzari, E.; Camarero, J.J.; Gazol, A.; Granda, E.; Shetti, R.; Wilmking, M.; Moiseev, P.; Pividori, M.; Carrer, M. Diverging shrub and tree growth from the Polar to the Mediterranean biomes across the European continent. Glob. Chang. Biol. 2017, 23, 3169–3180. [Google Scholar] [CrossRef] [PubMed]
  35. Larsson, L.-A.; Larsson, P.O. CDendro and CooRecorder (v. 9.3.1) [Software]; Cybis Elektronik: Saltsjöbaden, Sweden, 2018. [Google Scholar]
  36. Holmes, R.L. Computer assisted quality control in tree ring dating and measurement. Tree Ring Bull. 1983, 43, 69–78. [Google Scholar]
  37. Fritts, H.C. Tree-Rings and Climate; Academic Press: London, UK, 1976. [Google Scholar]
  38. Cook, E.R.; Krusic, P. A Tree-Ring Standardization Program Based on Detrending and Autoregressive Time Series Modeling; with Interactive Graphics; Tree-Ring Laboratory; Lamont Doherty Earth Observatory; Columbia University: New York, NY, USA, 2005. [Google Scholar]
  39. Briffa, K.R.; Jones, P.D. Basic chronology statistics and assessment. In Methods of Dendrochronology: Applications in the Environmental Sciences; Cook, E.R., Kairiukstis, L., Eds.; Kluwer Academic Publishers: Dordrecht, The Netherlands, 1990; pp. 137–152. [Google Scholar]
  40. Wigley, T.M.; Briffa, K.R.; Jones, P.D. On the average value of correlated time series; with applications in dendroclimatology and hydrometeorology. J. Clim. Appl. Meteorol. 1984, 23, 201–213. [Google Scholar] [CrossRef]
  41. Bunn, A.G. A dendrochronology program library in R (dplR). Dendrochronologia 2008, 26, 115–124. [Google Scholar] [CrossRef]
  42. R Core Team. R: A Language and Environment for Statistical Computing; R Foundation for Statistical Computing: Vienna, Austria, 2021. [Google Scholar]
  43. Cornes, R.; van der Schrier, G.; van den Besselaar, E.J.M.; Jones, P.D. An ensemble version of the E-OBS temperature and precipitation datasets. J. Geophys. Res. Atmos. 2018, 123, 9391–9409. [Google Scholar] [CrossRef] [Green Version]
  44. Berrisford, P.; Dee, D.P.; Poli, P.; Brugge, R.; Fielding, M.; Fuentes, M.; Kållberg, P.W.; Kobayashi, S.; Uppala, S.; Simmons, A.; et al. The ERA-Interim Archive, 2nd ed.; ERA Report Series No. 1; Shinfield Park: Reading, UK, 2011. [Google Scholar]
  45. Vicente-Serrano, S.M.; Tomas-Burguera, M.; Beguería, S.; Reig, F.; Latorre, B.; Peña-Gallardo, M.; Luna, M.Y.; Morata, A.; González-Hidalgo, J.C. A high resolution dataset of drought indices for Spain. Data 2017, 2, 22. [Google Scholar] [CrossRef] [Green Version]
  46. Hollander, M.; Wolfe, D.A. Nonparametric Statistical Methods; J. Wiley: New York, NY, USA, 1973. [Google Scholar]
  47. Venables, W.N.; Ripley, B.D. Modern Applied Statistics with S; Springer: Berlin/Heidelberg, Germany, 2002. [Google Scholar]
  48. Pinheiro, J.; Bates, D.; DebRoy, S.; Sarkar, D.; R Core Team. nlme: Linear and Nonlinear Mixed Effects Models. R Package Version 3.1-151. 2020. Available online: https://CRAN.R-project.org/package=nlme (accessed on 19 October 2020).
  49. Zuur, A.; Ieno, E.N.; Walker, N.; Saveliev, A.A.; Smith, G.M. Mixed Effects Models and Extensions in Ecology with R; Springer: New York, NY, USA, 2009. [Google Scholar]
Figure 1. Views of (a) a common juniper population affected by dwarf mistletoe with abundant dead or declining individuals, and junipers (b) moderately and (c) severely infected by dwarf mistletoe.
Forests 12 01199 g001
Figure 2. Annual climate (mean temperature and total precipitation) and drought trends and variability observed in the study area. The presented SPEI corresponds to July and it was calculated considering a 12-month temporal resolution. The continuous lines correspond to linear regressions fitted to temperature and SPEI data.
Forests 12 01199 g002
Figure 3. Growth data of junipers in the (a) Aliaga and (b) Ribazada study sites considering three health classes. Values are means ± SE. Growth rates differed significantly (p < 0.05) among health classes in the periods highlighted by grey shading. The bars show the number of junipers analyzed per year (right y axes) using the same fill colors as ring-width mean series.
Forests 12 01199 g003
Figure 4. Climate-growth relationships based on Pearson correlations calculated between series of ring-width indices of declining (D) and non-declining (ND) junipers vs. monthly climate variables (Tx, mean maximum temperature; Tn, mean minimum temperature; Pr, precipitation; Sm, soil moisture). Correlations were calculated from previous October to current September with months abbreviated by lowercase and uppercase letters corresponding to the prior and growth years, respectively. Dashed and dotted horizontal lines show the 0.05 and 0.01 significance levels, respectively.
Forests 12 01199 g004
Figure 5. Drought-growth relationships based on Pearson correlations calculated between series of ring-width indices of declining (D) and non-declining (ND) junipers vs. monthly data of the SPEI drought index calculated at 1- to 20-month long periods (x axes).
Forests 12 01199 g005
Figure 6. Moving climate-growth Pearson correlations calculated between series of ring-width indices of declining (D) and non-declining (ND) junipers vs. summer precipitation considering 20-year intervals. The correlation values are plotted for the 10th correlation of each 20-year interval (e.g., the correlation value plotted in 1959 corresponds to the 1950–1969 interval). Dashed and dotted horizontal lines show the 0.05 and 0.01 significance levels, respectively.
Forests 12 01199 g006
Figure 7. Interactive effects of mistletoe infestation or cover and summer precipitation (log-transformed values) on radial growth (color scale, log-transformed basal area increment) of junipers as predicted by the linear mixed-effects models fitted to data from the Ribazada site.
Forests 12 01199 g007
Table 1. Size and growth data of sampled junipers. Mistletoe infestation refers to the percentage of the juniper crown covered by mistletoe individuals. Values are means ± SE. Different letters indicate significant (p < 0.05) differences between health classes within each site according to Mann–Whitney tests.
VariablesAliagaRibazada
Declining IndividualsNon-Declining IndividualsDead IndividualsDeclining IndividualsNon-Declining IndividualsDead Individuals
No. measured individuals/radii15/2815/2911/2220/4020/363/6
Basal diameter (cm)4.9 ± 1.64.4 ± 1.44.7 ± 1.08.1 ± 3.07.7 ± 2.09.4 ± 3.2
Height (m)1.56 ±0.361.64 ± 0.281.81 ± 0.392.58 ± 0.482.81 ± 0.583.10 ± 0.46
Age (years)83 ± 478 ± 682 ± 482 ± 579 ± 577 ± 5
Crown cover (%)45.0 ± 21.9 b96.0 ± 6.0 c0.0 ± 0.0 a34. 2 ± 12.0 b93. 8 ± 5.0 c0.0 ± 0.0 a
Mistletoe infestation (%)26.0 ± 7.8 b1.0 ± 0.0 a31.4 ± 8.09 b38.0 ± 10.1 b0.9 ± 0.1 a40.0±0.00 b
Ring width (mm) 10.39 ± 0.040.34 ± 0.030.39 ± 0.060.56 ± 0.040.50 ± 0.030.52 ±0.05
First-order autocorrelation 10.67 ± 0.060.57 ± 0.060.61 ± 0.050.55 ± 0.030.54 ± 0.020.55 ± 0.06
Mean sensitivity 10.35 ± 0.020.37 ± 0.020.34 ± 0.020.42 ± 0.010.39 ± 0.020.39 ± 0.03
Correlation among series (rbar) 10.23 ± 0.02 a0.34 ± 0.03 b0.19 ± 0.01 a0.30 ± 0.02 b0.25 ± 0.01 a0.29 ± 0.01 b
Time span1908–20161923–20161894–20161886–20191907–20191931–2016
Best-replicated time span 21943–20161944–20161946–20161943–20191939–20191942–2016
1 Calculated over the best-replicated time span. 2 Period with Expressed Population Signal > 0.85.
Table 2. Summary of the main statistics characterizing the selected linear mixed-effects models fitted to juniper growth (basal area increment) as a function of year, mistletoe infestation, summer precipitation and interactions.
VariableSlope SEt valuep
AliagaRibazadaAliagaRibazadaAliagaRibazadaAliagaRibazada
Intercept−33.28−8.620.710.51−46.85−16.94<0.01<0.01
Year0.020.010.010.0148.1617.39<0.01<0.01
Mistletoe infestation−0.010.040.030.02−0.352.290.730.03
Summer prec.0.010.010.010.012.2212.850.03<0.01
Year x infestation0.01−0.010.010.010.52−2.290.610.02
Infestation x summer prec.−0.01−0.010.010.01−0.93−3.540.35<0.01
Publisher’s Note: MDPI stays neutral with regard to jurisdictional claims in published maps and institutional affiliations.

