Article

Correlation of Studies between Colour, Structure and Mechanical Properties of Commercially Produced ThermoWood® Treated Norway Spruce and Scots Pine

by
Petteri Torniainen
1,2,
Carmen-Mihaela Popescu
3,4,
Dennis Jones
2,5,*,
Alexander Scharf
2 and
Dick Sandberg
2,5
1
Finotrol Oy, Teollisuuskatu 3-5, FI-50130 Mikkeli, Finland
2
Department of Engineering Sciences and Mathematics, Wood Science and Engineering Division, Luleå University of Technology, Forskargatan 1, SE-93187 Skellefteå, Sweden
3
Petru Poni Insitute of Macromolecular Chemistry, 41A Grigore Ghica Voda Alley, 700487 Iasi, Romania
4
Centre for Wood Science and Technology, Edinburgh Napier University, 7 Hills Business Park, 37 Bankhead Crossway South Sighthill, Edinburgh EH11 4EP, UK
5
Department of Forestry and Biomaterials, Czech University of Life Sciences Prague, Suchdol, 16500 Prague, Czech Republic
*
Author to whom correspondence should be addressed.
Forests 2021, 12(9), 1165; https://doi.org/10.3390/f12091165
Submission received: 16 July 2021 / Revised: 18 August 2021 / Accepted: 25 August 2021 / Published: 28 August 2021
(This article belongs to the Special Issue Thermal Modification of Wood: Process and Properties)

Abstract

:
The thermal modification of wood has become the most-commonly commercialised wood modification process globally, with the ThermoWood® process currently being the most dominant. As with all commercial processes, there is a need to have a robust quality control system, with several small–scale studies undertaken to date investigating quality control using a range of analytical methods, culminating in a multi-year assessment of colour as a means of quality control. This study, as an extension to this multi-year assessment, further explores the colour of Norway spruce and Scots pine commercially modified by the ThermoWood® S and D processes, respectively, along with the mechanical properties and structural characterisation by Fourier transform infrared (FT–IR) spectroscopy and principal component analysis (PCA) to ascertain further correlations between colour and other measurable properties. Infrared spectroscopy indicated modifications in the amorphous carbohydrates and lignin, whereas the use of PCA allowed for the differentiation between untreated and modified wood. Colour measurements indicated reduced brightness, and shifting toward red and yellow colours after thermal modification, hardness values decreased, whereas MOE and MOR values were similar for modified wood compared to unmodified ones. However, by combining the colour measurements and PC scores, it was possible to differentiate between the two modification processes (Thermo–S and Thermo–D). By combining the mechanical properties and PC scores, it was possible to differentiate the untreated wood from the modified ones, whereas by combining the mechanical properties and colour parameters, it was possible to differentiate between the three groups of studied samples. This demonstrates there is a degree of correlation between the test methods, adding further confidence to the postulation of using colour to ensure quality control of ThermoWood®.

1. Introduction

As a natural renewable resource, wood is in general a non-toxic, easily accessible, and inexpensive biomass–derived material. Nevertheless, as wood is a natural product that originates from different individual trees, limits are imposed on its use, and the material needs to be transformed to acquire the desired functionality. Since the significant developments undertaken between 1980 and 2000 into research data derive as far back as the 1940s, methods associated with wood modification have been implemented and commercially developed to improve its intrinsic properties, produce new materials, and acquire a form and functionality desired by engineers without changing the eco-friendly characteristics of the material.
Therefore, wood modification has become the chosen method used to overcome some of its perceived weak points that are mainly related to low resistance to bio–deterioration against fungi, insects, termites, marine borers, moisture sensitiveness, low dimensional stability, low hardness and wear resistance, low resistance to UV irradiation and weathering in general, and aesthetic properties. This increased interest in wood modification has led to several key publications [1,2,3].
The bulk of recently commercialised wood modification processes has occurred in Europe [4], with particular focus on thermal modification. Industrial thermal modification processes typically aim at improving the biological durability of less durable wood species and enhancing the dimensional stability of the wood or wood-based products. Stamm et al. made the first systematic attempts to increase the resistance to wood-destroying fungi by heating wood beneath the surface of molten metal, showing that heating Sitka spruce to between 140 and 320 °C resulted in reduced swelling, improved dimensional stability, and increased resistance to microbial attack [5]. The success of the method was, however, limited, and the work was extended with a focus on different gaseous atmospheres by Thunell and Elken [6], and with heating beneath molten metal by Buro [7,8]. However, much of the commercial activity in thermal modification has been derived from the research of Burmester [9,10,11,12], and these pioneering works have been the basis of several successful thermal-modification processes. In 1990, the Finnish Research Centre VTT together with the Finnish industry developed the ThermoWood® process, which was established as an industrial process for the improvement of wood properties [13,14,15]. This process was officially launched by the ThermoWood Association in 2000, with the introduction of the treatment classes Thermo-S and Thermo-D. In parallel to the establishment of the ThermoWood® process, there have been other commercial developments across Europe, including the Netherlands [16,17,18], France [19,20,21], Germany [22,23] and Denmark [24].
One of the most common characteristics reported for thermal modification is the darkening of the colour of treated wood, which is a result of the degradation of products formed during the thermal modification. Studies have shown the importance of radicals to the formation of colour [25], with high correlation between colour and the levels of degradation of hemicelluloses and lignin having also been reported [26]. Further studies [27] found correlations with both types of softwood hemicelluloses, namely, glucomannan and xylan. Both temperature and treatment time have an effect on the wood colour [28]. It has also been reported that colour formation is affected by the presence of air during the thermal modification of maritime pine and eucalyptus (Eucalyptus globulus Labill.) wood [26] and by moisture content in Norway spruce at 200 °C [29] or during the thermal modification process [30] when treating Norway spruce and Scots pine under pressurised and superheated steam.
Early studies have suggested that colour measurement can be used as a quality control measure. For example, Sullivan [31] gave an overview of wood colour measurement and investigated various influencing factors. Other studies have shown a relationship between colour measurements and the different properties of thermally modified wood. Kamperidou and Barmpoutis [32] suggested a reasonably good relationship be-tween lightness (L*) parameter values and measured bending or impact bending strength of thermally treated Scots pine wood. As a result, it was postulated that the mechanical strength of thermally treated Scots pine under the specific conditions (in the presence of oxygen) could be determined by measuring only the colour brightness of the wood surface. This would provide considerable savings in terms of both time and material, given the non-destructive nature of the measurement. Brischke et al. [33] suggested that there was a linear correlation between the measured colour data and the thermal modification intensity for Norway spruce, Scots pine, and European beech, which was confirmed by Pleschberger et al. [34] for spruce and ash. Sikora et al. [35] considered the relationship between colour and chemical composition of spruce and oak at temperatures between 160 and 210 °C, whereas various commercial treatments (ThermoWood®, Plato®, and Retification) of Scots pine were considered by Sivrikaya et al. [36] in order to compare colour changes and VOC composition.
More recently, the potential of using colour parameters as a quality control system for wood modified by the ThermoWood® process was suggested [37], with these results forming an essential part of the current quality control system applied by the International ThermoWood Association [38], and supported by a multi-year evaluation of colour data of industrially produced ThermoWood® [39].
The issue of quality control is an integral part of commercial development to ensure declared properties are continually met. The same is true for thermally modified wood, which is made more confusing given the vast number of thermal modification procedures that are currently available on the market [40]. There have been several attempts to assess various quality control methods for thermally modified wood [41], though several methods are seen as unsuitable for commercial applications given the destructive nature of the test. In order to undertake more extensive evaluations, a “group method of data handling (GMDH)” neural network was applied to western hemlock that underwent thermal modification between 170 and 230 °C [42]. Once trained, the neural network was used to predict a variety of properties, with predictions more accurate for chemical properties (e.g., equilibrium moisture content, swelling, and water adsorption) than for physical properties (e.g., MOE and hardness).
However, it is imperative to ensure the method selected is supported by assessment and approval through an external certification institute. Among more recent assessment methods for predicting the quality of thermally modified wood has been the use of light polarisation [43], which was partly based on earlier work by Niskanen et al. [44] using the effective refractive index of unmodified and thermally modified wood via an immersion liquid method.
The changes that occur in wood at temperatures below 40 °C are mainly attributed to physical changes such as the emission of water and volatile extractives (i.e., terpenes) [45]. Some minor chemical changes probably start to occur in the interval of 40–90 °C, predominately due to certain extractives. It has been mentioned that temperatures higher than 140 °C induce changes in physical or mechanical properties in wood structure, which are correlated with the chemical transformations in its cellulose, hemicellulose, and lignin components, as well as extractives. These take place through a series of oxidation, hydrolysis, and/or decarboxylation reactions coupled with mass and heat transfer. The type of chemical reactions occurring and their intensity, as well as the final properties, are directly influenced by the treatment temperature, time, and/or amount of water, type of atmosphere, and the type of wood species [40,46]. Among other analytical methods, vibrational spectroscopy is a well–known and easy–to–use technique through which it is possible to obtain rapid information and identify the small changes in the chemistry of wood components induced by the above-mentioned parameters. Several researchers have used near–infrared (NIR) and mid–infrared (IR) spectroscopy to evaluate the effect of the thermal modification at different temperatures and different wood species [47,48,49,50]. Although NIR spectroscopy in correlation with multivariate data analyses is the most common spectroscopic method used to model the MOE and MOR of treated wood [48], to estimate the hardness and density [51] or to predict the crystallinity degree [52], the evaluation of the chemical composition or physical properties has been investigated by mid-infrared spectroscopy [46,53,54]. Recently, the moisture distribution in thermally modified Scots pine has been assessed using hyperspectral NIR [55], realising a new application for determining the drying characteristics of thermally modified timber.
Principal component analysis (PCA) is a multivariate statistical technique that can be used to give detailed information extracted from a dataset; therefore, it can be used to control and process the monitoring and classification of product origin [56]. The underlying idea in PCA is to convert the complex multi–dimensional data into the dimensionally reduced PCA space. The input data set is decomposed into two matrices of interest: scores and loadings. The scores matrix describes the samples in the PC space, whereas the loadings matrix defines the new axes of the dimensionally reduced data set. With PCA, the most important features of the spectra can be identified, and the band shifts and non-symmetries in the bands between the samples can be quickly determined [57,58].
Generally, during thermal modification, mechanical resistance decreases and wood becomes more rigid and fragile, depending on the type of treatment (maximum treatment temperature, heating rate, treatment time, atmosphere) [49], wood species, and its characteristic properties, or the initial moisture content of the wood. It is considered that wood treatment at lower temperatures (i.e., under 150 °C) does not bring the desired properties, whereas wood treatment at higher temperatures (over 150 °C) induces chemical modifications in its structure that provide better biological durability, but at the same time reduced mechanical properties [59]. It has been mentioned that with thermal modification of wood resulting in a weight loss of less than 10%, MOE remains generally unchanged, whereas MOR starts to decrease from the early stages of modification [27].
Most studies on the thermal modification of wood have been done on laboratory tests and the results are of limited value for industrial scale [60]. The present study investigated thermally modified Norway spruce and Scots pine wood using the industrial ThermoWood® process and aims to combine colour measurements with structural changes and mechanical properties. To do so, colour measurements, bending strength, hardness, and infrared (FT-IR) spectroscopy coupled with principal component analysis were used.

2. Materials and Methods

Both the Norway spruce (Picea abies L.) and Scots pine (Pinus sylvestris L.) used in this study were obtained from round timber felled and further processed in Finland. The sawn timber was dried in conventional industrial kilns before thermal modification to average moisture contents between 15% and 18%, then subsequently thermally modified in two identical ca. 70 m3 industrial treatment chambers (SWM-Wood, Mikkeli, Finland).
Defect-free sections of sawn timber of varying length (between 1.2 m and 1.6 m) were cut from randomly selected sawn-timber pieces from a batch production of approx. 70 m3 before and after the specific thermal modification condition. From the defect-free sections, specimens were cut out for the different tests presented in this study. Thus, this study focuses on using a random test selection, whereby colour measurements fall within the range accepted for Thermo–S and Thermo–D based on more than 10 years of data collected [37,39].
All material used in this study was treated according to the certified ThermoWood® process, a registered trademark of the International ThermoWood® Association [61]. Two treatment classes have been defined within the commercialised processing, namely, Thermo–S treated at 190 °C and Thermo–D treated at 212 °C, where S and D refer to “stability” and “durability,” respectively, based on the recommended applications according to EN 335 [62]: Use Classes 1 and 2 for Thermo–S and Use Classes 1, 2, and 3 for Thermo–D.
The thermal modification process was carried out in a high-temperature chamber using superheated steam without adding any additional chemicals into the wood. The manufacturing process was carried out in a one-stage system starting with pre–dried timber and finishing with the final product. Within that stage, the process consisted of the following consecutive phases:
  • Phase 1—Warming up the wood and kiln (90 to 100 °C);
  • Phase 2—High–temperature kiln drying (100 to 130 °C) and mild thermal modification (130 to 190 °C);
  • Phase 3—Intensive thermal modification for 2 to 3 h at a temperature dependent on the treatment class (Thermo–S = 190 ± 3 °C, Thermo–D = 212 ± 3 °C);
  • Phase 4—Cooling to a temperature between approximately 80 and 90 °C and reconditioning to a final moisture content between 4 and 7%; and
  • Phase 5—Final cooling down to ambient temperature.

2.1. Infrared (FT–IR) Spectroscopy and Principal Component Analysis (PCA)

Infrared spectra were recorded on an ALPHA Bruker FT–IR spectrometer in ATR mode, using a diamond crystal accessory. All spectra were collected between 4000 and 400 cm−1 with a spectral resolution of 4 cm−1. Twenty recordings were made for each board, with 5 boards used for each type of wood/treatment; therefore, for each untreated and treated species a total of 100 spectra were collected.
For the initial structural assessment, an evaluation was made on the average spectrum obtained from these 100 recordings. Processing of the spectra, including the second derivative spectra, was done using the OPUS 7.5 program (Bruker Corporation).
For principal component analysis (PCA), all pre-treated spectra in the 1400–1185 cm−1 region were used. Processing was done in the Origin 2021 program (OriginLab Corporation).

2.2. Colour Measurements

Wood-colour measurements were undertaken using a Minolta Chroma Meter CR410 (Konica Minolta Sensing Inc., Japan), which measured the tristimulus values (X, Y, Z) on the 2° standard colorimetric system as described within the draft standard CIE DS 014-4.3/E:2007 [63]. The measured values were converted into L*, a*, and b* according to CIELAB convention according to Equations (1)–(9).
L* = 116f(Y/Yn) − 16
a* = 500[f(X/Xn) − f(Y/Yn)]
b* = 200[f(Y/Yn) − f(Z/Zn)]
where
f(X/Xn) = (X/Xn)1/3  if (X/Xn) > (6/29)3
f(X/Xn) = (841/108)(X/Xn) + 4/29   if (X/Xn) ≤ (6/29)3
and
f(Y/Yn) = (Y/Yn)1/3  if (Y/Yn) > (6/29)3
f(Y/Yn) = (841/108)(Y/Yn) + 4/29  if (Y/Yn) ≤ (6/29)3
and
f(Z/Zn) = (Z/Zn)1/3  if (Z/Zn) > (6/29)3
f(Z/Zn) = (841/108)(Z/Zn) + 4/29  if (Z/Zn) ≤ (6/29)3
where X, Y, and Z are the tristimulus values of the test colour stimulus based on the CIE 1931 standard colorimetric system defined in CIE S 014-1 [64], and Xn, Yn, and Zn are the corresponding tristimulus values of a specified white stimulus.
In order to determine the colour difference ΔE between two different colours, calculations according to Equation (10) were undertaken to ascertain the difference between two points in this CIELAB space, thus providing the colour change as a result of the thermal modification process.
ΔE* = (ΔL*2 + Δa*2 + Δb*2)1/2
Circular colour measurements (measurement diameter 50 mm) were undertaken on planed tangential surfaces of the unmodified and modified wood specimens that had been maintained at 65% RH/20 °C prior to analysis, with 10 recordings for each board and a total of five boards used for each type of studied sample, with average values used for subsequent calculations.

2.3. Bending Strength

The modulus of rupture (MOR) was determined in conjunction with the modulus of elasticity (MOE) with a 4–point destructive bending test in the radial direction according to EN 408 [65]. Six test pieces with dimensions of 200 × 10 × 10 mm (L × R × T) were prepared from each specimen, which were stored under standard conditions (20 °C, 65% RH for a period of 10 days prior to determining their respective weights, densities, and equilibrium moisture content) and subsequently tested in a Hounsfield tensile tester (Tinius Olsen Ltd., Horsham, PA, USA). The load was increased constantly so that the applied maximum load (Fmax) was reached within (300 ± 120) seconds. The MOR was determined by Fmax and the MOE between 0.1 Fmax and 0.4 Fmax, with average results along with standard deviation.

2.4. Hardness

Brinell hardness was measured according to a modified version of EN 1534 [66,67], i.e., indentation depth instead of the indentation diameter. Measuring the indentation depth instead of the indentation diameter was found to be preferable due to the anisotropic properties of wood leading to elliptical indentations without clear borders. A Zwick Roell ZwickiLine 2.5 TS universal testing machine equipped with a 2.5 kN load cell (ZwickRoell GmbH & Co. KG, Ulm, Germany) and a steel ball 10 mm in diameter were used. The test load was increased to the target load of 1 kN over 15 s, where it was held for 25 s. Afterwards, the force was released over 15 s and the depth of the residual indentation was measured. Brinell hardness values were calculated according to Equation (11):
H B = F D π h
where F is the test force in N, D is the ball diameter in mm, and h is the indentation depth in mm.
For each specimen, a total of six replicate measurements on the tangential surface were performed to realise average values with standard deviation.

3. Results and Discussion

Generally, during thermal modification, chemical changes take place in the wood structure depending on many conditions (treatment temperature, treatment time, atmosphere, etc.). Therefore, at high temperatures (in our case, 190 and 212 °C), wood undergoes some structural modifications, including the reduction of hydrophilic OH groups and their replacement with O-acetyl groups in both hardwoods and softwoods [46,49,68]. These are due to a series of simultaneously occurring reactions, which further promotes the crosslinking between the reactive radicals, significantly reducing the re-absorption of water molecules and formation of hydrogen bonds between the water and the wood polymers. Apart from the reduction of the hydrophilic OH groups, a series of volatile organic compounds (VOCs) are produced, which are released or remain trapped in the wood structure [49,68].
From all wood components, hemicelluloses start to degrade first and are most affected by the thermal treatment due to their lower molecular weight and branched structure [69], as demonstrated by reports of significant decreases in hemicellulose content [29,49].
Hemicellulose degradation occurs via deacetylation reactions, with the release of the acetic acid, which assists in catalytic depolymerisation. As a consequence, the degree of crystallinity of the cellulose increases temporarily at treatment temperatures between 160 and 200 °C (depending on the wood species) [49,69]. In addition, due to the degradation of hemicelluloses there is an apparent increase in the lignin content [70]. Thermal modification also induces the cleavage of the β–O–4 linkages between the lignin phenylpropane units, as well as lignin demethoxylation, resulting in further crosslinking [50,71,72].

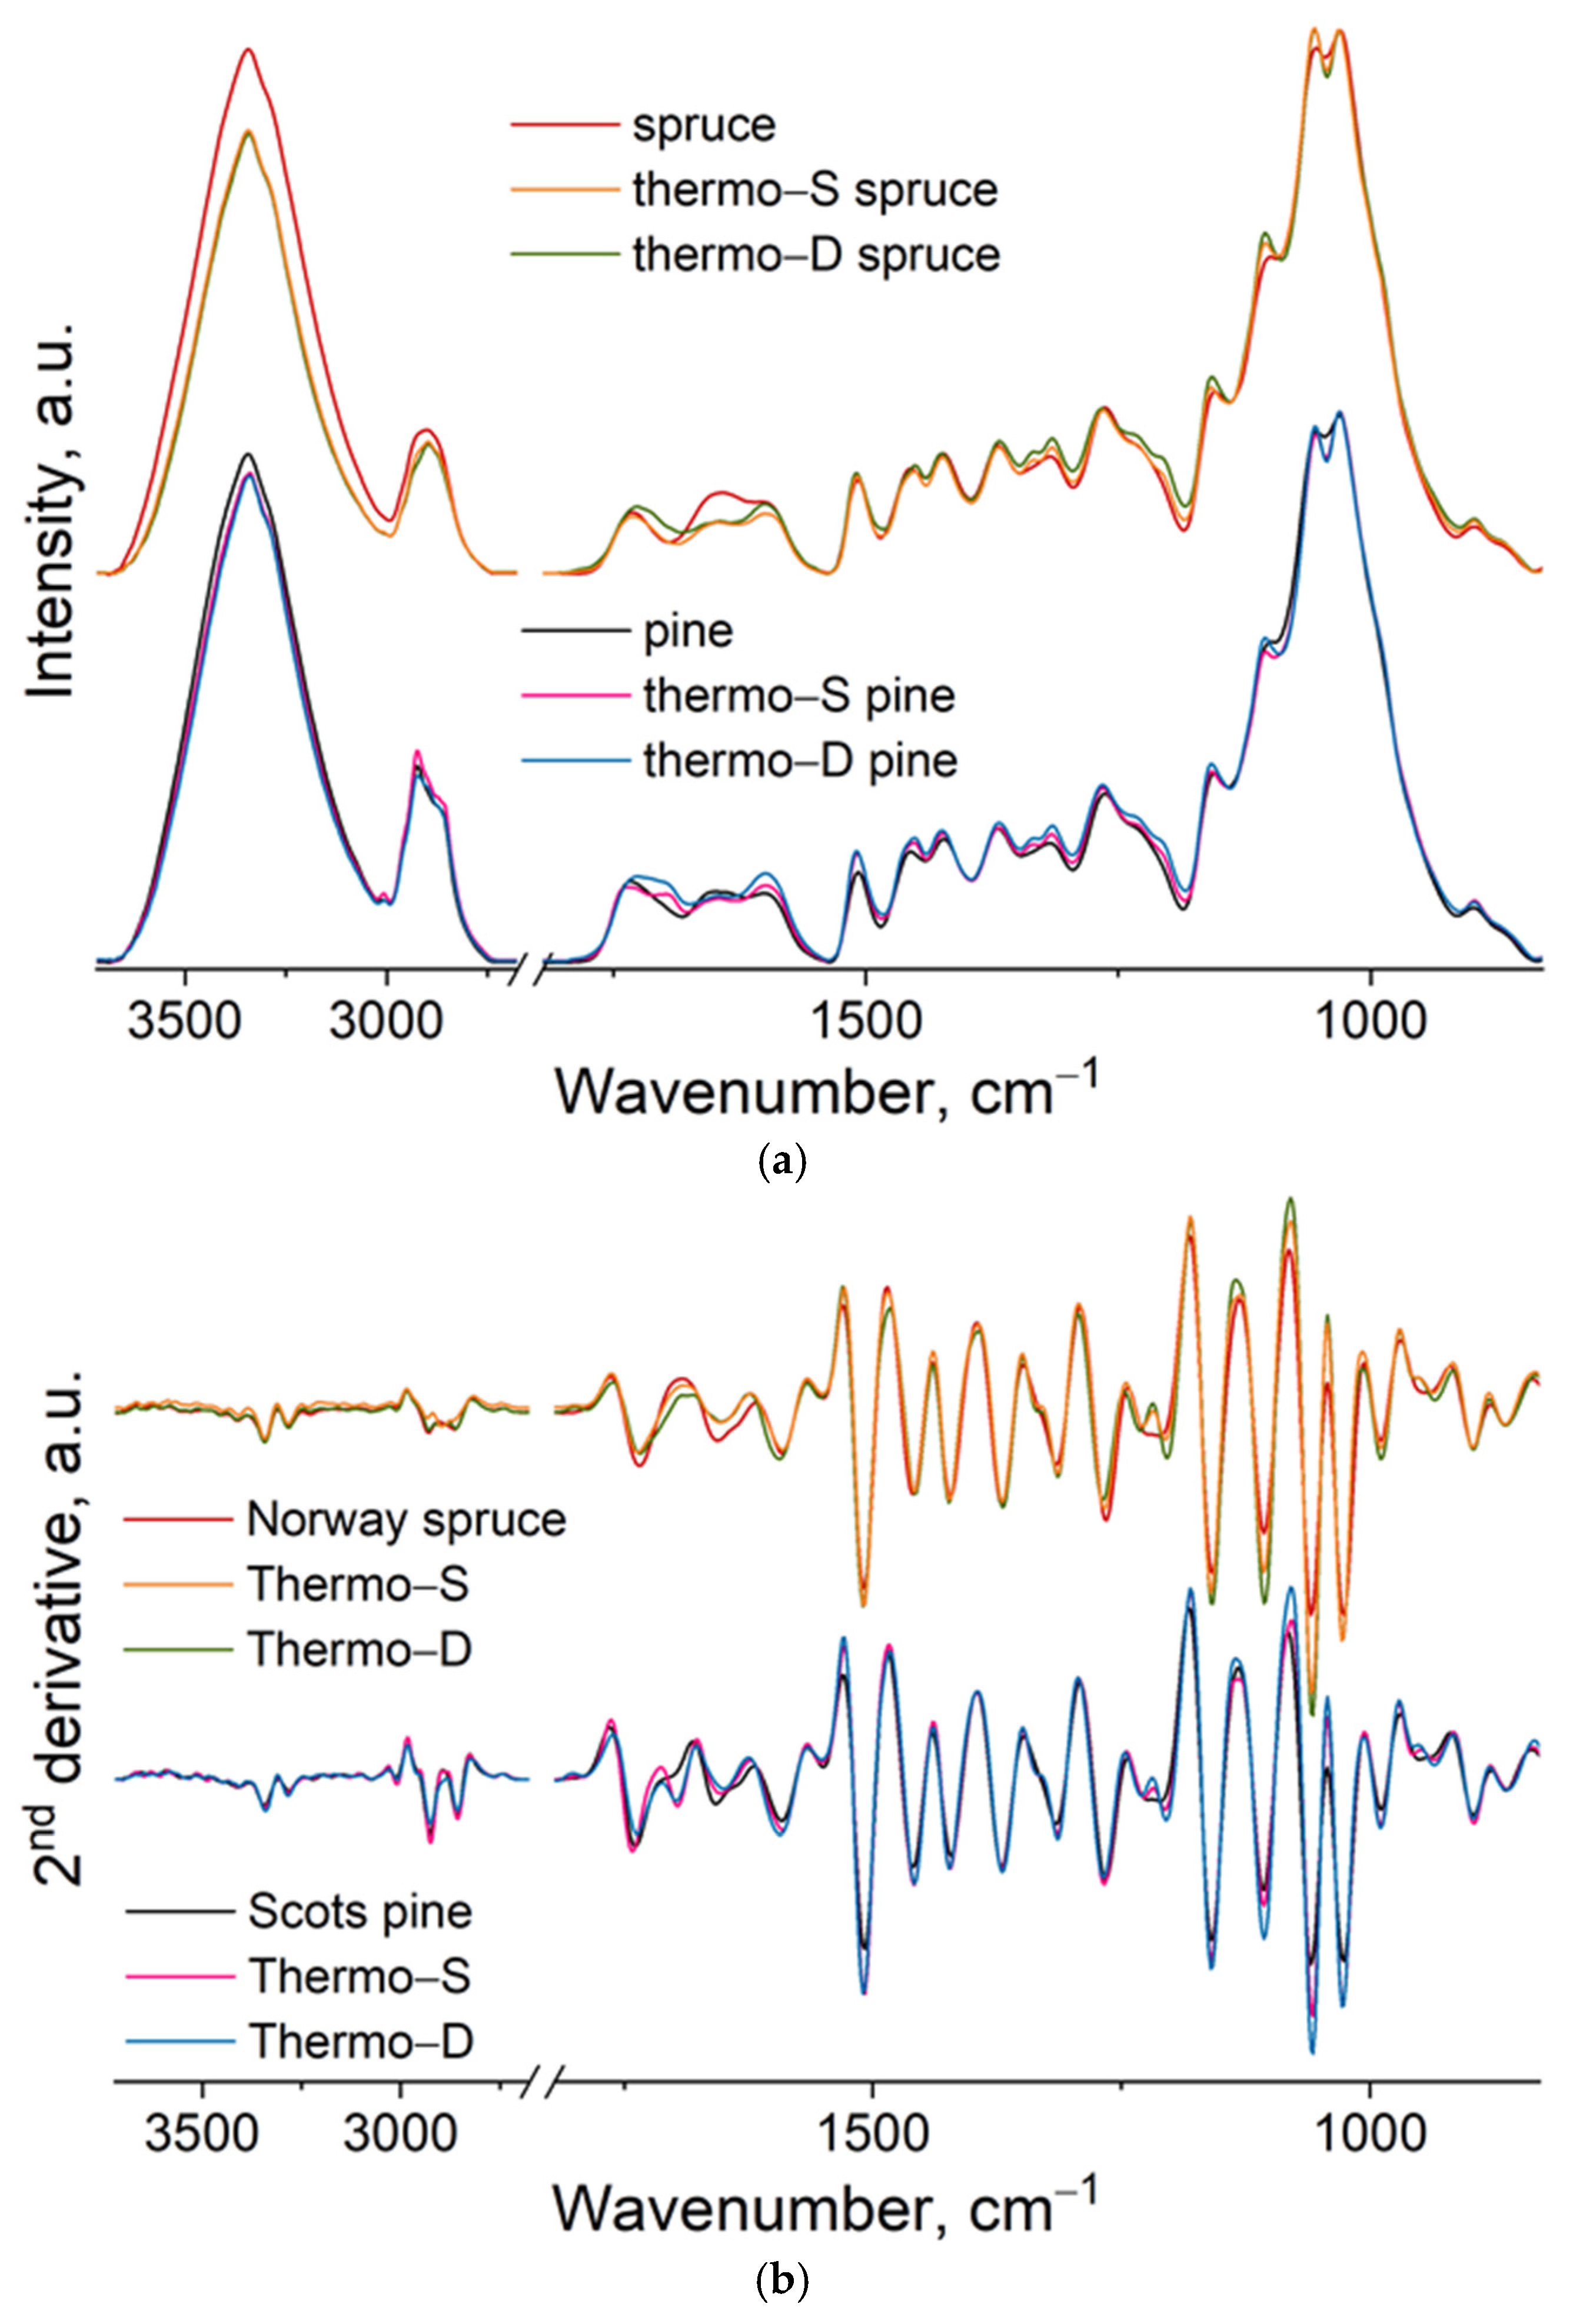
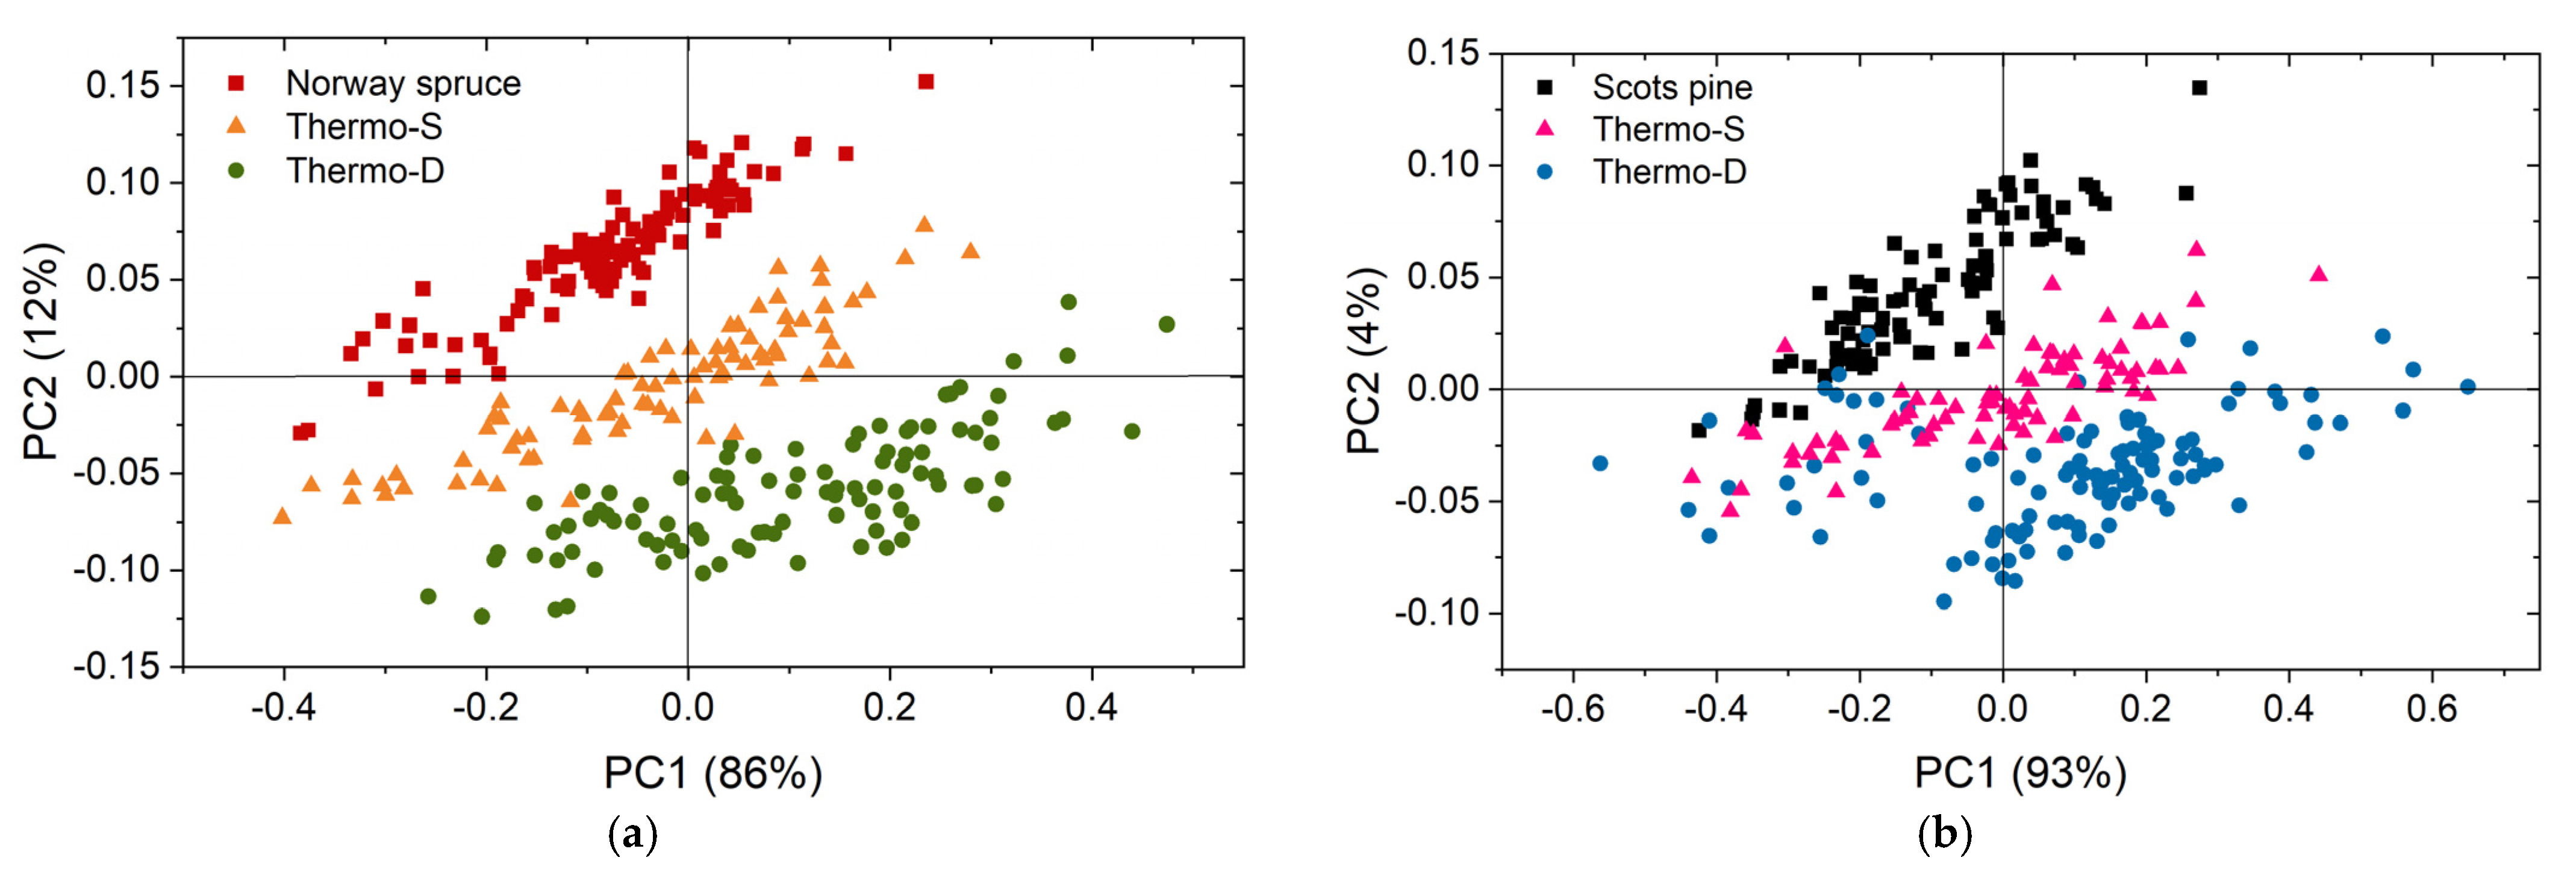
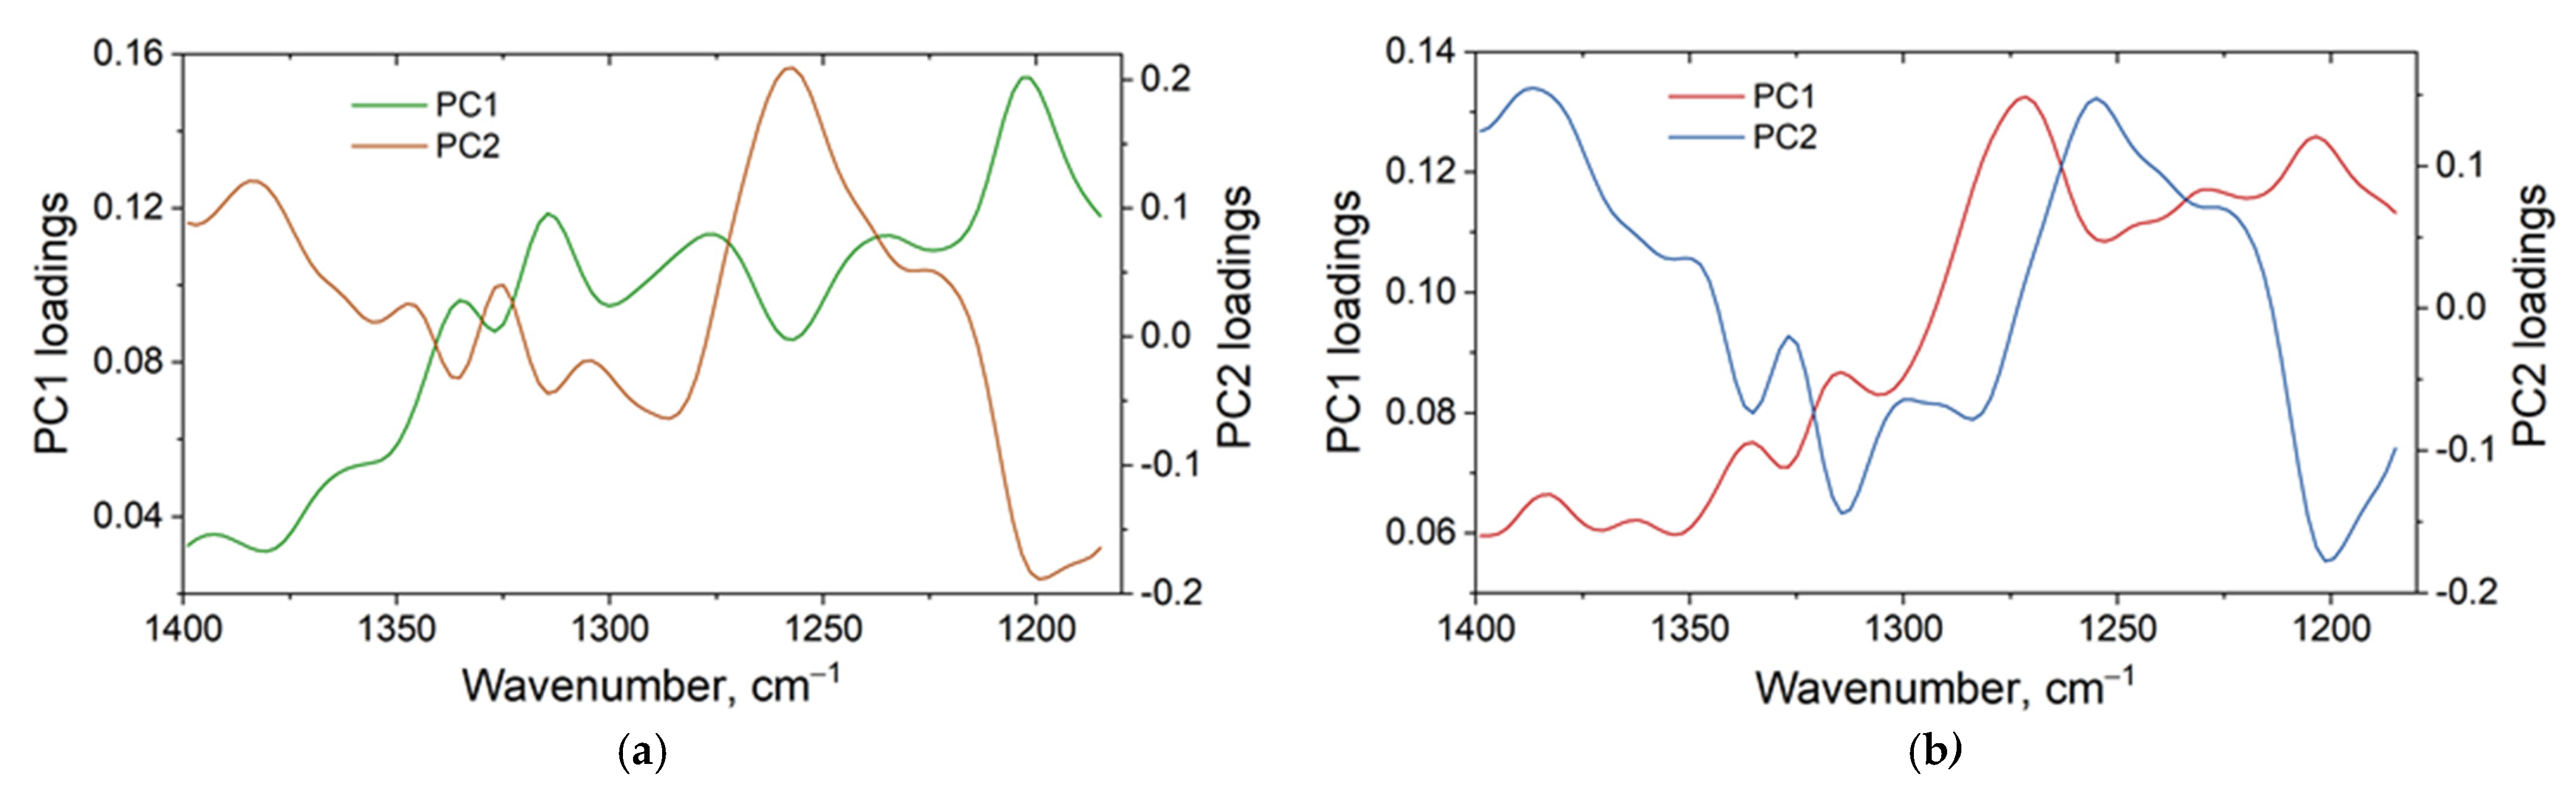
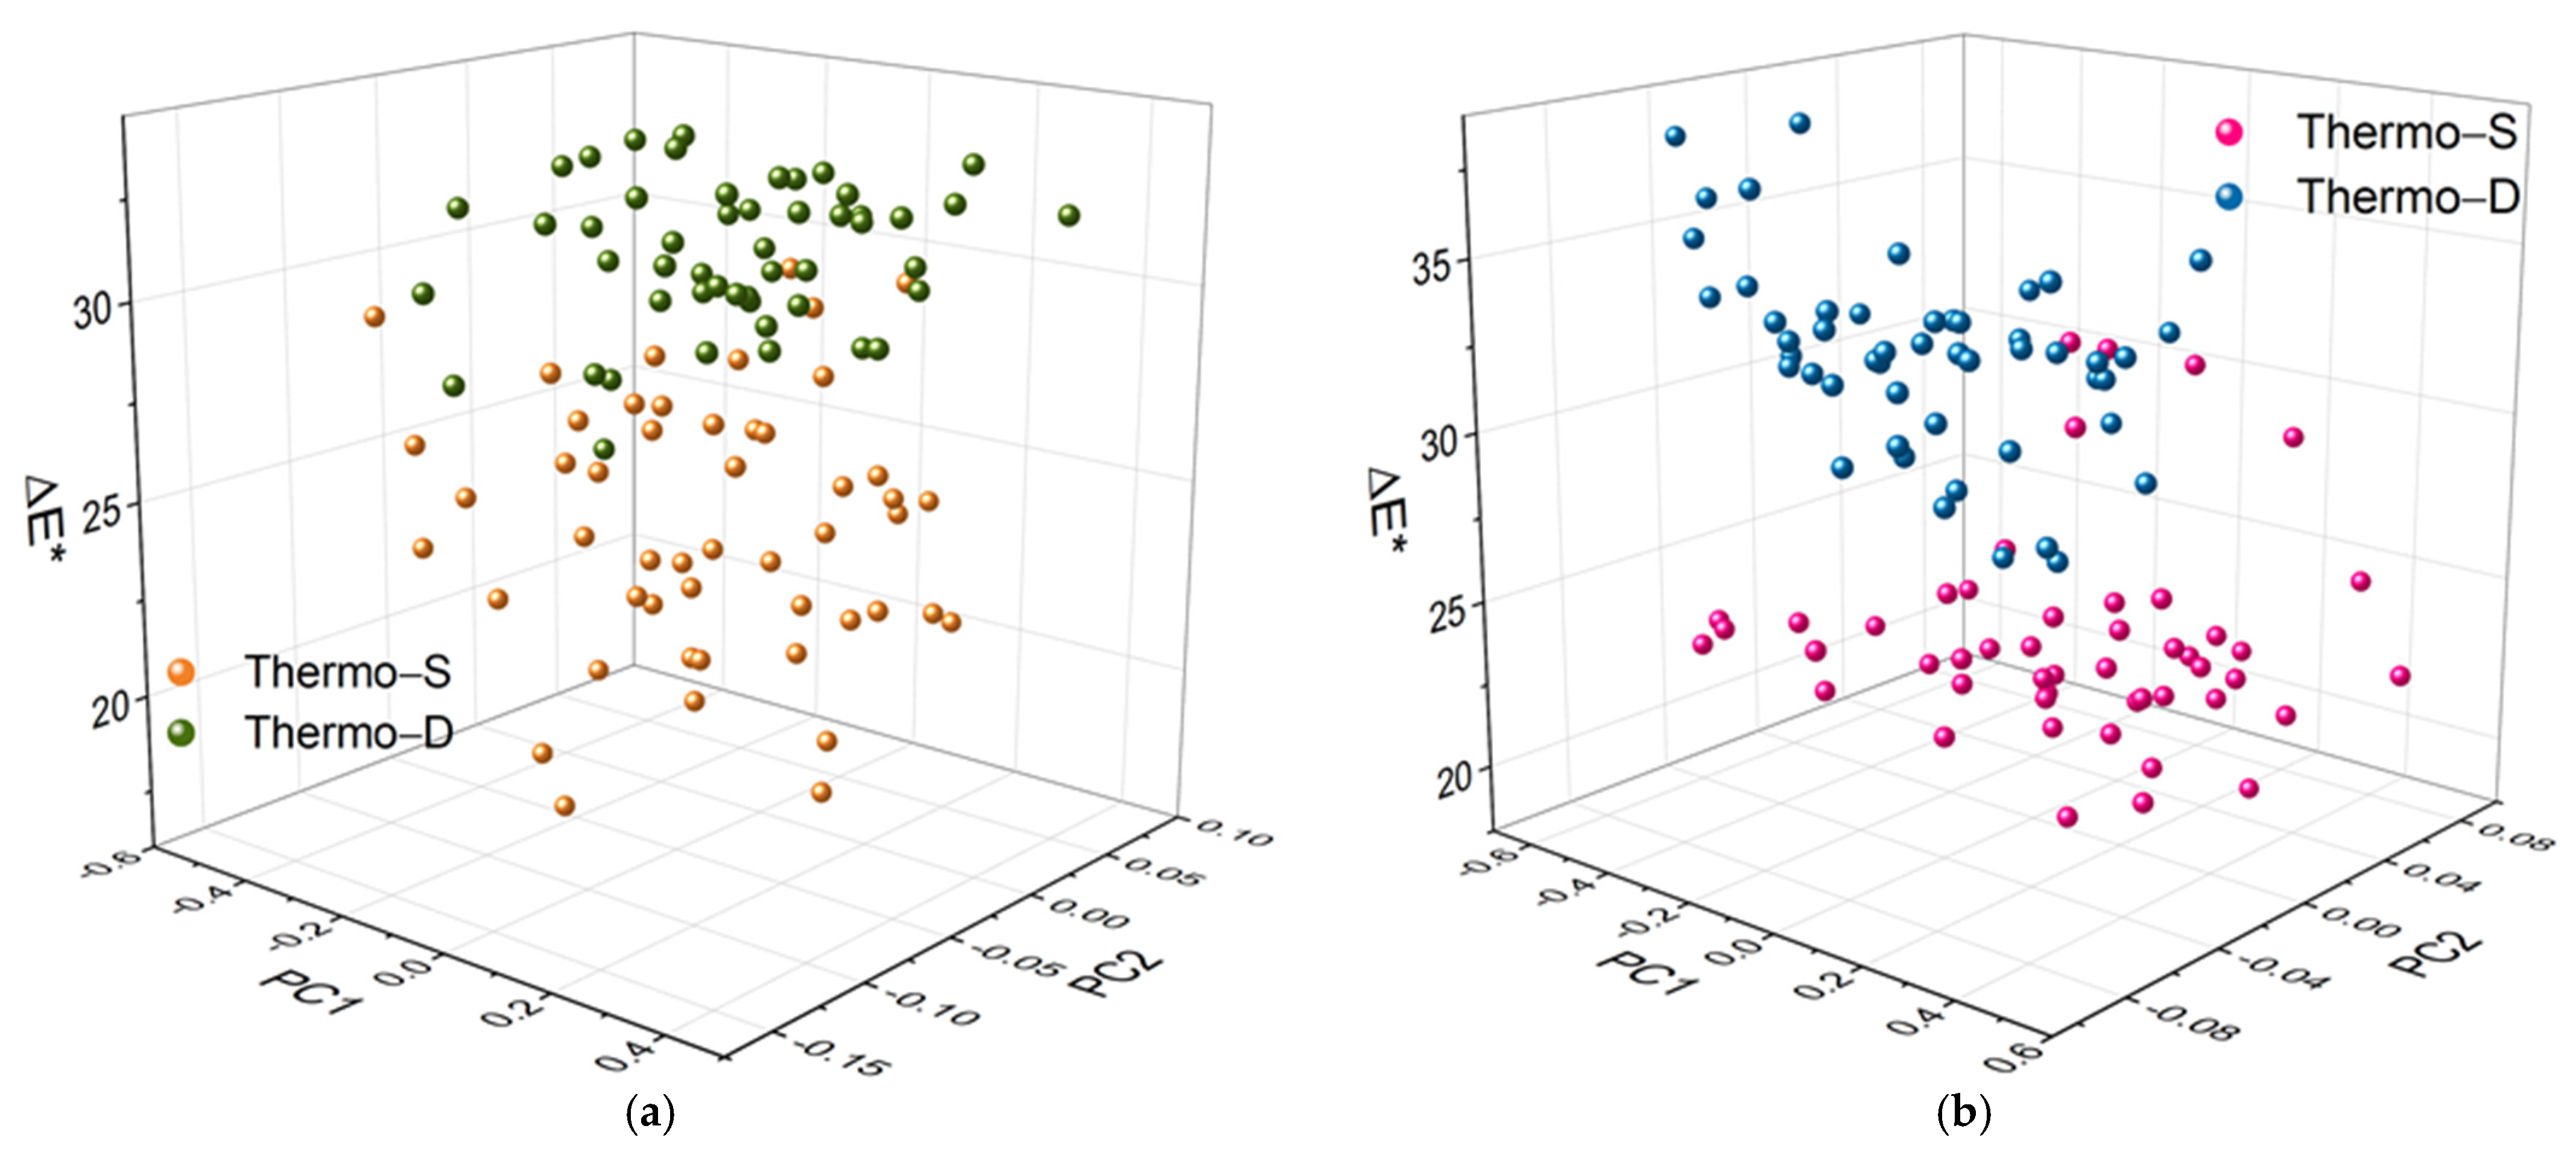
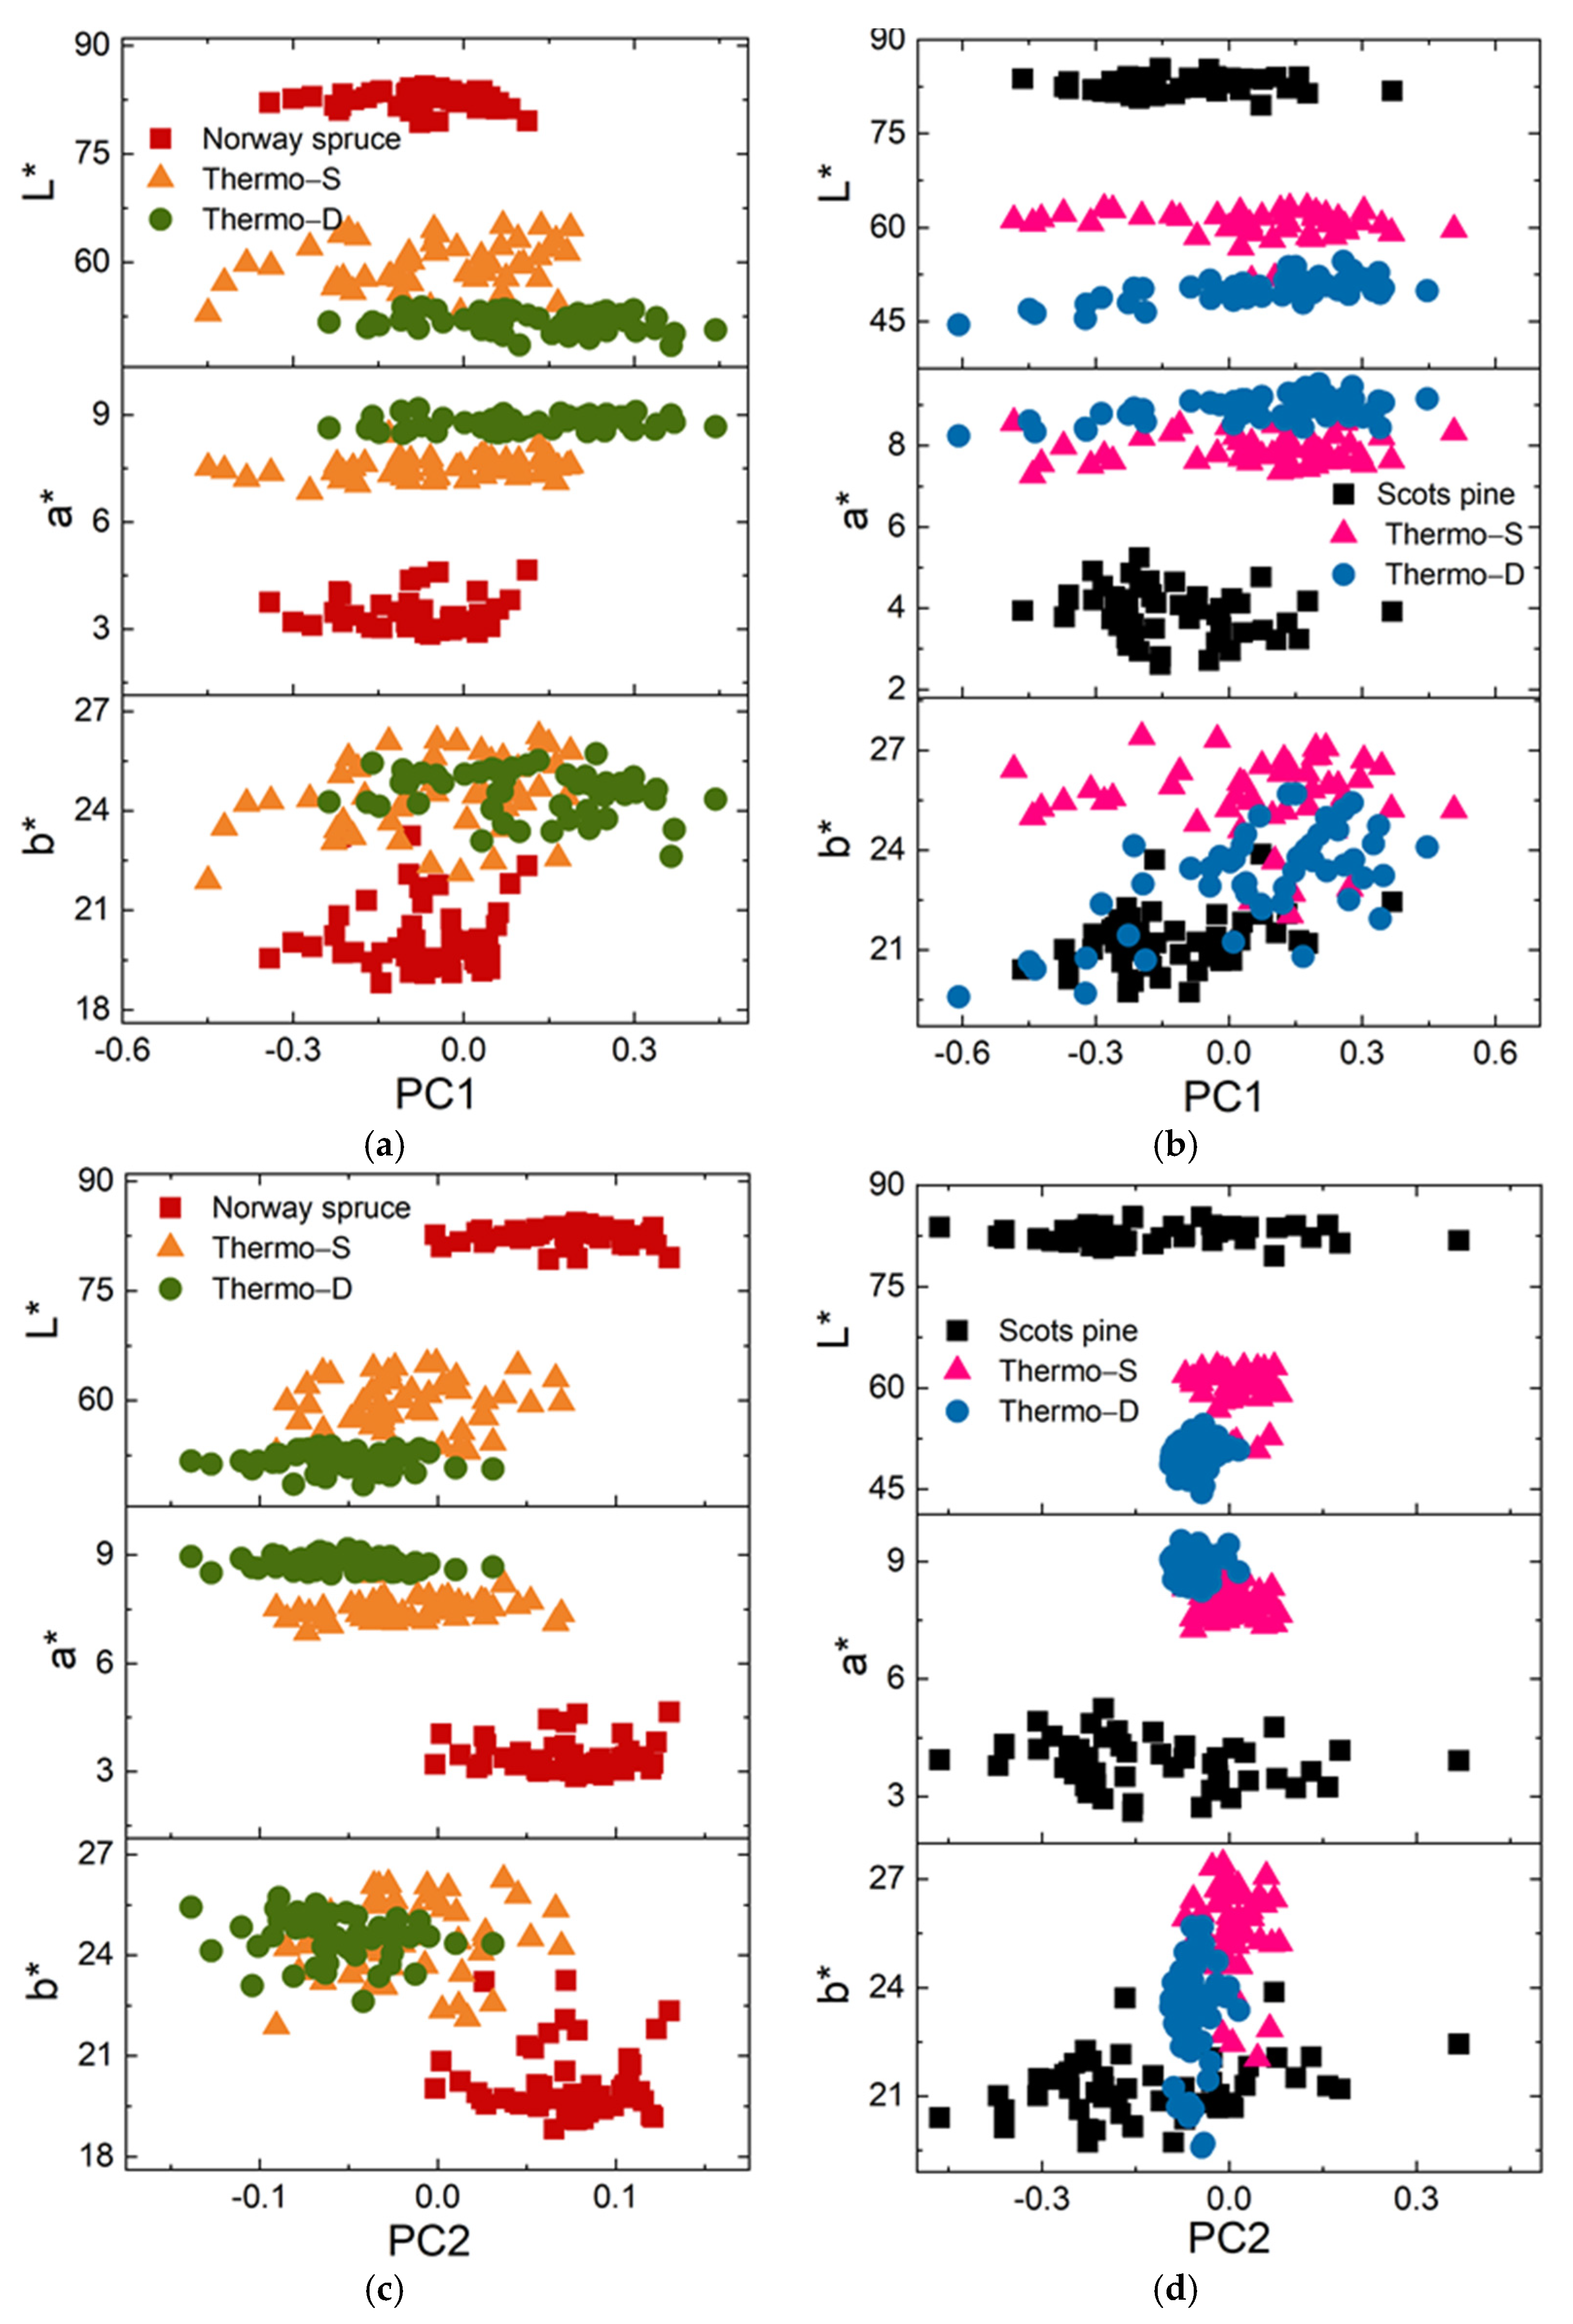
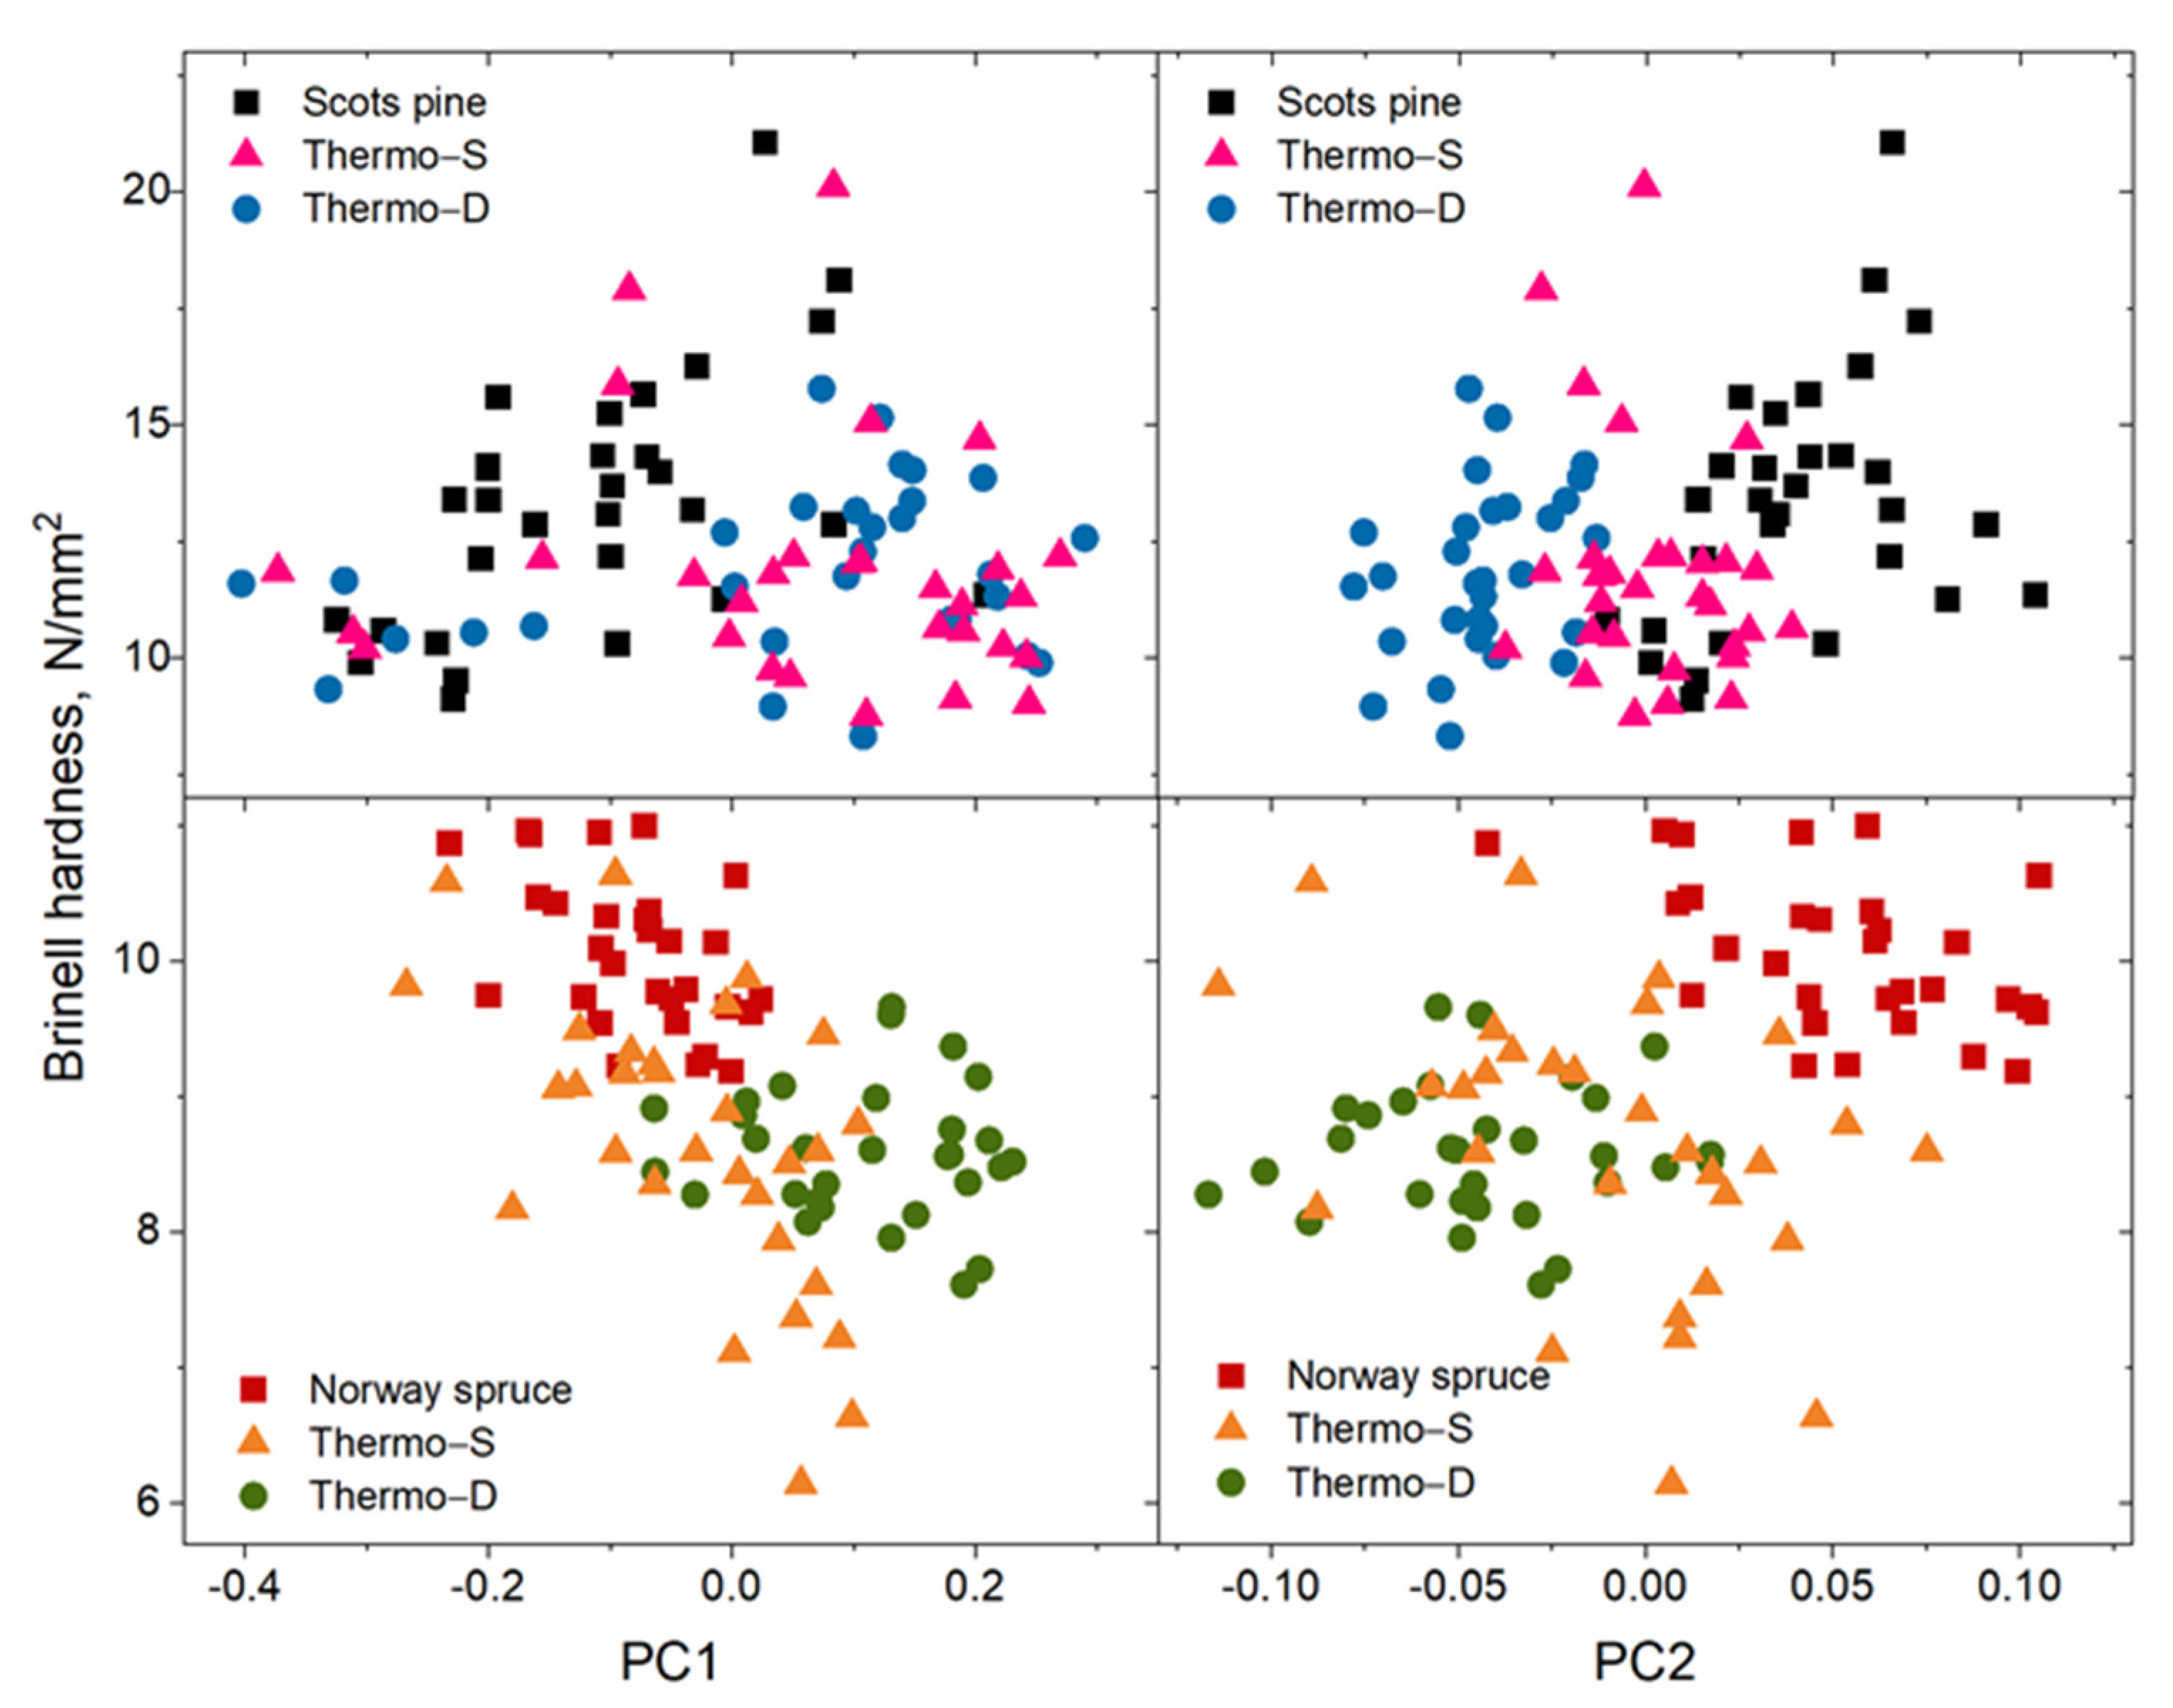
3.1. Fourier Transform Infrared (FT–IR) Spectroscopy and Principal Component Analysis (PCA)

Infrared spectra of the untreated and ThermoWood® Norway spruce and Scots pine wood presented in Figure 1a represents the average of 100 individual spectra obtained for every sample set. The average spectra were divided in the two main regions, namely, the 3750–2700 cm−1 region, assigned to different stretching vibrations of the OH groups and H-bonds, as well as to methyl and methylene groups, and the 1850–800 cm−1 region, assigned to specific stretching vibration and deformation bands belonging to all wood components. Generally, the wood spectra are formed by overlapping of the individual vibration bands; therefore, for a better evaluation of the differences taking place in the wood structure during the ThermoWood® process, the second derivative spectra were performed (Figure 1b).
The spectrum of untreated timber shows the characteristic bands of softwoods with a large band at about 3345/3343 cm−1 (Norway spruce/Scots pine), which is an envelope of the specific bands assigned to inter- and intramolecular hydrogen bonds in the wood components, and the band from 2900/2923 cm−1 (Norway spruce/Scots pine), which in this case is an envelope of the symmetric and antisymmetric stretching vibration of the methyl and methylene groups (Figure 1a). From Figure 1b it can be observed that the first band was composed of several sub-bands, such as 3411/3407, 3343/3344, 3281/3281, 3229/3221, and 3073/3074 cm−1 (Norway spruce/Scots pine) assigned to O2–H2⋯O6 intramolecular stretching modes (in cellulose), O5–H5⋯O3 intramolecular in cellulose, O6–H6⋯O3 intermolecular in cellulose Iβ, O6–H6⋯O3 intermolecular in cellulose Iα, and multiple formation of an intermolecular hydrogen bond between biphenol and other phenolic groups (in lignin) [46,73]. During the thermal modification, for the band from 3344 cm−1 no difference was observed in Norway spruce wood spectra, but it was shifted to 3343 and 3340 cm−1 in Scots pine wood spectra. The band from 3281 cm−1 was shifted to a higher wavenumber with about 4/3 cm−1, whereas the band from 3229/3221 cm−1 was shifted to a higher wavenumber with 6/13 cm−1. The shifting of the band’s maxima and the reduction of the entire band indicate a reduction in the amount of –OH groups due to different reactions taking place, i.e., the oxidation and/or hydrolysis of acetyl groups from hemicelluloses, as well as dehydration reactions and condensation reactions of lignin [2,74].
The band from 2900/2923 cm−1 (Norway spruce/Scots pine, respectively) was composed of individual bands at 2930/2927 and 2864/2858 cm−1 in untreated Norway spruce and Scots pine timber, respectively, whereas in the thermal modified timber three bands at 2934, 2898, and 2868 cm−1 were observed for Norway spruce and at 2961, 2925, and 2857 cm−1 for Scots pine. The shifting of the maxima of these bands was due to the structural and relative composition modifications in carbohydrates, as well as lignin.
In the 1800–800 cm−1 region, bands assigned to stretching and deformation vibrations of all wood components were observed. Compared to untreated timber in both Thermo-Wood® Norway spruce and Scots pine, differences in the spectra as well as their second derivatives were identified.
The band from 1738 cm−1 presented a small shoulder at 1705 cm−1 in untreated timber, whereas in Thermo–S and Thermo–D wood, the band was shifted to a higher wavenumber (1741 cm−1) and decreased slightly in intensity. The shoulder became a well-defined band with a higher intensity and shifted to 1696 cm−1. These bands were assigned to the carbonyl group stretching vibration of esters/aldehydes and aromatic/conjugated aldehydes and esters [73,75]. It is considered that the band from 1741 cm−1 was due almost exclusively to carbonyl groups of acetoxy groups in xylan, its decrease indicating the breaking down of acetyl or acetoxy groups in xylan [76,77], but also to the formation of carbonyl and carboxyl groups due to oxidation [35,76,78]. The increase in the intensity of the band from 1696 cm−1 might have been due an increase in acetyl, carbonyl, and carboxyl groups resulting from the condensation reactions taking place with cleavage of the aliphatic side chains and β–O–4 bonds in lignin [77] or carboxylation reactions taking place in carbohydrates [74,79]. For Thermo–S and Thermo–D Norway spruce timber, a band from 1705 cm−1 was not observed. The only observation in the derivative spectra was a slight intensity decrease combined with a width increase in the band from 1737 cm−1 and shifting towards a lower wavenumber.
A decreased intensity in the band from 1656/1658 cm−1, with a shift toward 1650/1652 cm−1, respectively, and the disappearance in the thermal modified Norway spruce and Scots pine of the band located at 1638 cm−1, was also observed. These bands were assigned to C=C double bonds in conjugated carbonyl groups in lignin and conjugated C–O in quinones and to adsorbed water molecules in wood [46,73,80]. The decrease in intensity of the first band could have been due to the cleavage of the acetyl groups, a phenomenon occurring during the thermal decomposition of hemicelluloses, but also during decomposition and condensation reactions from lignin [46]. The disappearance of the later band (from 1638 cm−1) indicates the more hydrophobic nature of the thermal modified timber compared to the untreated one, with less adsorption of water molecules into the wood structure.
In thermal modified timber, an increase in the intensity of the bands from 1592 and 1509 cm−1 assigned to aromatic skeletal stretching vibration was observed [46,73,77], which indicate an apparent increase in the lignin content. This increase was more pronounced in Scots pine than in Norway spruce. The observed modification was due to the degradation of hemicelluloses with the formation of volatile products and pseudolignin and is in accordance with the findings reported by others [75].
The appearance of a new band at 1336 cm−1 was observed in both wood species spectra (again, with higher modification occurring in the Scots pine wood spectrum) and increased intensity for the band from 1315 cm−1 was identified in the thermal modified timber. Both bands were assigned to C–H stretching vibration in cellulose and hemicelluloses, OH–bending vibrations of the free phenolic hydroxyl groups, and C–H stretching vibration in S and G lignin condensed units, as well as to CH2 rocking vibration in cellulose [46,73,75]. This indicates the presence of lignin condensation reactions taking place during the thermal modification.
Furthermore, the bands from 1225 and 1211 cm−1, which appeared as one large, combined band in the untreated Scots pine wood, could be observed as well-defined separate bands in modified timber at 1227/1228 (Thermo–S and Thermo–D) and 1206/1204 cm−1 (Thermo–S and Thermo–D). At the same time, the band from 1206/1204 cm−1 presented higher intensity in both Norway spruce and Scots pine modified wood species. These bands were assigned to the C–O–C stretching vibration mode of the pyranose ring and the C–O and C=O stretching vibration in lignin and hemicelluloses [46,73,75]. Nuopponen et al. [75] specified that the band from about 1206 cm−1 might also be assigned to aliphatic esters, lactones, and carboxylic acids, which have the C–O stretching band near 1200 cm−1. Furthermore, the degradation of amorphous carbohydrates was evidenced by the increase in intensity of the bands from 1159 and 1107 cm−1 assigned to the C–O–C and C–O stretching vibration in carbohydrates mainly for the crystalline regions from cellulose [46,73,75].
Increased intensity was also observed for the band from 1028/1027 cm−1 (Norway spruce/Scots Pine) assigned to the C–O ester stretching vibrations in methoxyl and β–O–4 linkages in lignin, as well as the C–O stretching vibration in carbohydrates [46,73,80]. Because the hemicelluloses were degrading, the intensity increase of this band was most probably due to the formation of alcoholic structures in lignin.
A clear image of the modifications taking place in the wood component structure was difficult to obtain due to many overlapping bands resulting from the hemicelluloses, cellulose, and lignin. Therefore, the interpretation of the spectral data was improved by combining them with multivariate analysis techniques. Among them, principal component analysis (PCA) is the most used technique in the qualitative analysis of spectral data. Generally, PCA is described by principal component scores and loadings. The scores give information about similarities and dissimilarities between the sample’s groups, whereas the loading plots indicate which absorption bands cause the differences observed between the sets of samples [46,75,81].
Untreated and ThermoWood® Norway spruce and Scots pine could be distinguished by the score plots of the first (PC1) and second (PC2) components performed for all spectra in the 1400–1185 cm−1 region (Figure 2). Even though PC1 described 86%/93% from the data variance and PC2 only 12%/4%, it could be observed that PC2 was the most informative latent variable for differentiation between the samples. Therefore, positive values on PC2 and mainly negative ones on PC1 could be observed for both untreated wood species. Thermo–S showed PC1 values close to the axis, whereas the values for PC2 were divided evenly between negative and positive values. The last series, the Thermo–D samples, presented mainly positive PC1 values and negative PC2 values.
The loading line plots (presented in Figure 3) indicate that the most significant difference for PC1 between the untreated and thermal modified timbers was due to the bands assigned to C–H deformation in cellulose and hemicelluloses and aliphatic C–H stretching vibration in −CH3 groups in lignin [46,73] at about 1392/1384 and 1359/1362 cm−1 (Norway spruce/Scots pine), C–H stretching vibration in cellulose and hemicelluloses, as well as C1–O in syringyl derivatives from lignin [46,73] at 1334/1335 cm−1 (Norway spruce/Scots pine); to the C–H rocking vibration in cellulose [46,73] at 1314/1315 cm−1 (Norway spruce/Scots pine); to C–H bending vibration in cellulose and C–O stretching vibration in lignin (especially C–O linkage in aromatic methoxyl groups in guaiacyl units) [46,73] at 1276/1272 cm−1 (Norway spruce/Scots pine); to C–O–C stretching vibration in pyranose ring as well as C–O stretching vibration in lignin and hemicelluloses [46,73] at 1235/1231 cm−1 (Norway spruce/Scots pine); and to C=O stretching vibration in lignin and hemicelluloses [46,73] at 1202/1203 cm−1 (Norway spruce/Scots pine).
On the other hand, the difference observed between the samples in the PC2 loading plots were due to the bands from 1383/1387 cm−1, 1347/1349 cm−1, 1326/1326 cm−1, 1305/1300 cm−1, 1258/1255 cm−1, and 1225/1226 cm−1 (Norway spruce/Scots pine) assigned mainly to C–H deformation vibration in cellulose and hemicelluloses and aliphatic C–H stretching vibration in –CH3 groups in lignin, C–H stretching vibration in cellulose, and C1–O stretching vibration in lignin; –CH2 rocking vibration in cellulose; C–O linkage in guaiacyl aromatic methoxyl groups in lignin and acetyl groups in hemicelluloses; and C–O–C stretching vibration in pyranose ring, as well as C–O stretching vibration in lignin and hemicelluloses [46,73].
The chemical modification resulting from the treatment in ThermoWood® Norway spruce and Scots pine was responsible for their new properties. Overall, the infrared spectra and PCA of ThermoWood® Norway spruce and Scots pine confirm that hemicelluloses and lignin were most sensitive to heat treatment. As a consequence, increased intensities of mainly aromatic bands in lignin were observed, as well as the bands assigned to crystalline regions in cellulose. The presence of the water during the warming up stage of the treatment acted as a softener for the wood structure, providing a certain flexibility for the cell wall components. Furthermore, the high temperature used during the treatment increased the mobility of the molecular chains in the wood cell wall. Both factors promoted the structural rearrangements aside from the degradation reactions [82,83], which could result in the formation of new irreversible hydrogen bonds within hemicelluloses and cellulose. The results obtained herein are in agreement with the chemical changes determined by Esteves et al. [84,85] through their study of the wet chemistry of heat-treated pine.
It had been mentioned in literature that the darkening of wood during the thermal modification is due to the changes in lignin structure, which is “richer than carbohydrates in latent chromophoric groups” [27]. It was also noted that modifications taking place between 1700–1600 cm−1 were associated with quinone formation, due to condensation reactions taking place in lignin.
Quinones absorb in the visible region of the electromagnetic spectrum and are considered to be the main structures inducing colour changes in the thermal treatment of wood [27]. The colour change due to heat treatment has also been associated with Maillard reactions taking place between sugars, phenolic compounds, and amino–acids, or with oxidative reactions that can take place between the extractives and the atmospheric gases [27,86].

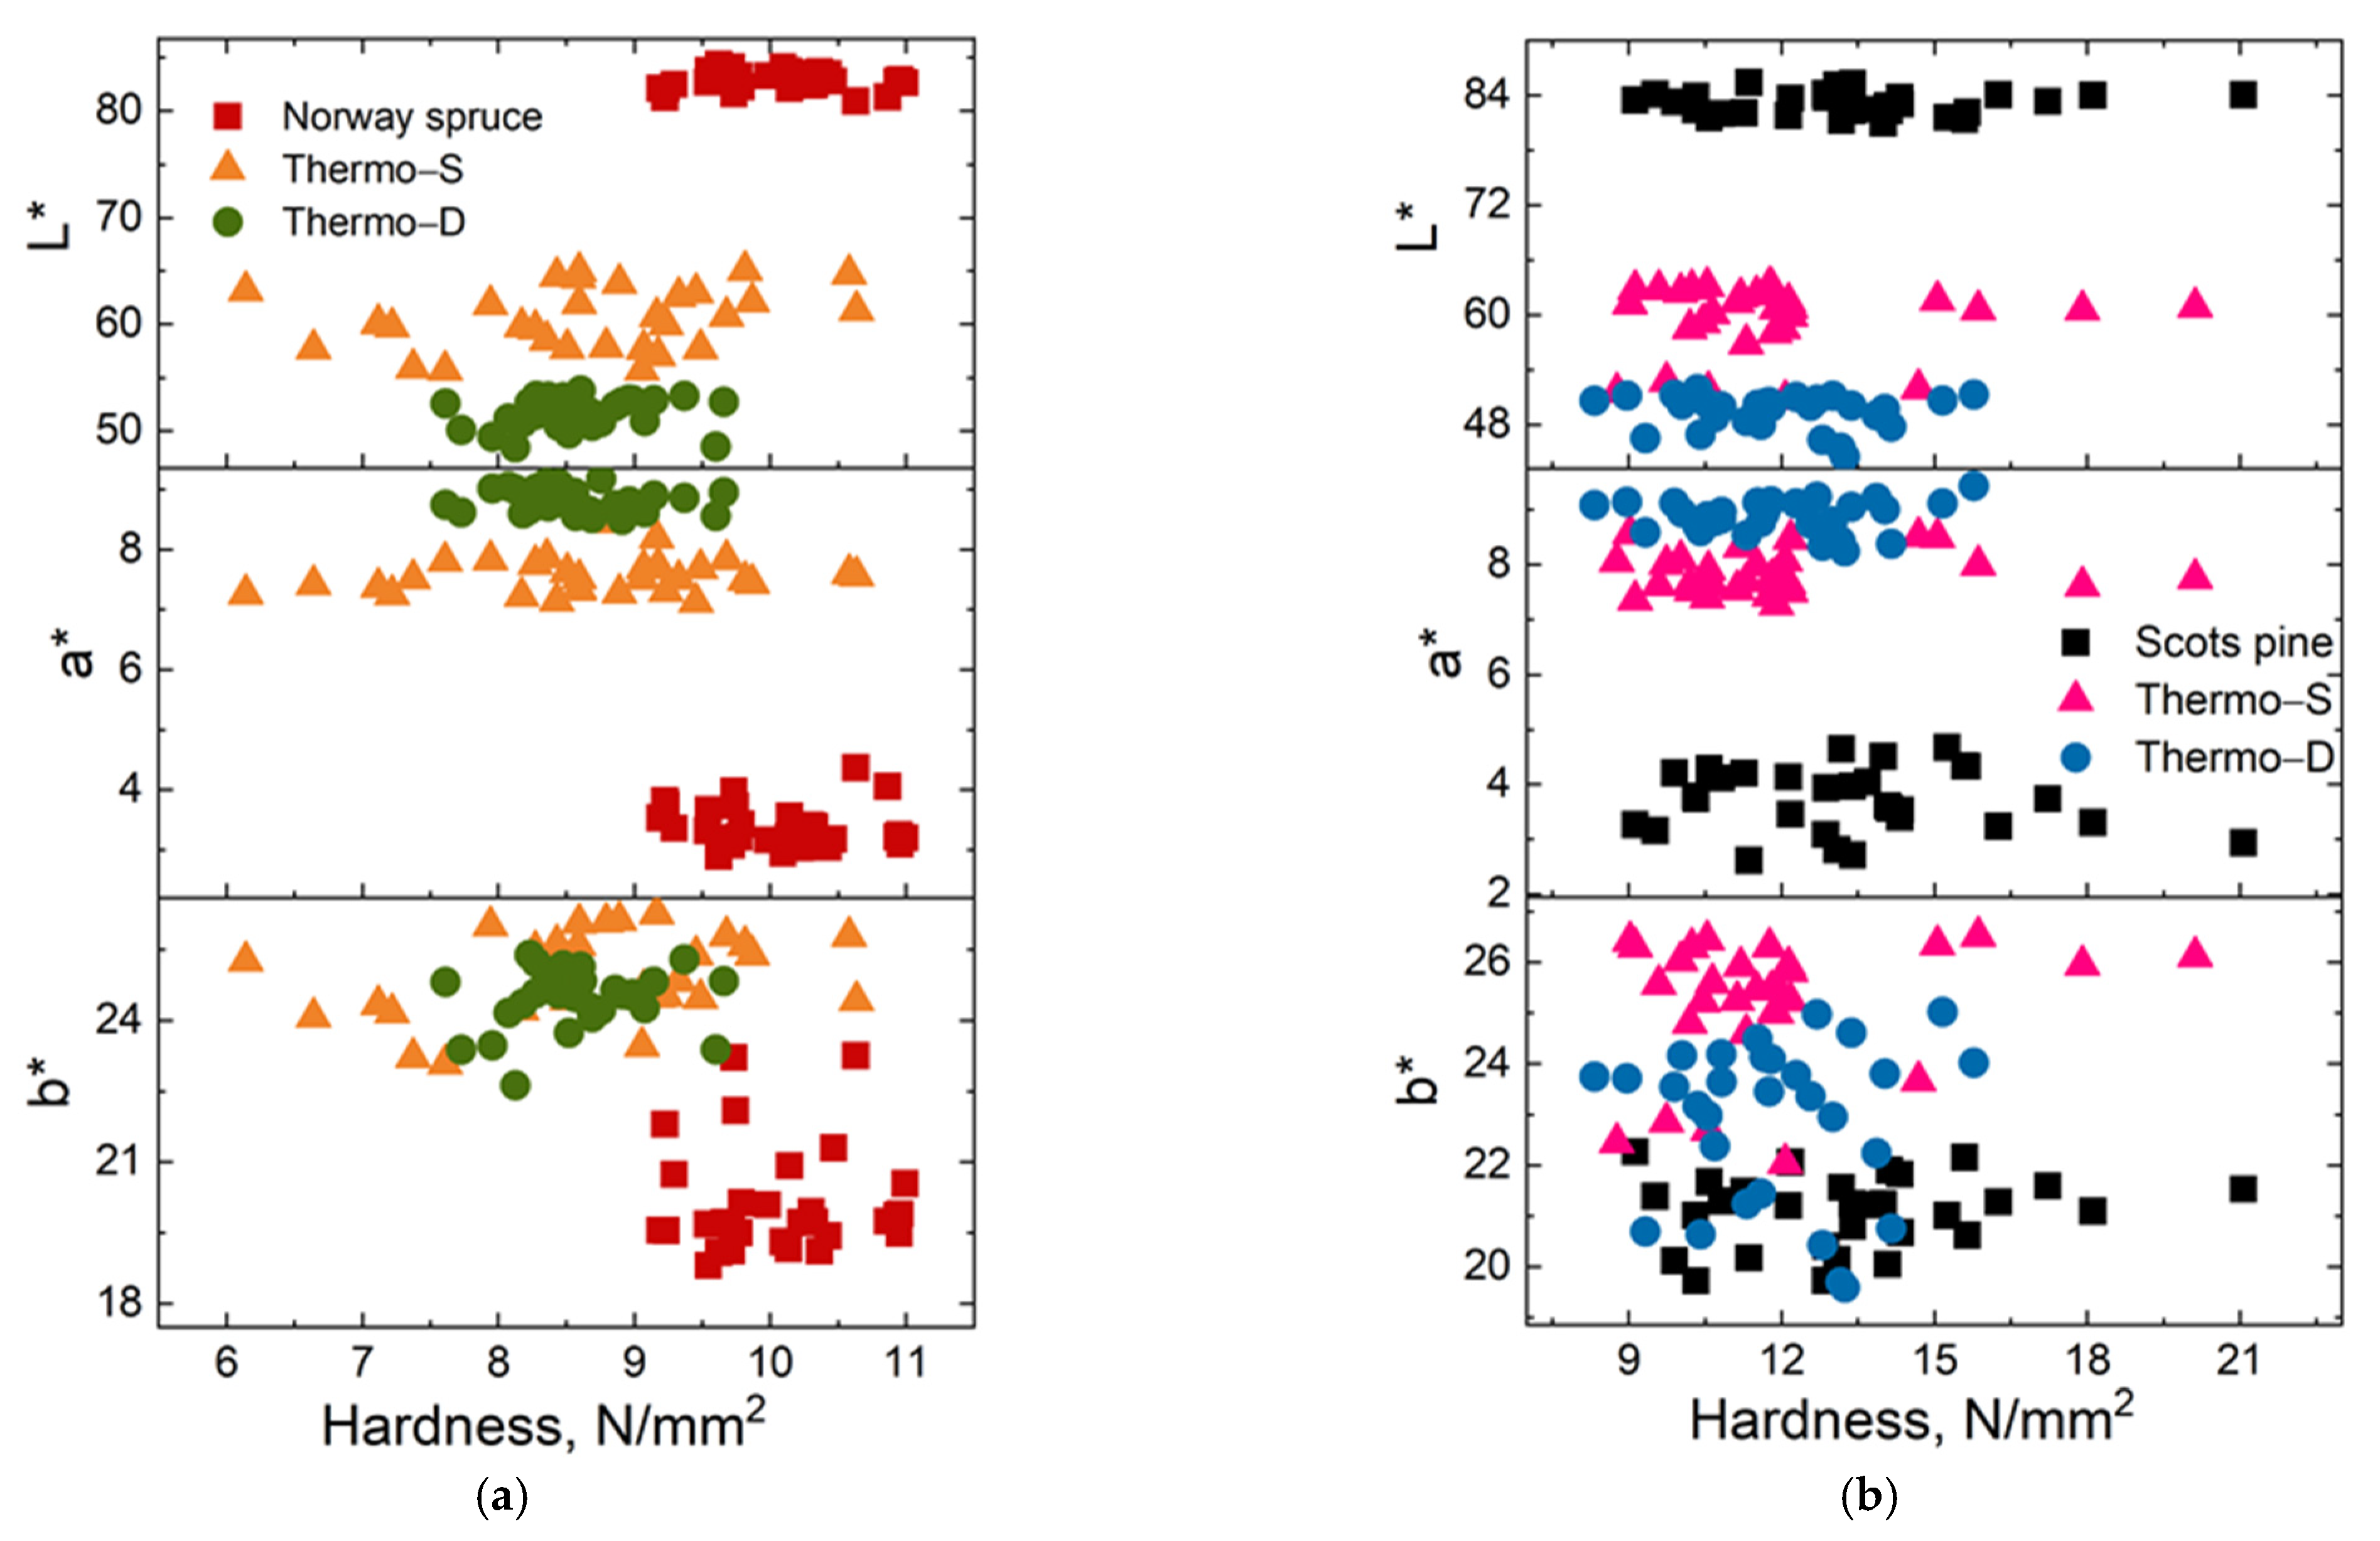
3.2. Colour Measurements

Bond cleavage and further oxidation and dehydration of polysaccharides, as well as the β–O–4 bonds and methoxyl groups’ cleavage and lignin condensation reactions, induced the formation of new chromophore and quinone structures, which were responsible for the colour changes [35]. To evaluate the differences in the colours developed by Norway spruce and Scots pine wood during the treatment, the colour was measured. The average measurement data and their standard deviations are presented in Table 1 and the colour guidelines for ThermoWood® Norway spruce and Scots pine as defined within quality control document FC–2 Thermally Modified Timber [38] are presented in Table 2.
Untreated Norway spruce and Scots pine timber presented similar L* (lightness) values of 82.55 and 82.73, whereas the a* and b* parameters were slightly different, namely, a* of 3.40 and 3.87 and b* of 20.19 and 21.21 for Norway spruce and Scots pine, respectively.
Analysing the parameters before and after the thermal modification, one can observed that the highest changes took place for the L* values, which decreased for both wood species to about 59 for Thermo–S (representing a decrease of about 28%) and 51/50 (representing a decrease of about 34/39%) for Thermo–D Norway spruce and Scots pine. The variation of the L* values due to thermal modification has been highly reported in the scientific literature [33,35,87,88] and was attributed to the formation of new compounds absorbing in visible light [89].
In contrast, the a* parameter increased for both wood species with the increase in temperature of the treatment, with about 55/51% for Thermo–S and about 61/57% for Thermo–D (Norway spruce/Scots pine). At the same time, the b* parameter indicated increased values compared to untreated timber, with about 17% for Thermo–S and with about 18/9% for Thermo–D Norway spruce and Scots pine.
The decrease in the L* value reduced the brightness, whereas the increase in the a* value represents a shift toward the red colour, and the increase in the b* value represents a shift toward the yellow colour after thermal modification. The increase in a* values was associated with the volatilisation of phenolic extractives, responsible for conferring the red colour to the wood, whereas the variation of b* values might have been due to the degradation of the chromophoric groups from lignin and wood extractives.
The L* values obtained in our case are in agreement with the data specified in the colour guidelines for ThermoWood® Norway spruce and Scots pine, falling between 58 and 68 for Thermo–S and between 45–55 for Thermo–D. On the other hand, the recorded a* values were under the values given in the guidelines for ThermoWood® Norway spruce and Scots pine, indicating slightly less redness.
Using the colour–measuring parameters (L*, a* and b*), the colour difference (ΔE*), which represents the overall colour changes of the modified timber in comparison to the same measurements of untreated timber, was calculated (see Table 1). The results indicate that higher treatment temperature resulted in greater colour changes, with the ΔE* values being about 24 for Thermo–S and about 33/31 for Thermo–D Norway spruce and Scots pine wood. A ΔE* value higher than 6 is classified as a major colour change [90,91].
ΔE* values were plotted against PC1 and PC2 scores for Norway spruce (Figure 4a) and Scots pine (Figure 4b). As can be observed, both scores contributed to the separation of the colour difference between the different thermal treatments for both wood species. Higher separation between parameters can be observed for the Scots pine wood samples.
Additional L*, a*, and b* parameters were plotted as a function of PC1 and PC2 scores. From Figure 5 we can observe a good cluster separation for the L* and a* parameters when plotted as a function of both PC scores for both Norway spruce and Scots pine, but no cluster separation was observed when the b* parameter was plotted as a function of PC scores.

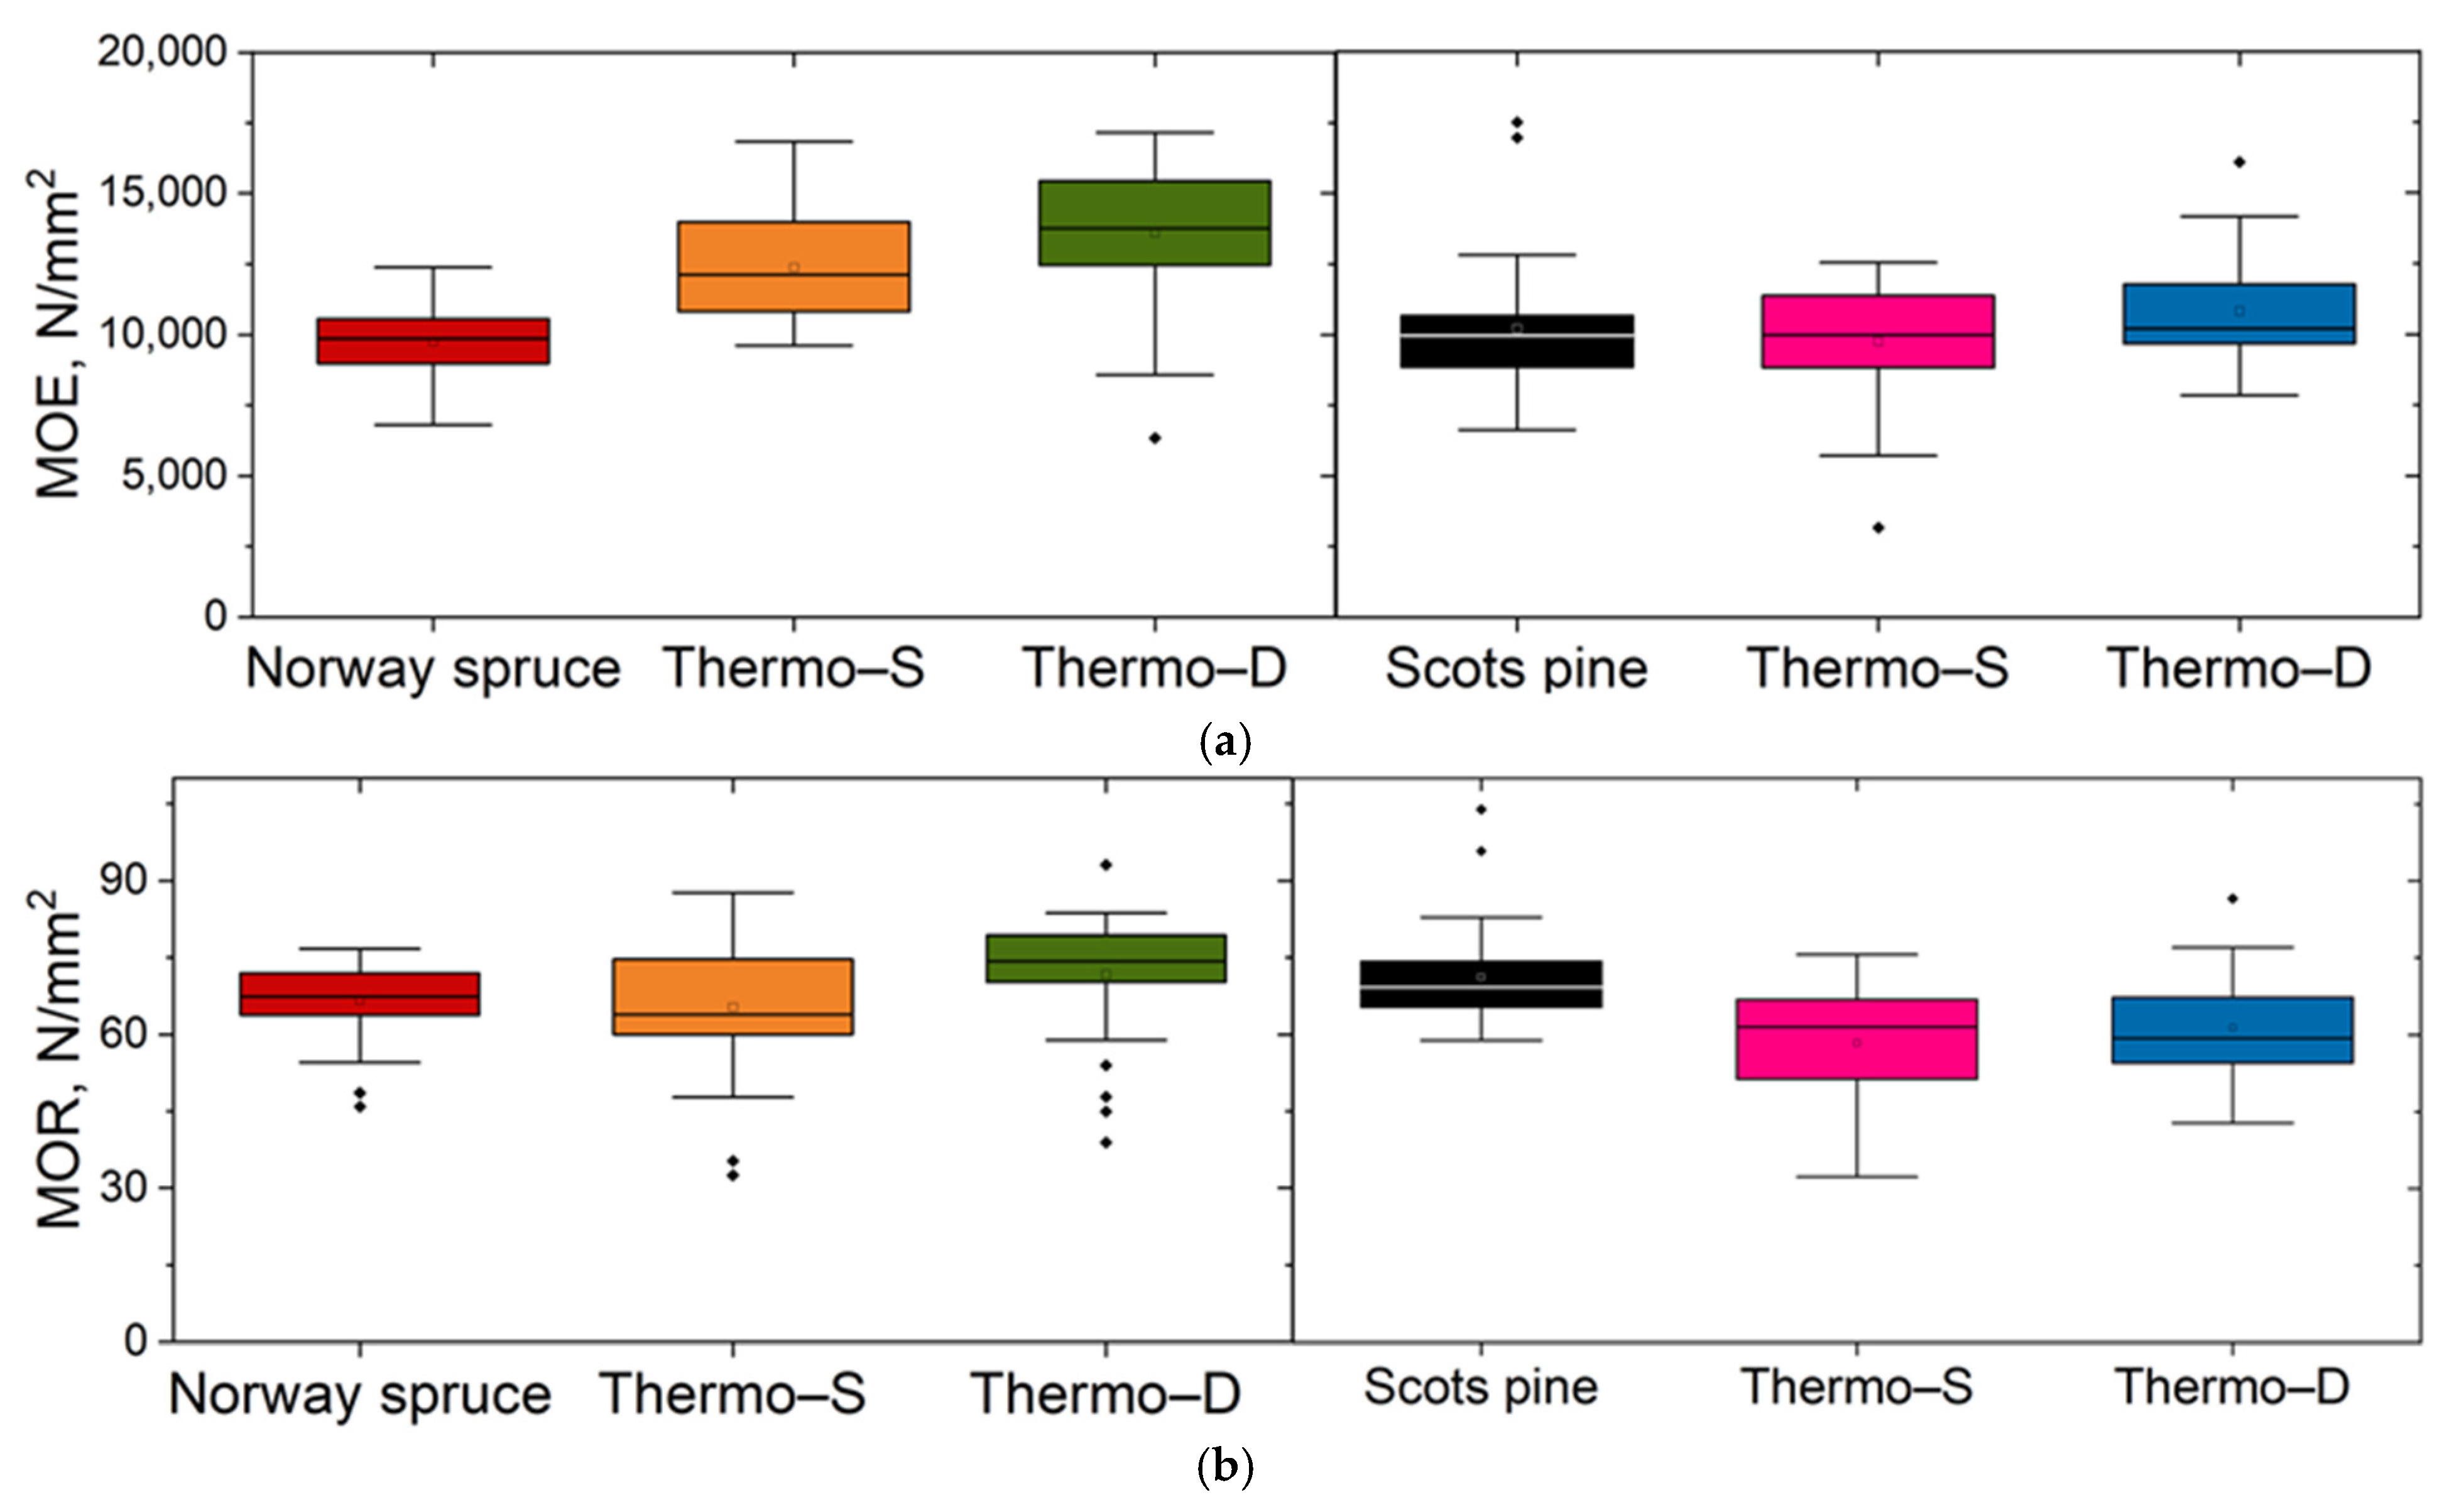
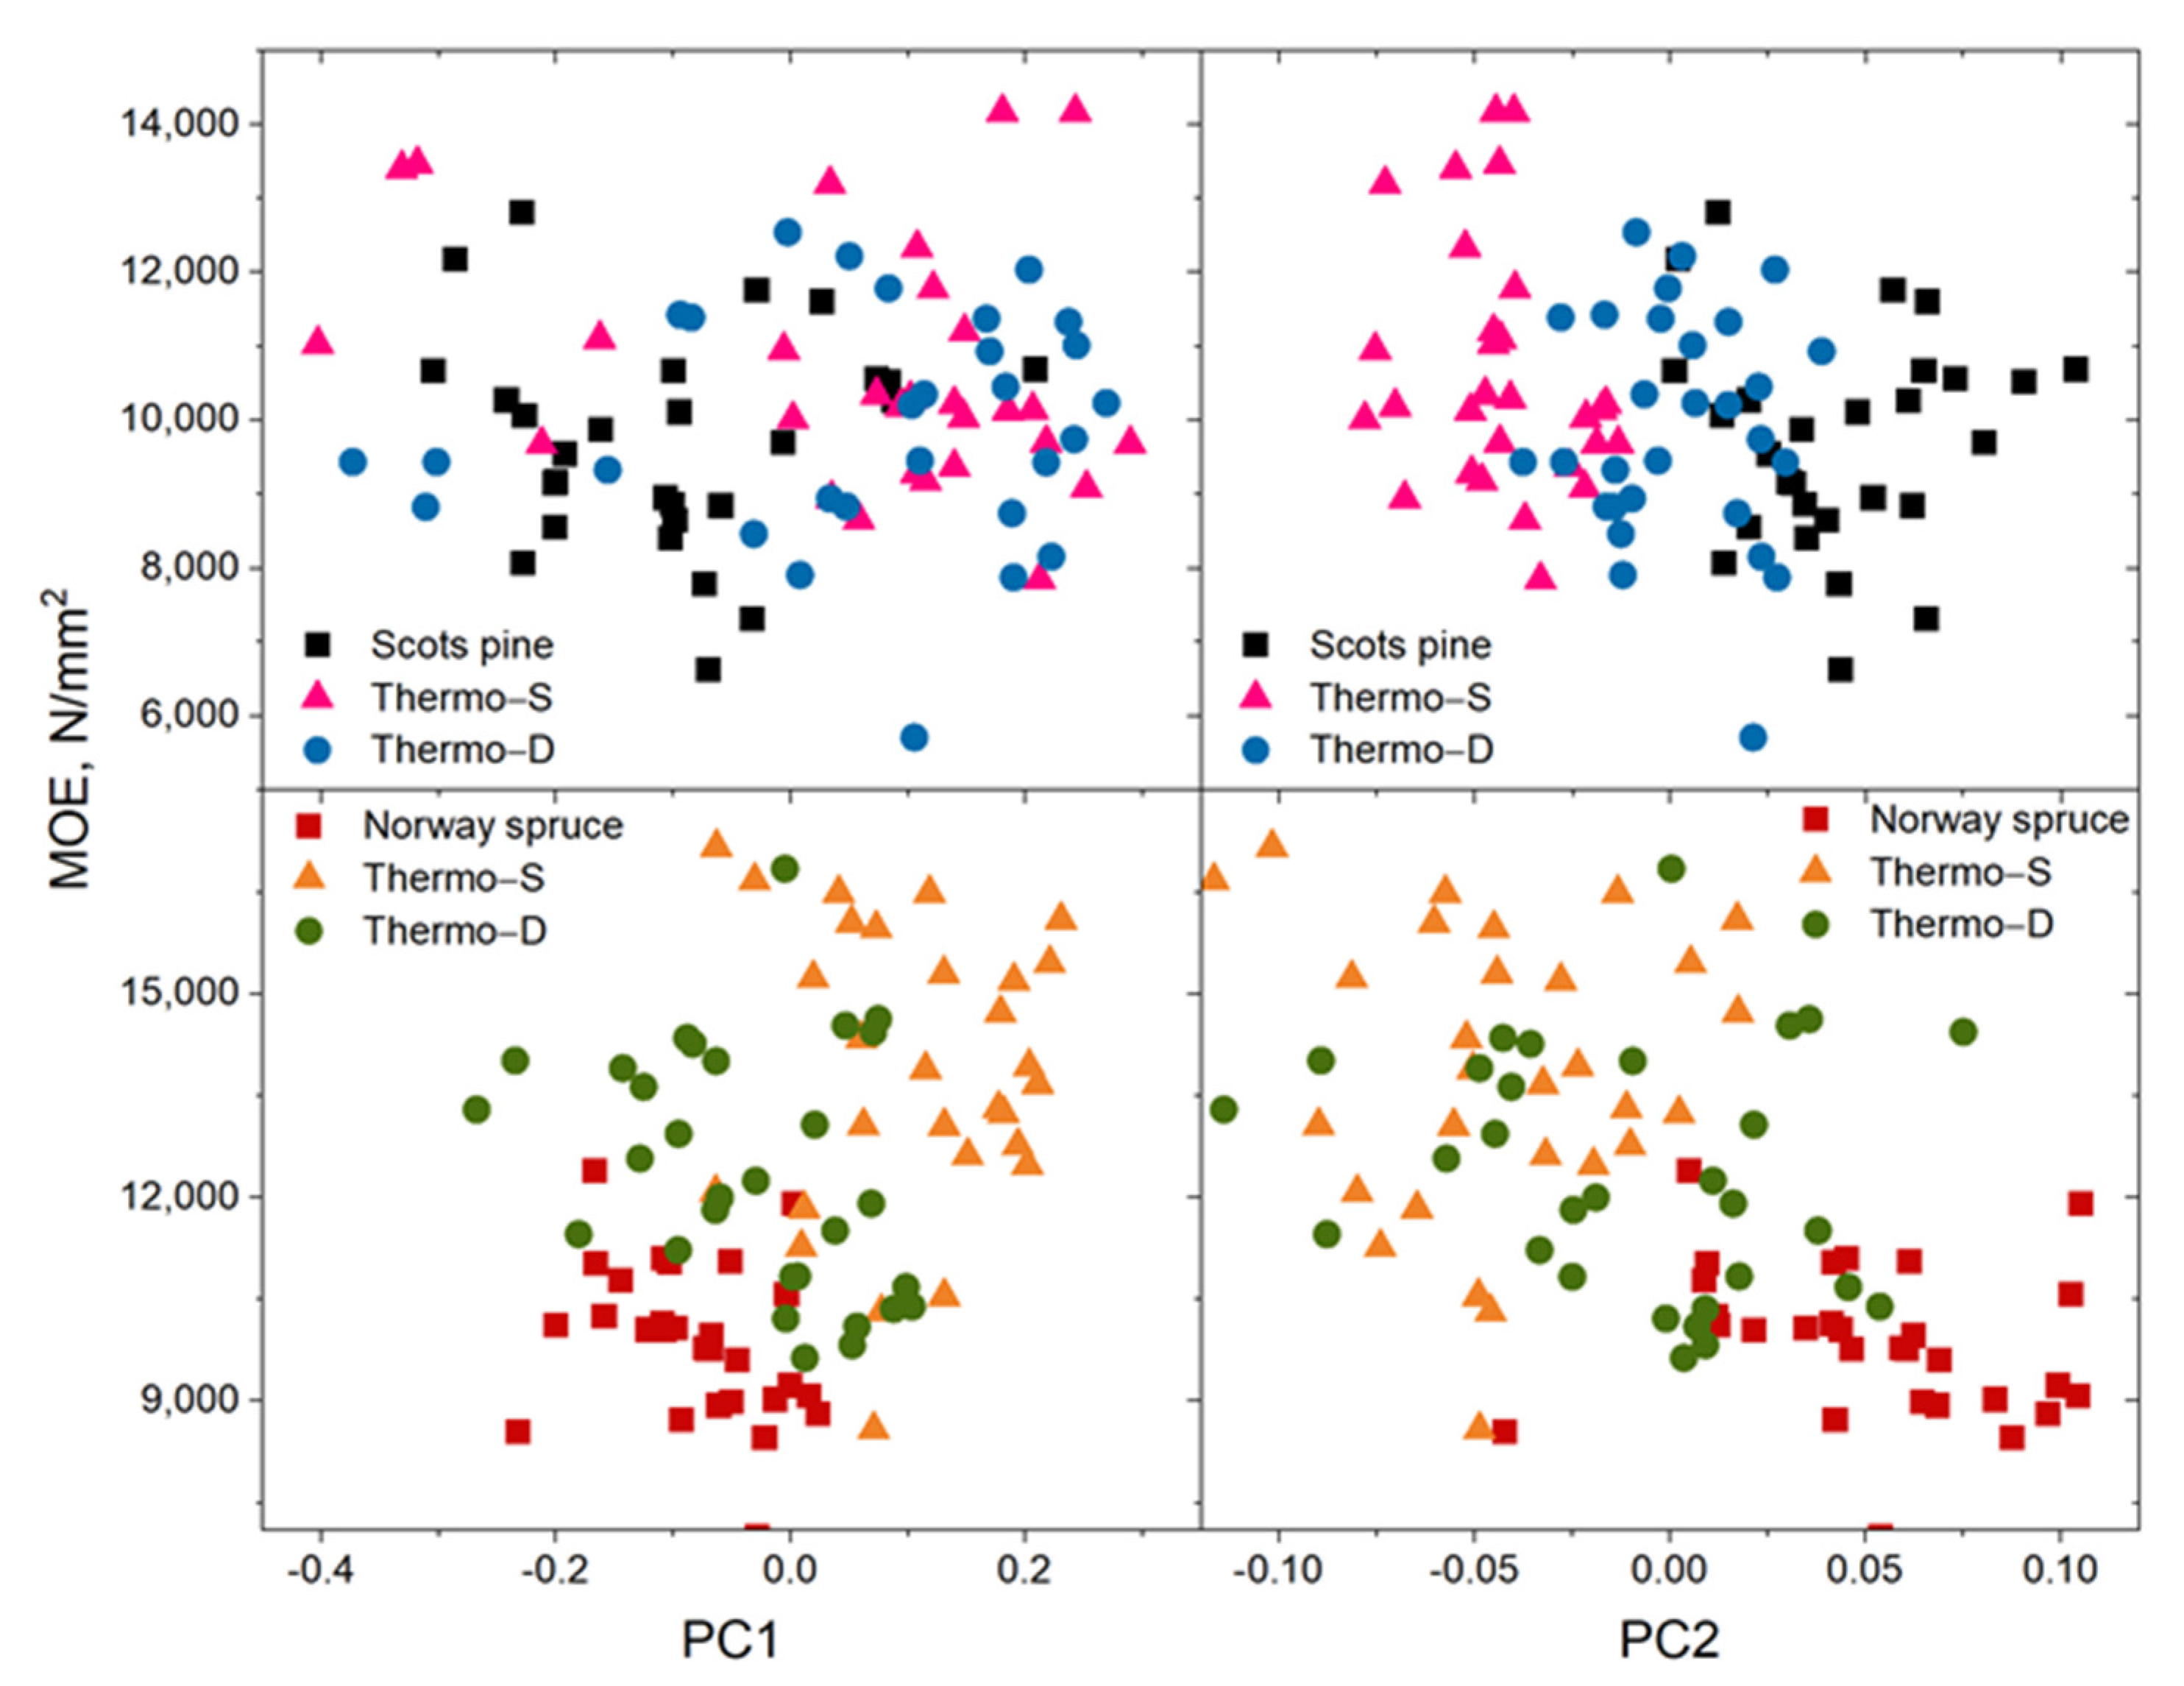
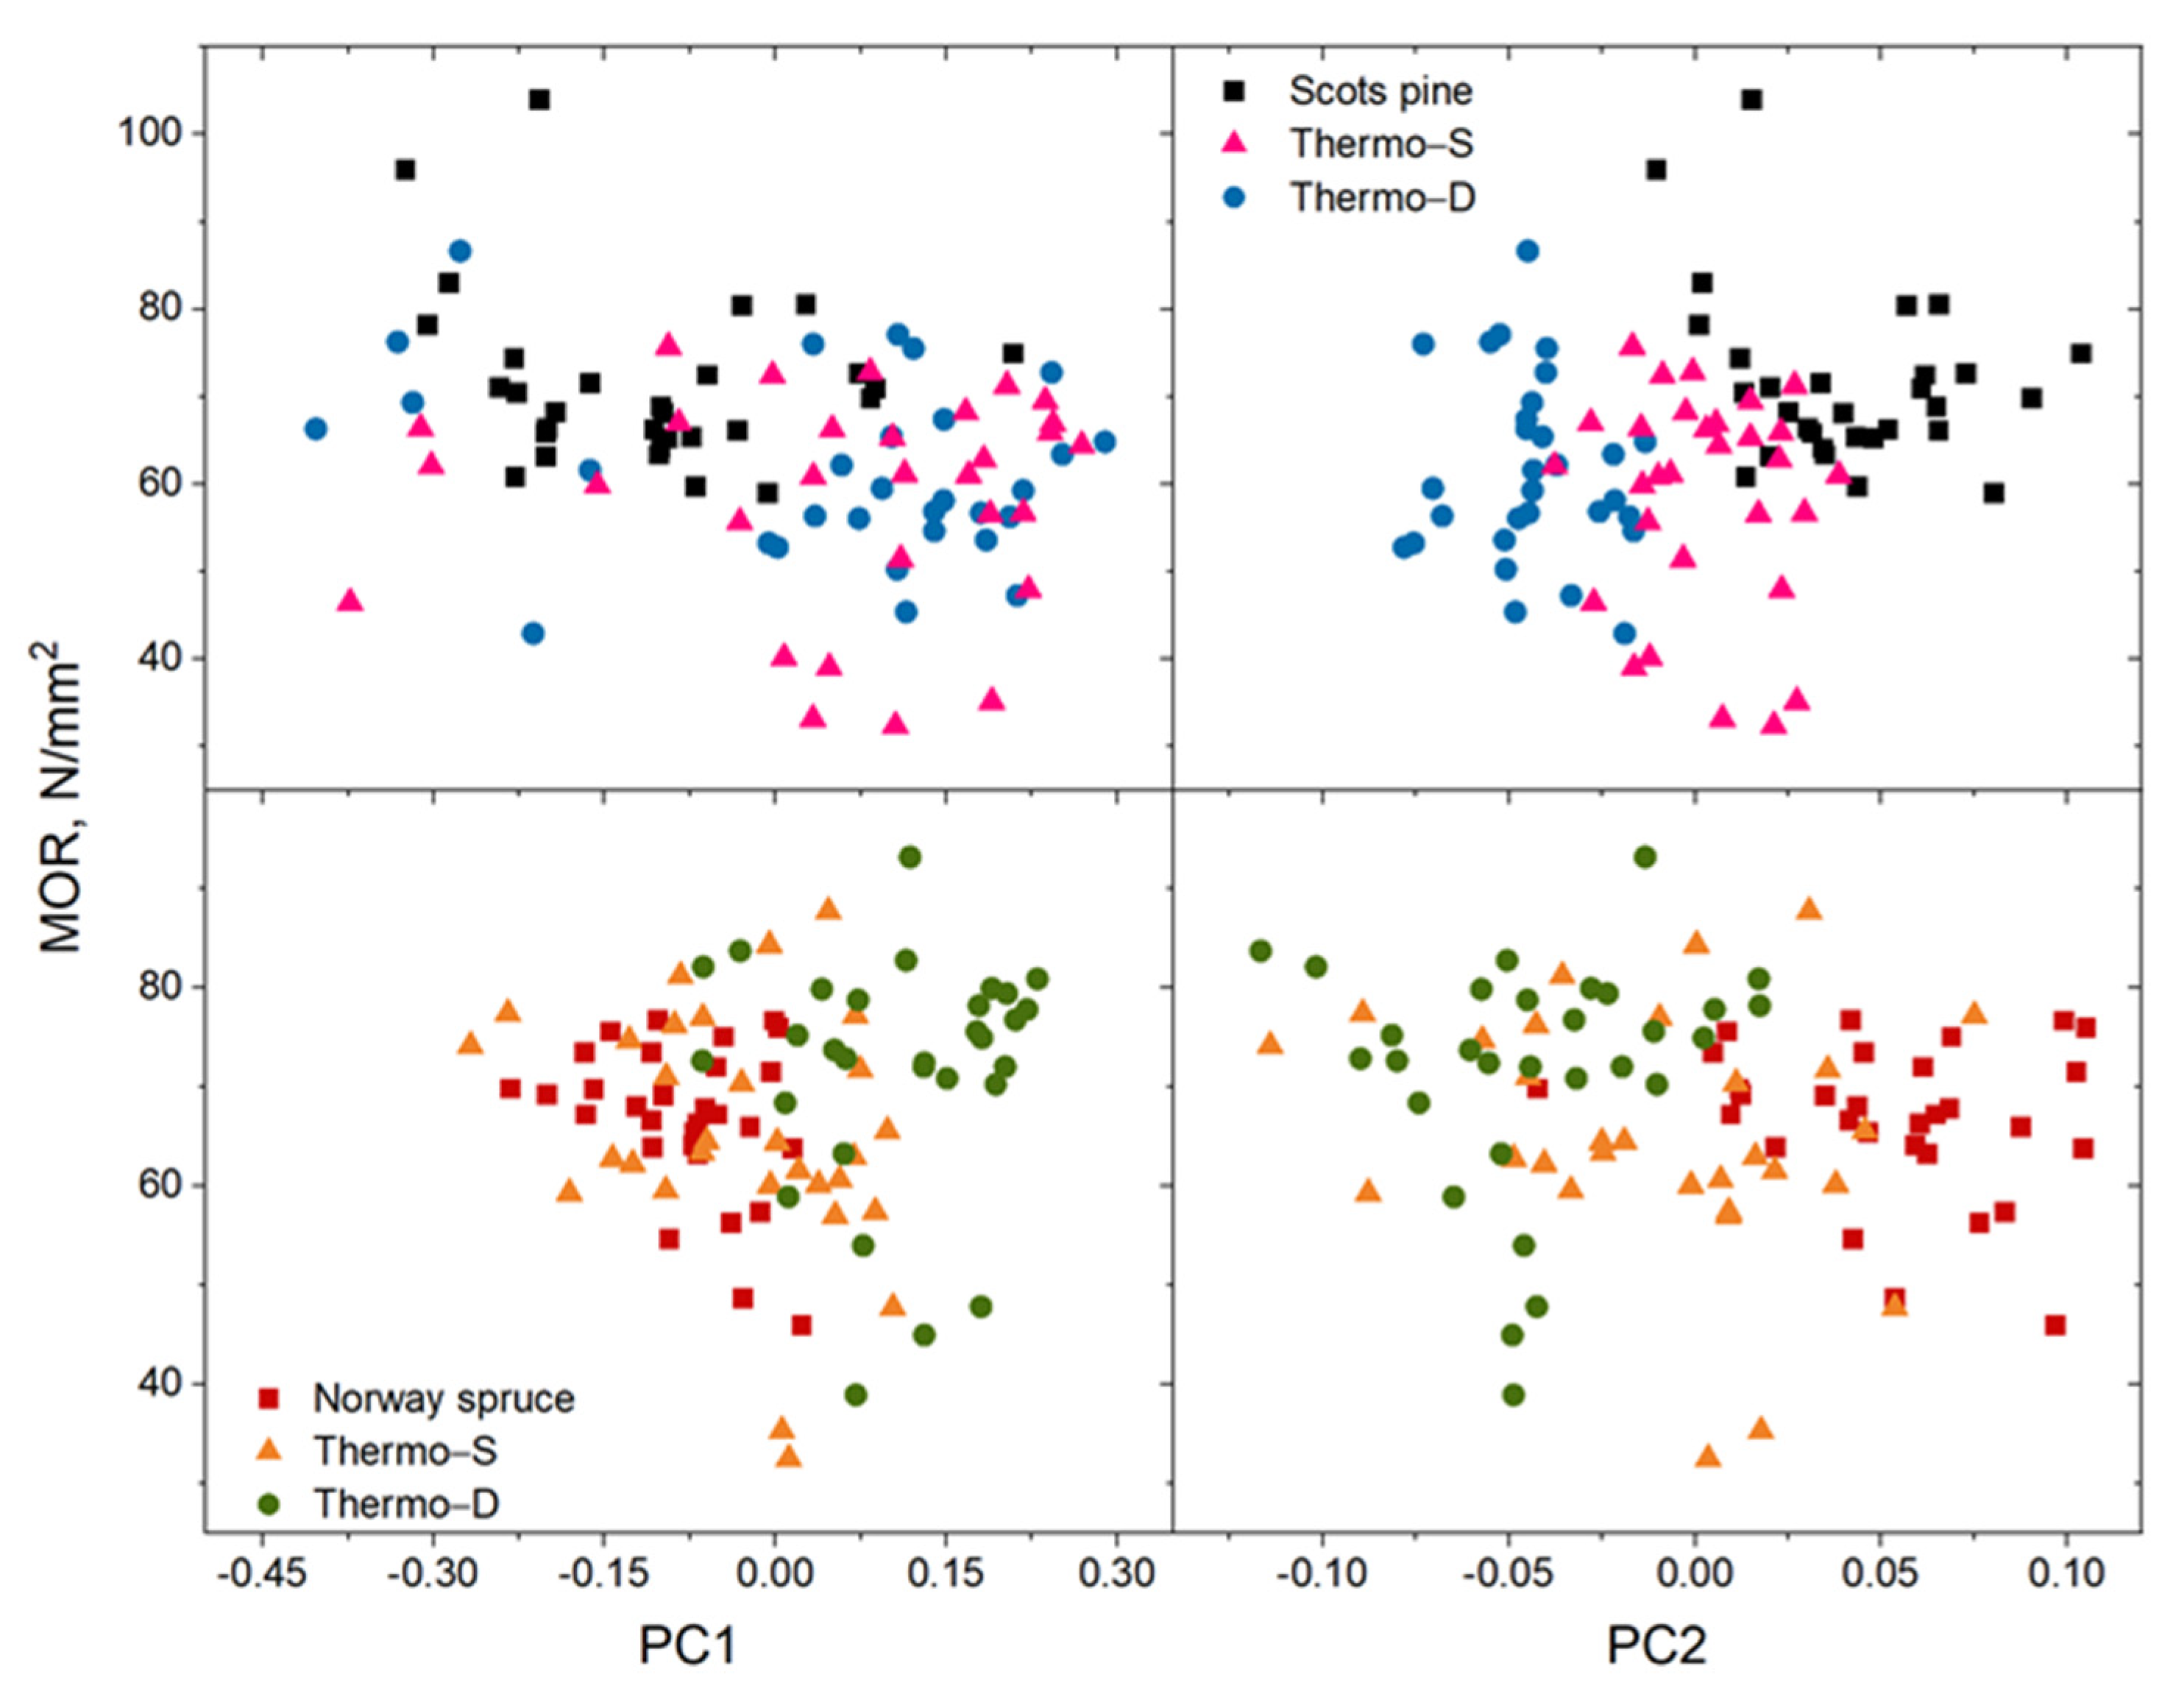
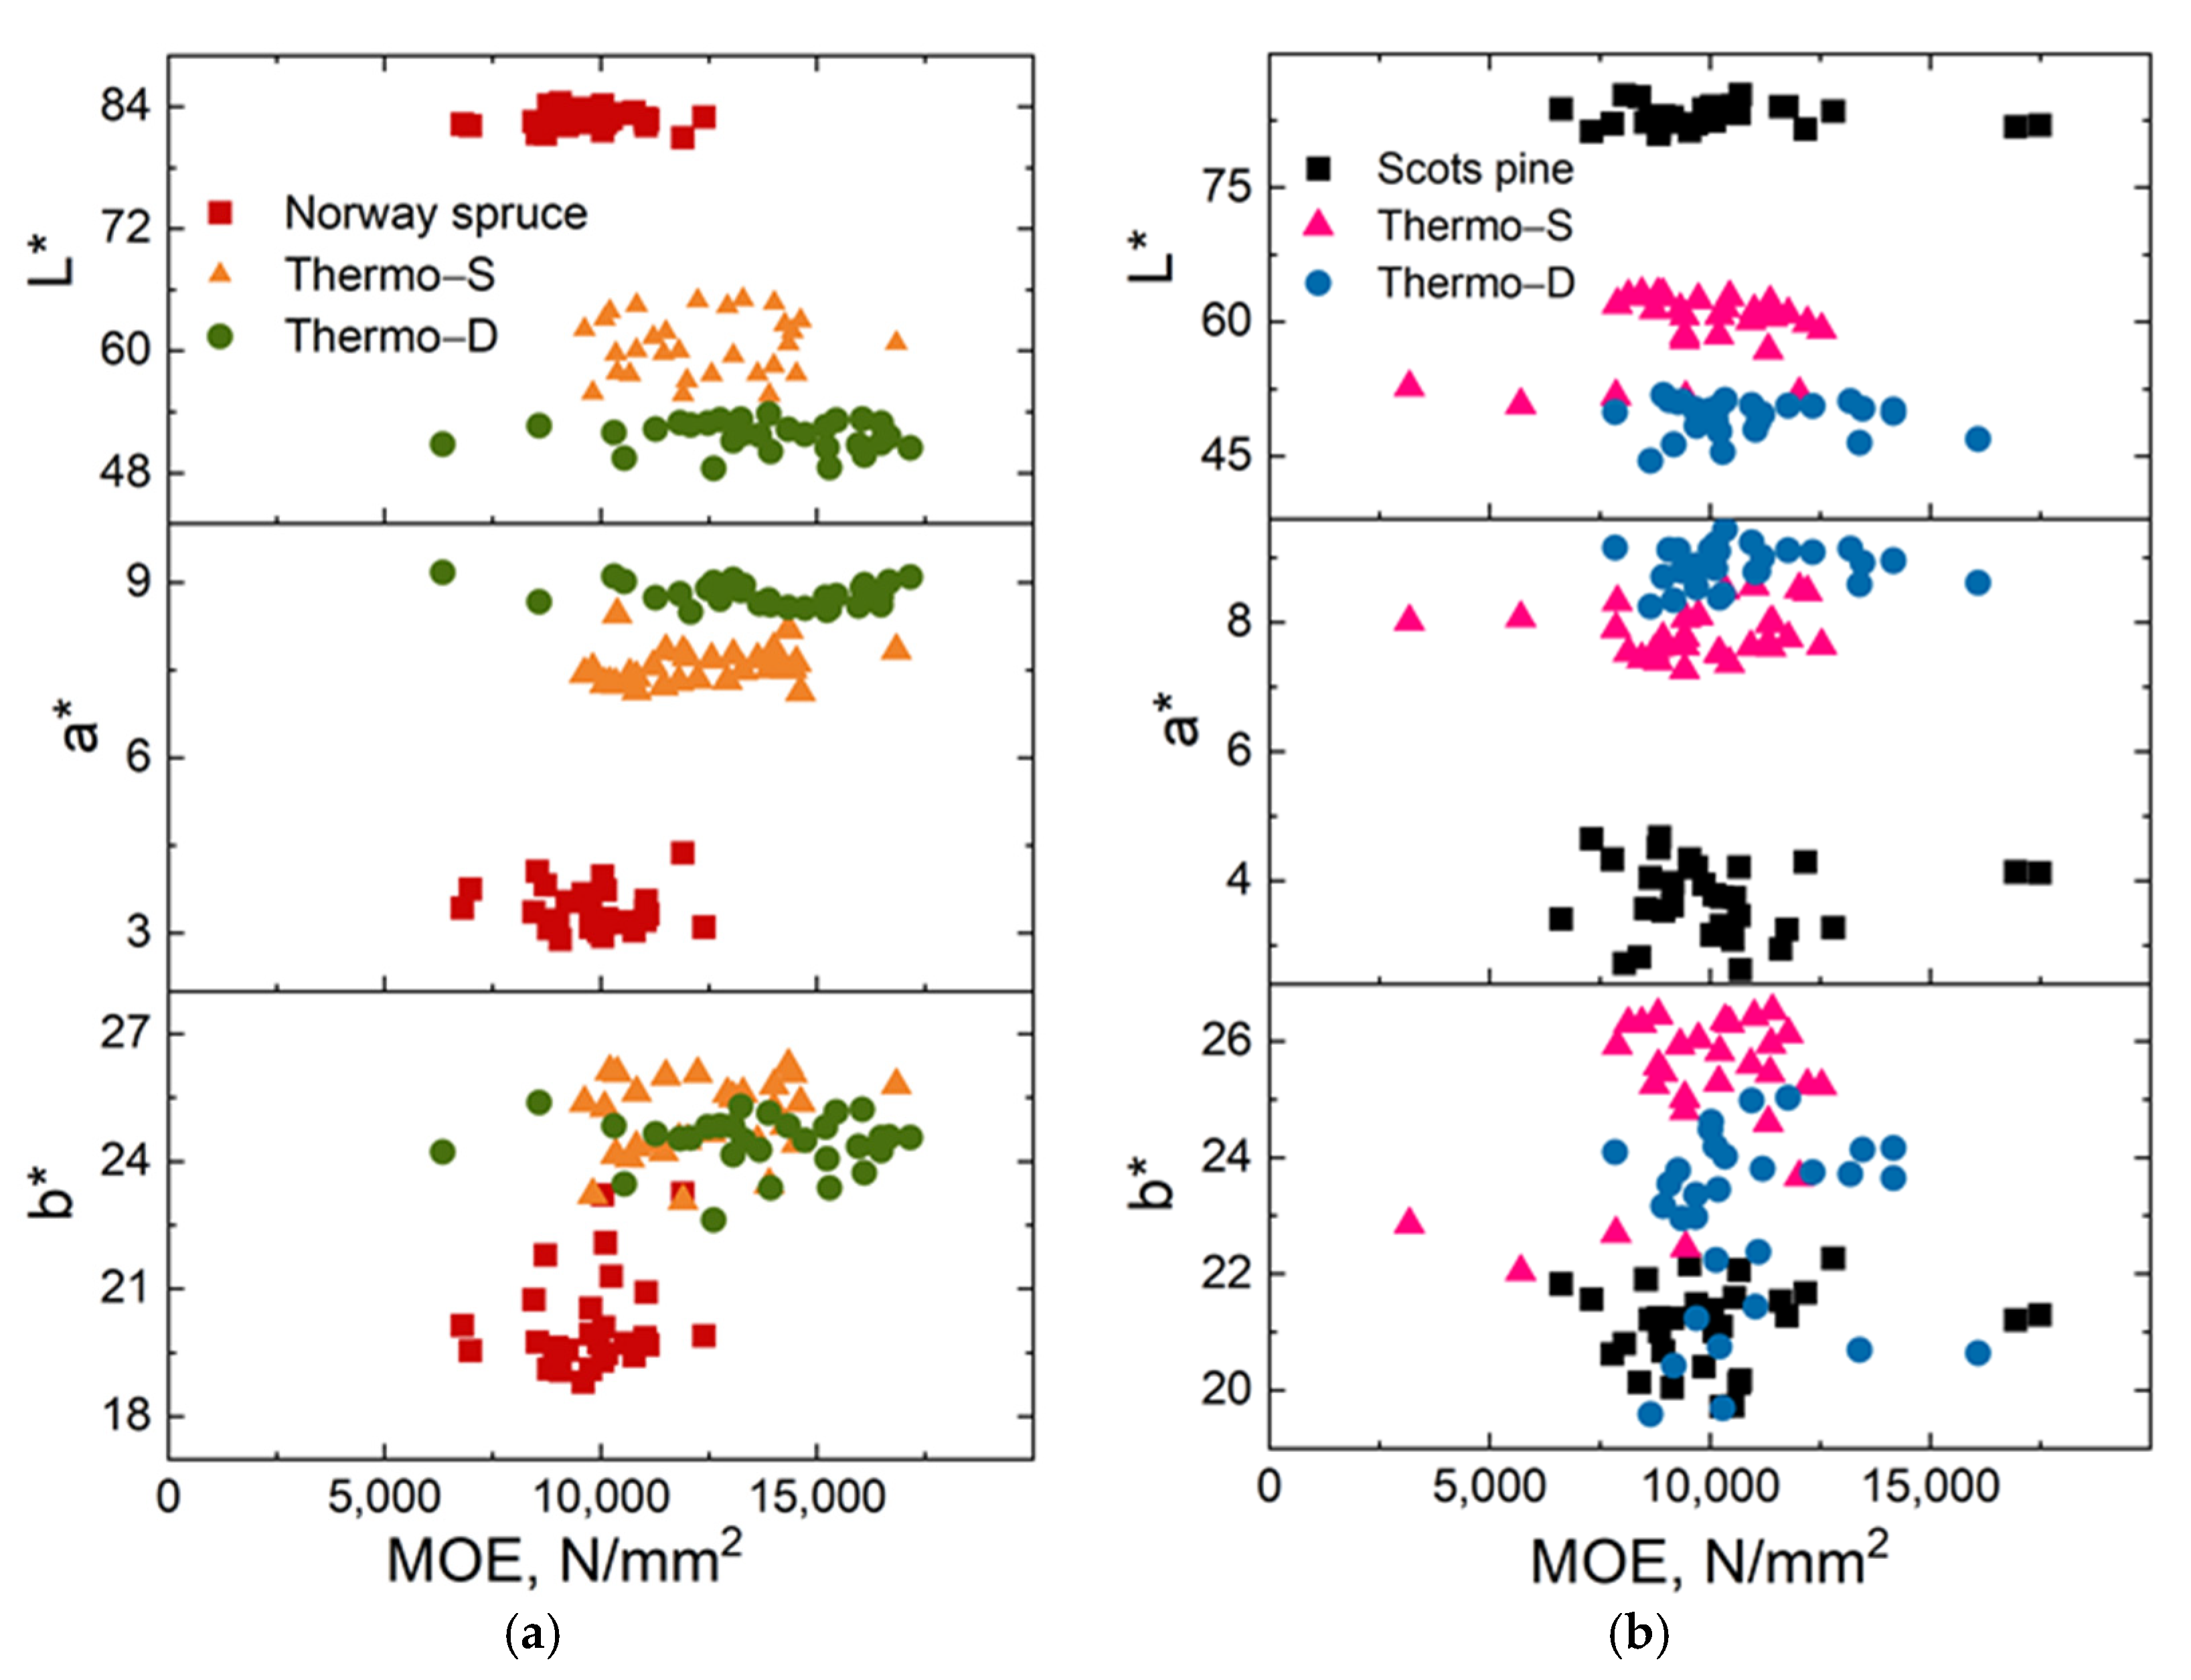
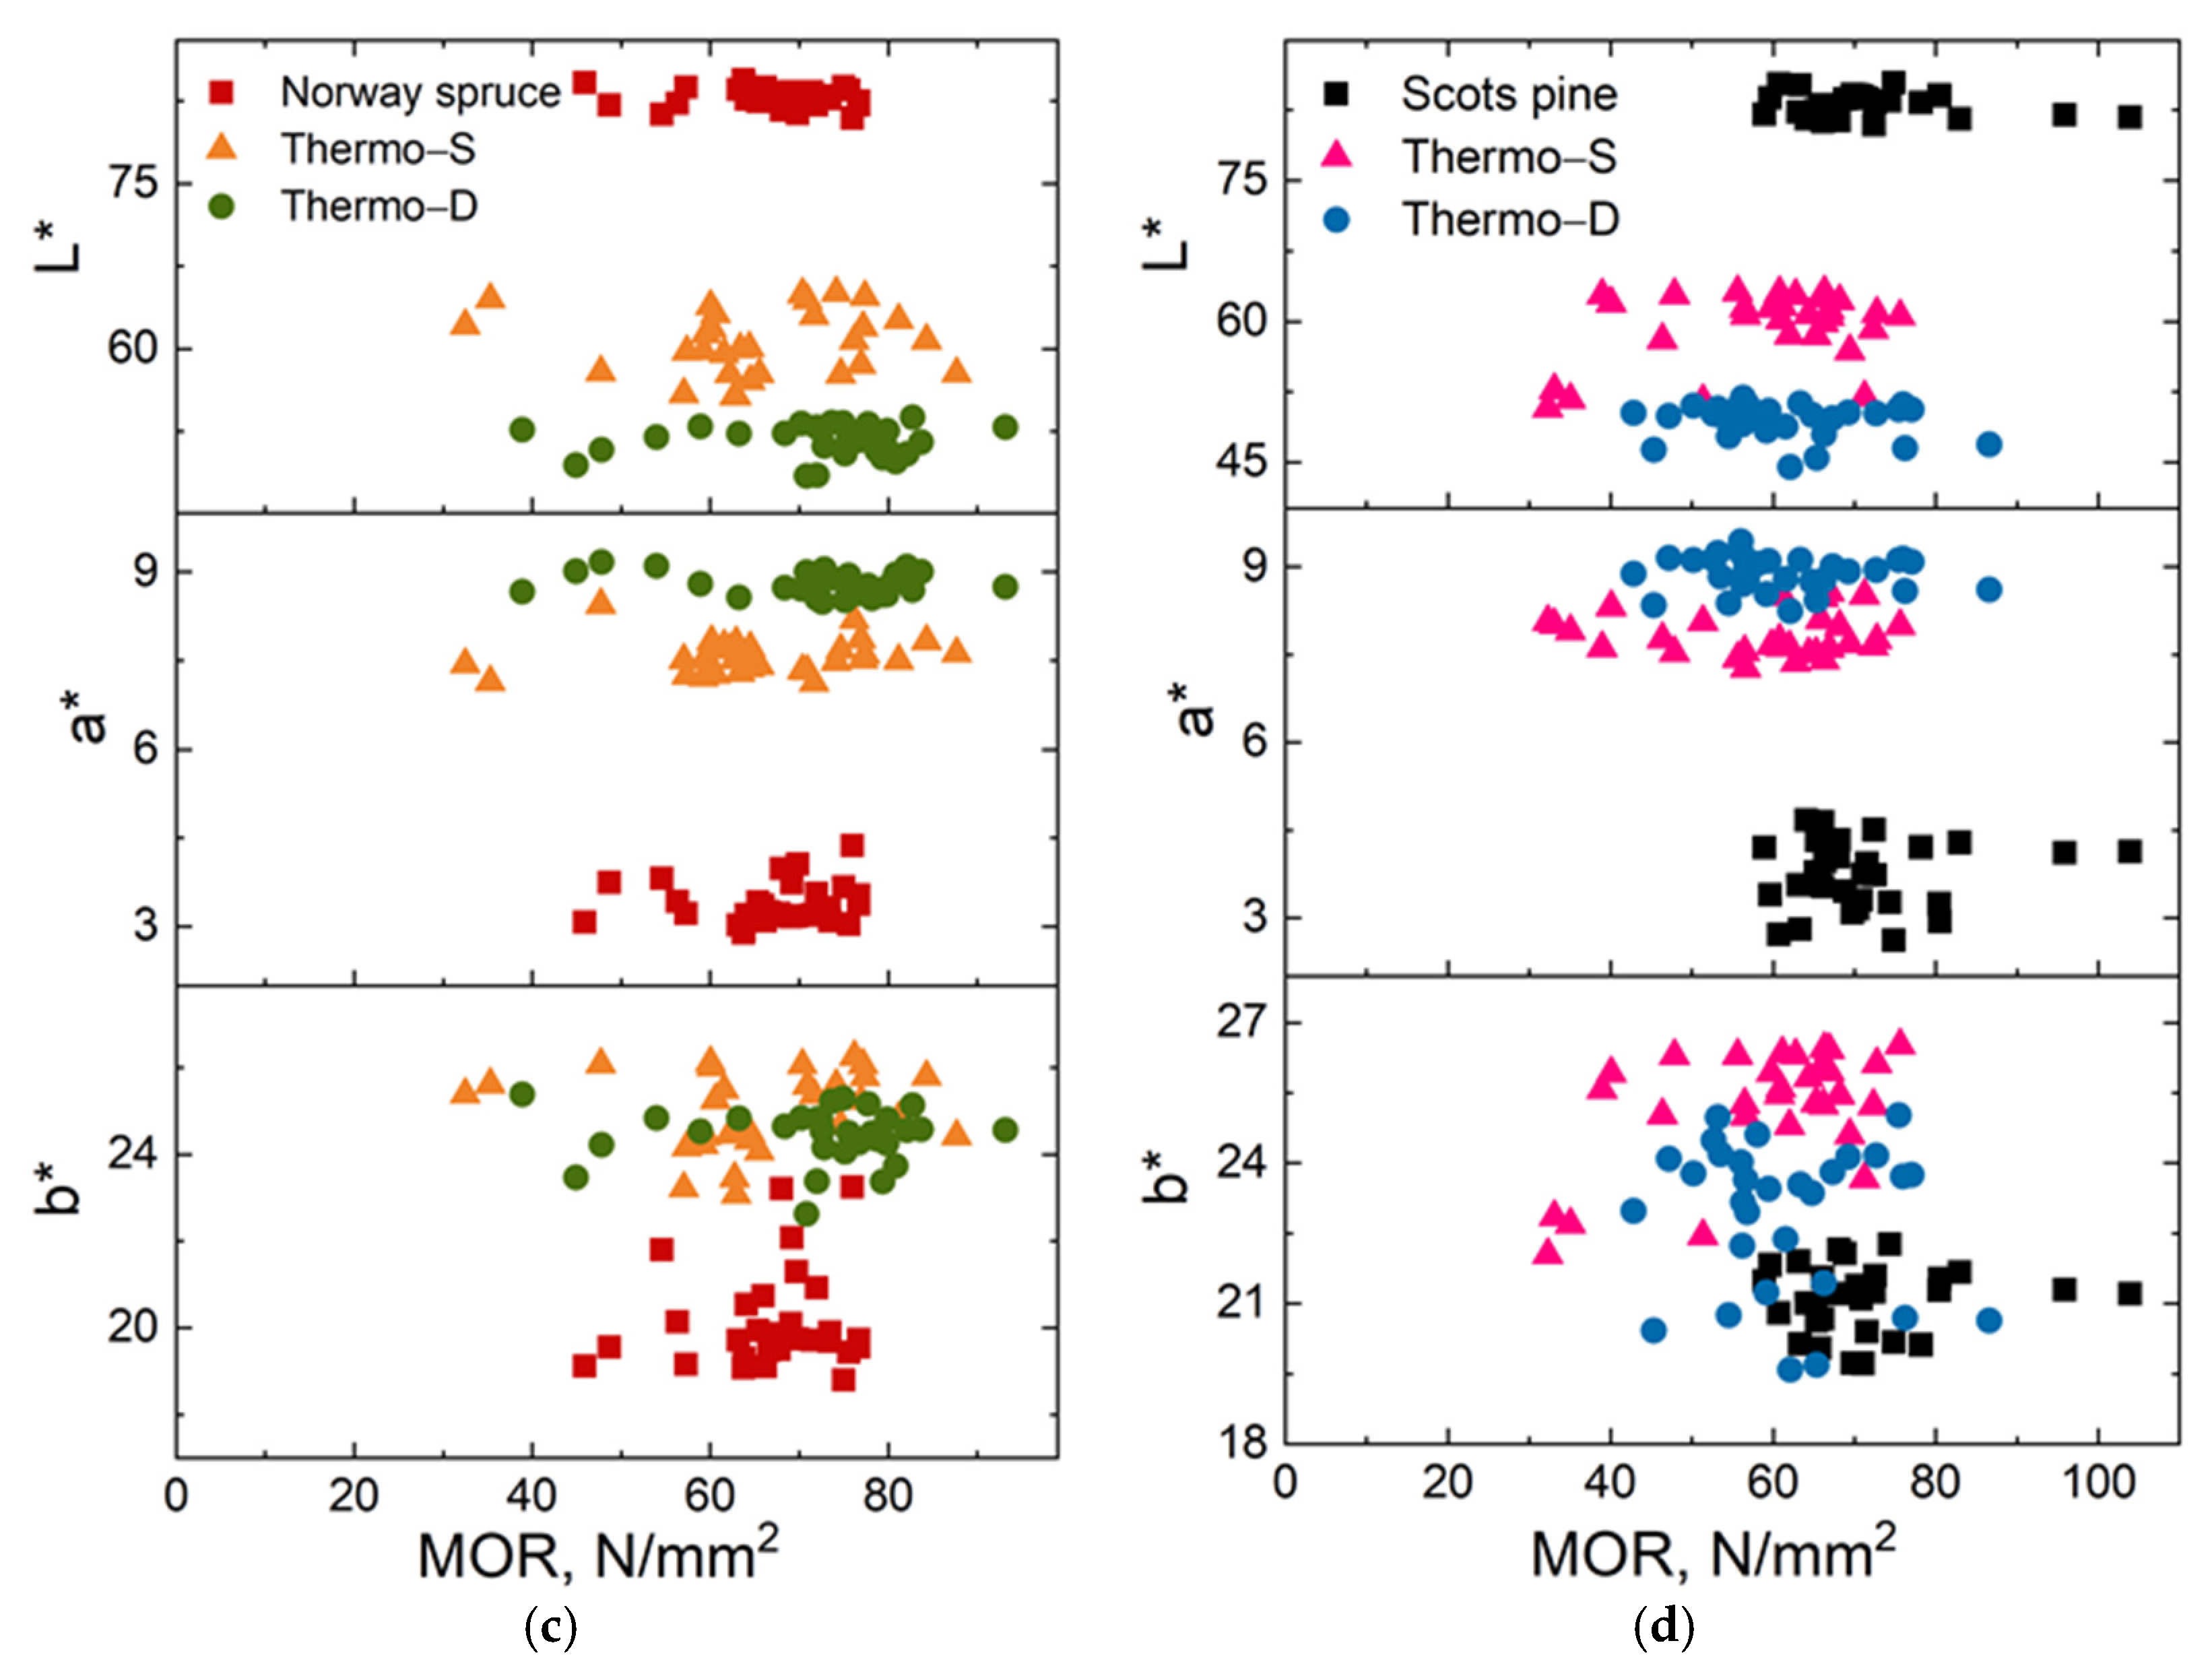
3.3. Modulus of Elasticity and Modulus of Rupture

In order to determine the mechanical properties of the reference and modified specimens, data were collected to ascertain density and moisture content (M.C.), as well as the measured modulus of elasticity (MOE) and modulus of rupture (MOR), as shown in Table 3.
It is important to note that the values shown in Table 3 refer to samples direct from commercial production. As a result, there are no baseline values for untreated samples. However, it was interesting to note the exceptionally high density for Thermo–D Norway spruce. Visual examination of the samples prior to testing noted denser annual ring growth for Norway spruce samples compared to those for Scots pine. The corresponding M.C. values for Norway spruce show the expected reduction in moisture due to the intensity of the thermal modification.
In Figure 6, the measured modulus of elasticity (MOE) and the modulus of rupture (MOR) values for the untreated and ThermoWood® Norway spruce and Scots pine wood are presented. The MOE and MOR values for untreated timber were similar, but they varied for the Thermo–S and Thermo–D treated wood species, being higher for Norway spruce wood as a result of the higher–than–expected density of the Thermo–D samples. However, the statistical variation bars show a degree of overlap between all specimens tested.
Generally, MOE was less affected, whereas MOR was more affected by the thermal modification. For Norway spruce, MOR indicated an increase in the values for the Thermo-D treatment, whereas Scots pine showed a slight decreasing trend with the increase in temperature. At the same time, the variability in the individual MOR values for this set of samples was larger.
The alteration of the mechanical properties was considered to be due to the loss of hemicelluloses, as well as the modification of the lignin structure. The decrease in hemicellulose content and the modification of the lignin structure was also observed through infrared spectroscopy.
Kocaefe et al. [92] mentioned in their study that the MOE values “can decrease or even increase slightly depending on the treatment conditions.” Won et al. [93] observed increased values for thermal treated Pinus densiflora compared to untreated samples. Herrera-Builes et al. [91], using specimens of 410 × 25 × 25 mm (L x R x T), found an increase in MOR of about 47 and 22% after thermal modification of wood at 170 and 190 °C, respectively, whereas MOE increased by 4 and 10%, respectively. The authors mentioned that the increase in mechanical properties might have been due to the condensation reactions in lignin and the rearrangement and crystallinity increase of cellulose, which may have acted as a “hardener” [91,94].
When plotting the MOE as a function of PC1 and PC2 scores (Figure 7), one can observe better cluster separation with the PC1 scores for Norway spruce, whereas for Scots pine there was some cluster separation of the untreated and thermal modified timber with the PC2 scores.
Considering the MOR values plotted as a function of PC1 and PC2 scores (Figure 8), the only cluster separation was observed for Scots pine wood, when MOR was plotted as a function of the PC2 scores.
Better cluster separation was found between L*, a*, and MOE/MOR for both wood species between untreated and thermal modified timber, but no real cluster separation could be identified between the b* parameter and MOE/MOR values (Figure 9).
During thermal treatment, the wood components start to degrade, eliminating volatile organic compounds; the crystallinity of cellulose increases; and condensation and crosslinking reactions taking place in lignin or lignin and other compounds. It has been reported [69] that hemicelluloses start to degrade first due to their lower molecular weight and branched structure. Their degradation results in a reduced amount of hydroxyl groups and the release of formic and acetic acids, which act as catalysts for further decomposition of lignin and cellulose and the formation of cross–linked structures. All these induce a decrease in the hygroscopicity of the wood and an improvement in the dimensional stability, but the strength properties of the wood are reduced [95,96].

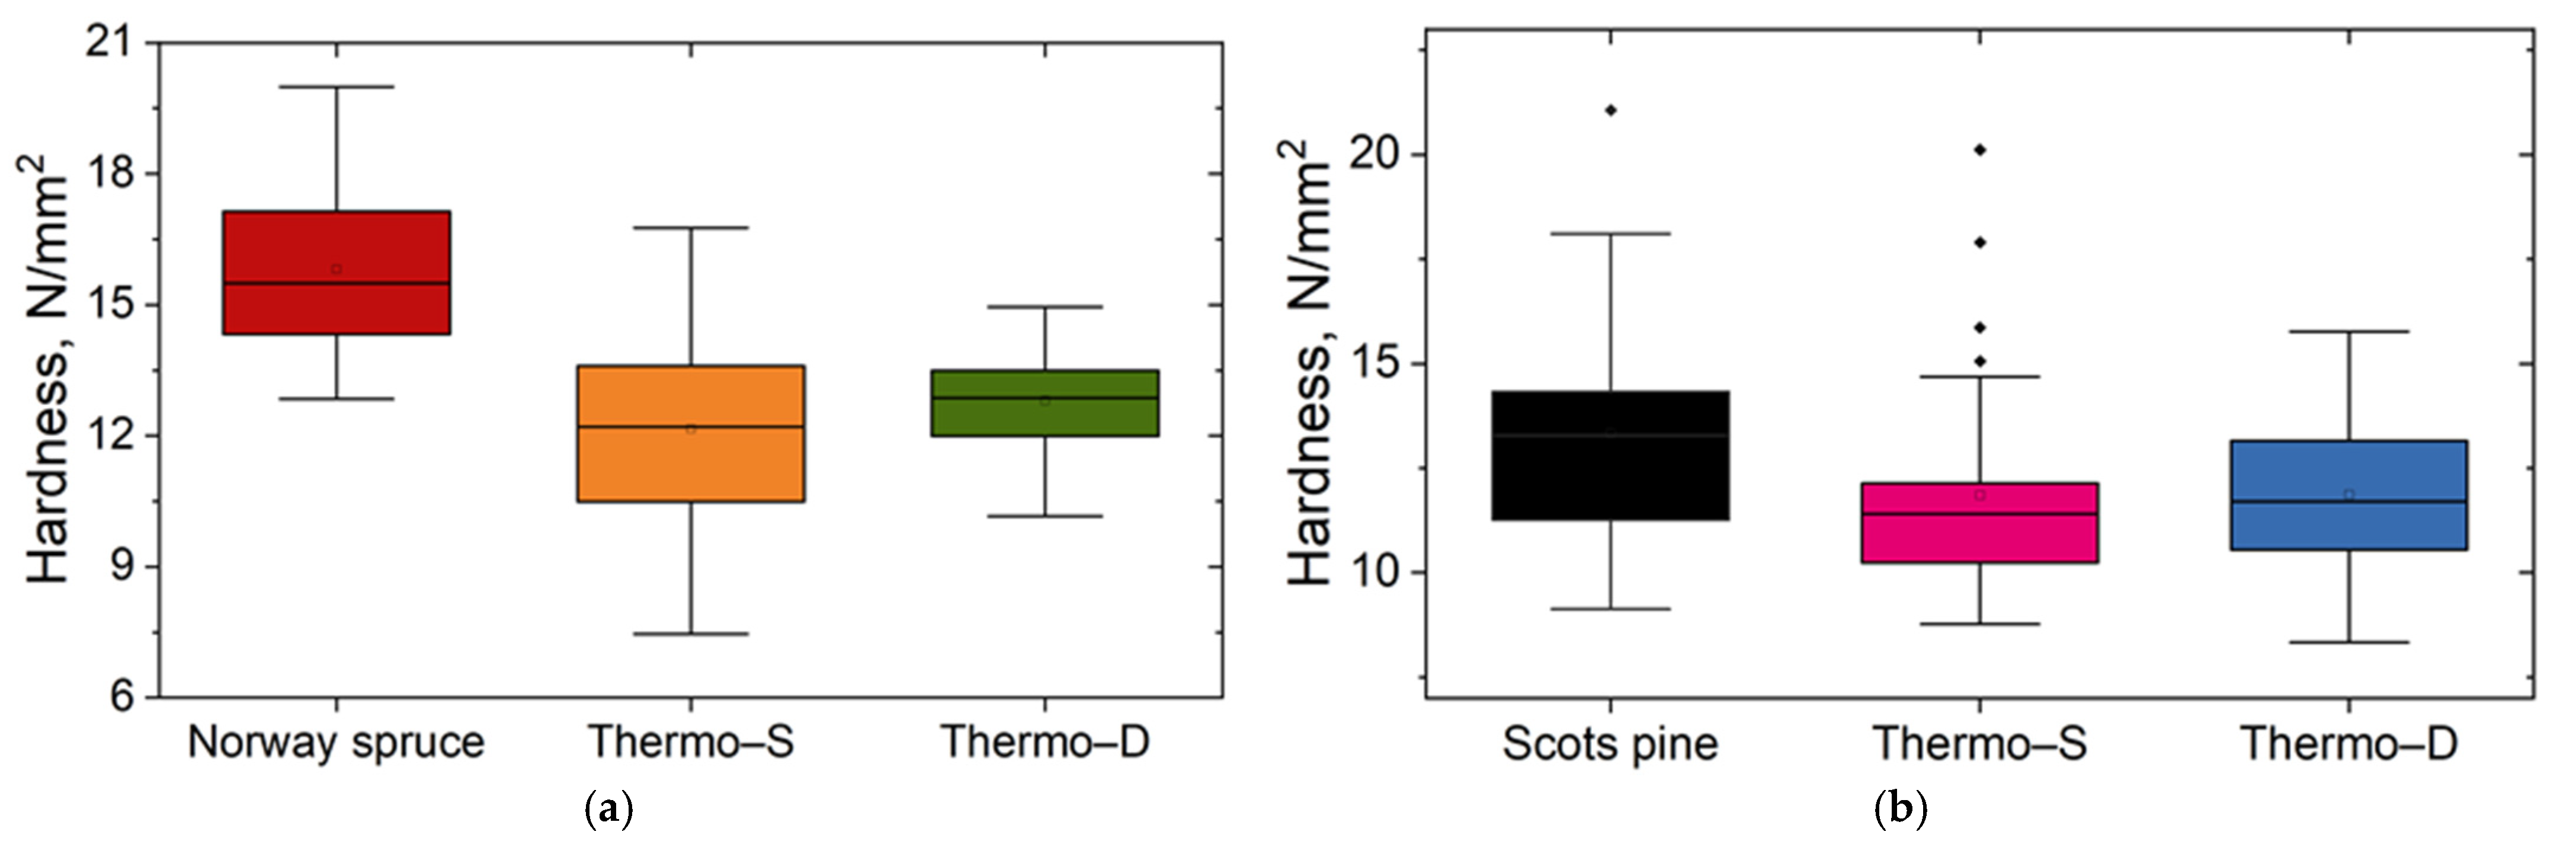
3.4. Brinell Hardness

The calculated hardness values for the untreated and ThermoWood® Norway spruce and Scots pine were determined at points corresponding to the total Brinell hardness, where the load was still being applied (HBD), and the plastic component of the Brinell hardness (HBP), measured after the load had been released, in order to determine the elastic recovery of the specimens (Table 4). The Brinell hardness values after the release of force for the sample groups are presented in Figure 10. The results in Table 4 seem to suggest that although there was a slight reduction in total Brinell hardness between untreated and treated specimens, there was a general reduction in the elastic recovery between Thermo–S and Thermo–D pine. The increased value noted for Thermo–D spruce may be partly attributed to the higher density of these specimens.
The results show a decrease in hardness for the Thermo–S and Thermo–D Norway spruce and Scots pine comparing to the untreated timber, with average values of about 15.8 and 13.3 N/mm2 for untreated Norway spruce and Scots pine, 12.2 and 11.9 N/mm2 for Thermo–S Norway spruce and Scots pine, and 12.8 and 11.9 N/mm2 for Thermo–D Norway spruce and Scots pine, respectively.
The results obtained from the ThermoWood® Norway spruce and Scots pine are in correlation with the literature data; the hardness decreased with the increase in temperature [93,97,98].
To identify the possible correlation between the PCA and mechanical tests, the PC scores were plotted against the measured hardness values. The Brinell hardness plotted as a function of the PC1 and PC2 scores for the untreated, Thermo–S, and Thermo–D Norway spruce and Scots pine is presented in Figure 11. As can be observed, there was no real differentiation between the untreated and modified timber when hardness was plotted against the PC1 score, with all the values overlapping. When the hardness was plotted against the PC2 scores, we could observe a certain differentiation between the untreated and the two thermal modifications, with only a partial overlapping.
Similar to MOE and MOR, when plotting L*, a*, and b* parameters as a function of Brinell hardness, better cluster separation for L*, a*, and Brinell hardness for both wood species between untreated and thermal modified timber was observed, though no real cluster separation could be identified between the b* parameter and Brinell hardness values (Figure 12).

4. Conclusions

Despite the advances in using colour as a key parameter for quality control of thermally modified wood [38,39], additional evidence to support quality control would enhance the commercial properties of products such as ThermoWood®. In this research, Norway spruce and Scots pine sawn timber, thermally modified via the ThermoWood® process, were evaluated for structure, colour, and mechanical property changes, as well as the correlation between them. To do so, infrared spectroscopy and principal component analysis, colour measurements, hardness, and bending strength were used. With infrared spectroscopy and PCA, it was possible to identify the structural changes at the molecular level. They indicated a modification in amorphous carbohydrates as well as in lignin. At the same time, by using PCA, it was possible to differentiate between untreated and modified wood. The colour measurements showed a decrease in the L* value and an increase in the a* and b* values, indicating reduced brightness, and a shift toward the red and yellow colours after thermal modification. Moreover, by using the ΔE* and PC scores, it was possible to differentiate between the two modification processes (Thermo–S and Thermo–D).
Hardness was found to decrease in thermally modified wood, whereas the MOE and MOR showed limited changes in values for modified wood compared to unmodified ones. This might be due to the modifications at the molecular level between the wood components, such as condensation reactions in lignin and the rearrangement and crystallinity increase of cellulose. However, the higher-than-expected density of Thermo–D Norway spruce specimens played a significant role in the limited differences noted.
By using the mechanical properties and PC scores, it was possible to differentiate the untreated wood from the modified ones, but no real differentiation was observed between the two modification regimes. This was possible when the colour parameters were used instead of the PC scores.
The combination between infrared spectroscopy, colour measurements, and mechanical tests can give valuable information on large sets of samples, thus contributing to a greater understanding of quality control. This is particularly important when considering large data sets, as would be generated with industrial production and quality control, given that the combination of these measurements can prevent the elimination of material from tested sets of samples.
The results within this paper suggest that current quality assurance methods [38,39] can be additionally supported by assessing the correlation between colour, mechanical properties, and infrared spectroscopy studies.

Author Contributions

Conceptualisation, P.T., D.J. and D.S.; methodology, P.T. and C.-M.P.; software, C.-M.P. and A.S.; validation, P.T. and D.J.; formal analysis, P.T.; investigation, C.-M.P. and A.S.; resources, D.S.; data curation, P.T., C.-M.P. and A.S.; writing—original draft preparation, P.T. and D.J.; writing—P.T., C.-M.P. and D.S.; visualisation, C.-M.P.; supervision, D.J. and D.S. All authors have read and agreed to the published version of the manuscript.

Funding

Support through CT WOOD-a centre of excellence at Luleå University of Technology, supported by the Swedish wood industry-is gratefully acknowledged. Additional support through the project "Advanced research supporting the forestry and wood-processing sector's adaptation to global change and the 4th industrial revolution," OP RDE (Grant No. CZ.02.1.01/0.0/0.0/16_019/0000803), is also acknowledged.

Conflicts of Interest

The authors declare no conflict of interest.

References

  1. Hill, C.A.S. Wood Modification: Chemical, Thermal and Other Processes; John Wiley & Sons: Chichester, UK, 2006; 239p. [Google Scholar]
  2. Gérardin, P. New alternatives for wood preservation based on thermal and chemical modification of wood—A review. Ann. For. Sci. 2016, 73, 559–570. [Google Scholar] [CrossRef] [Green Version]
  3. Sandberg, D.; Kutnar, A.; Mantanis, G.I. Wood modification technologies—A review. iForest 2017, 10, 895–908. [Google Scholar] [CrossRef] [Green Version]
  4. Jones, D.; Sandberg, D.; Goli, G.; Todaro, L. Wood Modification in Europe: A State-of-the-Art about Processes, Products and Applications; Firenze University Press: Florence, Italy, 2019; p. 113. ISSN 2704-601X. [Google Scholar]
  5. Stamm, A.J.; Burr, H.K.; Kline, A.A. Staybwood. Heat stabilized wood. Ind. Eng. Chem. 1946, 38, 630–634. [Google Scholar] [CrossRef]
  6. Thunell, B.; Elken, E. Värmebehandling av trä för Minskning av Svällning och Krympning; Report No. 18; The Swedish Wood Technology Research Institute: Stockholm, Sweden, 1948; p. 23. (In Swedish) [Google Scholar]
  7. Buro, A. Die Wirkung von Hitzebehandlung auf die Pilzresistenz von Kiefern- und Buchenholz. [The influence of thermal treatment on decay resistance of pine and beech wood]. Holz Roh- Werkst. 1954, 12, 297–304. [Google Scholar] [CrossRef]
  8. Buro, A. Untersuchungen über die Veränderung der Pilzresistenz von Hölzern durch Hitzebehandlung in Metallschmelzen. [Investigation of the change in decay resistance of wood during thermal treatment in a metal melt]. Holzforschung 1955, 9, 177–181. [Google Scholar] [CrossRef]
  9. Burmester, A. Formbeständigkeit von Holz gegenüber Feuchtigkeit—Grundlagen und Vergütungsverfahren. [Influnce of Moisture on Dimension Stability of Wood–Theory and Improvements]; BAM Berichte No. 4; Bundesanstalt für Materialforschung: Berlin, Germany, 1970. (In German) [Google Scholar]
  10. Burmester, A. Effect of heat-pressure treatments of semi-dry wood on its dimensional stability. Holz Roh- Werkst. 1973, 31, 237–243. [Google Scholar] [CrossRef]
  11. Burmester, A. Zur Dimensionsstabilisierung von Holz. [The dimensional stabilization of wood]. Holz Roh- Werkst. 1975, 33, 333–335. [Google Scholar] [CrossRef]
  12. Burmester, A. Dimensational stabilisation of wood. In The Proceedings IRG Annual Meeting, Sarajevo, Yugoslavia; International Research Group on Wood Protection IRG/WP/3171: Stockholm, Sweden, 1981; 8p. [Google Scholar]
  13. Viitanen, H.A.; Jämsä, S.; Paajanen, L.M.; Nurmi, A.J.; Viitaniemi, P. The effect of heat treatment on the properties of spruce. In The Procedings IRG Annual Conference, Bali, Indonesia; International Research Group on Wood Protection IRG/WP 94-40032: Stockholm, Sweden, 1994; 5p. [Google Scholar]
  14. Viitaniemi, P.; Jämsa, S. Modification of Wood with Heat-Treatment; Technical Research Centre of Finland, VTT: Espoo, Finland, 1996; 57p. (In Finnish) [Google Scholar]
  15. Viitaniemi, P. ThermoWood-modified wood for improved performance. In Proceedings of the 4th Eurowood Symposium “Wood—The Ecological Material”, Stockholm, Sweden, 22–23 September 1997; Trätek Report No. P9709084. pp. 67–69. [Google Scholar]
  16. Boonstra, M.J.; Tjeerdsma, B.F.; Groeneveld, H.A.C. Thermal modification of non-durable wood species. Part 1. The Plato technology: Thermal modification of wood. In The Proceedings IRG Annual Meeting, Maastricht, The Netherlands; International Research Group on Wood Protection IRG/WP 98-40123: Stockholm, Sweden, 1998. [Google Scholar]
  17. Militz, H.; Tjeerdsma, B. Heat treatment of wood by the Plato-process. In Proceedings of the Seminar on Production of Heat Treated Wood in Europe, Helsinki, Stockholm and Oslo, 20 November 2000. [Google Scholar]
  18. Willems, W. Method and Apparatus for Preserving Wood, and Wood Product. WO Patent No. 2000405, 22 December 2006. [Google Scholar]
  19. Dirol, D.; Guyonnet, R. The improvement of wood durability by retification process. In The Proceedings IRG Annual Meeting, Orlando, FL, USA; International Research Group on Wood Protection IRG/WP/93-40015: Stockholm, Sweden, 1993. [Google Scholar]
  20. Weiland, J.J.; Guyonnet, R. Study of chemical modifications and fungi degradation of thermally modified wood using DRIFT spectroscopy. Holz Roh- Werkst. 2003, 61, 216–220. [Google Scholar] [CrossRef]
  21. Vernois, M. Heat treatment of wood in France–State of the art. In Proceedings of the COST Action E22; Centre technique du Bois et de l’Ameublement: Paris, France, 2000. [Google Scholar]
  22. Rapp, A.O.; Sailer, M. Heat treatment of wood in Germany–State of the art. In Proceedings of the Seminar on Production of Heat Treated Wood in Europe, Helsinki, Stockholm and Oslo, November 2000. [Google Scholar]
  23. Sailer, M.; Rapp, A.O.; Leithoff, H.; Peek, R.D. Upgrading of wood by application of an oil-heat treatment. Holz Roh- Werkst. 2000, 58, 15–22. [Google Scholar] [CrossRef]
  24. Ohnesorge, D.; Tausch, A.; Krowas, I.; Huber, C.; Becker, G.; Fink, S. Laboratory tests on the natural durability of six different wood species after hygrothermal treatment. In Proceedings of the Fourth European Conference on Wood Modification, Stockholm, Sweden, 27–29 April 2009; pp. 159–164. [Google Scholar]
  25. Sivonen, H.; Maunu, S.; Sundholm, F.; Jämsa, S.; Viitaniemi, P. Magnetic resonance studies of thermally modified wood. Holzforschung 2002, 56, 648–654. [Google Scholar] [CrossRef]
  26. Esteves, B.; Marques, A.; Domingos, I.; Pereira, H. Heat-induced colour changes of pine (Pinus pinaster) and eucalyptus (Eucalyptus globulus) wood. Wood Sci. Technol. 2008, 42, 369–384. [Google Scholar] [CrossRef] [Green Version]
  27. Gonzalez-Pena, M.M.; Hale, M.D.C. Colour in thermally modified wood of beech, Norway spruce and Scots pine. Part 1: Colour evolution and colour changes. Holzforschung 2009, 63, 385–393. [Google Scholar] [CrossRef]
  28. Schneider, A. Investigations on the convection drying of lumber at extremely high temperatures. Part II: Drying degrade, changes in sorption, colour and strength of pine sapwood and beech wood at drying temperatures from 110 to 180 °C. Holz Roh- Werkst. 1973, 31, 1998–2206. [Google Scholar]
  29. Bekhta, P.; Niemz, P. Effect of high temperature on the change in color, dimensional stability and mechanical properties of spruce wood. Holzforschung 2003, 57, 539–546. [Google Scholar] [CrossRef]
  30. Dagbro, O.; Torniainen, P.; Karlsson, O.; Morén, T. Colour responses from wood, thermally modified in superheated steam and pressurized steam atmospheres. Wood Mater. Sci. Eng. 2010, 5, 211–219. [Google Scholar] [CrossRef]
  31. Sullivan, J.D. Color characterization of wood: Color parameters of individual species. For. Prod. J. 1966, 17, 25–29. [Google Scholar]
  32. Kamperidou, V.; Barmpoutis, P. Correlation between the changes of colour and mechanical properties of thermally-modified scots pine (Pinus sylvestris L.) wood. Pro Ligno 2015, 11, 360–365. [Google Scholar]
  33. Brischke, C.; Welzbacher, C.R.; Brandt, K.; Rapp, A.O. Quality control of thermally modified timber: Interrelationship between heat treatment intensities and CIE L*a*b* color data on homogenized wood samples. Holzforschung 2007, 61, 19–22. [Google Scholar] [CrossRef]
  34. Pleschberger, H.; Teischinger, A.; Müller, U.; Hansmann, C. Change in fracturing and colouring of solid spruce and ash wood after thermal modification. Wood Mater. Sci. Eng. 2014, 9, 92–101. [Google Scholar] [CrossRef]
  35. Sikora, A.; Kačík, F.; Gaff, M.; Vondrová, V.; Bubeníková, T.; Kubovský, I. Impact of thermal modification on color and chemical changes of spruce and oak wood. J. Wood Sci. 2018, 64, 406–416. [Google Scholar] [CrossRef]
  36. Sivrikaya, H.; Tesařová, D.; Jeřábková, E.; Can, A. Color change and emission of volatile organic compounds from Scots pine exposed to heat and vacuum-heat treatment. J. Build. Eng. 2019, 26, 100918. [Google Scholar] [CrossRef]
  37. Torniainen, P.; Elustondo, D.; Dagbro, O. Industrial validation of the relationship between color parameters in thermally modified spruce and pine. BioResources 2016, 11, 1369–1381. [Google Scholar] [CrossRef] [Green Version]
  38. Finotrol. FC-2. Thermally Modified Timber (TMT); Finotrol Oy: Mikkeli, Finland, 2017; 13p. [Google Scholar]
  39. Torniainen, P.; Jones, D.; Sandberg, D. Colour as a quality indicator for industrially manufactured ThermoWood®. Wood Mater. Sci. Eng. 2021, 16, 287–289. [Google Scholar] [CrossRef]
  40. Sandberg, D.; Kutnar, A.; Karlsson, O.; Jones, D. Wood Modification Technologies Principles-Sustainability, and the Need for Innovation; CRC Press: Boca Raton, FL, USA, 2021; 442p. [Google Scholar]
  41. Willems, W.; Lykidis, C.; Altgen, M.; Clauder, L. Quality control methods for thermally modified wood. Holzforschung 2015, 69, 875–884. [Google Scholar] [CrossRef]
  42. Nasir, V.; Nourian, S.; Avramidis, S.; Cool, J. Prediction of physical and mechanical properties of thermally modified wood based on color change evaluated by means of “group method of data handling” (GMDH) neural network. Holzforschung 2019, 73, 381–392. [Google Scholar] [CrossRef]
  43. Soetedjo, H.; Niskanen, I.; Rautkari, L.; Altgen, M.; Hiltunen, E.; Thungström, G.; Zakrisson, D.; Räty, J. Determining the degree of heat treatment of wood by light polarization technique. Eur. J. Wood Wood Prod. 2018, 76, 1359–1362. [Google Scholar] [CrossRef]
  44. Niskanen, I.; Heikkinen, J.; Mikkonen, J.; Harju, A.; Heräjärvi, H.; Venäläinen, M.; Peiponen, K.E. Detection of the effective refractive index of thermally modified Scots pine by immersion liquid method. J. Wood Sci. 2012, 65, 46–50. [Google Scholar] [CrossRef]
  45. Manninen, A.-M.; Pasanen, P.; Holopainen, J.K. Comparing the VOC emissions between air-dried and heat-treated Scots pine wood. Atmos. Environ. 2002, 36, 1763–1768. [Google Scholar] [CrossRef]
  46. Popescu, M.-C.; Froidevaux, J.; Navi, P.; Popescu, C.-M. Structural modifications of Tilia cordata wood during heat treatment investigated by FT-IR and 2D IR correlation spectroscopy. J. Mol. Struct. 2013, 1033, 176–186. [Google Scholar] [CrossRef]
  47. Schwanninger, M.; Hinterstoisser, B.; Gierlinger, N.; Wimmer, R.; Hanger, J. Application of Fourier transform near infrared spectroscopy (FT-NIR) to thermally modified wood. Holz Roh- Werkst. 2004, 62, 483–485. [Google Scholar] [CrossRef]
  48. Esteves, B.M.; Pereira, H.M. Wood modification by heat treatment: A review. BioResources 2009, 4, 370–404. [Google Scholar] [CrossRef]
  49. Poncsák, S.; Kocaefe, D.; Bouazara, M.; Pichette, A. Effect of high temperature treatment on the mechanical properties of birch (Betula papyrifera). Wood Sci. Technol. 2006, 40, 647–663. [Google Scholar] [CrossRef]
  50. Popescu, C.-M.; Zeniya, N.; Endo, K.; Genkawa, T.; Obataya, E. Modifications in spruce wood structure following hydro-thermal treatment evaluated by NIR spectroscopy. Pro Ligno 2019, 15, 48–54. [Google Scholar]
  51. de Abreu Neto, R.; Guedes Ramalho, F.M.; Ribeiro Costa, L.; Gherardi Hein, P.R. Estimating hardness and density of wood and charcoal by near-infrared spectroscopy. Wood Sci. Technol. 2021, 55, 215–230. [Google Scholar] [CrossRef]
  52. Inagaki, T.; Mitsui, K.; Tsuchikawa, S. Near-infrared spectroscopic investigation of the hydrothermal degradation mecha-nism of wood as an analogue of archaeological objects. Part I: Softwood. Appl. Spectrosc. 2008, 62, 1209–1215. [Google Scholar] [CrossRef]
  53. Popescu, M.-C.; Popescu, C.-M.; Lisa, G.; Sakata, Y. Evaluation of morphological and chemical aspects of different wood species by spectroscopy and thermal methods. J. Mol. Struct. 2011, 988, 65–72. [Google Scholar] [CrossRef]
  54. Liu, X.Y.; Tu, X.W.; Liu, U. Effects of light thermal treatments on the color, hygroscopity and dimensional stability of wood. Wood Res. 2021, 66, 95–104. [Google Scholar] [CrossRef]
  55. Stefansson, P.; Thiis, T.; Gobakken, L.R.; Burud, I. Hyperspectral NIR time series imaging used as a new method for estimating the moisture content dynamics of thermally modified Scots pine. Wood Mater. Sci. Eng. 2021, 16, 49–57. [Google Scholar] [CrossRef]
  56. dos Santos Grasel, F.; Flôres Ferrão, M.; Wolf, C.R. Development of methodology for identification the nature of the polyphenolic extracts by FTIR associated with multivariate analysis. Spectrochim. Acta A Mol. Biomol. Spectrosc. 2016, 153, 94–101. [Google Scholar] [CrossRef] [PubMed]
  57. Popescu, C.-M.; Popescu, M.-C. A near infrared spectroscopic study of the structural modifications of lime (Tilia cordata Mill.) wood during hydro-thermal treatment. Spectrochim. Acta A Mol. Biomol. Spectrosc. 2013, 115, 227–233. [Google Scholar] [CrossRef] [PubMed]
  58. Via, B.K.; Zhou, C.; Acquah, G.; Jiang, W.; Eckhardt, L. Near infrared spectroscpy calibration for wood chemimstry: Which chemometric technique is best for the prediction and interpretation? Sensors 2014, 14, 13532–13547. [Google Scholar] [CrossRef] [Green Version]
  59. Korkut, S. The effects of heat treatment on some technological properties in Uludağ fir (Abies bornmuellerinana Mattf.) wood. Build. Environ. 2008, 43, 422–428. [Google Scholar] [CrossRef]
  60. Källander, B. Drying and Thermal Modification of Wood: Studies on Influence of Sample Size, Batch Size, and Climate on Wood Response. Ph.D. Thesis, Luleå University of Technology, Skellefteå, Sweden, 2016. [Google Scholar]
  61. Anonymous. ThermoWood® Handbook; International ThermoWood Association: Helsinki, Finland, 2021; 53p. [Google Scholar]
  62. CEN. EN 335: 2013. Durability of Wood and Wood-Based Products—Use Classes: Definitions, Applications to Solid Wood and Wood-Based Products; European Committee for Standardization: Brussels, Belgium, 2013. [Google Scholar]
  63. CIE. CIE DS 014-4.3. Colorimetry—Part. 4: CIE 1976 L*a*b* Colour Space; CIE Central Bureau: Vienna, Austria, 2007; p. 12. [Google Scholar]
  64. CIE. CIE S 014-1/E. Colorimetry—Part. 1: CIE Standard Colorimetric Observers; CIE Central Bureau: Vienna, Austria, 2006; 40p. [Google Scholar]
  65. CEN. EN 408: 2010 + A1: 2012. Timber Structures. Structural Timber and Glued Laminated Timber. Determination of Some Physical and Mechanical Properties; European Committee for Standardization: Brussels, Belgium, 2010. [Google Scholar]
  66. CEN. EN 1534: 2020. Wood Flooring and Parquet. Determination of Resistance to Indentation. Test. Method; European Committee for Standardization: Brussels, Belgium, 2020. [Google Scholar]
  67. Niemz, P.; Stübi, T. Investigations of hardness measurements on wood based materials using a new universal measurement system. In Proceedings of the Symposium on Wood Machining, Properties of Wood and Wood Composites Related to Wood Machining, Vienna, Austria, 5–7 July 2000; pp. 51–61. [Google Scholar]
  68. Herrera, R.; Erdocia, X.; Llano-Ponte, R.; Labidi, J. Characterization of hydrothermally treated wood in relation to changes on its chemical composition and physical properties. J. Anal. Appl. Pyrolysis 2014, 107, 256–266. [Google Scholar] [CrossRef]
  69. Fengel, D.; Wegener, G. Wood, Chemistry, Ultrastructure, Reactions; Walter de Gruyter & Co.: Berlin, Germany, 1984; 613p. [Google Scholar]
  70. Severo, E.T.D.; Calonego, F.W.; Sansígolo, C.A. Physical and chemical changes in juvenile and mature woods of Pinus elliottii var. elliottii by thermal modification. Eur. J. Wood Wood Prod. 2012, 70, 741–747. [Google Scholar] [CrossRef]
  71. Popescu, C.-M.; Navi, P.; Placencia Peña, M.I.; Popescu, M.-C. Evaluation of the structural changes occurring in wood during hydro-thermal and thermal treatment using NIR spectroscopy and principal component analysis. Spectrochim. Acta Part. A Mol. Biomol. Spectrosc. 2018, 191, 405–412. [Google Scholar] [CrossRef] [PubMed]
  72. Park, Y.; Jang, S.-K.; Park, J.-H.; Yang, S.-Y.; Chung, H.; Han, Y.; Chang, Y.-S.; Choi, I.-G.; Yeo, H. Changes of major chemical components in larch wood through combined treatment of drying and heat treatment using superheated steam. J. Wood Sci. 2017, 63, 635–643. [Google Scholar] [CrossRef]
  73. Popescu, C.-M.; Jones, D.; Kržišnik, D.; Humar, M. Determination of the effectiveness of a combined thermal/chemical wood modification by the use of FT-IR spectroscopy and chemometric methods. J. Mol. Struct. 2020, 1200, 127133. [Google Scholar] [CrossRef]
  74. Kăcíková, D.; Kubovský, I.; Ulbriková, N.; Kăcík, F. The impact of thermal treatment on structural changes of teak and iroko wood lignins. Appl. Sci. 2020, 10, 5021. [Google Scholar] [CrossRef]
  75. Nuopponen, M.; Vuorinen, T.; Jämsä, S.; Viitaniemi, P. Thermal modifications in softwood studied by FT-IR and UV resonance Raman spectroscopies. J. Wood Chem. Technol. 2005, 24, 13–26. [Google Scholar] [CrossRef]
  76. Esteves, B.; Velez Marques, A.; Domingos, I.; Pereira, H. Chemical changes of heat treated pine and eucalypt wood monitored by FTIR. Maderas. Cienc. Tecnol. 2013, 15, 245–258. [Google Scholar] [CrossRef] [Green Version]
  77. Özgenç, Ö.; Durmaz, S.; Boyaci, I.H.; Eksi-Kocak, H. Determination of chemical changes in heat-treated wood using ATR-FTIR and FT Raman spectrometry. Spectrochim. Acta A Mol. Biomol. Spectrosc. 2017, 171, 395–400. [Google Scholar] [CrossRef]
  78. Solár, R.; Reinprecht, L.; Kačík, F.; Melcer, J.; Horský, D. Comparison of some physico-chemical and chemical properties of carbohydrate and lignin part of contemporary and subfossil oak wood. Cellul. Chem. Technol. 1987, 21, 513–524. [Google Scholar]
  79. Kotilainen, R.; Toivannen, T.; Alén, R. FTIR monitoring of chemical changes in softwood during heating. J. Wood Chem. Technol. 2000, 20, 307–320. [Google Scholar] [CrossRef]
  80. González-Peña, M.M.; Curling, S.F.; Hale, M.D. On the effect of heat on the chemical composition and dimensions of thermally modified wood. Polym. Degrad. Stab. 2009, 94, 2184–2193. [Google Scholar] [CrossRef]
  81. Nuopponen, M.; Vuorinen, T.; Jämsä, S.; Viitaniemi, P. The effects of a heat treatment on the behaviour of extractives in softwood studied by FTIR spectroscopic methods. Wood Sci. Technol. 2003, 37, 109–115. [Google Scholar] [CrossRef]
  82. Matsuda, Y.; Isogai, A.; Onabe, F. Effects of thermal and hydrothermal treatments on the reswelling capabilities of pulps and papersheets. J. Pulp Pap. Sci. 1994, 20, 323–327. [Google Scholar]
  83. Borrega, M.; Kärenlampi, P.P. Hygroscopicity of heat-treated Norway spruce (Picea abies) wood. Eur. J. Wood Wood Prod. 2010, 68, 233–235. [Google Scholar] [CrossRef] [Green Version]
  84. Esteves, B.; Velez Marques, A.; Domingos, I.; Pereira, H. Influence of steam heating on the properties of pine (Pinus pinaster) and eucalypt (Eucalyptus globulus) wood. Wood Sci. Technol. 2007, 41, 193–207. [Google Scholar] [CrossRef]
  85. Esteves, B.; Videira, R.; Pereira, H. Chemistry and ecotoxicity of heat treated pine wood extractives. Wood Sci. Technol. 2011, 45, 661–676. [Google Scholar] [CrossRef] [Green Version]
  86. Thompson, D.W.; Kozak, R.A.; Evans, P. Thermal modification of color in red alder veneer. 1. Effects of temperature, heating time, and wood type. Wood Fiber Sci. 2005, 37, 653–661. [Google Scholar]
  87. Mitsui, K.; Takada, H.; Sugiyama, M.; Hasegawa, R. Changes in the properties of light-irradiated wood with heat treatment. Part 1. Effect of treatment conditions on the change in color. Holzforschung 2001, 55, 601–605. [Google Scholar] [CrossRef]
  88. Welzbacher, C.R.; Brischke, C.; Rapp, A.O. Influence of treatment temperature and duration on selected biological, mechanical, physical and optical properties of thermally modified timber. Wood Mater. Sci. Eng. 2007, 2, 66–76. [Google Scholar] [CrossRef]
  89. Kamperidou, V.; Barboutis, I.; Vasileiou, V. Response of colour and hygroscopic properties of Scots pine wood to thermal treatment. J. For. Res. 2013, 24, 571–575. [Google Scholar] [CrossRef]
  90. Priadi, T.; Cesarizki Suharjo, A.A.; Karlinasari, L. Dimensional stability and colour change of heat-treated young teak wood. Int. Wood Prod. J. 2019, 10, 119–125. [Google Scholar] [CrossRef]
  91. Herrera-Builes, J.F.; Sepúlveda-Villarroel, V.; Osorio, J.A.; Salvo-Sepúlveda, L.; Ananías, R.A. Effect of thermal modification treatment on some physical and mechanical properties of Pinus oocarpa wood. Forests 2021, 12, 249. [Google Scholar] [CrossRef]
  92. Kocaefe, D.; Poncsak, S.; Boluk, Y. Effect of thermal treatment on the chemical composition and mechanical properties of birch and aspen. BioResources 2008, 3, 517–537. [Google Scholar]
  93. Won, K.-R.; Kim, T.-H.; Hwang, K.-K.; Chong, S.-H.; Hong, N.-E.; Byeon, H.-S. Effect of heat treatment on the bending strength and hardness of wood. J. Korean Wood Sci. Technol. 2012, 40, 303–310. [Google Scholar] [CrossRef] [Green Version]
  94. Gunduz, G.; Aydemir, D.; Karakas, G. The effects of thermal treatment on the mechanical properties of wild pear (Pyrus elaeagnifolia Pall.) wood and changes in physical properties. Mater. Des. 2009, 30, 4391–4395. [Google Scholar] [CrossRef]
  95. Calenego, F.W.; Severo, E.T.D.; Furtado, E.L. Decay resistance of thermally modified Eucalyptus grandis wood at 140 °C, 160 °C, 180 °C, 200 °C and 220 °C. Bioresour. Technol. 2010, 101, 9391–9394. [Google Scholar] [CrossRef]
  96. Lekounougou, S.; Kocaefe, D. Effect of thermal modification temperature on the mechanical properties, dimensional stability, and biological durability of black spruce (Picea mariana). Wood Mater. Sci. Eng. 2014, 9, 59–66. [Google Scholar] [CrossRef]
  97. Bakar, B.F.A.; Hiziroglu, S.; Tahir, P.M. Properties of some thermally modified wood species. Mater. Des. 2013, 43, 348–355. [Google Scholar] [CrossRef] [Green Version]
  98. Kocaefe, D.; Poncsak, S.; Tang, J. Effect of heat treatment on the mechanical properties of North American jack pine: Thermogravimetric study. J. Mater. Sci. 2010, 45, 681–687. [Google Scholar] [CrossRef]
Figure 1. Average infrared spectra (a) and their second derivatives (b) of the untreated and ThermoWood® Norway spruce and Scots pine.
Forests 12 01165 g001
Figure 2. Principal component (PC) scores performed on infrared spectra in the 1400–1185 cm−1 region for untreated and ThermoWood® Norway spruce (a) and Scots pine (b).
Forests 12 01165 g002
Figure 3. Loading plots performed on infrared spectra in the 1400–1185 cm−1 region for untreated and ThermoWood® Norway spruce (a) and Scots pine (b).
Forests 12 01165 g003
Figure 4. Colour difference (ΔE*) values plotted as a function of PC1 and PC2 scores for ThermoWood® Norway spruce (a) and Scots pine (b).
Forests 12 01165 g004
Figure 5. L*, a*, and b* parameters plotted as a function of PC1 (a,b) and of PC2 (c,d) scores for the untreated and Thermo-Wood® Norway spruce (a,c) and Scots pine (b,d).
Forests 12 01165 g005
Figure 6. MOE (a) and MOR (b) measured for untreated and ThermoWood® Norway spruce and Scots pine.
Forests 12 01165 g006
Figure 7. MOE plotted as a function of PC1 and PC2 scores for untreated and Thermo-Wood® Norway spruce and Scots pine.
Forests 12 01165 g007
Figure 8. MOR plotted as a function of PC1 and PC2 scores for untreated and Thermo-Wood® Norway spruce and Scots pine.
Forests 12 01165 g008
Figure 9. L*, a*, and b* parameters plotted as a function of MOE (a,b) and of MOR (c,d) for the untreated and ThermoWood® Norway spruce (a,c) and Scots pine (b,d).
Forests 12 01165 g009aForests 12 01165 g009b
Figure 10. Brinell hardness after release of force (HBP) measured for the untreated and ThermoWood® Norway spruce (a) and Scots pine (b).
Forests 12 01165 g010
Figure 11. Brinell hardness measured after release of the force plotted as a function of PC1 and PC2 scores for untreated and ThermoWood® Norway spruce and Scots pine.
Forests 12 01165 g011
Figure 12. L*, a*, and b* parameters plotted as a function of Brinell hardness after release of force measured for the untreated and ThermoWood® Norway spruce (a) and Scots pine (b).
Forests 12 01165 g012
Table 1. Colour measurements for untreated, Thermo–S, and Thermo–D Norway spruce and Scots pine wood. stD—standard deviation.
SampleLightness (L*)Red-Green Colour Parameter (a*)Yellow-Blue Colour Parameter
(b*)
Colour Difference (ΔE*)
AveragestDAveragestDAveragestDAveragestD
Norway spruce
Untreated 82.551.163.400.4420.191.04
Thermo–S59.533.257.500.2824.411.1423.843.35
Thermo–D51.751.338.780.1924.530.6831.601.69
Scots pine
Untreated 82.731.263.870.6121.210.86
Thermo–S59.943.137.900.3725.601.1923.632.99
Thermo–D49.992.028.920.3023.151.5233.232.37
Table 2. Current colour guidelines for ThermoWood® Norway spruce and Scots pine as defined within quality control document FC-2 Thermally Modified Timber (TMT) 2014 [38].
ClassL*a*b*
Thermo–S58–688–10
Thermo–D45–5519–24
Table 3. Overview of selected properties of unmodified and modified Norway spruce and Scots pine specimens. stD—standard deviation.
Density (stD) (kg/m3)M.C. (stD) (%)MOR (stD) (N/mm2)MOE (stD) (N/mm2)
Norway spruce
Untreated 440.8 (25.8)13.05 (0.70)66.63 (7.76)9762 (1243)
Thermo–S425.6 (42.6)8.87 (0.62)65.50 (12.66)12377 (1815)
Thermo–D448.1 (40.6)5.87 (0.82)71.69 (12.08)13603 (2510)
Scots pine
Untreated486.4 (32.2)13.22 (0.41)71.29 (9.90)10198 (2369)
Thermo–S449.8 (29.5)8.76 (0.65)58.42 (12.38)9694 (2005)
Thermo–D453.4 (41.1)8.27 (0.94)61.40 (10.36)10737 (1853)
Table 4. Brinell hardness results for unmodified and ThermoWood® treated Norway spruce and Scots pine. stD—standard deviation.
Density (stD) (kg/m3)M.C. (stD) (%)HBD (stD) (N/mm2)HBP (stD) (N/mm2)Elastic Recovery (stD) (%)
Norway spruce
Untreated 440.8 (25.8)13.05 (0.70)10.05 (0.56)15.81 (1.89)35.94 (4.45)
Thermo–S425.6 (42.6)8.87 (0.62)8.66 (1.07)12.16 (2.38)27.72 (5.89)
Thermo–D448.1 (40.6)5.87 (0.82)8.59 (0.49)12.81 (1.16)32.68 (3.77)
Scots pine
Untreated486.4 (32.2)13.22 (0.41)9.73 (1.46)13.33 (2.70)26.30 (4.29)
Thermo–S449.8 (29.5)8.76 (0.65)9.02 (1.59)11.85 (2.57)23.36 (3.73)
Thermo–D453.4 (41.1)8.27 (0.94)9.13 (1.07)11.86 (1.80)22.63 (3.41)
Publisher’s Note: MDPI stays neutral with regard to jurisdictional claims in published maps and institutional affiliations.

