1. Introduction
The Nordic region has vast forest cover with abundant forest resources. About three quarters of the total land area in Finland and Sweden are covered by forests and other woodlands. In 2020, Sweden had the largest forest area in the European Union, with an area of 30.3 million hectares, with Finland having about 23.2 million hectares [
1]. The vast forest area provides rich forest resources for this region and lays a good foundation for forest industry development.
The acquisition of raw wood materials is an important step in the forest industry, linking the upstream and downstream industries. In addition to logging and wood supply, the process also includes forest management, regeneration, thinning, and cleaning, among other activities. For logging and wood supply, the harvesting system of round wood logging to delivery at refineries can be divided into different components as planning, harvesting, forwarding, and secondary haulage [
2]. Considering activities that need to be operated on forest land, that is, regeneration, cleaning, harvesting, and terrain transport, these operations are all realized by manual assistance with mechanized equipment: disc trenchers and mounders are mainly used in the regeneration operation, cleaning is mainly done manually using motor-manual methods with a brush saw, harvesting is almost entirely mechanized by single-grip harvesters, and round wood collection, loading, and stacking are completed by forwarders [
2]. Indeed, forest operations require labor-intensive work despite mechanization.
To maintain sustainable development of forestry and enhance competitiveness, it is necessary to ensure adequate wood supply and to continuously improve the efficiency of forest production. Long-term statistical data of gross felling in Sweden indicates a halted increase in the past decade, now maintained on a relatively stable level. Meanwhile, the number of forestry practitioners as a whole has shown a downward trend. The improvement of production efficiency also seems to have bottlenecked after the 2000s, accompanied by a continuous increase of the cost for felling [
3,
4]. These factors constrain further development of the Swedish forest industry and introduce new challenges for researchers working in the field of forestry, such as how to further improve the efficiency of forestry production.
Cut-to-length (CTL) logging is a mechanized harvesting system, which is common to the Nordic. Although this process has been highly mechanized, it still requires direct operation by machine operators. A series of mental and physical activities involved in harvester operators’ decision-making and operation was studied [
5], where each work element when harvesting trees and its respective challenges were described. This series of complex decision-making and operation processes not only bring challenges to operators, but also indirectly produce many problems that need to be improved, including labor bottleneck, employment cost, training cost, personnel safety, and so on. As a response, the introduction of automation is expected to improve the working environment of forest machine operators with regard to work safety, reduce the burden of operators, and improve the performance of the entire forest harvesting system [
6].
In fact, the exploration and research on forest machine automation are in progress. One study expressed that mechanized systems will progressively increase the automation extent until the systems can be enjoyed in automatic harvesting operations [
7]. Some studies have also provided practical results, e.g., path-following forwarders in Scandinavian forest environments [
8] and unmanned harvesters remotely controlled from a manned forwarder [
9].
The use of imaging sensors to assist in improving forestry automation is also a major research direction. Imaging sensors can be deployed on vehicles or forest machines for object detection or to assist operations. Some studies have fully demonstrated their potential for application, such as color camera systems for tree detection and distance measurement [
10], stereo camera systems for scanning and reconstructing land previously processed by mounders [
11], human detection in forest environments using a thermal camera [
12], structured light cameras used for log recognition [
13], and fusion of multiple imaging sensors to achieve more complex functions such as modeling of forest nonstructural roads [
14]. The application of imaging sensors can improve the environmental observation ability of the forest machine system and is a good assistant to the visual observation of the operator in the operation cabin.
The ability of environmental cognition and object detection is a necessary condition for all operations in forest harvesting and is also the basis of operation automation. In the process from round wood logging to delivery, operations such as path planning, driving, obstacle avoidance, felling, timber handling, and other relevant forest machine operations are all done by the operator. All those operations are based on the operator’s observations and impressions, and detection of various objects in the field of vision, such as boulders, stumps, logs, and other objects are conducted. Forest machine operators need to be confined to the machine cab for a long time. Subjected to a complex forest environment and the operation cabin, it may be difficult to stay focused for a long time in the process of work, which may result in errors in visual detection of objects.
With the emergence of artificial intelligence, machine learning and deep learning algorithms are nowadays integrated into the construction of detectors applied to the discovery, detection, and positioning of objects in unstructured outdoor environments such as forests or agricultural lands [
15,
16,
17], as well as the realization of navigation functions based on object information [
18,
19]. This trend implies the potential of applying already widely used deep-learning-based object detection also in complex scenarios like forest terrain.
Automatic targeting has also been rapidly improved through the use of deep learning. Region-convolutional neural networks (R-CNN) [
20] applied deep learning for detection for the first time, and improvements using Fast R-CNN [
21] and Faster R-CNN [
22] gave faster detection speed. Subsequently, YOLO [
23] and SSD [
24] were developed, which could detect objects in high-resolution images at high speed in real time. The chosen algorithm and framework in this paper, YOLOv3 [
25] and Darknet-53, respectively, are some years old in a rapidly evolving area but have matured into solutions that are possible to realize with ease on architecture possible to be run on mobile platforms and are still today seen as close to the state of the art as far as image detection goes [
26,
27].
The objective of this paper is to propose an environment-sensing and object-detection system based on imaging sensors and suitable hardware for working in forest environments, which can realize real-time automatic detection and three-dimensional positioning of important objects around forest machines during its operation. The hardware selected by the system comprises mature products on the market, combined with common underlying software architecture used for deep learning target detection. The purpose is to realize our desired function of real-time obstacle detection and localization in clearcut areas, explore its feasibility, and establish a foundation for further improvement of system functions.
Our desire is to utilize the outcome to assist the operator during forestry work, while the long-term goal is to enhance the effect of forest machine automation and lay a foundation for the construction of autonomous navigation systems for unmanned forest machines.
2. Materials and Methods
The terrain objects considered in the study are mainly objects with obvious target properties, such as large stones, stumps, etc., which exist in the forest after harvest has been completed and which pose an issue during machine operation. The study includes several composite solutions developed in order to have the entire real-time system functioning and benchmarked:
A signal reading and processing system from the Zed2 stereo camera.
An image object detection system and subsequent calculation of three-dimensional mapping.
Realization of detection and localization functionality for the potential terrain target objects.
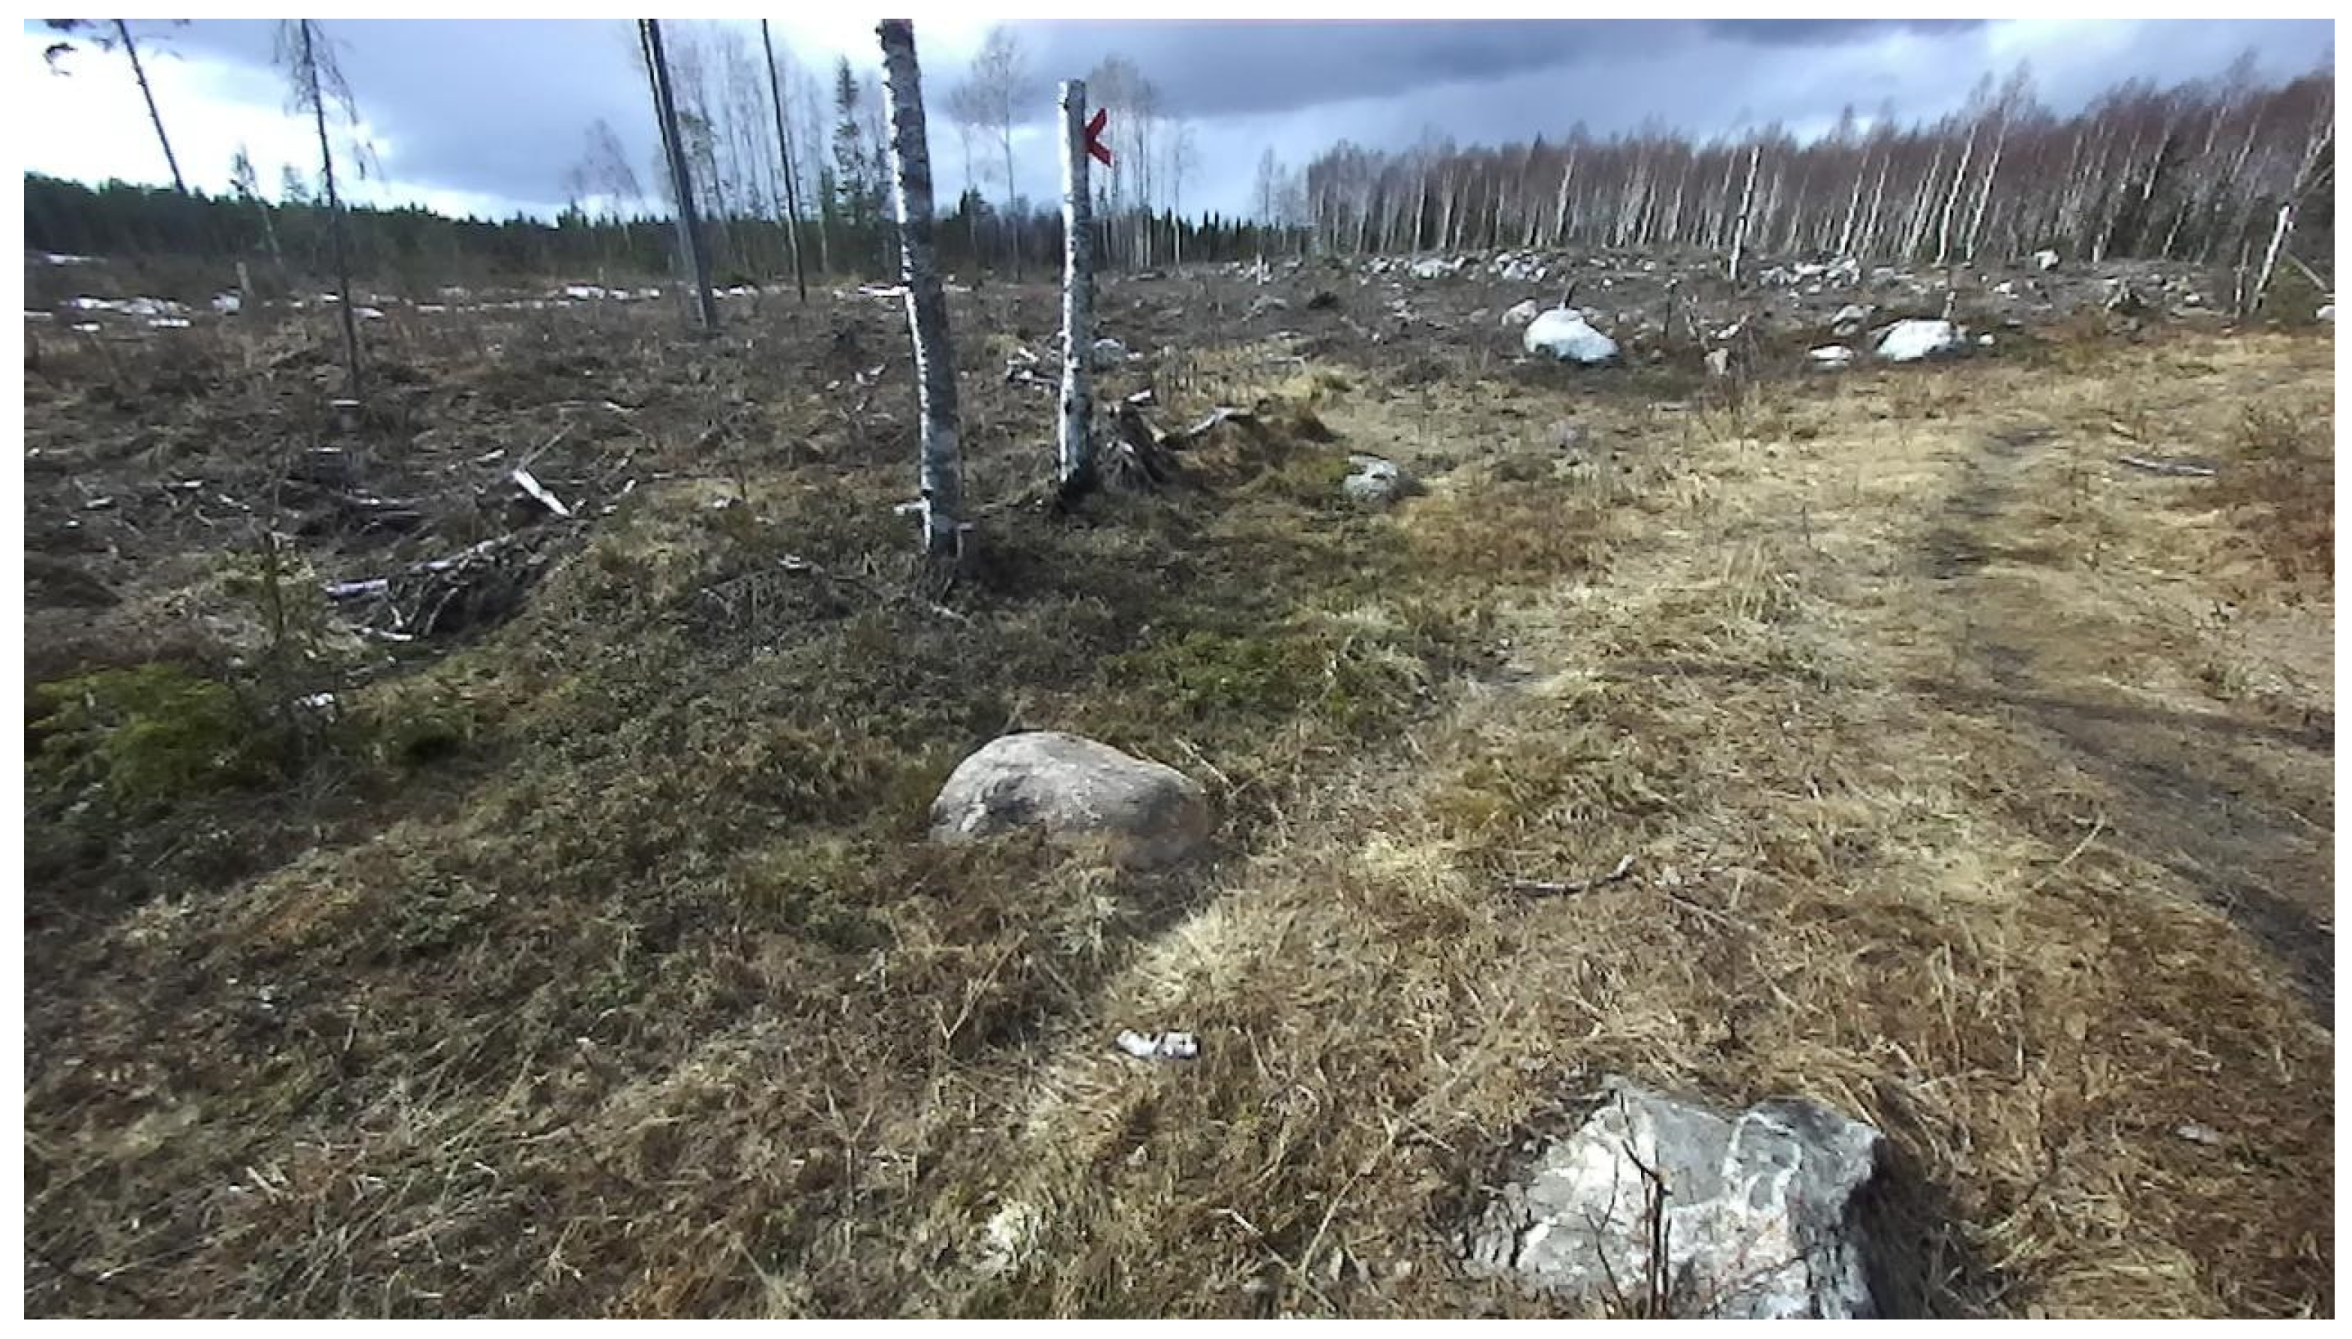
2.1. Location for Data Collection
The field we chose for data collection is located in northern Sweden, a suburb of the city of Luleå. The sampling was done on a cloudy morning in early May. The temperature at the time was close to zero with small patches of snow covering parts of the clearcut. A view of the field is shown in
Figure 1.
2.2. Construction of Hardware and Software Systems
2.2.1. Software and Hardware Preparations
Regarding the hardware aspect of the system, it is mainly composed of two devices, namely the data processing unit and the camera. The processing unit for real-time evaluation was an Nvidia Jetson Xavier minicomputer running Ubuntu 18.04 LTS operating system, in which the Robotic Operating System (ROS) framework [
28] was installed. The Nvidia Jetson Xavier is purpose-built to create and deploy end-to-end AI robotics applications, used in our case to undertake the tasks of calculation and processing. Data collection was done in real forest environments using a Zed2 stereo camera [
29], which was chosen mainly because of availability and compatibility with the ROS framework. The Zed2 camera was directly connected to the Jetson Xavier, and at the same time, the Zed2 camera’s Software Development Kit (SDK) was also installed on the Jetson Xavier. Having this setup, all the output signals of the Zed2 camera could be published directly in the ROS environment in real time.
The software framework, based on ROS, was chosen because of its good compatibility and ease of use. For example, both signal transmission and communication between the Zed2 and the Jetson Xavier could easily be constructed via ROS built-in packages. At the same time, ROS also has the flexibility to utilize customized python scripts to achieve the functionality needed through custom functions.
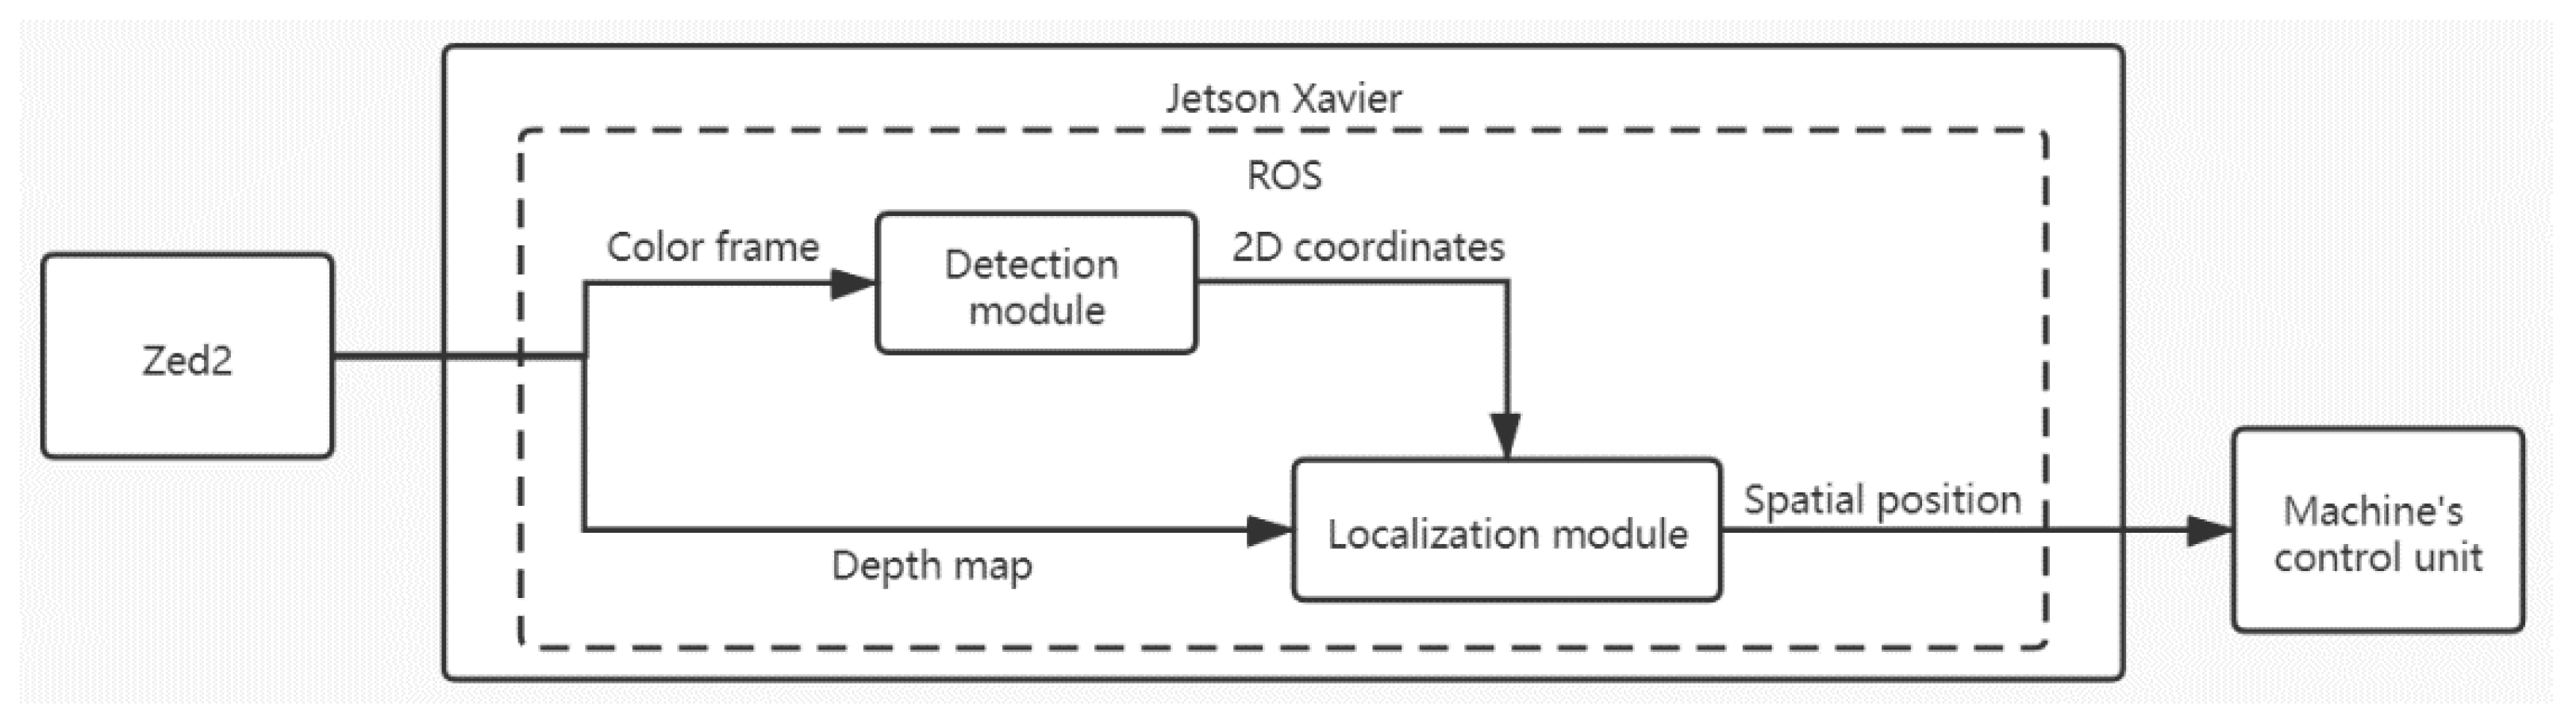
2.2.2. System-Wide Workflow
The system mainly contains two functional modules: (1) the image object detection system module, which is an off-the-shelf solution for image object detection, here called the “Detection module”, and (2) the function module, mainly responsible for object position determination. The complete working process of the system is as follows. The Zed2 camera captures the scene and outputs the necessary data stream including color images, depth maps, point clouds of the scene, camera information, etc. The data stream feeds into the Detection module to complete object detection and 2D image coordinate positioning. Then, the depth map, the camera information, and the processed data output from the Detection module are sent to the function module. After processing, the detection information and the actual spatial location of the target object are output. Thus, the detection and localization of the target object in the scene are completed. Subsequently, machine-specific control hardware processes the information to either make operative decisions or send intelligible feedback to the machine operator (
Figure 2).
2.3. Data Collection and Equipment
First, data were collected from relevant environments to later realize and evaluate the system on relevant hardware and software (
Section 2.2).
The data collection was achieved by a standard laptop connected with a Zed2 camera, running Ubuntu 18.04 LTS, ROS, and preinstalled Zed2′s SDK. The field sampling recorded two types of images, i.e., RGB and depth. The Zed2 has integrated sensing to keep track of the camera pose, which is beneficial when Euclidean coordinates are derived from 2D depth. Therefore, other needed data, such as point cloud data, coordinate transform information, etc., were calculated through the camera SDK and could also be saved in each data frame.
In the process of sampling, it is necessary to ensure that the recorded color images and depth maps have the same frame rate and resolution. To ensure the quality of recording, relieve the pressure of data stream transmission, and reduce the data storage, the sampling frequency of the color images, depth maps, and point-cloud data are set at 15 Hz with a resolution of 1280 × 720 pixels. To ensure that the sampling process is as consistent as possible with the actual working state of the whole system, we set the camera at an approximate height of 1.7 m from the ground with a pitch angle of 45 degrees from the gravitational vector and kept the speed of movement at an average of 50 m/min.
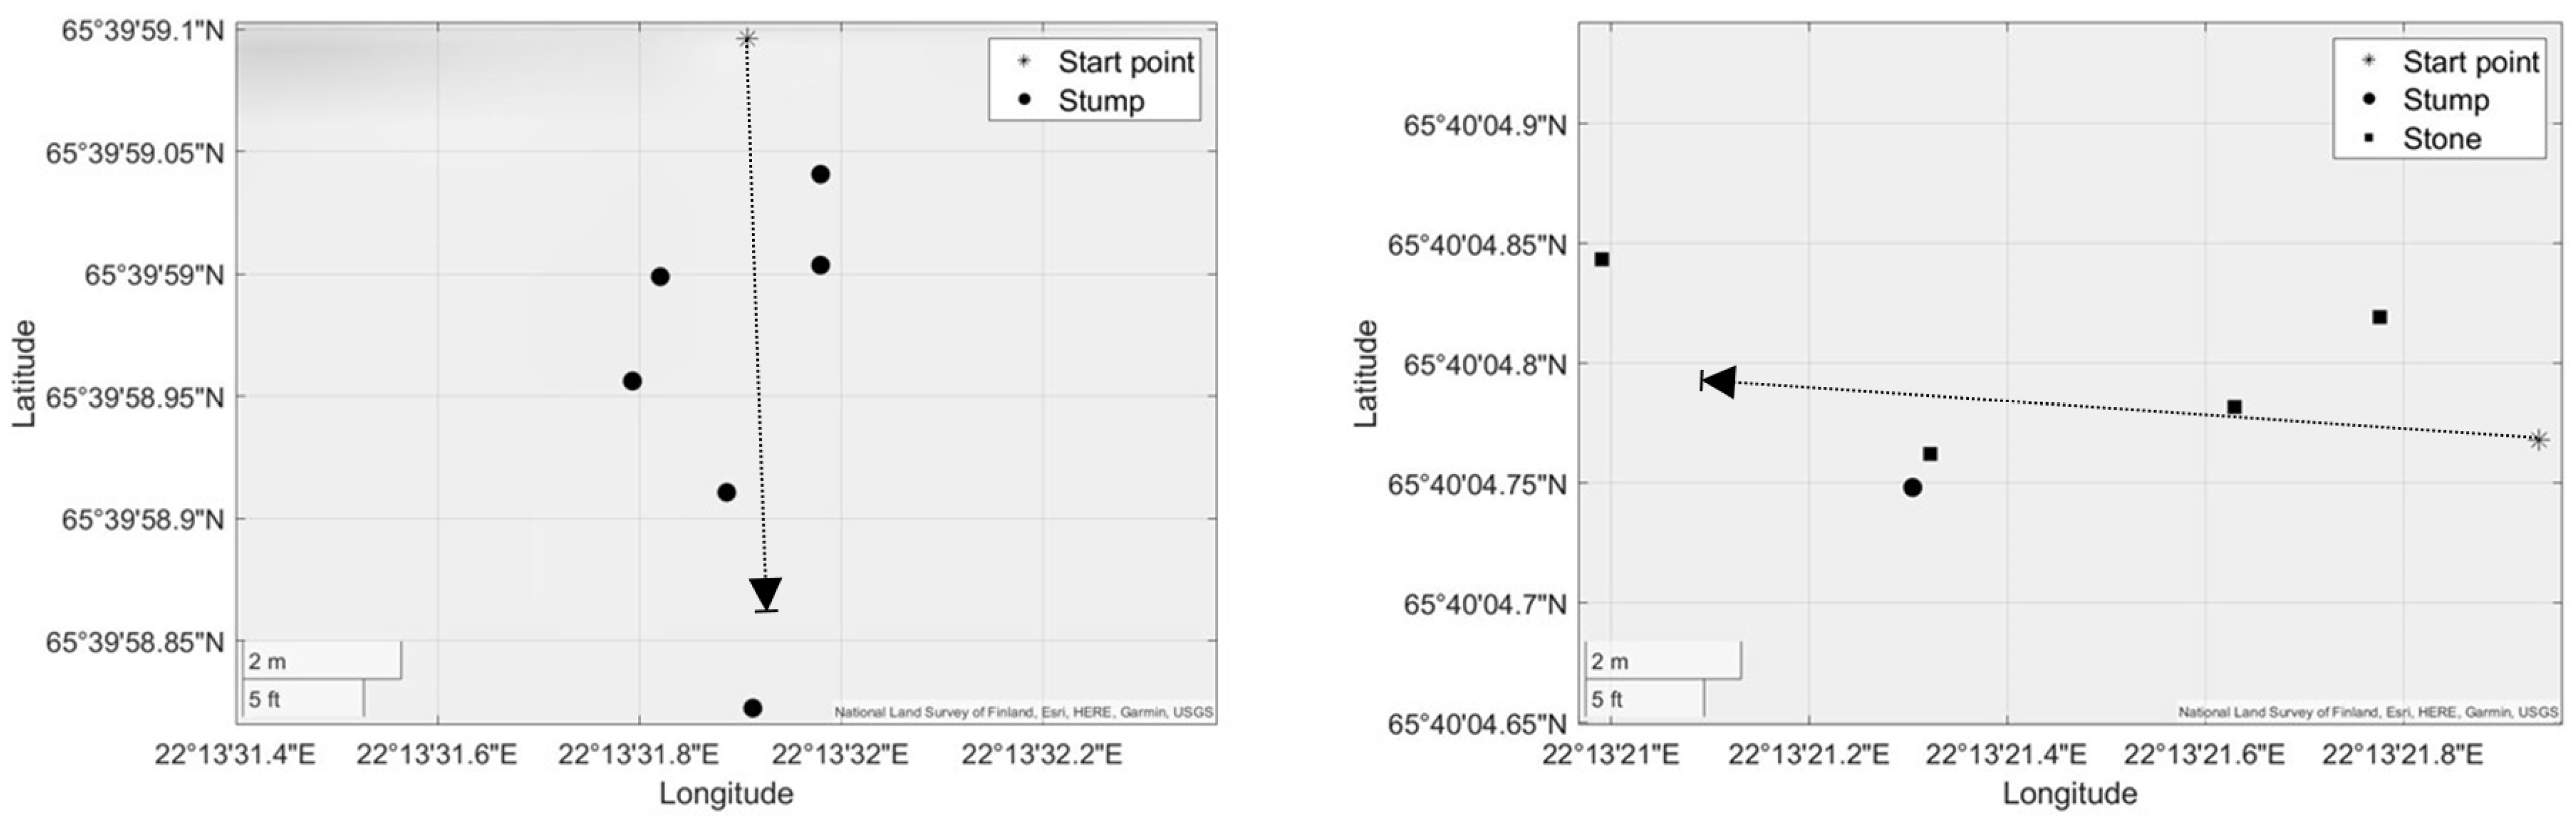
The chosen region is a woodland harvested about three years prior to the data collection, in which we chose two areas of 20 square meters as our sampling area. In this range, we manually selected the objects that we thought needed to be recorded, keeping in mind what poses issues for machine operation. In each of these two areas, a track about 10 m long was defined to record our dataset for testing. All objects of interest along these two tracks were within camera range at some point during the run, and the locations of these objects were manually recorded by a GNSS function. The approximate locations of objects were determined and are shown in
Figure 3 with the camera’s route depicted for testing.
The target objects in Track 1 are six stumps, and the target objects in Track 2 contain one stump and four stones. For each track, we recorded three runs.
The positioning quality evaluation later compares the difference between automatic object positioning results and the manual measurement results. The manual measurements were done by positioning object center points in 3D space (
Section 2.5), while automatic object positioning was done using the developed object detection and localization system (
Section 2.4).
2.4. Object Detection and Localization
2.4.1. Dataset Preprocessing and Augmentation
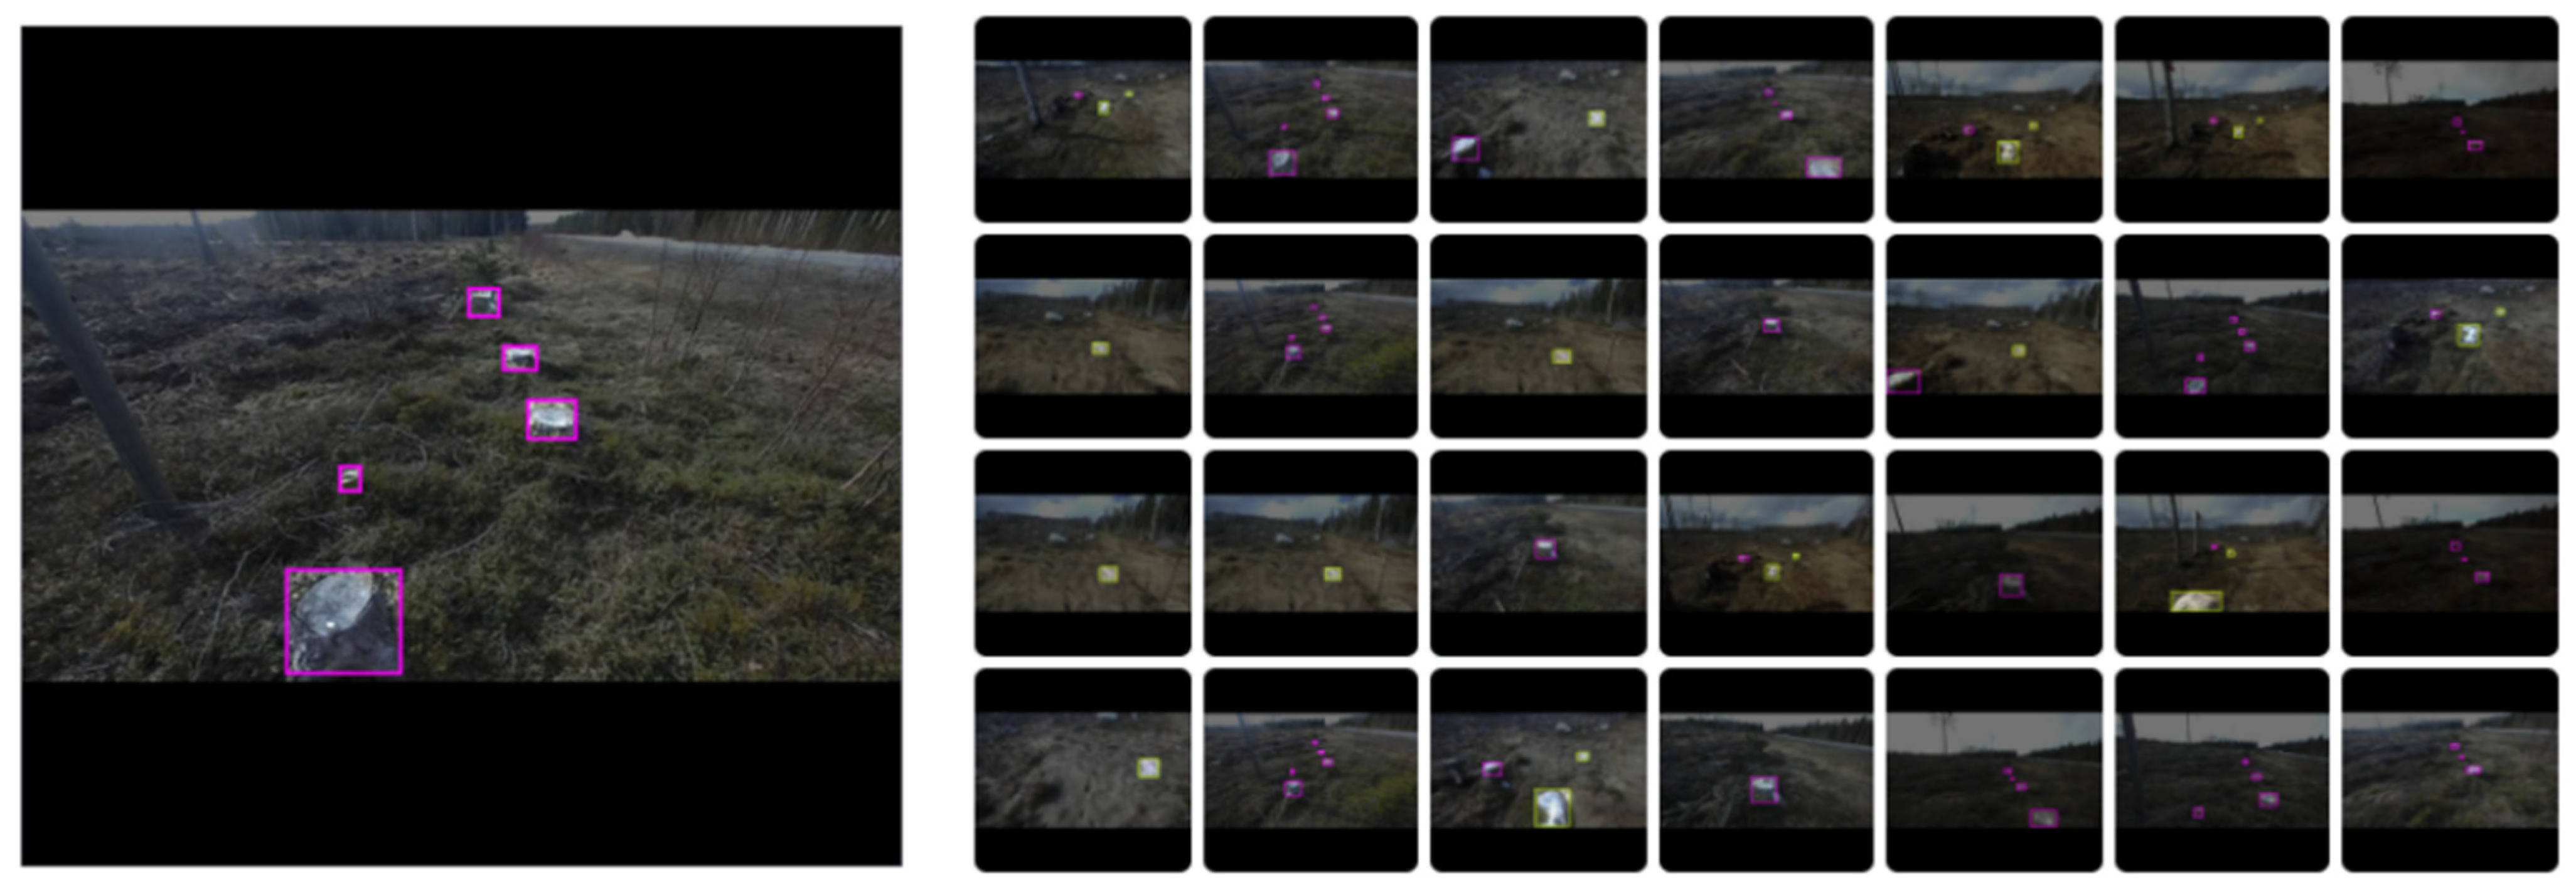
The Detection module uses a neural network (see
Section 2.4.2) to conduct automatic object detection in 2D image data, and the module must be trained on labeled datasets where manually drawn rectangles, called bounding boxes, define positions of the objects’ whereabouts (
Figure 4). Having trained on a large enough dataset, the Detection module enables real-time object detection.
Considering that the purpose of training the detector is not to obtain an object detector highly robust and widely applicable, but for subsequent discovery of two types of obstacles in the specific regions, we ended up selecting a relatively small number of images for labeling in the obtained training dataset. The dataset for training encompassed 272 images. We labeled the objects of interest in the images and added augmentation steps to increase robustness. We first labeled all the stones and stumps that existed in all pictures and then fit and resized all images by black edges to become square images with 608 × 608 pixels, a size tailored for our specific choice of neural network.
For all of these 272 images, we set 197 images as the training set and set the remaining 75 images left as the validation set, i.e., the entire dataset before augmentation.
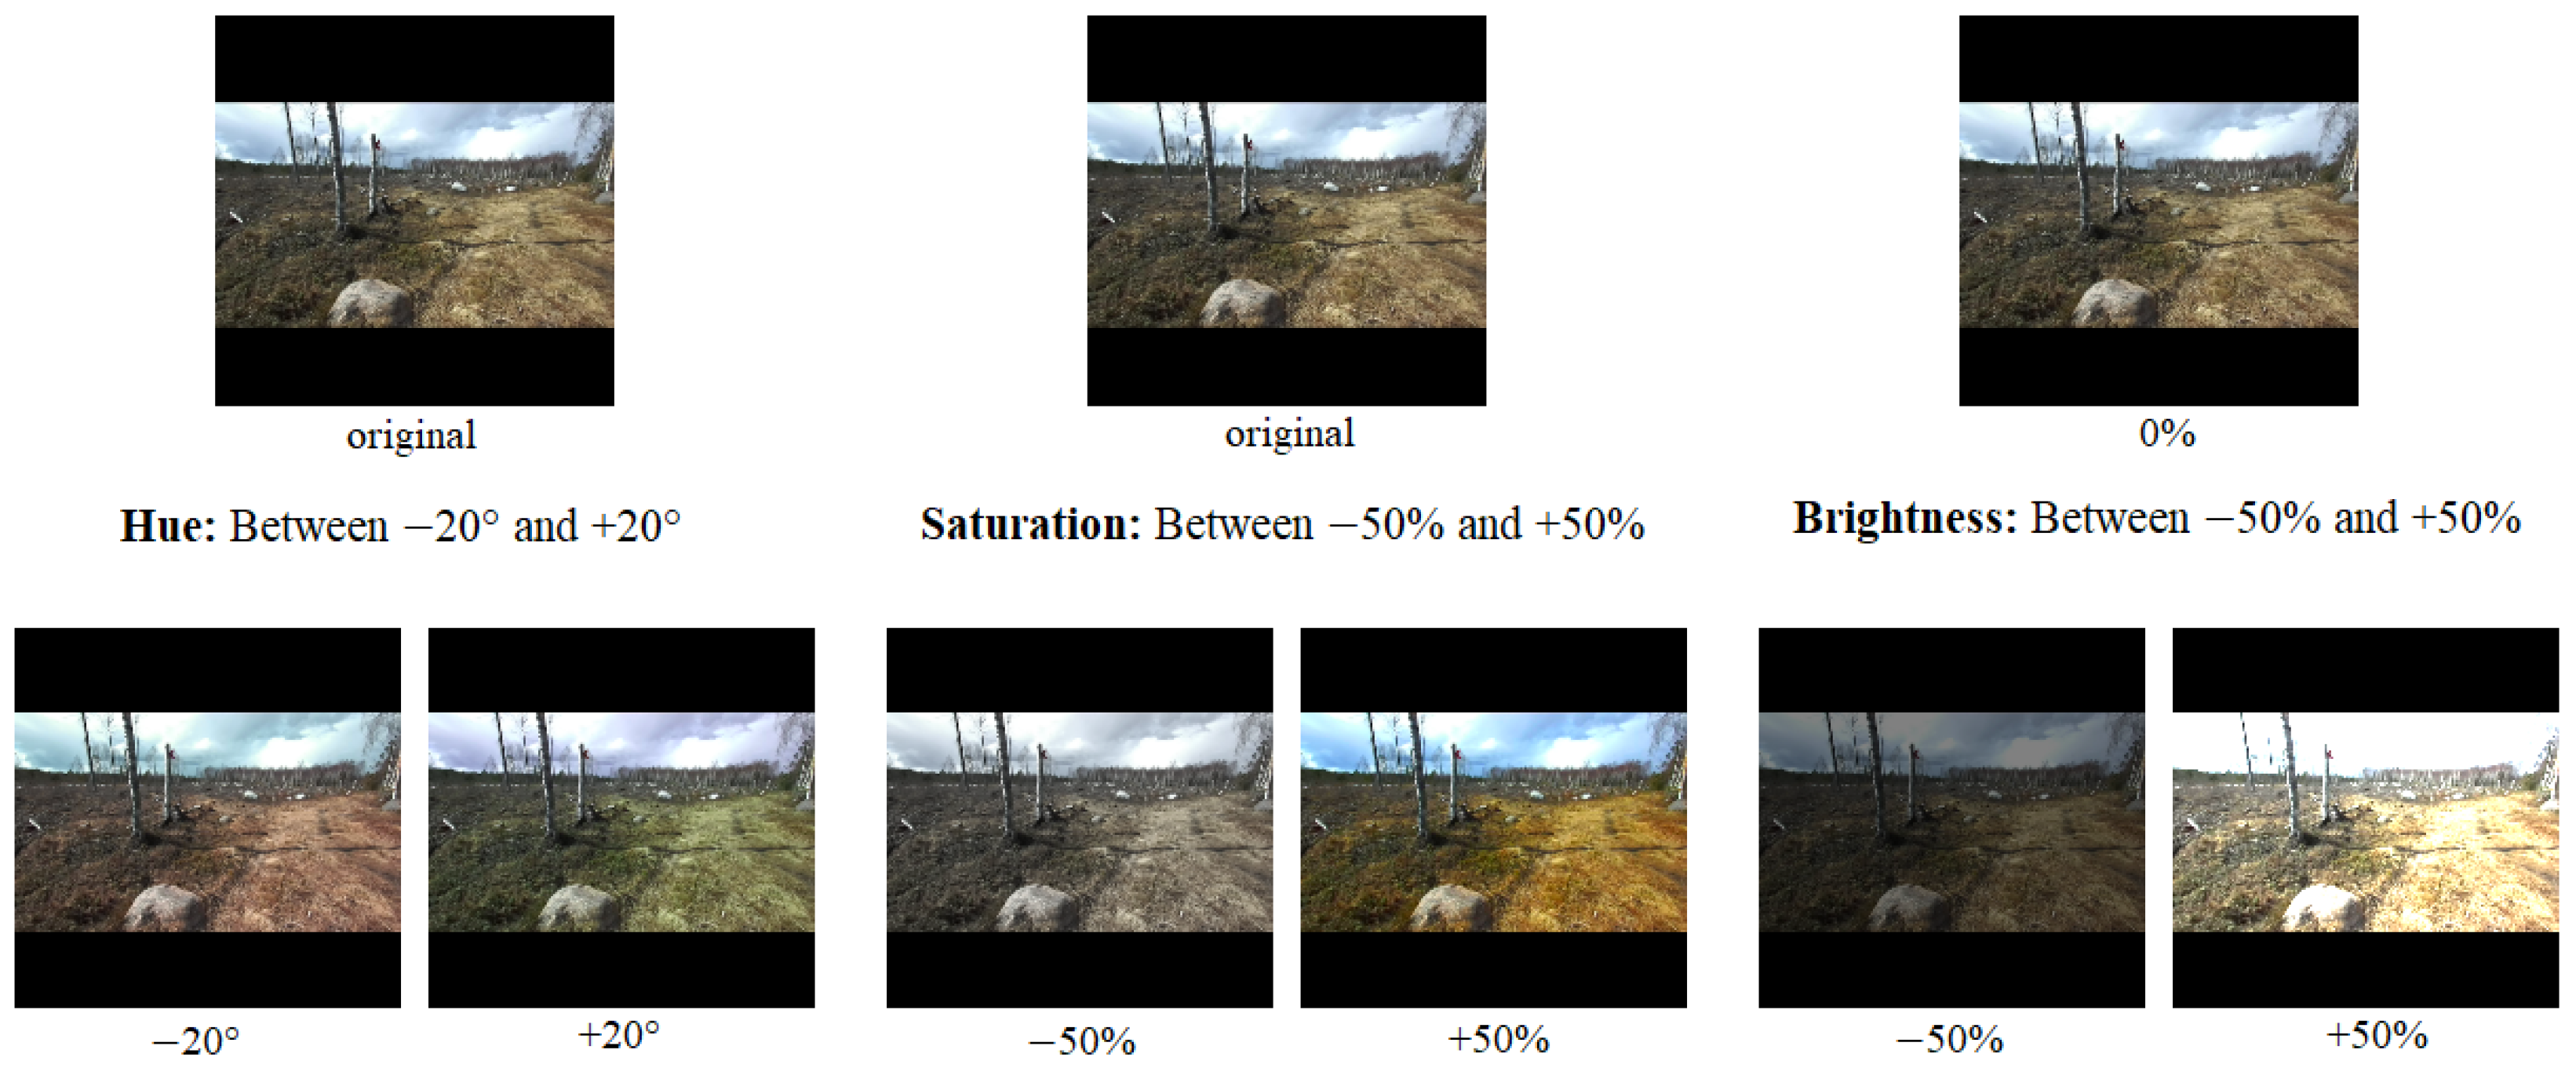
Augmentation for image datasets usually performs geometric and color augmentations, such as rotation, flipping, increasing noise, change of saturation, and brightness, etc. Such data augmentation of training datasets is considered to help reduce over-fitting on models and improve performance [
30]. Considering how data are collected outdoors with changing environmental conditions, we added adjustments of hue, saturation, and brightness on images in the training set.
We made changes for each of the images in the training set. Hue was adjusted randomly between −20° and +20°, saturation was adjusted between −50% and +50%, and brightness was adjusted between −50% and +50%. Each augmentation method is depicted in
Figure 5.
Through augmentation, we expanded the image data set for training from 197 to 591 images.
2.4.2. YOLO-ROS and the Detection Module
In the program design, the main part of the Detection module is the YOLO-ROS package [
31], which is used to realize the function of object detection in the color images. It is an existing ROS package developed for object detection in camera images and uses YOLOv3 on Graphical and Central Processing Units (GPU and CPU, respectively). The YOLOv3 algorithm has been verified to be effective and fast in real-time detection applications [
25]. The YOLOv3 backbone Darknet-53 possesses fewer floating-point operations compared to other state-of-the-art networks but is two times faster with the same classification accuracy [
17], a good-to-have property for real-time execution. YOLOv3 also shows significant improvement for small objects detection and performs very well with speed involvement compared with earlier versions [
25]. Running YOLO-ROS within the ROS framework enables results output to be directly available within the ROS network, which enables other devices running within the same ROS framework to subscribe to the information or directly transmit signals from other devices into the YOLO-ROS for subsequent processing. The built-in YOLO algorithm in this ROS package also meets our need for obtaining detection results in real time. Using YOLO-ROS makes it convenient for other parts of the ROS network to call the YOLO function and freely use and edit the outgoing data from the package.
YOLO-ROS encapsulates the YOLOv3 algorithm based on the Darknet-53 network, a convolution neural network with 53 convolution layers. The encapsulated YOLOv3 has a training process completely consistent with the original YOLOv3. The weight file obtained after training by the original YOLOv3 can therefore also be used here. By feeding the training set into YOLO, we can get a so-called weights file trained on the prepared data. A weights file is a binary file containing the parameters for the 53 layered neural network. With transfer learning, we utilized a pretrained model that was previously trained on terrain objects such as stumps and stones with a newly built training database that contains around 1000 images. Our final weights file achieved a mean average precision (mAP) of 94.90%, which is an evaluation metric [
32] commonly used in the PASCAL Visual Object Class (VOC) challenge [
33]. The network initialization parameters are shown in
Table 1.
The output of this package used for subsequent object positioning is the information of the bounding box position in 2D images, as well as corresponding object class and probability measures.
2.4.3. The Determination of Spatial Position of the Target Objects
After the target object is recognized by object detection, we need to determine its actual position in space and output it. Through the Zed2 camera, we can get the depth map of the target area, and the corresponding spatial coordinates can be obtained after depth data processing.
The camera is modeled according to the pinhole camera model. The relationship between the coordinate of a 3D space point
and the pixel coordinate of its image projection in 2D
is given by
where
is an arbitrary scale factor;
and
are the rotation and translation, which relate the world coordinate system to the camera coordinate system;
and
denote the focal length of the camera in X-axis and Y-axis, and
and
denote the center of the camera’s aperture.
It can be deduced from the above formula that:
If the pixel coordinate , and the depth information of this pixel is known, the actual spatial position represented by the corresponding pixel can be calculated according to the camera parameters , , , and , which are usually provided by the camera manufacturer.
Using coordinates provided by the bounding box data, we can determine the region represented by the bounding box in the depth map. The depth information in this region reflects the spatial characteristics of the target object. Then, we can calculate the actual position of the target object according to the depth information according to the above calculation method. The depth information of the bounding box center point is used to calculate the actual position of the object. However, considering that loss of depth information may sometimes occur, depth information of bounding box center points may also be lost. Therefore, we use the mean value of depth data in a small area of the bounding box center to calculate the object position, which significantly increases calculation robustness. This is a possible technique since the camera points downwards and to a great extent depicts terrain areas and not areas without depth information that otherwise would rapidly change from one pixel to another.
2.5. Comparing Object Position from 3-D Scene with Automatic Object Detection
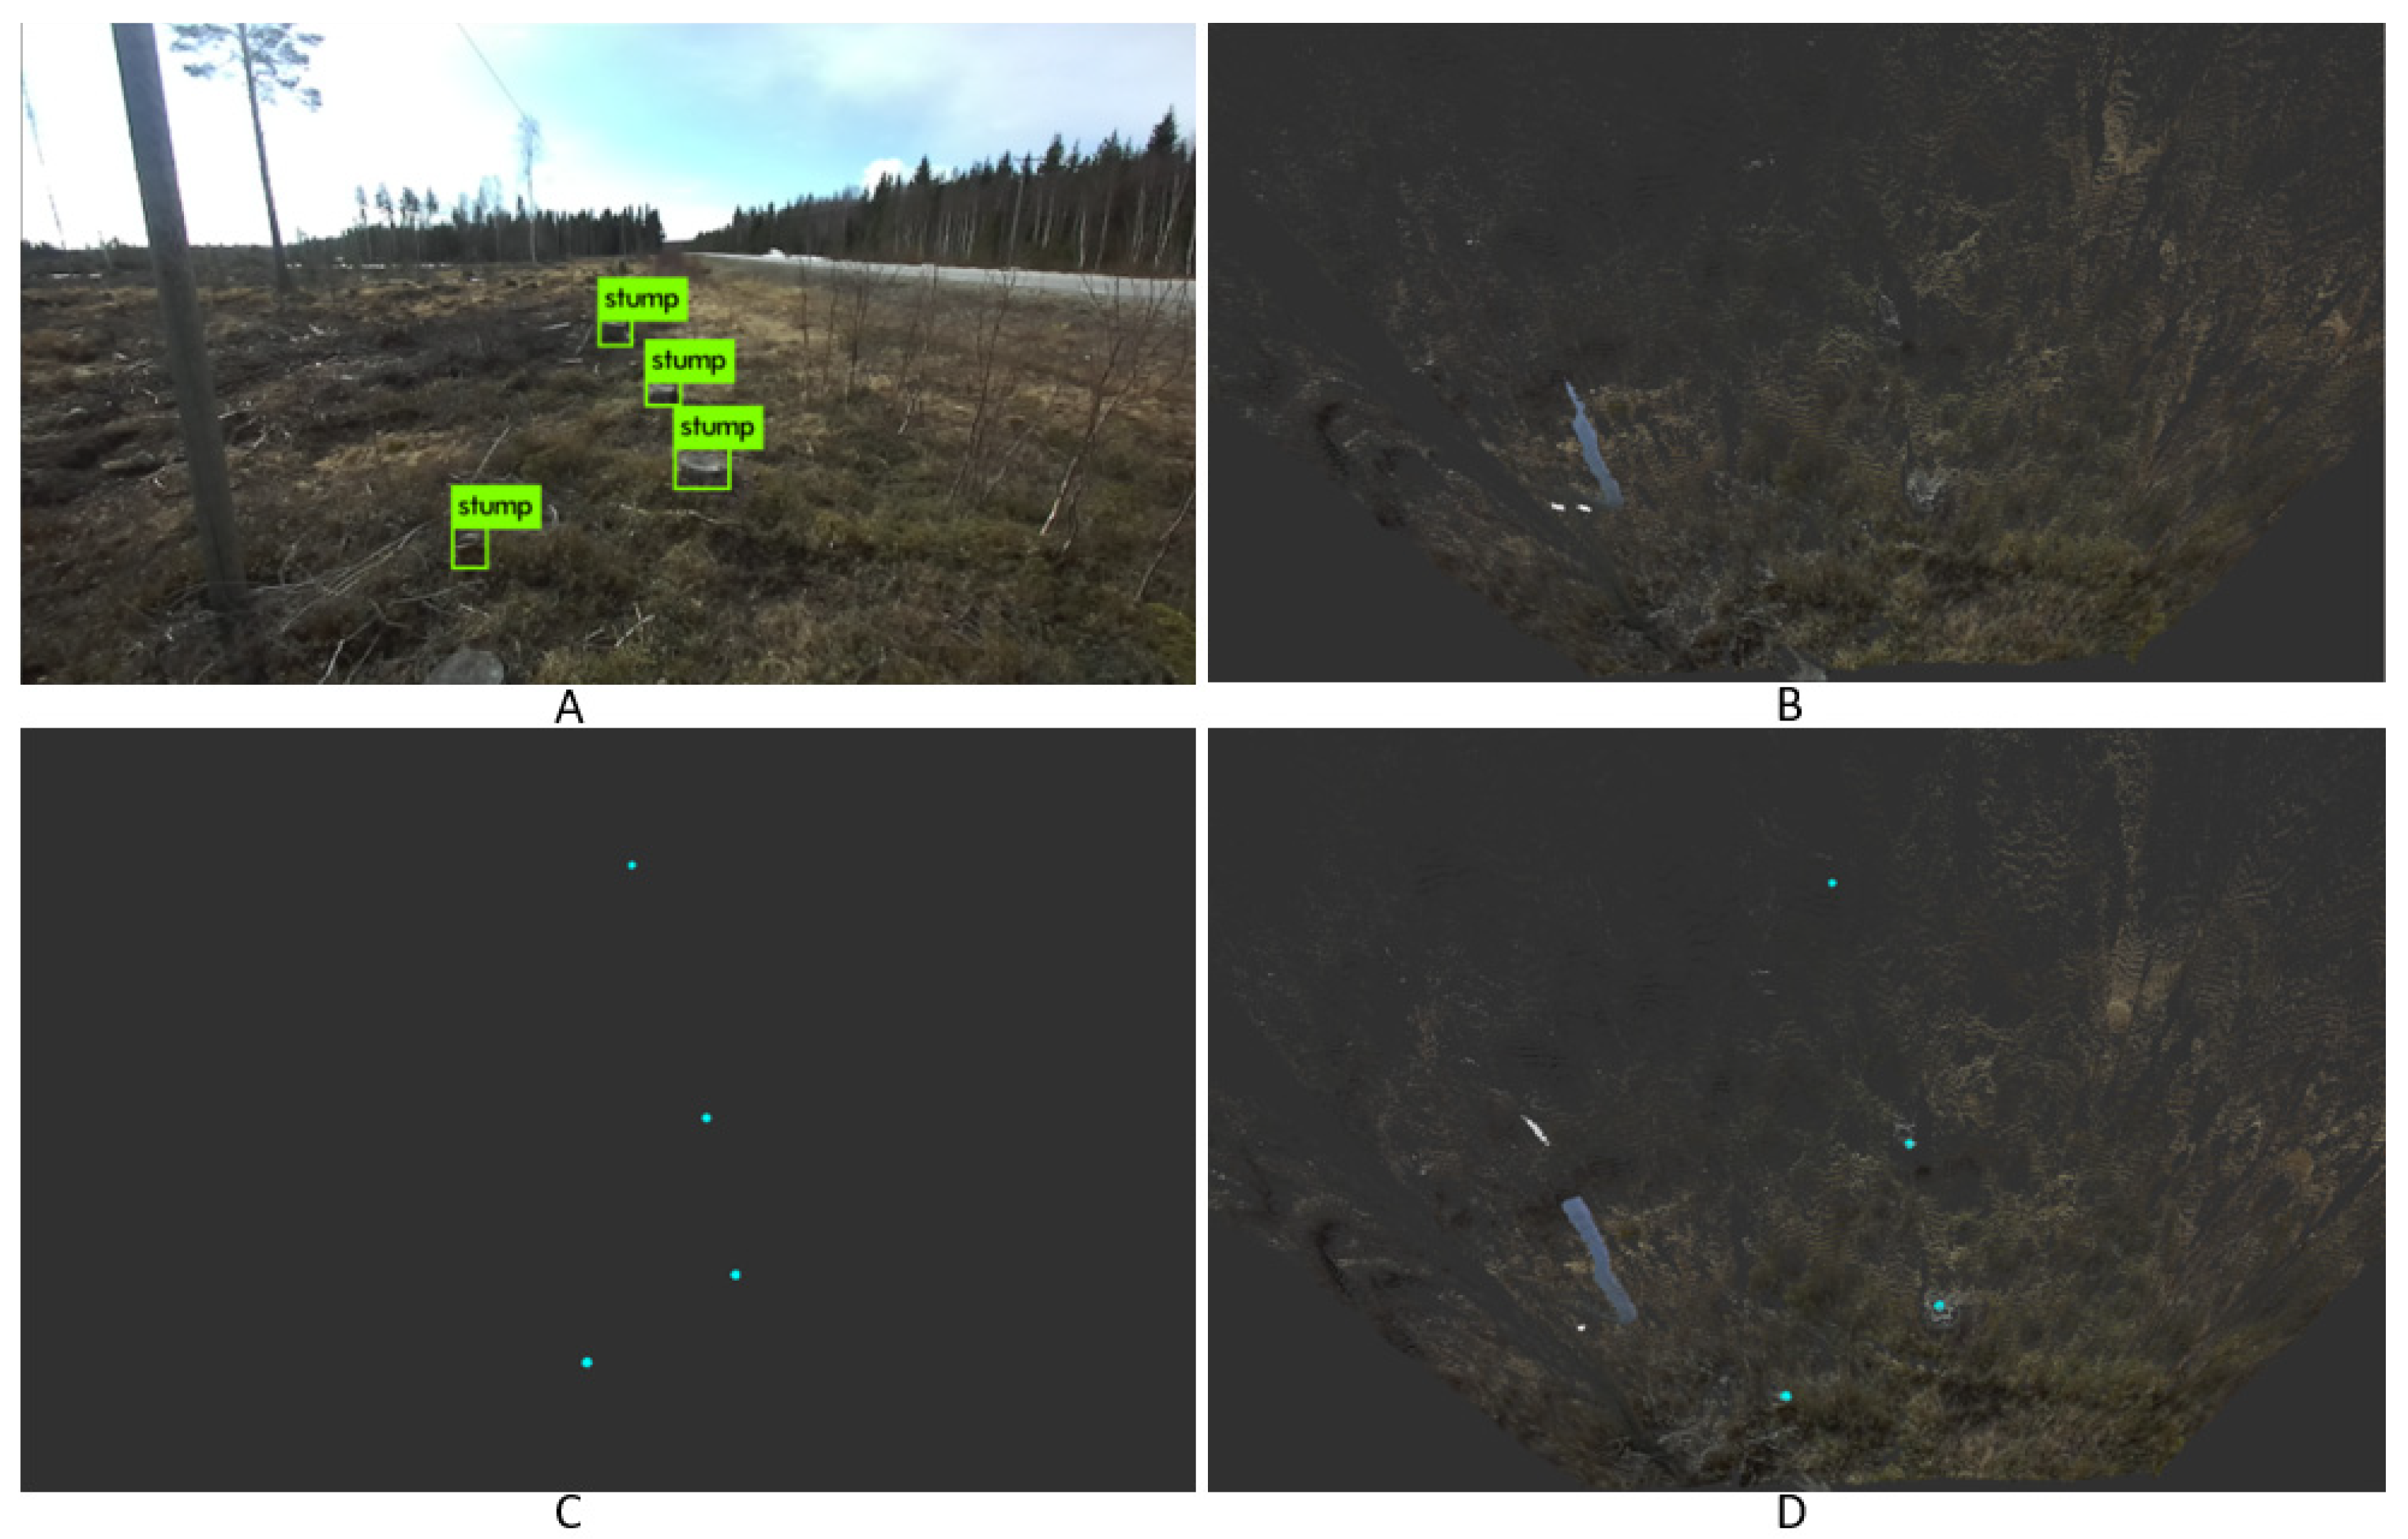
ROS Visualization (RVIZ) was selected to enable the display of the output results, which is a graphical tool built into ROS and can easily perform graphical operations of ROS programs. Different signals were displayed in different windows in RVIZ.
The Zed2 camera can generate 3D point clouds from the recorded scene in real time. The density and number of points in view, or the resolution of the point-cloud data, depends on the resolution of the color images. The detection and localization results of the objects of interest are also shown in the form of point-cloud data. Each detected object is represented by a point at its center position. In this case, point-cloud data containing object center points (
Figure 6C) and scene point-clouds (
Figure 6B) exist in the form of two independent layers, which do not affect each other and can be displayed separately. The result is exemplified in
Figure 6.
When the two layers of point clouds are displayed together, we not only can perceive the whole scene from what we see but also can produce an intuitive feeling about the location of the object of interest in the whole scene. Having free access to any perspective in the 3D view, we thoroughly labeled actual center points of objects, enabling us to evaluate the discrepancy between manual and automatic center point locations. Center point differences were calculated by measuring the shortest distance between the points in 3D space. The manually defined object center points were located on top of the object and in the area mass center given by an orthographic view.
The comparison between automatic localization results and the manual localization results in the point cloud excludes the impact of the camera’s own depth noise on the comparison results. According to official documents, the error of the Zed2 camera is <1% up to 3 m and <5% up to 15 m [
34], that is, for example, a point measured at 2 m depth from the camera; in reality, the actual depth distance from this point to the camera can be up to 2 cm off the measured value. Such discrepancies between the detected distance and the actual point distance are always present.
3. Results
By comparing the difference between the results from automatic detection and localization obtained by manual location information, which was regarded as the true value as the benchmark, we can judge the actual performance of the automatic detection positioning system.
3.1. Hit or Miss
We focus on evaluating the successful detection and missing detection of target objects since we assume that most of the existing target objects can be accurately detected. The analysis of results focuses on whether the target object can be detected effectively while taking the possible detection errors of the non-target object as the outcome error.
Table 2,
Table 3 and
Table 4 show the ability of the detector to detect objects of interest in the environment. For the target objects that appear in the scene, the successful occurrence of a bounding box overlapping the object by at least 90% is regarded as a successful detection; here we say it is a “hit”. If the target object is not successfully framed by the bounding box, it will be regarded as a “miss”. The counting starts when the corresponding object is first detected and ends after the object is outside the field of view. It should be noted that the total number of times the same object appears in different runs may be different since the number of frames encompassing the same object varies between runs.
In Track 1, there are six target objects, which are all stumps. Apparent from
Table 2 is that on all the three runs of Track 1, the system has a high detection accuracy. The travel times for Track 1 runs were 13.5 s, 14.1 s, and 14.4 s. The maximum time difference between the three runs never exceeded one second.
For the five target objects located in Track 2,
Table 3 shows the detection results. These five objects comprise four stones and one stump. Travel times for Track 2 runs were 21.0 s, 20.6 s, and 20.8 s. The time difference between runs never exceeded 0.4 s.
There are objects that are identified as targets by the system but are not actually target objects (commonly called “false-positives”). Such objects, should they occur excessively, can seriously affect the implementation of subsequent functions, and they were therefore monitored. During detection, if a “false-positive” test occurred in a frame, it was recorded and summarized to a total number of errors for all frames. However, the number of “false-positive” errors was extremely low during actual testing, absent in most test runs, and only a few “false-positive” errors occured occasionally in a few test runs. Overall, “false-positive” errors during detection comprised less than 1% of total detections made by the system. Therefore, it has little negative impact on the detection function of the system.
Table 4 shows the overall detection ability of the detector with regard to the target object located in the two tracks. For Track 1, successful detection during the runs took place for 97.7%, 97.4%, and 96.1% of the frames, respectively. Overall, correct detection occurred 97.1% of times. For Track 2, the percentage of successful detection was 98.9%, 97.7%, and 97.9%. Overall, correct detection occurred 98.2% of times. The resulting detection performance in Track 2 exceeded Track 1 results.
Combining all the results achieved from the testing in Track 1 and Track 2, it is apparent that the object detection rate exceeds 96%. That is, for all target objects that naturally exist in the scene, most of them can be detected successfully. Higher detection success rate lays a good foundation for object localization.
3.2. Accuracy Analysis
Positional deviations between the automatic localization and the manual reference are reported as absolute mean values and Root Mean Square Errors (RMSE) in
Table 5. In addition, to show the discrete degree of errors, the Standard Deviation (SD) between automatic localization and manual measurements were also calculated.
Comparing the results of the three runs of Track 1 shows a lowest mean error in run 1. However, a high degree of data dispersion means that the volatility of the distance between the automatically localized position and the manual reference is larger. In the meantime, the automatic localization results in run 2 show both good positioning performance with low fluctuation.
Comparing the three runs of Track 2 shows that run 3 demonstrates the best result of automatic localization positioning and at the same time has a low error dispersion.
Comparing the results in Track 1 and Track 2 as a whole, we can say that the test result of Track 2 demonstrates better performance: smaller mean error, lower SD, and lower RMSE.
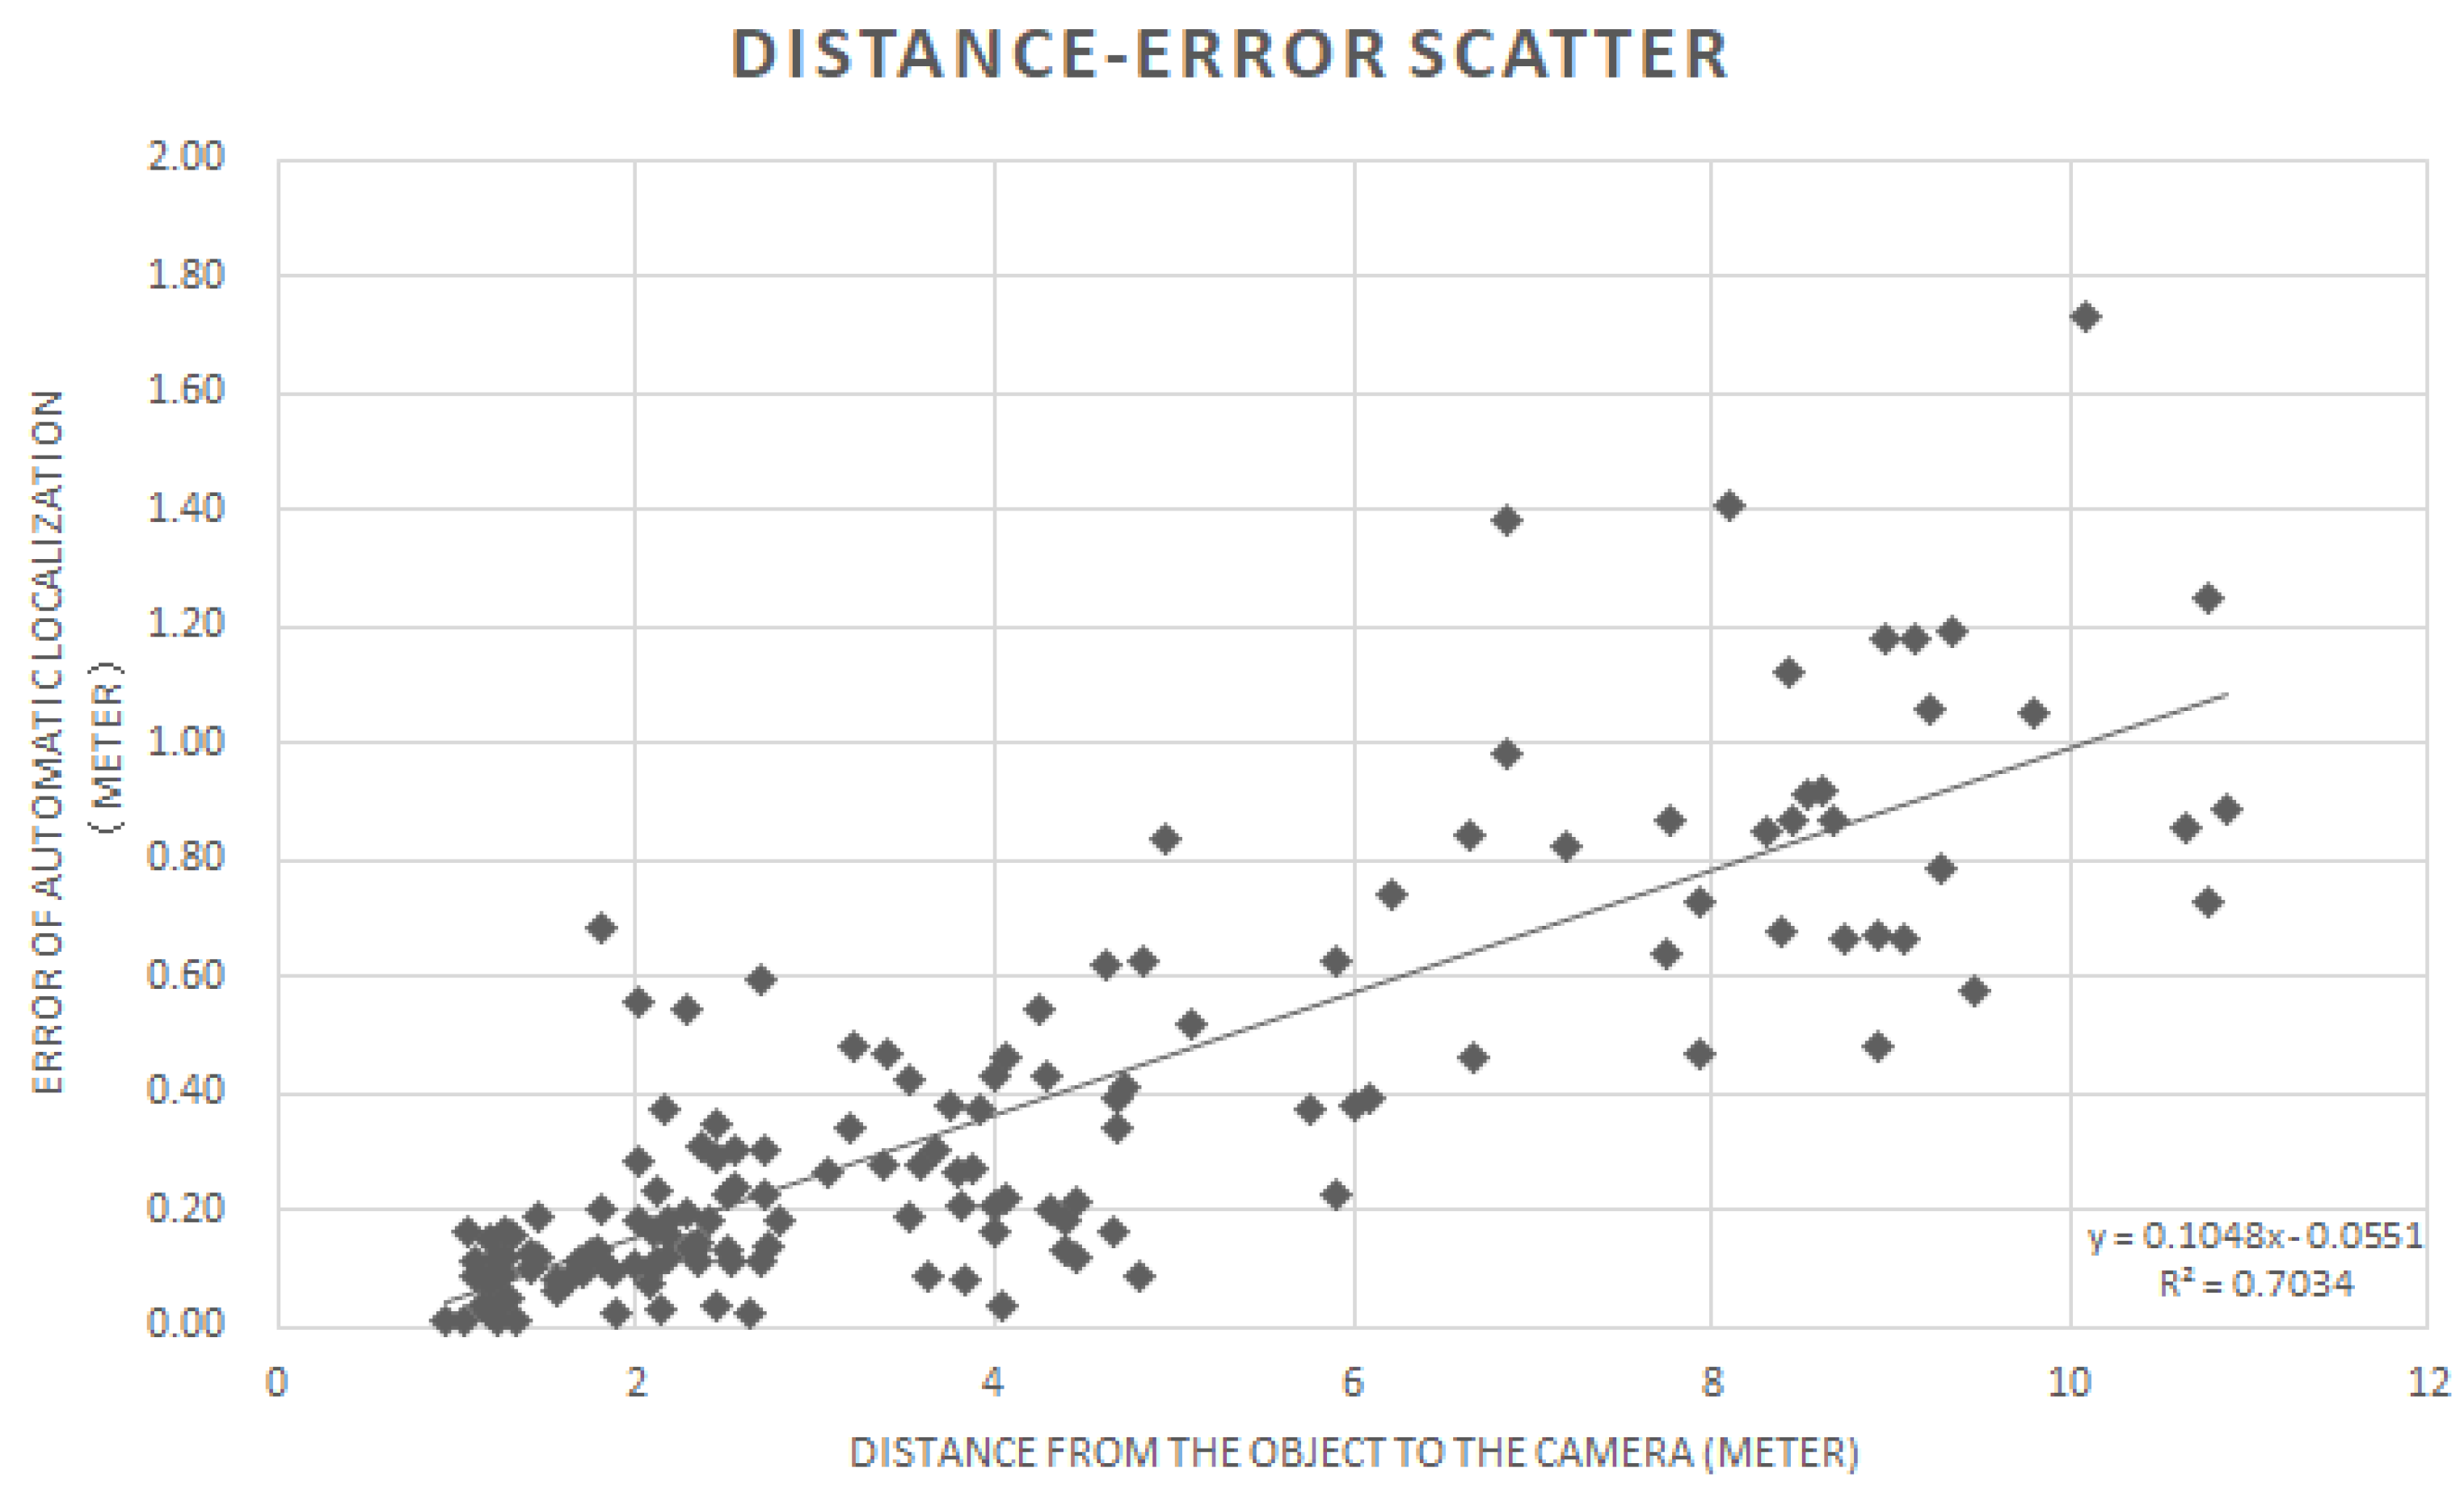
Meanwhile, in order to understand the relationship between the distance from the target object to the camera and the error in the automatic object localization, we randomly selected 150 objects from our testing process and measured the distance from the object to the camera and the automatic localization error. Results are depicted as a scatter map in
Figure 7.
The distance increase between objects and camera will increase the error of localization. The
Figure 7 scatter plot also shows the first-order linear regression, in which its error value (y) increases linearly as the distance value (x) increases. In general, objects farther away from the camera appear smaller and take up fewer pixels in the color image used for detection. Compared with objects in closer proximity, distant objects are represented in the image by fewer pixels, which means that the distance between adjacent pixels is larger. Therefore, the farther the objects detected, the more likely they are to produce errors in the judgment of distance. Not depicted in
Figure 7 is the fact that the camera itself produces errors (under 1% within 0–3 m and under 5% within 3–15 m), which need to be added to the total system accuracy performance.
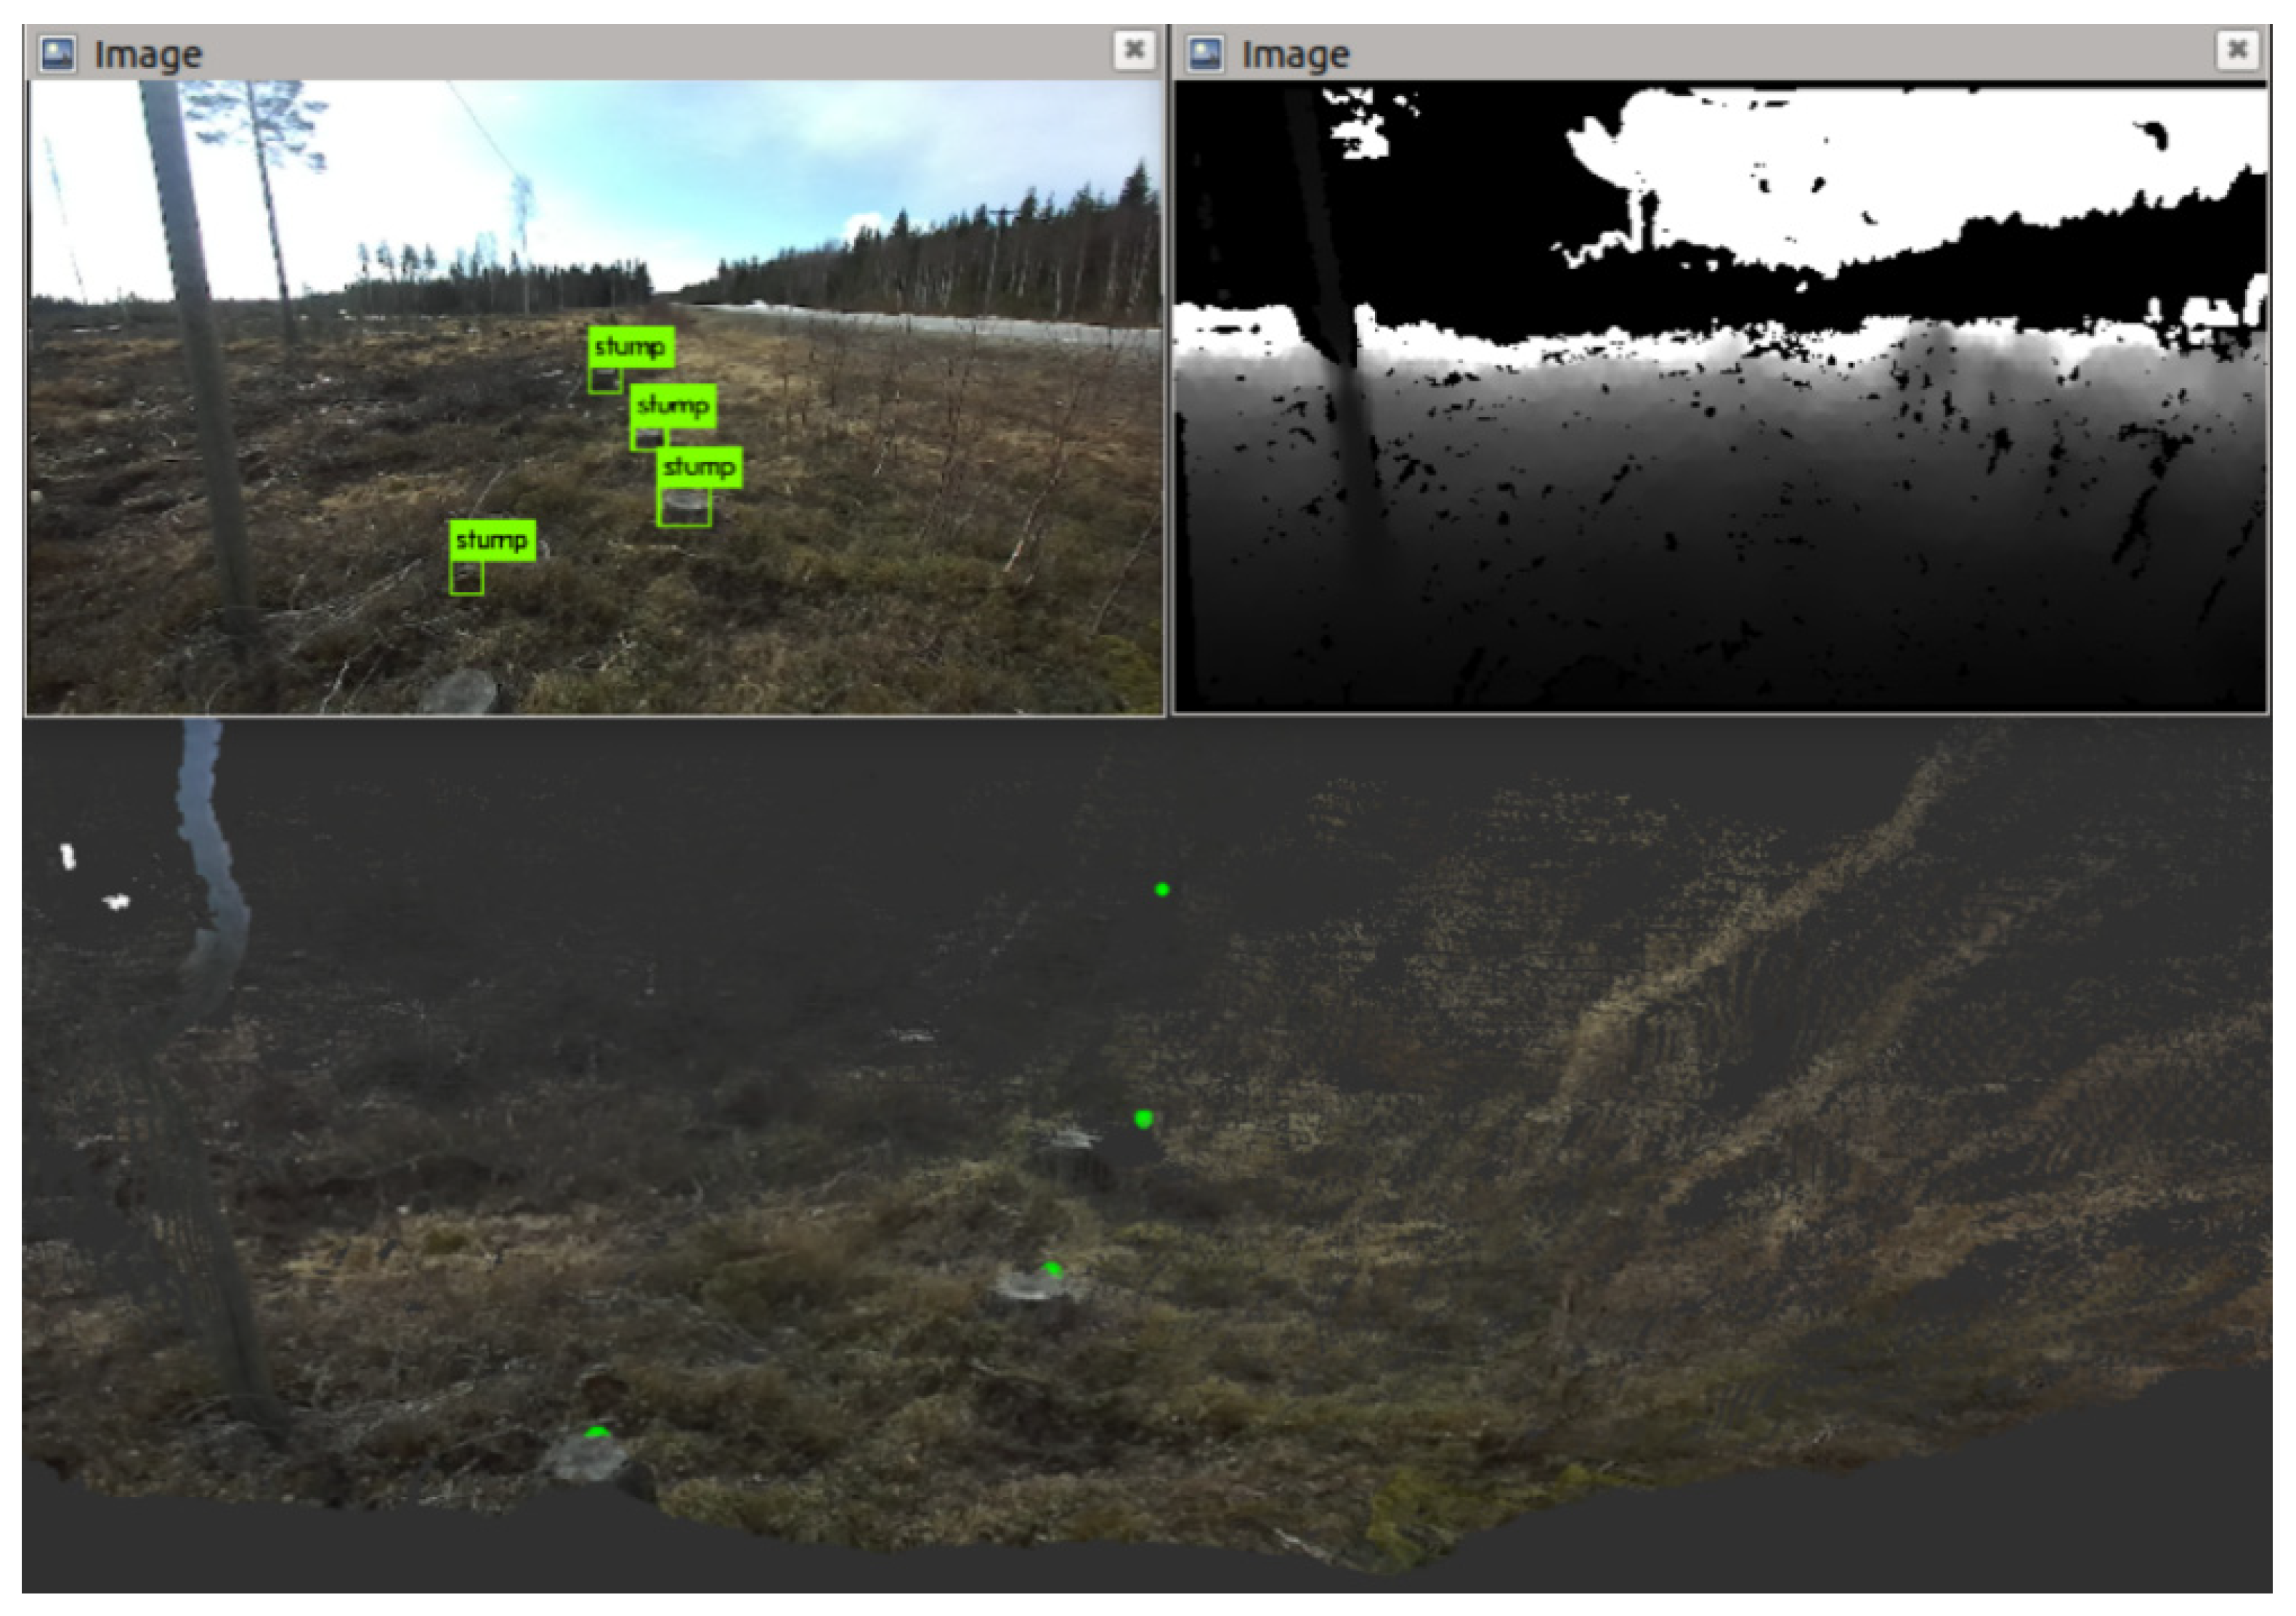
3.3. Visualization
For real-time results to be graphically displayed, RVIZ is used to visualize detection and localization results. For target objects detected within the camera view, positions are represented by a separate point-cloud layer. At the same time, the point-cloud data for the entire scene is displayed, each pixel in the color as it appears to the camera. Finally, the visual result displays a real-time mixed point cloud containing the locations of detected objects (in green,
Figure 8) through the RVIZ window.
Figure 8 exemplifies the graphic visualization.
3.4. Real-Time Performance of Nvidia Jetson Xavier
In ROS, capabilities exist to evaluate the network speed and performance during real-time operation on the Nvidia Jetson Xavier. These built-in functions were used to assess frame rates of the system for two cases: (1) when visualizing the output from the Detection and Localization modules on a graphical display and (2) when feeding Detection and Localization module output directly to a machine control unit. The actual frame rate performance is shown in
Table 6.
4. Discussion
Our results show the feasibility of constructing an automatic object detection and localization system for traditional forestry machines such as forest harvesters and forwarders common to Scandinavian forest environments. In our actual test, the average error is not more than half a meter, and the distribution of error is relatively balanced with no apparent scattered large errors. Furthermore, we can also determine that the error between each automatic localization position and the manual marked position for each object maintain is within a reasonable range. The camera depth accuracy, however, is not taken into account since manually measured and automatically created object positions originate from the same data source. This means that up to 5% increased positional error could occur at distances exceeding 3 m when comparing to a point on a machine where the camera would be affixed. Although the influence of this error has been avoided in our experimental setup, it still needs to be considered when subsequent operations need precise measures of actual object whereabouts.
This result has been able to demonstrate the ability of the current system to locate objects such as stumps or large stones in the harvested forest, where we predict that its usage will bring considerable auxiliary effect to operators. Moving on, we plan to apply this method to forestry machine applications and partially replace the operator’s work so that it can play an essential role in machines’ environmental perception, motion planning, execution, etc. When forest machines have acquired the ability to detect, identify, and locate objects in the forest environment, encountered terrain with classified and marked objects can allow exploration into new advanced human–machine interaction methods, such as the autonomous establishment of local maps based on detected objects as overlaid landmarks, thus having autonomous localization and navigation in the region, complete unmanned logging of trees with pose estimation and collection of logs, etc. Similar perspectives have also been proposed by some other researchers [
35,
36,
37,
38].
Our goal in this project was to construct the interoperability between forest machines and visual perception, giving a basic ability to perceive, distinguish, and locate target objects in forest environments. However, our current implementation of the function is preliminary, there are many limitations, such as the still rather simple hardware system architecture. The Zed2 stereo camera used in the experiment has the advantages of being cheap and easily accessible and having high resolution. At the same time, the quality is unstable, easily affected by light conditions, and data errors are high compared to other sensor systems, such as Lidar, that rely on other sensing technology insensitive to ambient lighting conditions. A particularly negative influence on the results originates from the camera error increase as the distance from the detected object increases, having a negative impact on the subsequent localization process. At the same time, the impact of weather conditions on the working of the system is still unknown, which is also related to our next step of work. We also intend to test the algorithm in different lighting conditions, different weather conditions, and different forest environments. Additionally, other camera sensors may be introduced.
Regarding the algorithms used, improvements are still needed in both the function realization and the result display. For example, current detection and localization results can not reflect the shape and size of the object, and the resulting point locations of objects do not reside in the objects’ geometric center, since points were manually selected from point-cloud data for comparison. For the above shortcomings, we will continue to try to improve and perfect the system in future work, utilizing, e.g., bounding box sizes to better consider objects’ spatial geometry.
We also notice issues with real-time display of the results. Firstly, the display of the location results will have a slight delay compared with the scene point cloud from the camera. This is due to the time the Localization module requires to calculate object positions. The point-cloud signal is synchronized with the image signal transferred from the camera to the computer, displaying the point cloud and image signal directly, while the localization results are displayed after subsequent processing. This results in a sense of lag between the two signals in real-time display. When computing power is low, the time difference of the data display will be extended to the point that it can be detected by human eyes. In this regard, a solution for the problem could be to synchronize image, scene point cloud, and point location data to improve the perception of real-time results, however, forcing all data frames to be displayed slightly later than real-time.
The second problem with real-time display regards frame rate. On the Nvidia Jetson Xavier, the real-time display frame rate with visualization is kept at 5 to 7 frames per second, which is not enough for real-time display requirements [
39]. By comparison, a laptop with an Nvidia RTX-2070 graphics card can be kept stable at more than 15 fps, indicating that the low frame rate on the Nvidia Jetson Xavier is due to the lack of computing power. The easiest way to improve the performance is to enhance computing power with other hardware or simplify the procedures and the structure of the deep learning network. ROS has an advantage in that processes can be run on parallel systems connected via ethernet, reducing loads on a highly utilized system.
The paper has demonstrated the feasibility of using common software and hardware on the market to realize real-time detection and localization of obstacles that may be used to improve the operation of forest machine operation after logging. Based on this, along with the continuous system improvement, our ultimate ambition is to improve the environmental sensing system in such a way as to detect, classify, locate, and obtain the shape and size of objects of interest around machines in real-time, which are properties required in a system that is highly automated. Further, machines’ proprioceptive sensor data should be embedded in the system to estimate posture and to construct an object-distribution map surrounding a displayed environment containing a machine digital twin, which is especially beneficial for robotics development [
40]. It can then provide guidance for subsequent automatic operations, such as detecting the position and estimating the pose of logs in clearfellings, allowing unmanned forest machines to automatically select the optimal paths to traverse, and picking up and collecting the logs in turn. Another important application is within silviculture, where machines navigate and operate to e.g., scarify soil and plant seedlings while being vastly impeded by surface and sub-surface obstacles [
41]. If operator assistance or machine control could be applied using our findings, the quality of operation could possibly be increased on obstacle-rich clearcuts.


