Article

Decision Support Tool for Tree Species Selection in Forest Regeneration Based on Harvester Data

1
Luke/Natural Resources Institute Finland, Juntintie 154, 77600 Suonenjoki, Finland
2
Department of Forest Sciences, University of Helsinki, Latokartanonkaari 7, P.O. Box 27, 00014 Helsingin, Finland
3
Luke/Natural Resources Institute Finland, Korkeakoulunkatu 7, 33720 Tampere, Finland
4
Metsä Group, Tampereen Palvelutoimisto, Näsilinnankatu 14 C, 33210 Tampere, Finland
5
Luke/Natural Resources Institute Finland, Latokartanonkaari 9, 00790 Helsinki, Finland
*
Author to whom correspondence should be addressed.
Forests 2021, 12(10), 1329; https://doi.org/10.3390/f12101329
Submission received: 27 August 2021 / Revised: 23 September 2021 / Accepted: 23 September 2021 / Published: 28 September 2021
(This article belongs to the Special Issue Digital Transformation and Management in Forest Operations)

Abstract

:
Precision forestry—i.e., the division of a stand to smaller units and managing of the stand at a micro-stand level—provides new possibilities to increase forest growth, arrange forest stand structure and enhance forest health. In the regeneration phase by adjusting the tree species selection, soil preparation, intensity of regeneration measures (method, planting density, and material), and young stand management procedures according to precise information on soil properties (e.g., site fertility, wetness, and soil type) and microtopography will inevitably lead to an increase in growth of the whole stand. A new approach to utilizing harvester data to delineate micro-stands inside a large forest stand and to deciding the tree species to plant for each micro-stand was piloted in central Finland. The case stands were situated on Finsilva Oyj forest property. The calculation of the local growth (m3/ha/year) for each 16 × 16-m grid cell was based on the height of the dominant trees and the stand age of the previous tree generation. Tree heights and geoinformation were collected during cutting operation as the harvester data, and the dominant height was calculated as the mean of the three largest stems in each grid cell. The stand age was obtained from the forest management plan. The estimated local growth (average of nine neighboring grid cells) varied from 3 to 14 m3/ha/year in the case stands. When creating micro-stands, neighboring grid cells with approximately the same local growth were merged. The minimum size for an acceptable micro-stand was set to 0.23 ha. In this case study, tree species selection (Scots pine or Norway spruce) was based on the mean growth of each micro-stand. Different threshold values, varying from 6 to 8 m3/ha/year, were tested for tree species change, and they led to different solutions in the delineation of micro-stands. Further stand development was simulated with the Motti software and the net present values (NPVs (3%)) for the next rotation were estimated for different micro-stand solutions. The mixed Norway spruce–Scots pine stand structure never produced a clearly economically inferior solution compared to the single species stand, and in one case out of six, it provided a distinctly better solution in terms of NPV (3%) than the single species option did. Our case study showed that this kind of method could be used as a decision support tool at the regeneration phase.

1. Introduction

In current forest management practice, forest stands are delineated and formed either on an operational or a biological basis. Typically, the size of a forest stand varies between 1 and 10 hectares. However, stands in boreal forests often comprise rather broad small-scale variation regarding soil properties, site fertility, tree species mixture, etc. The term ‘precision forestry’ is an emerging forest management concept based on observing, measuring, and responding to the intrinsic variability within forest stands—see, for instance, [1,2].
With modern techniques (e.g., airborne laser scanning and harvester data), it is possible to produce trustworthy and, on a spatial scale, precise predictions on site quality indices, diameter–height distributions, and microtopography for a given point or grid cell or on a micro-stand level. Combining the information of tree attributes and site index with topographical, cartographical, and hydrological information provides a way to upgrade forestry efficiency. Furthermore, precision forestry gives forest practitioners tools to adjust the unique features of the site by managing the forest more according to biological prerequisites.
The concept of precision forestry—i.e., the division of a stand to smaller units and management of the stand at a micro-stand, grid cell, or even tree-by-tree level—provides a great possibility to have an impact on forest growth, forest stand structure, and forest health. In the regeneration phase, adjusting the tree species selection, soil preparation, intensity of regeneration measures (method, planting density, and material), and young stand treatment procedures according to precise information on soil properties (e.g., site fertility, wetness, and soil type) and microtopography will inevitably lead to an increase in growth of the whole stand.
Increasing the crop yield by productivity zoning is a long-established tradition in agriculture (precision farming, e.g., [3]). At present, the productivity zones in agricultural fields are most often delineated by remote sensing technologies (e.g., [4]). Recently, productivity zoning by various remote sensing technologies have also received increasing attention in forestry (e.g., [5,6]). However, forest stands are much more complex ecosystems with wide sets of tree species and other vegetation species compared to crop fields. Remote sensing has some limitations in assessing forest growth properly. Current remote sensing technologies are rather inefficient for assessing past forest growth, and they have difficulties assessing shares of different tree species [7,8,9].
Modern harvesting technology offers a promising alternative to assess past tree growth and tree species proportions, at least when the existing forest stand is clearcut. The harvester measures and registers the location of the tree while harvesting and this dataset can then be utilized to assess past forest growth by geographic location and also to estimate future growth. Recently, georeferenced tree level harvester data have been used to improve pre-harvest yield estimations [10,11] and for the estimating status of forest stands after harvesting [12]. Georeferenced harvester data have also been used to create spatially explicit maps of standing volume at the time of harvest [13].
The aims of this study are (1) to present a new method to execute productivity zoning of forest sites with georeferenced harvester data, (2) to demonstrate how to use productivity zoning when selecting the best alternative tree species at the micro-stand level, and (3) to assess the economical results of future tree stands with different micro-stand solutions.

2. Materials and Methods

2.1. Study Stands

The study material comprised six mature mixed Scots pine (Pinus sylvestris L.)—Norway spruce (Picea abies (L.) Karst.) forest stands on Finsilva Oyj forest property in central Finland. All these stands were clear-felled in summer and autumn 2017. The area of the chosen study stands varied from 1.3 to 23 ha. Site types according to the Finnish site type classification varied in these study stands from a quite unfertile Vaccinium type to fertile Myrtillus type [14]. The main tree species was Norway spruce in two study stands, and Scots pine in four study stands. All these stands had some birch (Betula pendula Roth. and B. pubescens Ehrh.) admixture (varying from 2 to 13% stand volume). Average cutting volumes varied from 199 to 303 m3/ha (Table 1).
All the study stands were situated in a limited area within a 15-km radius in central Finland near Tampere. When simulating the development of the next stand generation with the Motti simulator, all study stands were assumed to be situated within the same area.

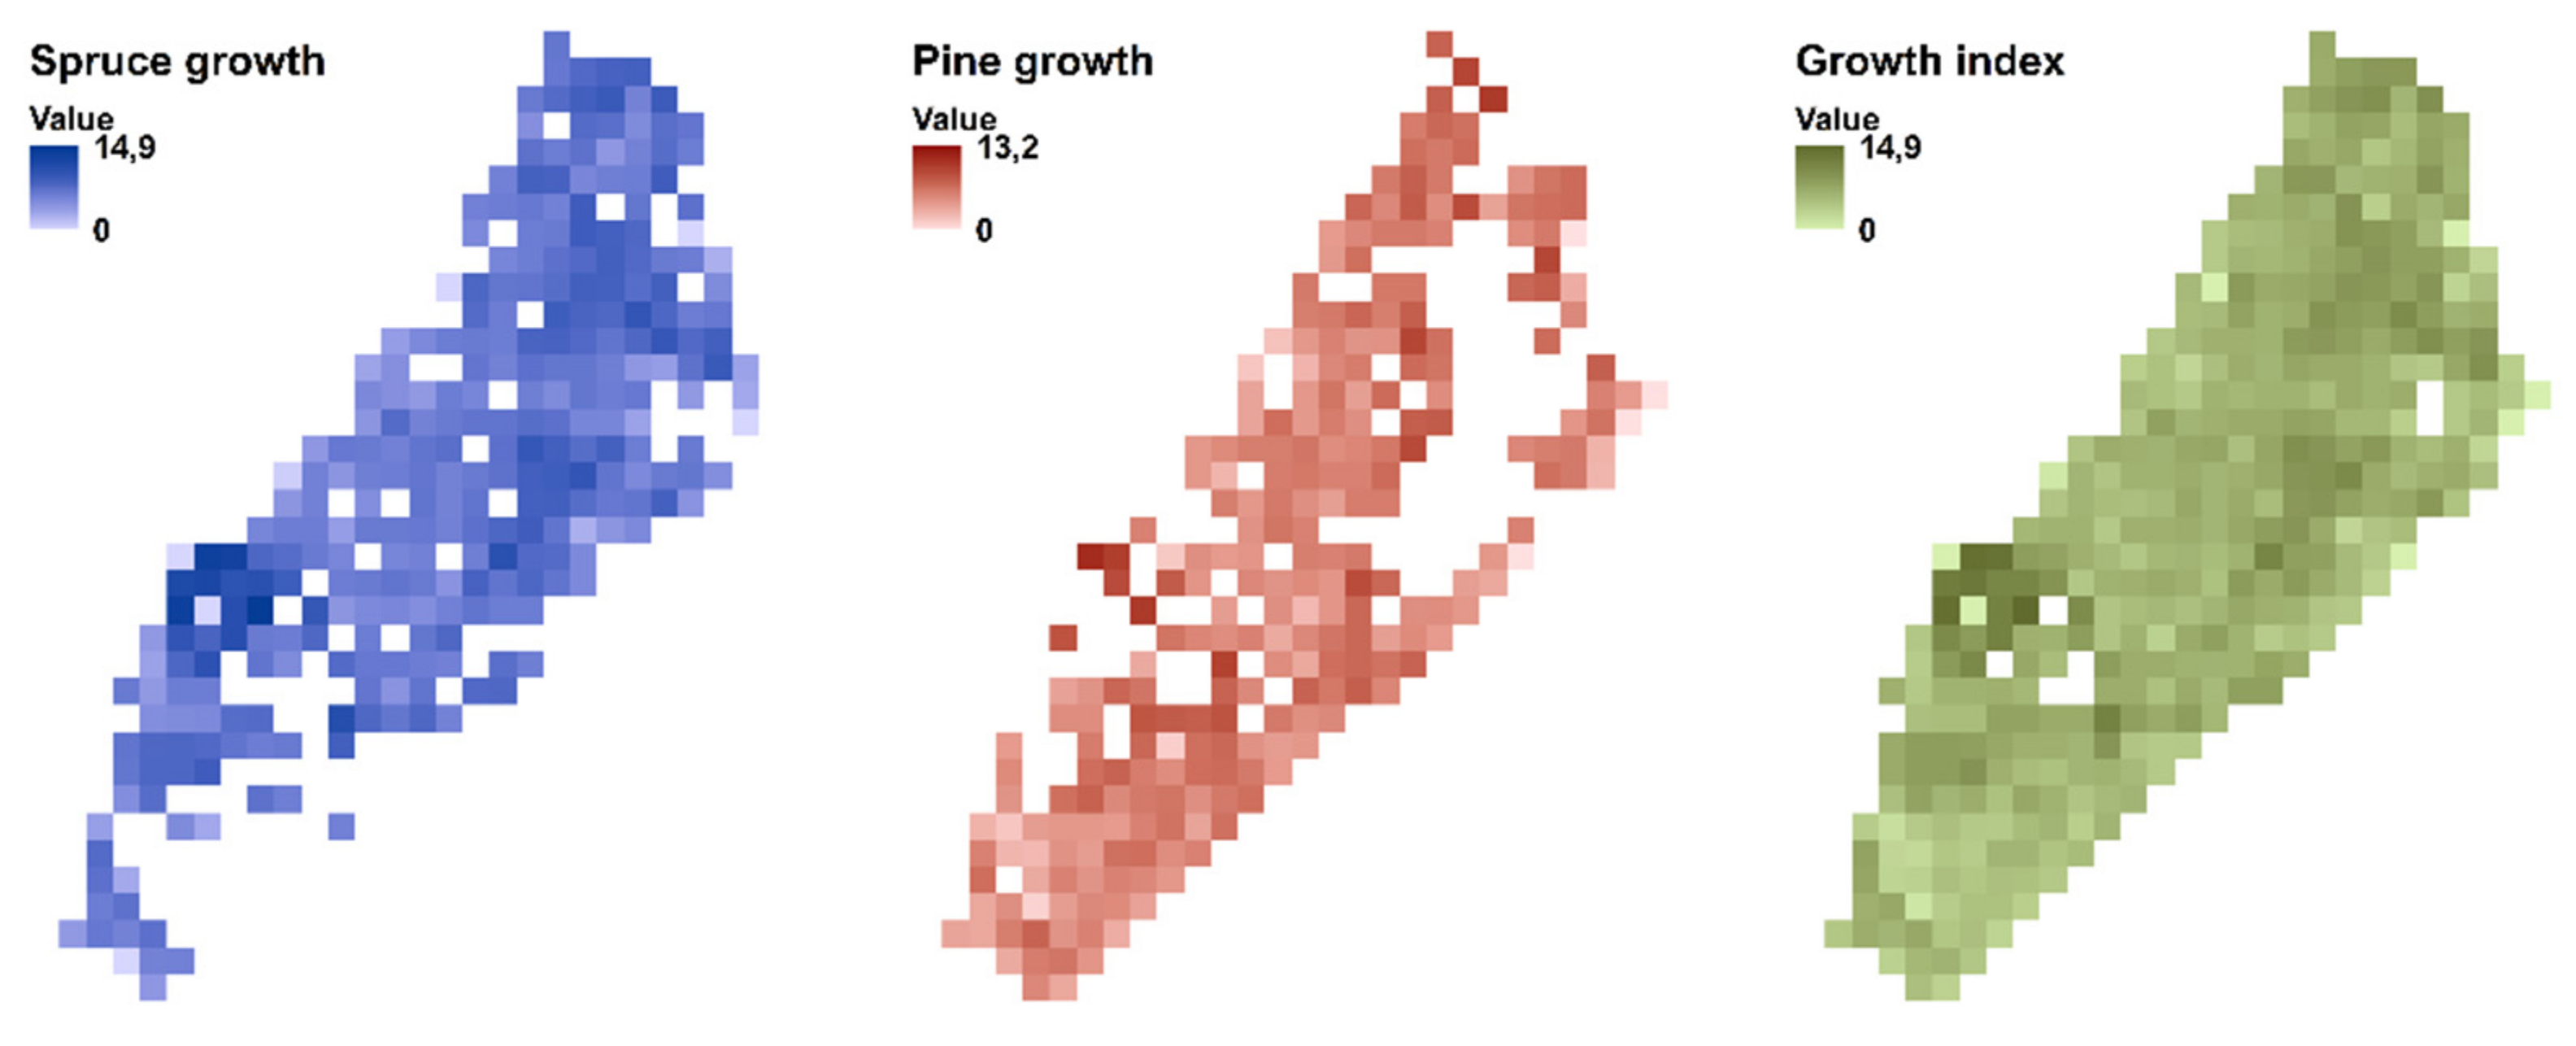
2.2. Estimation of Localized Growth

While harvesting, the most important tree characteristics were registered: geographic location of the tree (=location of harvester base machine at the moment the tree had been felled), butt end and top end diameters of each log, length of each log, and an assortment of each log. After harvesting, the tree information was converted into hpr-format [15]. Next, the hpr file was interpreted and analyzed with the HprAnalys -software developed by Skogforsk. With this tool, tree information was converted into ESRI Shapefile format. Using the ArcGIS tool, a new vector grid layout of 16 × 16 m was created, and each tree was categorized into one specific grid cell according to its location.
Tree height was based on harvester data and modeled top height. At first, the height of each felled tree was estimated using the diameter at the breast height, the height of the last cut, and the diameter of the stem at the height of the last cut. Top height was estimated using the model of Varjo [16]. Secondly, from each grid cell, the three tallest trees were selected as the dominant trees. Thirdly, stand age was based on the forest stand data. Next, the site index (i.e., H100 = height of dominant trees at the age of 100 years) for each grid cell was estimated with the equations given by Gustavsen [17]:
S c o t s   p i n e :   H 100 = 128.229 e x p l n H d o m l n 128.229 exp 4.70248 T 0.47692 4.70248 100 0.47692
N o r w a y   s p r u c e : H 100 = 147.481 e x p l n H d o m l n 147.481 exp 4.64631 T 0.29981 4.64631 100 0.29981
where
Hdom is the height of dominant trees at the moment of harvest and
T is the biological age of dominant trees at the moment of harvest.
Finally, the mean annual volume growth (iv) for each grid cell for a period of 100 years (m3/ha/year) was estimated for Scots pine and Norway spruce with the following equations presented by Vuokila and Väliaho [18]:
Norway spruce: iv = 0.11 + 0.0095 (H100)2
Scots pine: iv = −0.44 + 0.0098 (H100)2
A greater value of these growths (Scots pine or Norway spruce) was selected to represent growth of the grid cell (Figure 1).

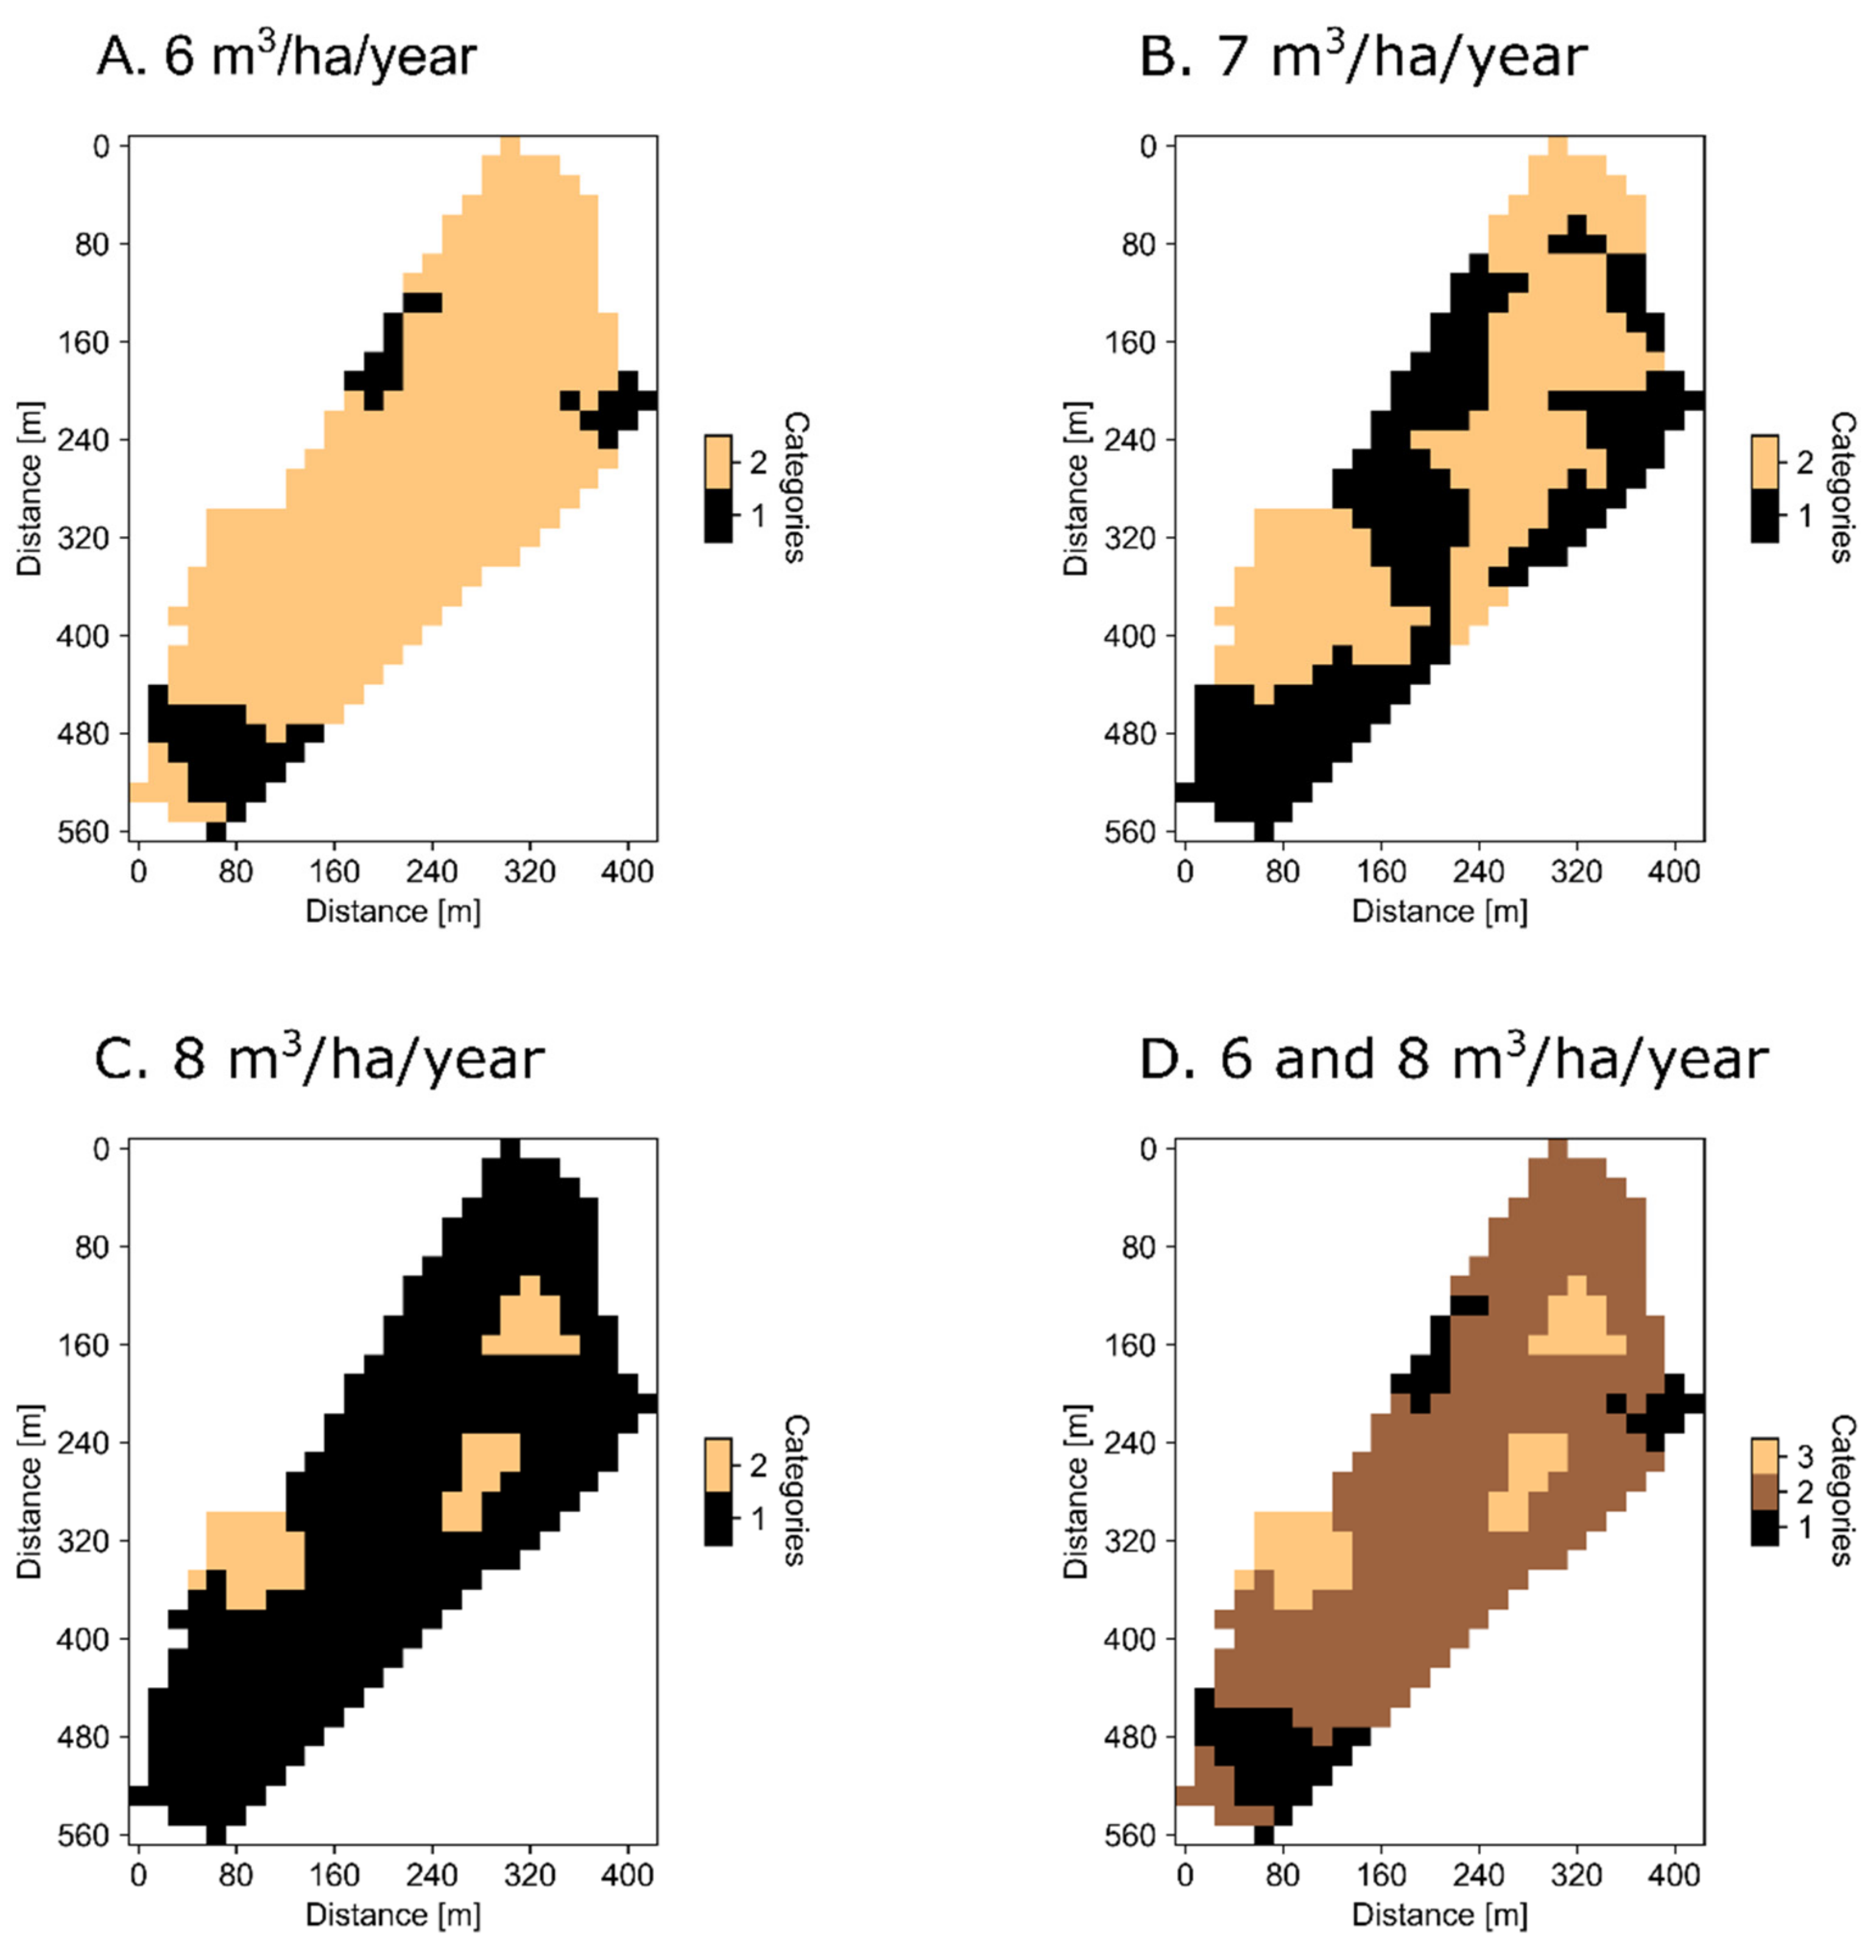
2.3. Creation of Micro-Stands

Delineation of micro-stands was based on the growth (mean growth within 100 years, m3/ha/year) of each grid cell. In order to scale out the variation in growth between adjacent grid cells, the average value of nine grid cells (the center cell plus eight adjacent cells) was used as the growth value for the center cell. Micro-stands were generated from adjacent cells within the same growth category. The alternative threshold values for tree species change from Scots pine to Norway spruce were 6, 7, or 8 m3/ha/year in this case study. First, the program segmented the given growth data and identified the continuous areas of different categories. An iterative process was used to segment the growth data to areas larger than the threshold value (nine grid cells; 0.23 ha). Areas smaller than nine grid cells were identified and their growth values were converted to the closest value in the neighboring segments. The segmentation, area identification, and cell value transformation were repeated until all the continuous areas (micro-stands) were large enough (at least 0.23 ha).

2.4. Simulation of Future Stand Development

Further stand development by dominant tree species and site type was simulated for each micro-stand with the Motti stand simulator, which has been developed at the Natural Resources Institute Finland (Luke). Motti is a stand-level forest management and decision support tool that consists of stand-level models and distance-independent individual-tree models for predicting stand dynamics (regeneration, growth, and mortality) and stand structure [19,20,21]. The growth and yield models of the Motti stand simulator are based on extensive empirical data covering all commercial tree species [22,23]. The predicted responses to different forest management practices are based on empirical data which cover all common forest management practices applied in practical forestry in Finland over recent decades.
In the simulations, the regeneration method was planting (Norway spruce, 1800 seedlings per hectare; Scots pine, 2200 seedlings per hectare), and the site preparation method was mounding. Survival of seedlings was assumed to be 90% for both tree species. Both early cleaning (EC) and pre-commercial thinning (PCT) were assessed in all simulations. The density of the sapling stands after EC was 3000–4000 seedlings per hectare, depending on the site type and tree species. The total stem number after PCT was 1800 and 2200 for Norway spruce and Scots pine, respectively. Tree selection in intermediate cuttings was based on thinning from below. Young stand management was performed at stand ages of 5 (EC) and 11 years (PCT) in both Norway spruce- and Scots pine-dominated stands. The time of intermediate cuttings was 33 and 29 years and 44 and 38 years in Norway spruce- and Scots pine-dominated stands, respectively. The rotation period for Norway spruce-dominated stands was 64 years, and that for Scots pine-dominated stands was 61 years.
The merchantable stem volumes from intermediate cuttings and clearcutting were calculated using assortment rules widely applied in Finland—see, for instance, [24]. The wood prices and silvicultural costs used in economical calculations were based on annual statistics [25] from the years 2002 to 2016 (deflated by the cost-of-living index to the year 2016). The net present values (NPVs, 3%) for the whole rotation were compared between different micro-stand solutions.

3. Results

3.1. Comparison of Different Micro-Stand Solutions

Alternative micro-stand solutions resulted in quite different proportions of Scots pine and Norway spruce in the same study stand (Figure 2). For instance, in study stand no. 49, the single threshold value solutions (alternatives A–C in Figure 2) differed totally from each other. The double threshold solution, 6 and 8 m3/ha/year (alternative D in Figure 2), seemed to combine the features of the single threshold solutions.
The number of micro-stands varied from 1 to 13 in the different solutions in the study stands. In the smallest study stands (stand no. 2 and no. 118), delineation of micro-stands only created two micro-stands. This was obvious because the total area of these stands was less than two hectares. In larger study stands, the number of micro-stands was clearly higher, varying from 1 to 13. In these larger study stands, the average number of micro-stands in single threshold value solutions was six, and in double threshold value solutions, it was nine.
The average area of micro-stands was 1.68 ha (excluding the solution from a threshold value of 6 m3/ha/year in study stand no. 127, which led to a pure Norway spruce stand). In larger study stands (excluding no. 2 and no. 118), the average micro-stand area was more than two hectares. The minimum micro-stand area averaged at 0.46 ha (excluding one micro-stand solution in study stand no. 127), and in larger stands, 0.27 ha.
In two study stands (no.118 and no. 127) the result was Norway spruce-dominated stock in every micro-stand solution. Additionally, the single threshold value of 6 m3/ha/year, and the double threshold values of 6 and 8 m3/ha/year with Norway spruce in the middle category always gave a Norway spruce-dominated stand as a result. Most often, Scots pine-dominated stands were found when the threshold value was 8 m3/ha/year, or when the double threshold values were 6 and 8 m3/ha/year with Scots pine in the middle category, which was quite an obvious outcome.

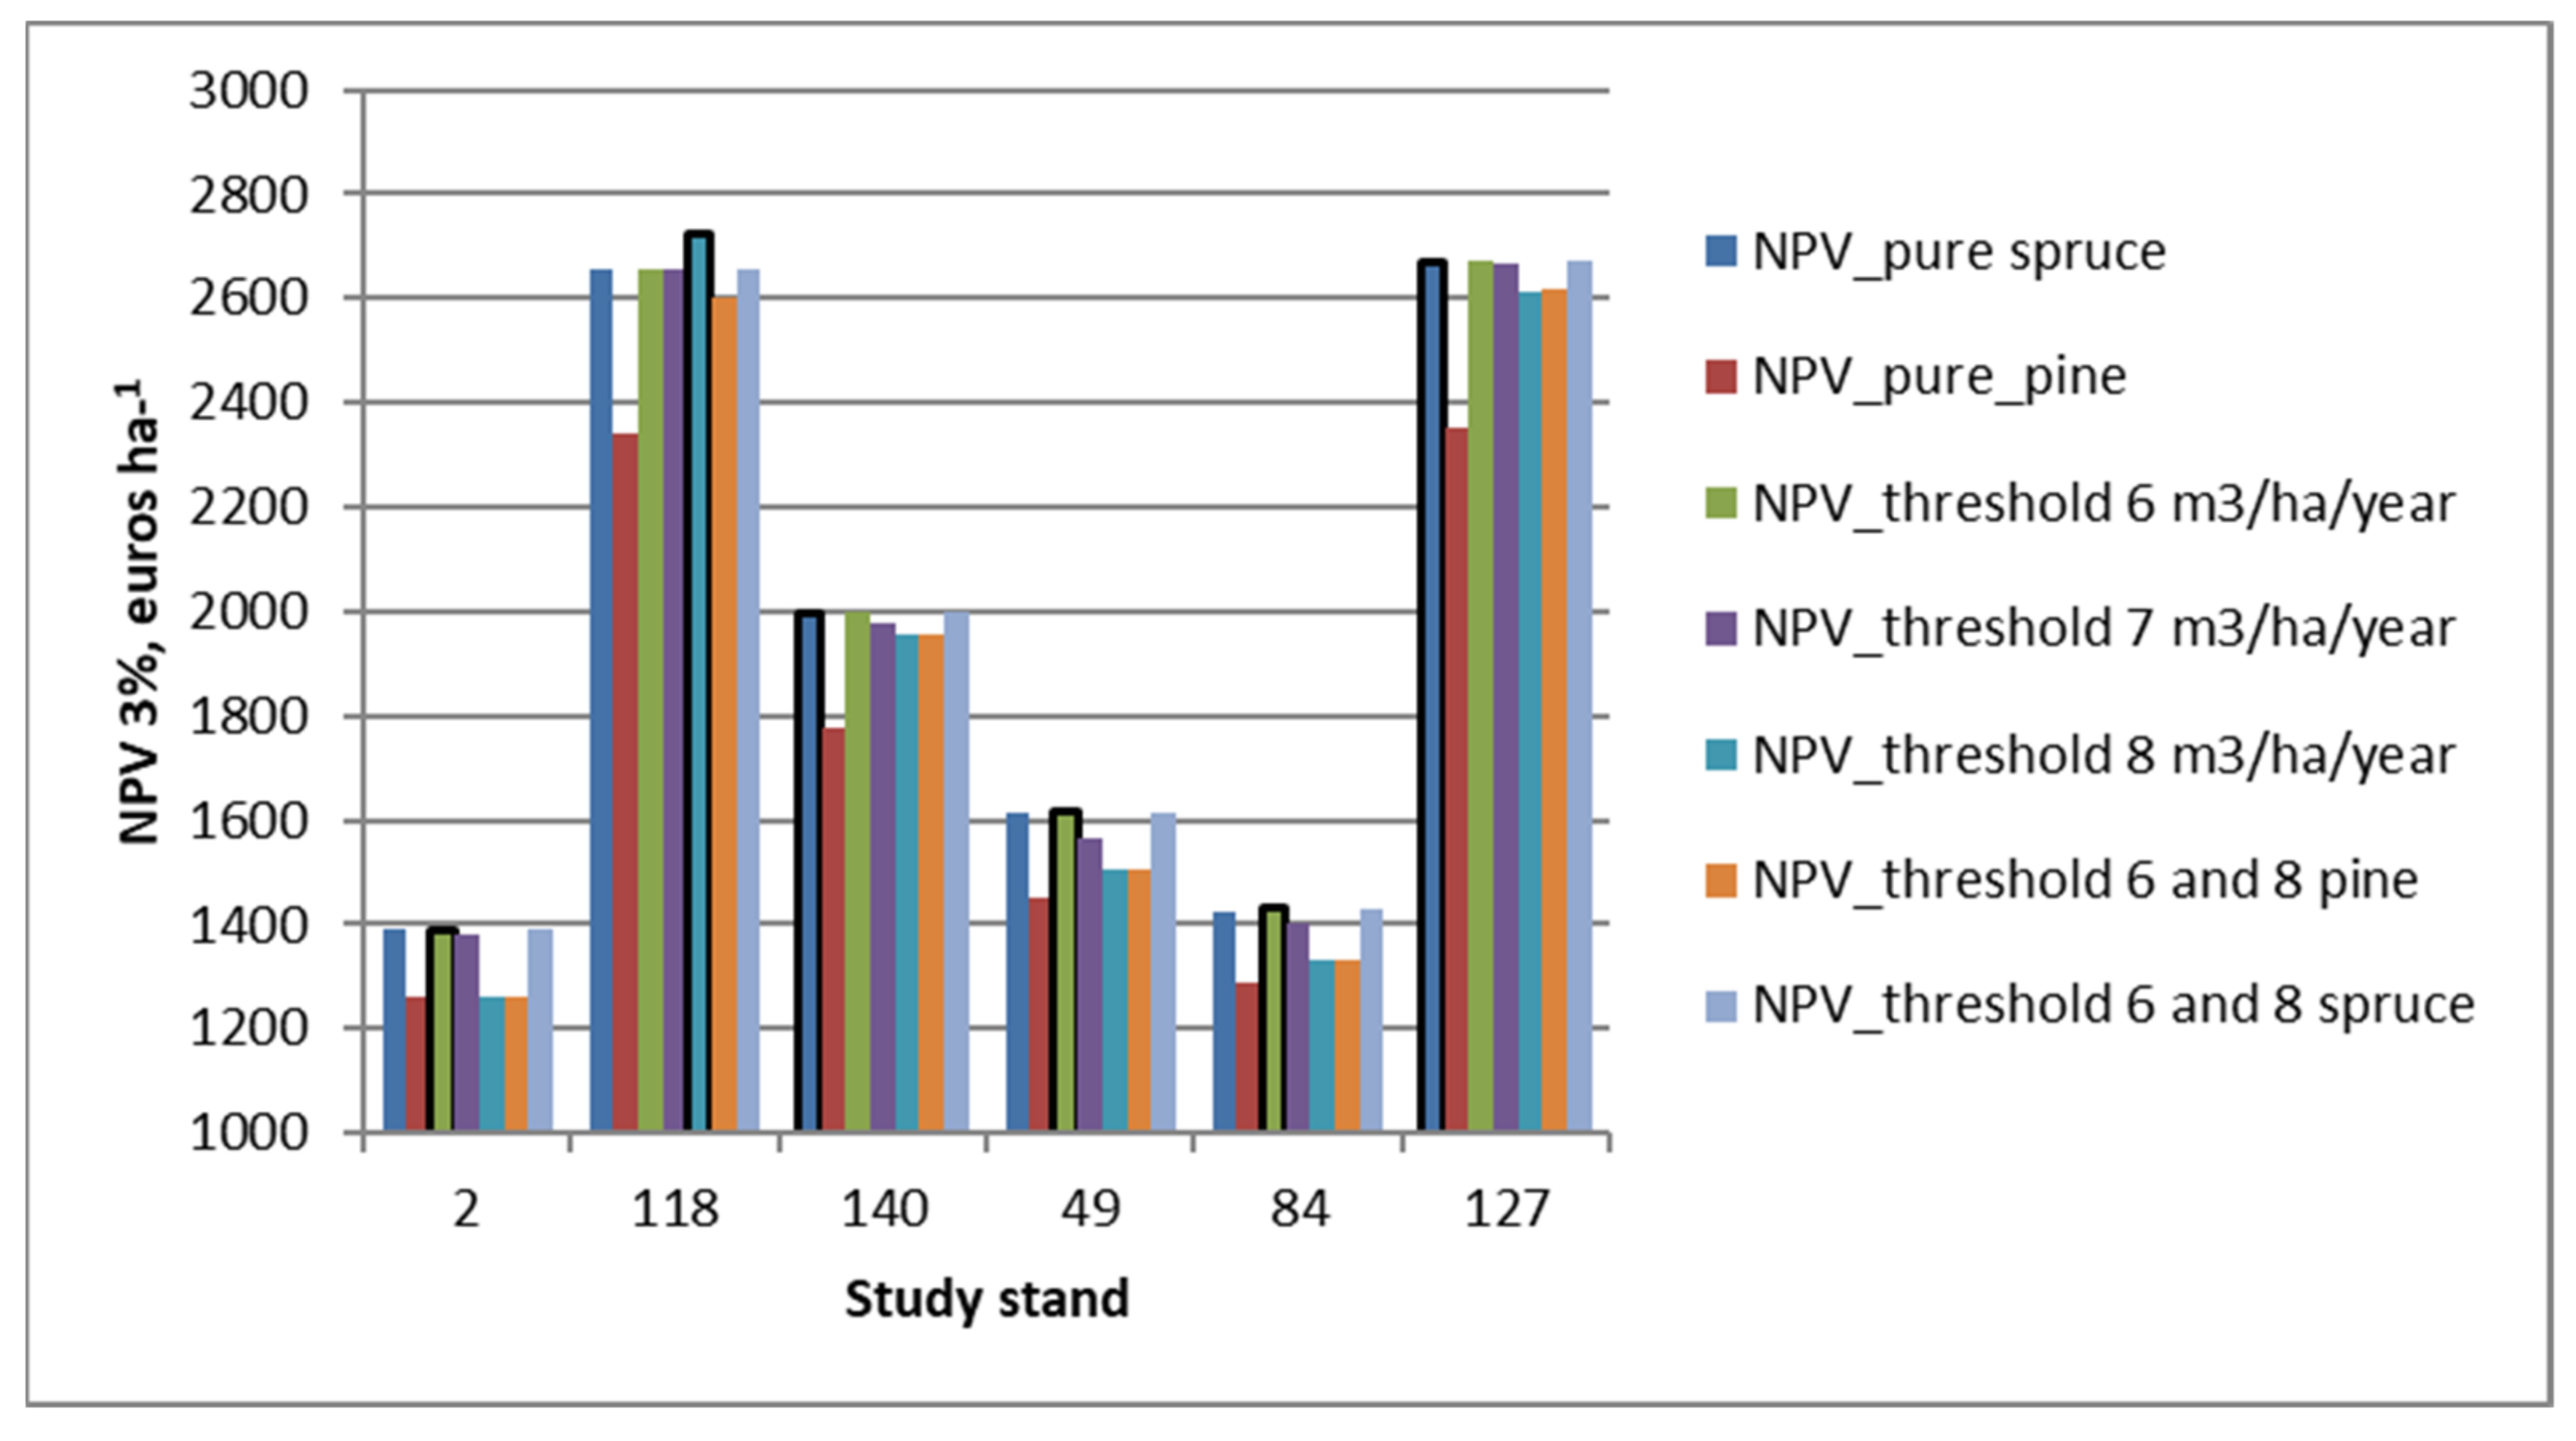
3.2. Economic Effects Related to Micro-Stand-Level Forest Management

In all study stands, the NPV (3%) of pure Norway spruce stands was clearly higher than that of pure Scots pine stands (Figure 3). In four out of six cases, the NPV (3%) of mixed stands (i.e., combinations of micro-stands) was slightly higher than that of pure Norway spruce stands. All these mixed stands were Norway spruce-dominated, and they were treated according to silvicultural guidelines of Norway spruce-dominated stands. In one study stand (no. 118), the NPV (3%) was significantly higher with the option where the stand was planted with two tree species (delineation with a threshold value of 8 m3/ha/year) rather than with one tree species. On the other hand, in all study stands, there existed a mixed stand solution or solutions which gave about the same NPV (3%) as the pure Norway spruce stand.

4. Discussion

A method for creating micro-stands inside a large forest stand at regeneration phase was piloted in this study. The local site index was calculated for each grid cell using harvester data from clear-felling. The calculation was based on the three tallest trees in the harvester data for each grid cell. Study stands were thinned below in earlier intermediate cuttings, so it could be assumed that the height growth of dominant trees over the entire rotation was a good estimate of site quality in terms of site index. In our study, we tried to measure the age of the trees in the field inventory, but it seemed that the ages of stands in forest data were as good estimation as our field measurements. If the age of dominant trees could be detected automatically with an optical device during the felling operation, it might give a more precise estimate of local site index. Image analysis has been used to detect heartwood from a log end during tree harvesting successfully [26], so it might be a solution for measuring the age of trees, too. Additionally, if the position of the harvester’s felling device (harvester head) instead of the base machine’s position could be registered at the time of felling the tree, it would also bring more accuracy to the site index estimation for individual grid cells. There are several ways (sensing technologies) available to solve this problem—see [27]. The distance from GPS to harvester head was 10–12 m at most. In reality, trees cut from the same machine position could have had over 20 m distance and belonged to different grid cells.
Site types in the study stands were mostly classified as the Myrtillus type of the Finnish site type classification [14], which is quite suitable to regenerate both Norway spruce and Scots pine. The estimate of local site index (mean growth within 100 years, m3/ha/year) was used for delineation of micro-stands suitable for Norway spruce or Scots pine planting. The minimum micro-stand area was discussed with experts from practice, and it seemed that the area of a micro-stand can be quite small without causing extra costs in site preparation or planting with varying tree species. In other silvicultural activities as well as in all cuttings, the whole stand was treated with the same operation and method (e.g., same timing of thinning). Thus, the minimum micro-stand size was adjusted in this study to 0.23 ha. Practically, this means, for instance, a 48 × 48 m square. From a biological point of view, this is a feasible solution where at least the middle parts of the micro-stand do not receive border effects from neighboring micro-stands. This is especially important if neighboring micro-stands are planted with tree species with strongly differing growth rates.
Future stand development for Scots pine- and Norway spruce-dominated stands in different forest site types was predicted with the Motti stand simulator. The predictions were based on statistical models which are based on empirical data and are designed to be applied across the country and different sites. In the simulations, the stands were managed according to silvicultural guidelines and dominant tree species. According to earlier research results (e.g., [28]), Motti reliably predicts the development of managed commercial forests. However, growth models always predict the average development of the stand for a given area and site type. Predictions depend on empirical data and their representativeness. Thus, in this study, the most obvious uncertainties related to the simulations were in predicting the development of the Norway spruce stand in less fertile Vaccinium site type. This is due to the shortage of empirical data for models covering the whole fertility variation of the Vaccinium site type. This means that Norway spruce stands are generally growing in the more fertile edge of the Vaccinium site type, whereas Scots pine stands are covering all variations of the Vaccinium type. Thus, the comparability of the predictions for Norway spruce and Scots pine on Vaccinium sites is not as good as on more fertile sites.
Our simulations pointed out that the “precision forestry” option where the forest stand may be planted with two different species is a very promising alternative to the current forest practices. The mixed Norway spruce–Scots pine micro-stand structure never produced a clearly economically inferior solution as compared to the single species stand, and in one case out of six, it provided a distinctly better solution in terms of NPV (3%) than the single species option did.
Through micro-stand structures, we can create one kind of mixed forest inside a larger forest stand. In our case, it was a mixed coniferous stand. It is not mixed in terms of planting to retain trees in an intimate mixture, but rather by retaining a mix of pure patches or patches dominated by each species that together create a mixed stand. Researchers generally agree that in boreal forests, the wood production capacity in pure coniferous forests tend to exceed that of mixed broadleaved–coniferous forests, but a slight mixture of broadleaves does not significantly hinder the growth of conifers [29,30,31]. According to our results, the economical outcome of a mixed Scots pine–Norway spruce stand does not vary considerably from that of a pure Norway spruce stand. However, mixed broadleaved–coniferous forest structures can provide better outcomes than mixed coniferous forests in terms of biodiversity, recreational and aesthetic values, water quality, and uncertainties caused by climate change—e.g., [32,33,34,35].
The relationship between pines and spruces is far less studied than that of mixed broadleaved–coniferous forests. According to [34], mixed pine–spruce forests are not as advantageous as mixed pine–birch or spruce–birch forests in terms of many ecosystem services as the ecology of pines and spruces is far closer than that of birches and conifers. However, forests comprised of two coniferous tree species probably surpass pure stands in terms of wind throw risks, pest and pathogen outbreaks, bilberry production, and hunting-related recreational value. Pure monoculture forests provide a more cost-efficient solution for young stand management and logging operations but, on the other hand, increases the risk of financial returns [34] because the market of single wood species is vulnerable to price fluctuations.
The piloted tree species selection tool could be further developed to adjust planting density and planting material according to the local site index. On the most fertile parts of a regeneration area, it might be worth using more genetically improved planting material with a higher density than on the less fertile parts of the same site. Furthermore, if the existence of root rot could be detected during the felling of the tree it would give valuable additional information for tree species selection.

5. Conclusions

A new approach to utilizing harvester data to determine site productivity variation, delineate micro-stands inside a large forest stand and decide the tree species to plant for each micro-stand was piloted in this study. Most of the micro-stand solutions were feasible for practical forestry; the minimum micro-stand area was 0.23 ha. According to the simulations with the Motti stand simulator, the economic result from the next tree generation was at the same level in micro-stand solutions with mixed Scot pine–Norway spruce as in pure Norway spruce stands. Thus, the “precision forestry” option where the forest stand is planted with two different species is a very promising alternative to the current forest practices.

Author Contributions

Conceptualization, J.U., T.S. and S.H.; field trial, H.L. and E.H.; coding micro-stand delineation tool, S.K.; simulations, S.H.; analysis of results and writing T.S., J.U., S.H. and S.K. All authors have read and agreed to the published version of the manuscript.

Funding

This work was supported by the EU, through the EFFORTE (Efficient forestry by precision planning and management for sustainable environment and cost competitive bio-based industry) project (Grant Agreement Number: 720,712—EFFORTE—H2020-BBI-PPP-2015-02/H2020-BBI-PPP2015-2-1).

Institutional Review Board Statement

Not applicable.

Informed Consent Statement

Not applicable.

Data Availability Statement

Harvester data belongs to Finsilva Oyj.

Acknowledgments

We thank Finsilva Oyj for providing forest stands and harvester data for this case study.

Conflicts of Interest

The authors declare no conflict of interest.

References

  1. Kovacsova, P.; Antalova, M. Precision Forestry—Definition and Technologies. Sumar. List 2010, 134, 603–611. [Google Scholar]
  2. Ackerman, P.A.; Norihiro, J.; Ham, H.; Brewer, J.C. Producing More from Less. Towards optimising value in the bio-economy from data driven decisions. In Proceedings of the 4th Precision Forestry Symposium, Stellenbosch University, Stellenbosch, South Africa, 28 February–2 March 2017. [Google Scholar]
  3. Zhang, N.Q.; Wang, M.H.; Wang, N. Precision agriculture—A worldwide overview. Comput. Electron. Agric. 2002, 36, 113–132. [Google Scholar] [CrossRef]
  4. Georgi, C.; Spengler, D.; Itzerott, S.; Kleinschmit, B. Automatic delineation algorithm for site-specific management zones based on satellite remote sensing data. Precis. Agric. 2018, 19, 684–707. [Google Scholar] [CrossRef] [Green Version]
  5. Tompalski, P.; Coops, N.C.; White, J.C.; Wulder, M.A. Enhancing Forest Growth and Yield Predictions with Airborne Laser Scanning Data: Increasing Spatial Detail and Optimizing Yield Curve Selection through Template Matching. Forests 2016, 7, 255. [Google Scholar] [CrossRef] [Green Version]
  6. Mohamedou, C.; Tokola, T.; Eerikäinen, K. LiDAR-based TWI and terrain attributes in improving parametric predictor for tree growth in southeast Finland. Int. J. Appl. Earth Obs. Geoinf. 2017, 62, 183–191, ISSN 0303-2434. [Google Scholar] [CrossRef]
  7. Packalén, P.; Suvanto, A.; Maltamo, M. A Two Stage Method to Estimate Species-specific Growing Stock. Photogramm. Eng. Remote. Sens. 2009, 75, 1451–1460. [Google Scholar] [CrossRef]
  8. Coops, N.C. Characterizing Forest Growth and Productivity Using Remotely Sensed Data. Curr. For. Rep. 2015, 1, 195–205. [Google Scholar] [CrossRef]
  9. Kukkonen, M.; Kotivuori, E.; Maltamo, M.; Korhonen, L.; Packalen, P. Volumes by tree species can be predicted using photogrammetric UAS data, Sentinel-2 images and prior field measurements. Silva Fenn. 2021, 55. [Google Scholar] [CrossRef]
  10. Söderberg, J. A Method for Using Harvester Data in Airborne Laser Prediction of Forest Variables in Mature Coniferous Stands. Master’s Thesis, Dept. of Forest Resource Management, University of Agricultural Sciences, Umeå, Sweden, 2015. [Google Scholar]
  11. Holmgren, J.; Barth, A.; Larsson, H.; Olsson, H. 2012. Prediction of stem attributes by combining airborne laser scanning and measurements from harvesters. Silva Fenn. 2012, 46, 227–239. [Google Scholar] [CrossRef] [Green Version]
  12. Möller, J.J.; Bhuiyan, N.; Arlinger, J.; Hannarup, B.; Nordström, M. Estimating thinning results based on standardised harvester data. In Proceedings of the 4th Precision Forestry Symposium, Stellenbosch University, Stellenbosch, South Africa, 28 February–2 March 2017. [Google Scholar]
  13. Olivera, A.; Visser, R. Development of forest-yield maps generated from Global Navigation Satellite System (GNSS)-enabled harvester StanForD files: Preliminary concepts. N. Z. J. For. Sci. 2016, 46. [Google Scholar] [CrossRef] [Green Version]
  14. Cajander, A.K. The theory of forest types. Acta For. Fenn. 1926, 29, 108. [Google Scholar] [CrossRef]
  15. Skogforsk. Available online: https://www.skogforsk.se/english/projects/stanford/ (accessed on 15 December 2019).
  16. Varjo, J. Latvan hukkapuun pituusmallit männylle, kuuselle ja koivulle metsurimittausta varten. [Models of top part of pine, spruce and birch for lumberjack measurement]. Puutavaran mittauksen kehittämistutkimuksia 1989–93. Metsäntutkimuslaitoksen Tiedonantoja 1995, 558, 69. [Google Scholar]
  17. Gustavsen, H.G. Talousmetsien kasvupaikkaluokittelu valtapituuden avulla. [Site index curves for conifer stands in Finland]. Folia For. 1980, 454, 1–31. [Google Scholar]
  18. Vuokila, Y.; Väliaho, H. Viljeltyjen havumetsiköiden kasvatusmallit. [Growth and yield models for conifer cultures in Finland]. Commun. Inst. For. Fenn. 1980, 99, 1–48. [Google Scholar]
  19. Salminen, H.; Lehtonen, M.; Hynynen, J. Reusing legacy FORTRAN in the MOTTI growth and yield simulator. Comput. Electron. Agric. 2005, 9, 103–113. [Google Scholar] [CrossRef]
  20. Siipilehto, J.; Ojansuu, R.; Miina, J.; Hynynen, J.; Valkonen, S.; Saksa, T. Metsikön Varhaiskehityksen Kuvaus MOTTI-Ohjelmistossa [Early Development of Young Stands in Motti Software]. Metlan Työraportteja 2014, 286. Available online: http://www.metla.fi/julkaisut/workingpapers/2014/mwp286.pdf (accessed on 15 December 2019). (In Finnish)
  21. Hynynen, J.; Salminen, H.; Ahtikoski, A.; Huuskonen, S.; Ojansuu, R.; Siipilehto, J.; Lehtonen, M.; Eerikäinen, K. Long-term impacts of forest management on biomass supply and forest resource development: A scenario analysis for Finland. Eur. J. For. Res. 2015, 134, 415–431. [Google Scholar] [CrossRef]
  22. Hynynen, J.; Salminen, H.; Ahtikoski, A.; Huuskonen, S.; Ojansuu, R.; Siipilehto, J.; Lehtonen, M.; Rummukainen, A.; Kojola, S.; Eerikäinen, K. Scenario Analysis for the Biomass Supply Potential and the Future Development of Finnish Forest Resources, Working Papers of the Finnish Forest Research Institute 302. Metla 2014. Available online: http://www.metla.fi/julkaisut/workingpapers/2014/mwp302-en.htm (accessed on 15 December 2019).
  23. Hynynen, J.; Ojansuu, R.; Hökkä, H.; Siipilehto, J.; Salminen, H.; Haapala, P. Models for predicting stand development in MELA System. Finn. For. Res. Inst. Res. Pap. 835 2002, 1–116. [Google Scholar]
  24. Huuskonen, S.; Haikarainen, S.; Sauvula-Seppälä, T.; Salminen, H.; Lehtonen, M.; Siipilehto, J.; Ahtikoski, A.; Korhonen, K.T.; Hynynen, J. Benefits of juvenile stand management in Finland—Impacts on wood production based on scenario analysis. For. Int. J. For. Res. 2020, 93, 458–470. [Google Scholar] [CrossRef]
  25. Luke. Available online: https://statdb.luke.fi/PXWeb/pxweb/fi/LUKE/ (accessed on 15 December 2019).
  26. Raatevaara, A.; Korpunen, H.; Tiitta, M.; Tomppo, L.; Kulju, S.; Antikainen, J.; Uusitalo, J. Electrical impedance and image analysis methods in detecting and measuring Scots pine heartwood from a log end during tree harvesting. Comput. Electron. Agric. 2020, 177. [Google Scholar] [CrossRef]
  27. Lindroos, O.; Ringdahl, O.; La Hera, P.; Hohnloser, P.; Hellström, T. Estimating the Position of the Harvester Head—A Key Step towards the Precision Forestry of the Future? Croat. J. For. Eng. 2015, 36, 147–167. [Google Scholar]
  28. Mäkinen, H.; Hynynen, J.; Isomäki, A. Intensive management of Scots pine stands in southern Finland: First empirical results and simulated further development. For. Ecol. Manag. 2005, 215, 37–50. [Google Scholar] [CrossRef]
  29. Frivold, L.H.; Frank, J. Growth of mixed birch-coniferous stands in relation to pure coniferous stands at similar sites in south-eastern Norway. Scand. J. For. Res. 2002, 17, 139–149. [Google Scholar] [CrossRef]
  30. Hynynen, J.; Repola, J.; Mielikäinen, K. The effects of species mixture on the growth and yield of mid-rotation mixed stands of Scots pine and silver birch. For. Ecol. Manag. 2011, 262, 1174–1183. [Google Scholar] [CrossRef]
  31. Huuskonen, S.; Domisch, T.; Finér, L.; Hantula, J.; Hynynen, J.; Matala, J.; Miina, J.; Neuvonen, S.; Nevalainen, S.; Niemistö, P.; et al. What is the potential for replacing monocultures with mixed-species stands to enhance ecosystem services in boreal forests in Fennoscandia? For. Ecol. Manag. 2021, 479, 21. [Google Scholar] [CrossRef]
  32. Paquette, A.; Messier, C. The effect of biodiversity on tree productivity: From temperate to boreal forests. Glob. Ecol. Biogeogr. 2011, 20, 170–180. [Google Scholar] [CrossRef] [Green Version]
  33. Gamfeldt, L.; Snäll, T.; Bagchi, R.; Jonsson, M.; Gustafsson, L.; Kjellander, P.; Ruiz-Jaen, M.C.; Fröberg, M.; Stendahl, J.; Philipson, C.D.; et al. Higher levels of multiple ecosystem services are found in forests with more tree species. Nat. Commun. 2013, 4, 1340. [Google Scholar] [CrossRef] [PubMed]
  34. Felton, A.; Nilsson, U.; Sonesson, J.; Felton, A.M.; Roberge, J.-M.; Ranius, T.; Ahlström, M.; Bergh, J.; Björkman, C.; Boberg, J.; et al. Replacing monocultures with mixed-species stands: Ecosystem service implications of two production forest alternatives in Sweden. Ambio 2016, 45, 124–139. [Google Scholar] [CrossRef] [Green Version]
  35. Mina, M.; Huber, M.O.; Forrester, D.I.; Thüring, E.; Rohner, B. Multiple factors modulate tree growth complementarity in Central European mixed forests. J. Ecol. 2018, 106, 1106–1119. [Google Scholar] [CrossRef]
Figure 1. Maps of mean annual volume growth (m3/ha/year) in study stand no. 49, estimated by the past growth of Norway spruce (left), Scots pine (middle) and combination with the maximum value of Norway spruce or Scots pine (right). The estimated growth (average of 9 neighboring grid cells) varied from 3 to 14 m3/ha/year in the case stands.
Forests 12 01329 g001
Figure 2. Visualization of micro-stands in study stand no. 49 categorized with single threshold values of 6 (A), 7 (B) and 8 m3/ha/year (C) and double threshold values of 6 and 8 m3/ha/year (D). (AC): Category 1 = Scots pine, 2 = Norway spruce, (D): 1 = Scots pine, 2 = Scots pine or Norway spruce and 3 = Norway spruce.
Forests 12 01329 g002
Figure 3. NPVs (3%) with seven different micro-stand options in the study stands. The highest bar has bolded frames. Study stands were arranged in ascending order by area.
Forests 12 01329 g003
Table 1. Stand volumes by tree species in the study stands at time of cutting.
Stand Characteristics
Study Stand No.Area,
(ha)
Main Site TypeMean Age (year)Scots Pine,
(m3/ha)
Norway,
Spruce (m3/ha)
Birch,
(m3/ha)
Total,
(m3/ha)
21.3MT *9114211218272
1181.7MT679312131245
1405.1VT **601215325199
499.8MT786510612183
8412.8MT6511211118241
12723.3MT651821138303
* Myrtillus site type, ** Vaccinium site type.
Publisher’s Note: MDPI stays neutral with regard to jurisdictional claims in published maps and institutional affiliations.

