1. Introduction
As a reaction to recent and anticipated future declines in species populations, and following a general concern about ecosystem health, attempts to restore (parts of) ecosystems are increasingly common [
1,
2]. The main aim of restoration is to recover a self-sustaining ecosystem which is resilient to normal stress and disturbance levels and interacts with contiguous ecosystems [
3]. The SER International Primer on Ecological Restoration [
3] provides nine attributes to determine if restoration has been accomplished successfully, but what is not mentioned is that the initial state of the sites chosen for restoration may determine how fast and perhaps also if restoration goals will be, or are, accomplished. It is unequivocal that a site near the desired state will reach a restored ecosystem state more quickly than a site that is not. When the aim is to reintroduce and preserve a specialist species, the target species’ ecological requirements are central to the selection of restoration sites. However, a stakeholder may have several motivations for choosing a site, including ecological, logistic, and economic.
Although several papers have examined how to select sites for restoration based on ecological factors [
4,
5], little attention has been paid to whether site selection has followed ecological criteria and how this affects restoration success. Insights into how restoration sites were selected can be gained either through studying the action plan or evaluation plan or from conversations with people that were involved in the project [
6,
7]. However, conclusions drawn from such studies are only reliable to a limited extent, in part because there is a tendency to overestimate ecological results if collaboration and organization worked well [
8]. Further evaluation of whether the ecologically best sites were chosen for restoration and whether restoration has been, or will be, accomplished can be achieved through on-the-ground monitoring of the sites before and during restoration. Unfortunately, such evaluations are often incomplete, unavailable, or nonexistent [
9,
10]. Additionally, it is not always logistically feasible to conduct field studies that yield accurate and sufficient data on the habitat composition and structure of sites selected for restoration and the surrounding area.
Although the white-backed woodpecker (WBW,
Dendrocopos leucotos B.) is globally of ‘least concern,’ the population is in decline [
11], and in Sweden its status is ‘critically endangered’ [
12]. Since the beginning of the 20th century, its distribution range in Sweden has decreased by over 90%. This loss has been attributed to forestry practices that have reduced deciduous woodland and old and dead trees, and subsequently the WBW’s main food source: wood-boring and bark-living insects [
12,
13,
14]. Efforts to restore the WBW population were initiated in the 1970s by the Swedish University of Agricultural Sciences, followed by the Swedish Society for Nature Conservation. National coordination was formalized through an advisory action plan for the WBW, adopted in 2005, where public and private actors (the Swedish Environmental Protection Agency, county administrative boards, NGOs, forest companies, and landowners) work together [
15]. Private companies have undertaken most of the WBW habitat restoration, and in 1993 a large forest company committed to setting aside and restoring 10,000 ha of forest [
15]. Also, in other countries in the region, conservation efforts are targeted at the WBW where efforts consist of protecting the remaining breeding sites, providing food during the winter, and managing protected areas specifically for the WBW [
16,
17]. Adopted management strategies have included (1) the removal of spruce to create well-lit deciduous forest habitat, and (2) the creation of decaying and dead birch wood [
16]. These management strategies are, however, not always effective [
17].
The habitat requirements for the WBW comprise old-growth deciduous forests with plentiful dead and decaying wood [
15,
18]. In Sweden, it is estimated that a pair of WBWs needs 50 to 100 ha of deciduous forest to survive [
13] and 10 to 20 m
3 ha
−1 of dead deciduous wood [
18]. Furthermore, 10% to 17% of a forested landscape (tens of km
2) needs to be suitable habitat [
19]. This means that a pair of woodpeckers requires at least 50 ha of deciduous forest within a 294 to 500 ha area of forested landscape (50 ha is 10% of 500 ha and 17% of 294 ha) to survive. However, the goal in the project plan was to have 100 ha with a high proportion of deciduous trees (> 75%) within 500 ha of forest [
15].
Because the WBW is extremely rare in Sweden (there was only one breeding pair in the country in 2013 [
20] and three or four in 2016 [
21]), considerations for the regions where sites might be restored were based upon the presence of relatively high amounts of deciduous forest compared to other parts of Sweden, so sites that were already relatively close to ideal. WBW had been released in Sweden since the 1990s already [
21], so restored sites could serve as new release sites. Restoration was thus focused on the counties of Värmland and Dalsland in southwestern Sweden because they were seen as the most ecologically promising to be able to contain a healthy population of WBW in the relatively near future [
15]. We assumed that the best way to protect the WBW is to choose sites for restoration that are close to ideal ecological conditions, so that sites might reach ideal conditions more quickly and not take years or decades, which may be too late for protecting the WBW. So, if site selection within these counties was solely based on the species’ ecological requirements, then selected restoration sites would contain more deciduous trees and more older trees than the surrounding landscape. Furthermore, one would expect that restoration should remove coniferous trees, create less dense forests with plenty of dead deciduous wood (both standing and lying), and that it should match a scale relevant to the WBW.
Our study addresses the issue of whether site selection meets ecological criteria by using a case study to determine whether site selection for the restoration of a locally red-listed species, the WBW, was based on its habitat needs. We focused on a large, long-running restoration effort in Sweden that aims to restore forest ecosystems that have long since been intensively managed and are now dominated by relatively young and dense stands of Scots pine (
Pinus sylvestris L.) and Norway spruce (
Picea abies L.) that have little amounts of dead wood [
22]. The aim of the restoration is to allow re-colonization of a healthy population of WBW. Bell et al. [
23] previously collected environmental data from nine restoration sites restored as part of this project as well as from nine nearby commercially managed reference sites. They found that the restored sites contained larger volumes of coarse, woody debris than commercially managed forests. Furthermore, the majority of man-made snags and downed logs were birch (
Betula spp.) and most spruce trees were removed, which led to less dense stands dominated by broadleaved trees. We used forest inventory data to evaluate the ecological appropriateness of a large number of restoration sites, which were selected by a forest company for restoration targeted at the WBW. We assessed (1) the current suitability of the region for the WBW, (2) whether restoration sites contained older trees and more deciduous trees than the surrounding landscape before restoration, (3) the progress that had been made in creating a less dense forest that is less dominated by coniferous trees, and (4) whether the restoration occurred at a scale appropriate for the WBW. In parallel with this study and to contextualize the results, we interviewed people involved in the WBW restoration efforts on site in Värmland in September 2013. The seven interviewees were key individuals involved in the WBW work (one forest owner and representatives of two forest companies, the county administrative board and the Swedish Forest Agency).
2. Materials and Methods
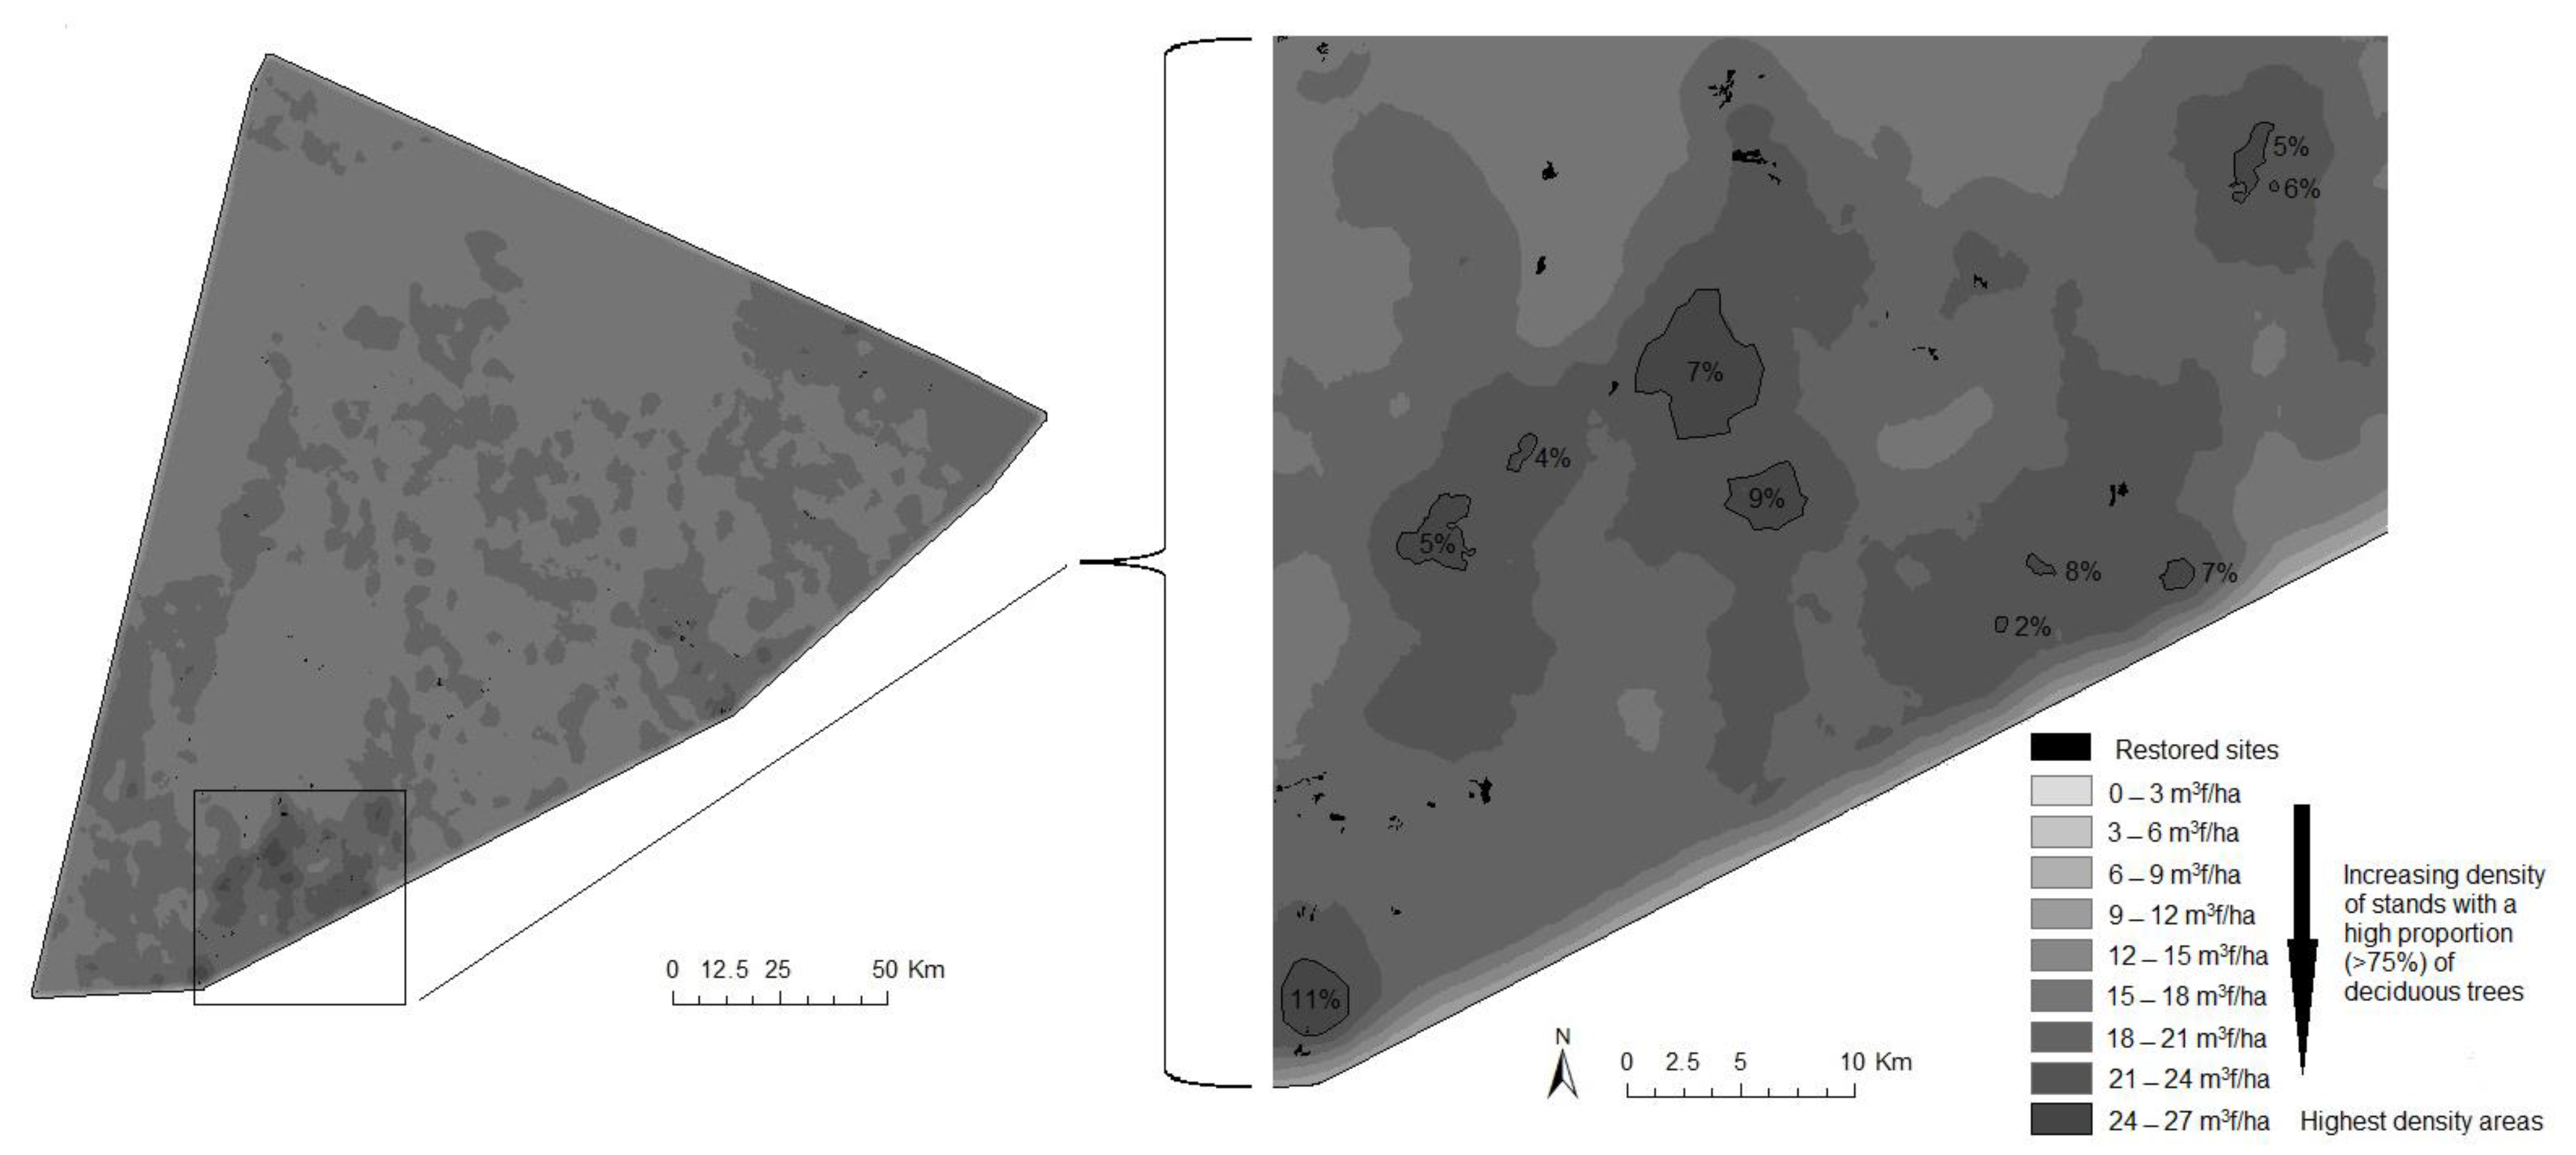
We obtained locations of forest stands restored for WBWs in the county of Värmland from one of the Swedish forest companies involved in WBW restoration, a company which is the main restoration actor in this county (
Figure 1) [
15]. Unfortunately, we were unable to obtain locations of restored stands not managed by this forest company. Therefore, our study focused solely on whether ecological criteria for stand selection were met by this forest company. The forest company identified a total of 595 stands (~2300 ha) that were restored between 1995 and 2011. Because forest inventory data were only available for the years 2000, 2005, and 2010, the forest composition analyses were based on the 405 sites that were restored between 2001 and 2009
(~1530 ha).
Many of the stands were directly adjacent to, or very close to, another stand, and approximately one third of the stands were <0.001 ha (10 m
2) and connected to or encompassed by a larger stand. These ‘slivers’ were probably caused by location corrections or additions to previously restored stands by the forest company. Therefore, we aggregated these stands for the forest composition analyses using ArcGIS 10. Determination of which stands were aggregated were based on numbers presented by Aulén [
11] and Carlson [
19], from which we concluded that a pair of WBWs needs approximately 50 ha of deciduous forest within a 500 ha area of forested landscape (i.e., 10% deciduous forest within a forested landscape) to survive. Using the radius of a 500 ha circle (~1.26 km), we created a buffer zone of 1.26 km around each of the restored stands to represent the forested landscape required by a pair of WBWs. When a restored stand was situated within the buffer zone of one or more other restored stands, these stands were aggregated. This resulted in 63 groups of aggregated stands, encompassing all 405 sites that were restored between 2001 and 2009. Henceforth, we called these groups ‘restoration sites’ or ‘restored sites’, depending on if they were pre-restoration or post-restoration. We also amalgamated the buffer zones around the stands so that each restored site had an accompanying buffer zone of 1.26 km in width. In total, 89% of the land within these buffer zones was classified as ‘tree cover’ by the Global Land Cover 2000 Project (GLC 2000), of which 45% was owned by the forest company (data were obtained from the forest company) and 8% was protected area with various levels of conservation and protection.
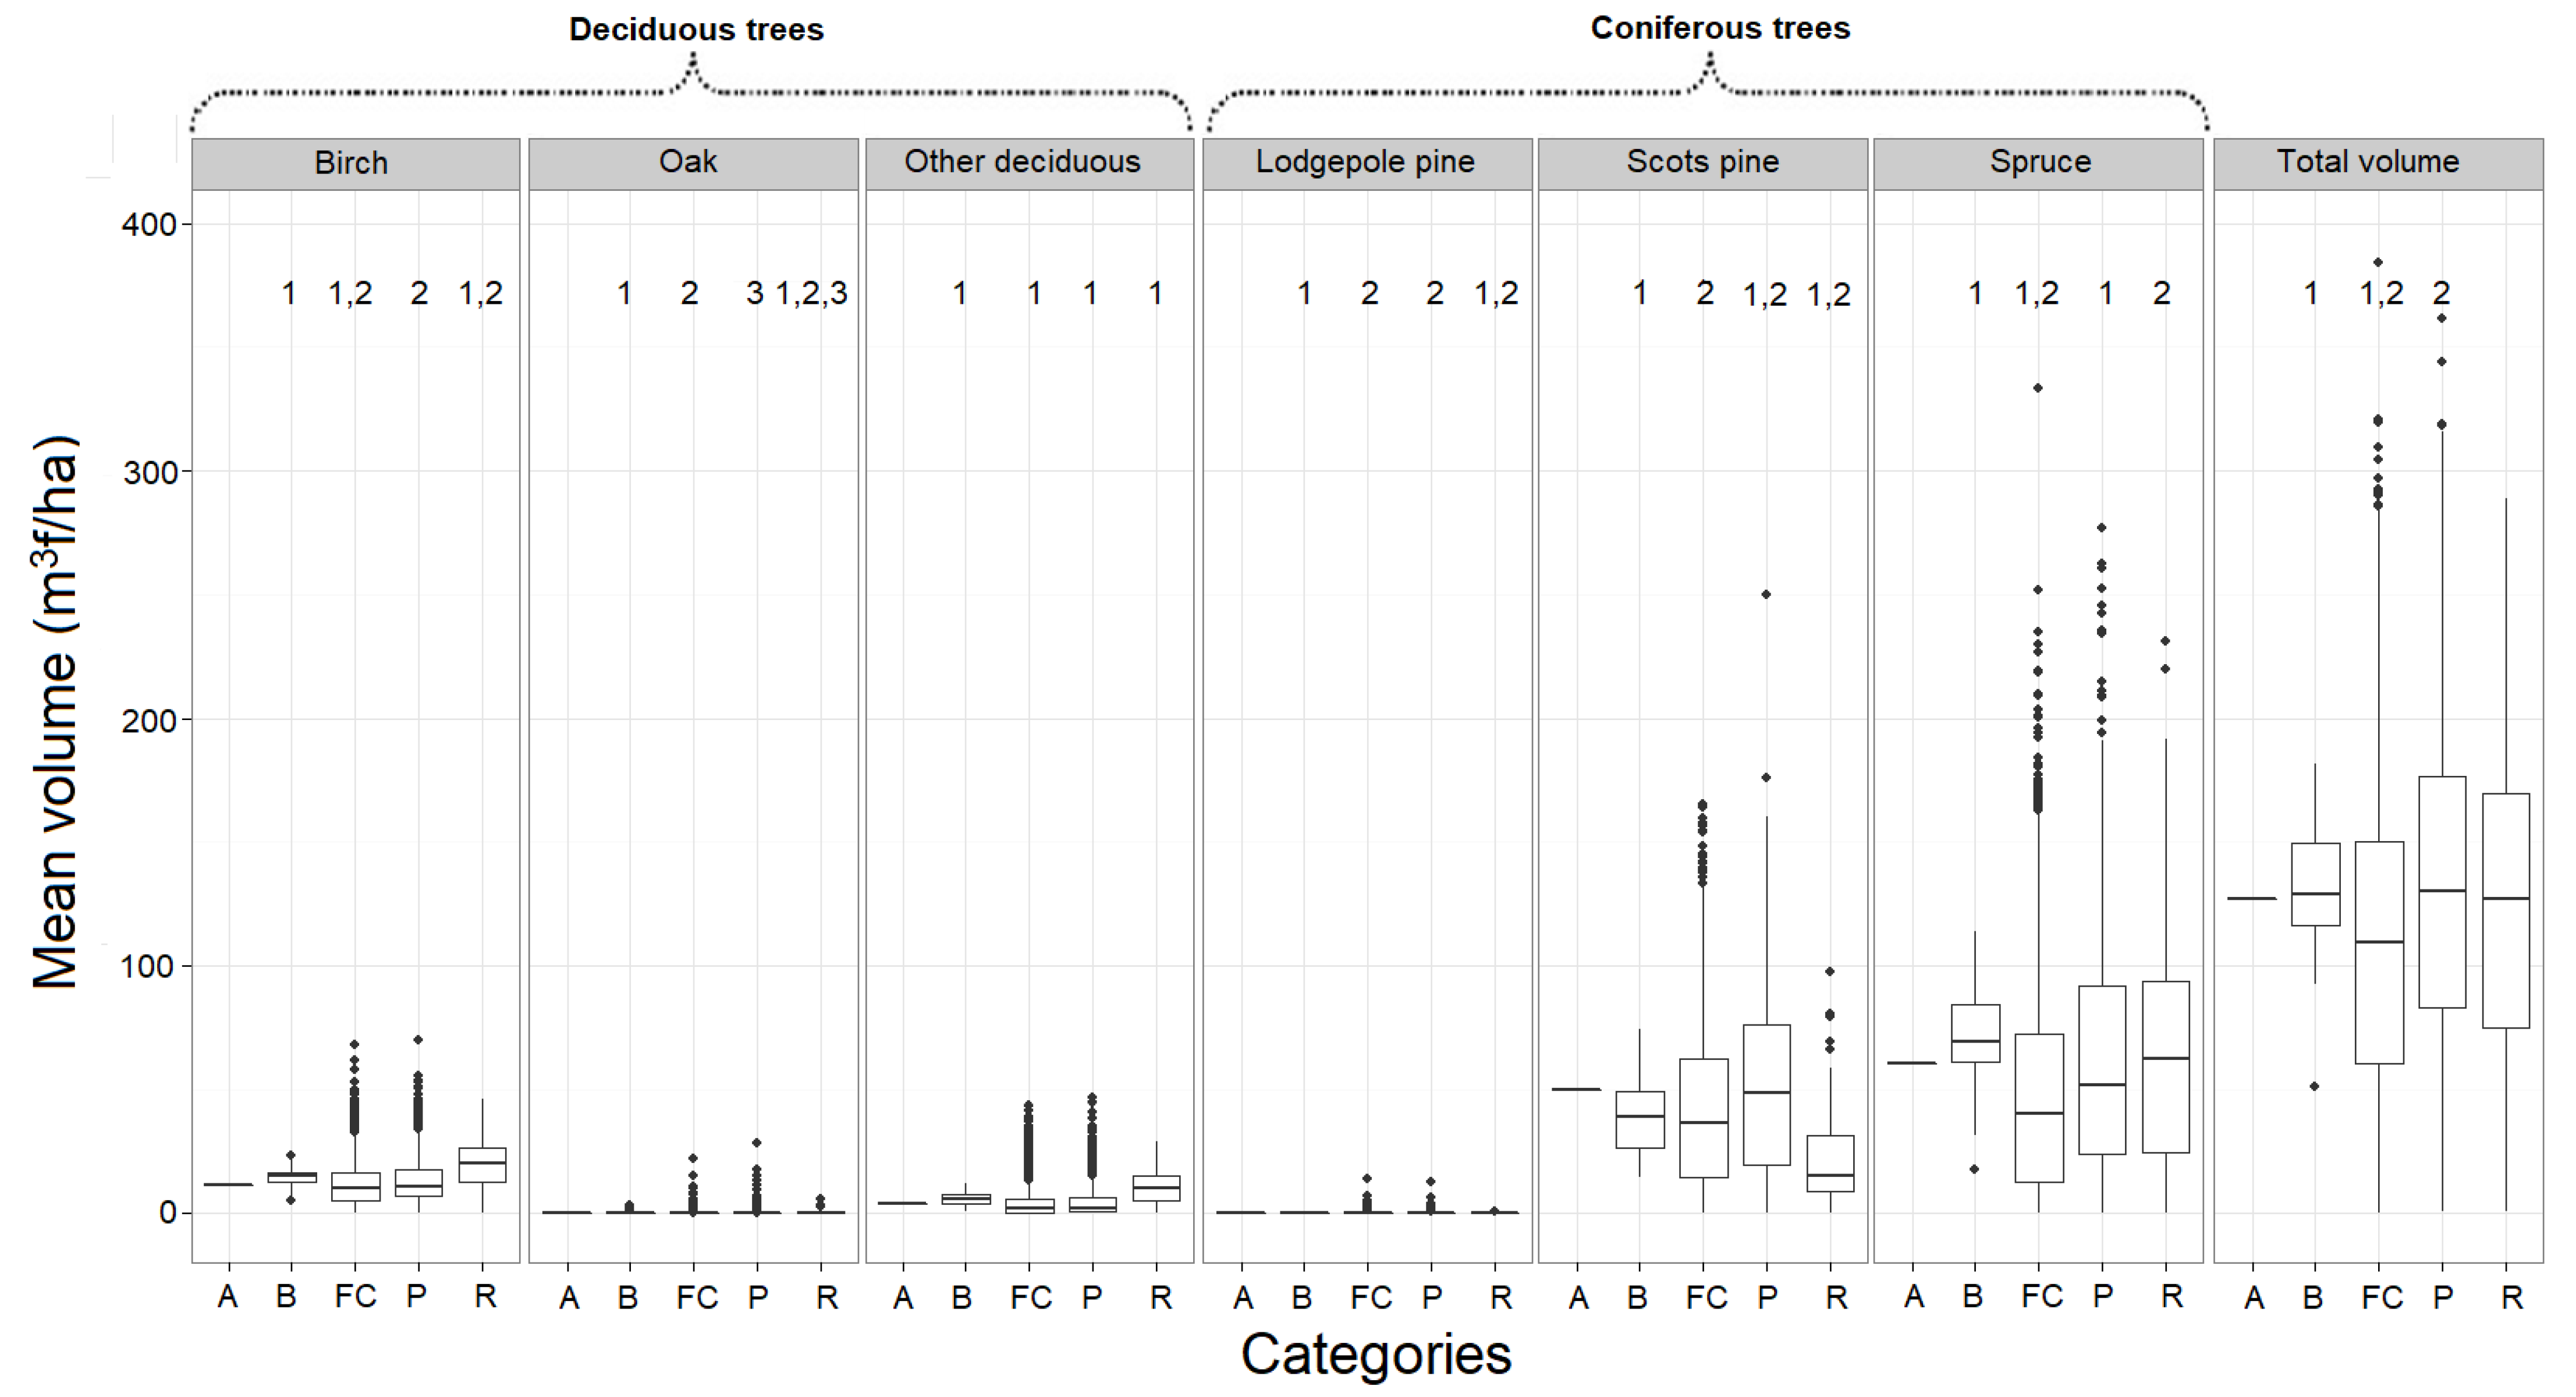
For the analyses we created five different geographic categories: first, the restored sites (category 1: R (
Table 1)) and their accompanying buffer zones (category 2: B) as described above. We created a convex hull polygon enveloping all restored sites to geographically define the study region (category 3: A). In order to compare the forest composition of stands selected for restoration with those not selected for restoration, we obtained data from the forest company on the location of all the land they owned in the study region. This land defines category 4 (FC). Additionally, to gauge the current suitability of already established protected areas (category 5: P) in the study region for the WBW, we obtained data on their locations from the World Database on Protected Areas (WDPA:
http://www.wdpa.org/, updated annually, accessed on 1 February 2013). Category 5 is defined by all land in the study region classified by the WDPA as protected, excluding ‘natural landmarks’ as they consisted of lone trees, boulders, etc. (
Table 1).
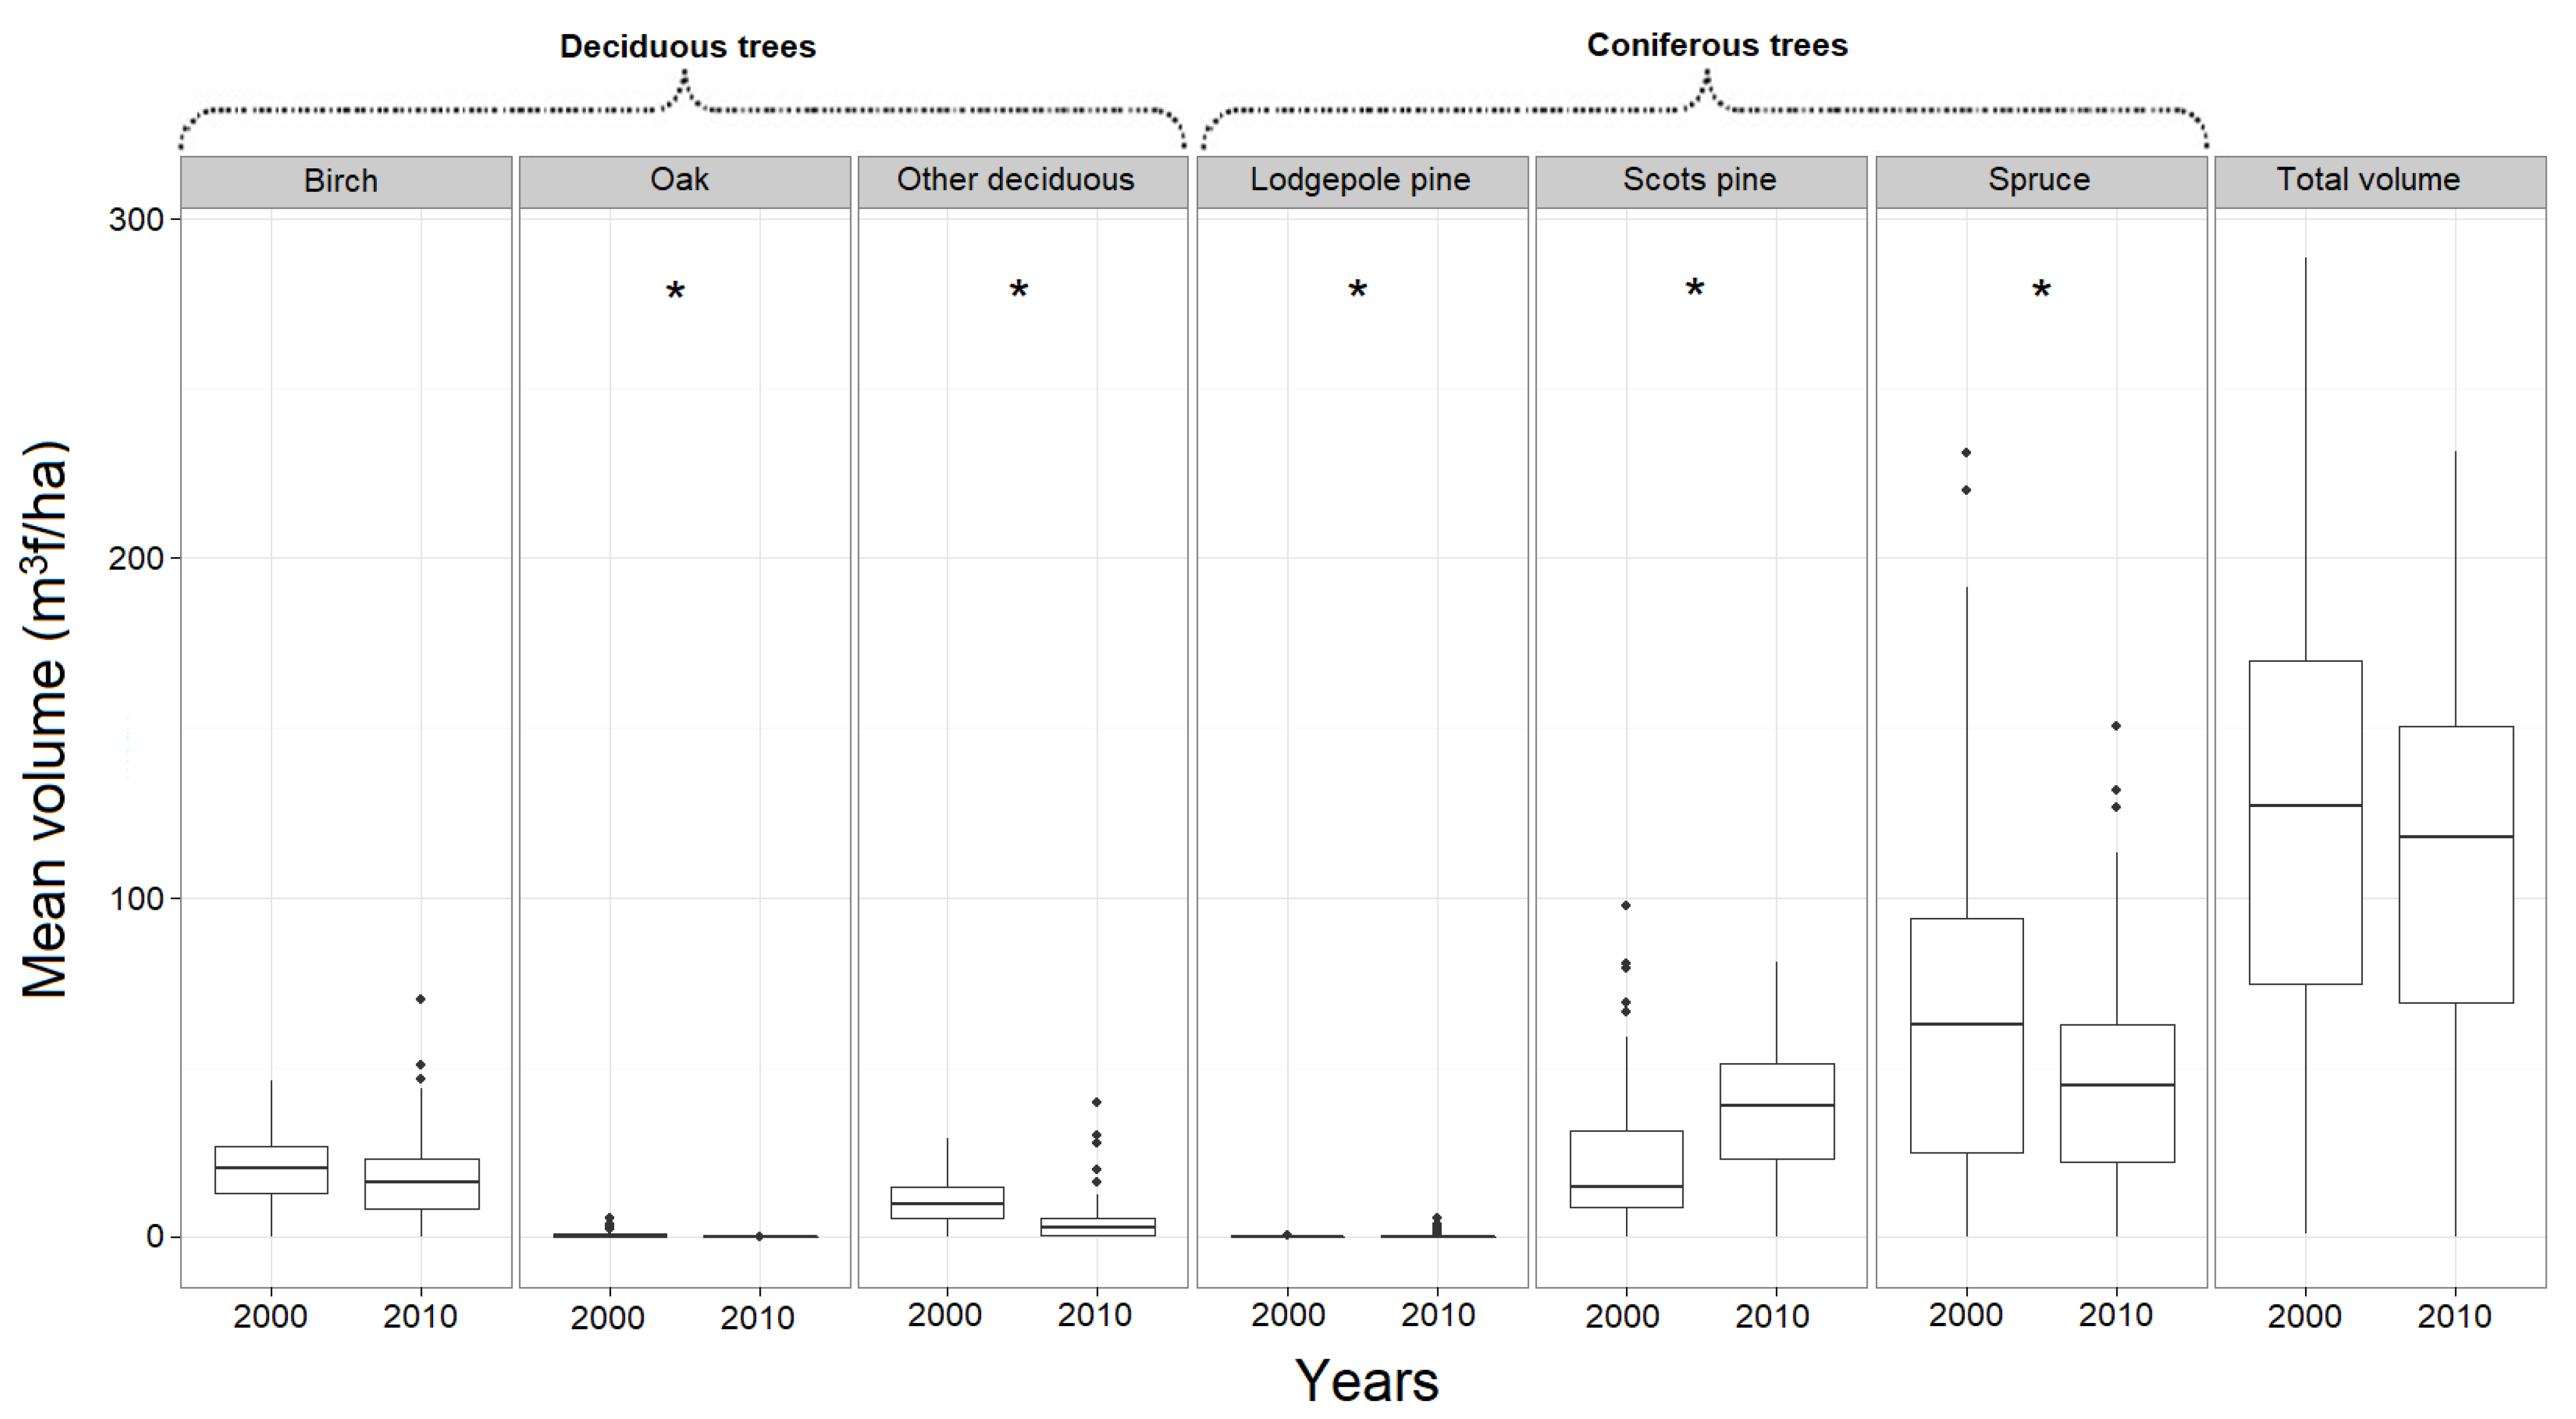
We used forest inventory data from 2000 and 2010 to determine whether restoration sites contained older trees and more deciduous trees than the surrounding landscape before restoration (2000) and whether restoration sites had lower tree densities and were less dominated by coniferous trees after restoration (2010). These forest data were obtained from the Swedish forestry inventory conducted by the Department of Forest Resource Management of the Swedish University of Agricultural Sciences (
http://skogskarta.slu.se, accessed 1 February 2013). The datasets contain information on age and biomass of common tree species at a 25 × 25 m resolution. The data used were the mean ages of all living tree species and the volume of individual living tree species: European beech (
Fagus sylvatica L.), lodgepole pine (
Pinus contorta Douglas ex Loudon), Norway spruce (denoted as ‘spruce’), pedunculate oak (
Quercus robur L. denoted as ‘oak’), Scots pine, silver birch (
Betula pendula Roth, denoted as ‘birch’), and of ‘other deciduous trees’ (e.g., common alder (
Alnus glutinosa L.) and Eurasian aspen (
Populus tremula L.)). Unfortunately, data on the volume of dead deciduous wood present were not available on a detailed scale and could thus not be taken into account. Means of tree ages were calculated for each restored site, buffer zone, forested area owned by the forest company, protected area, and for the entire study region.
To determine whether the restoration occurred at a scale appropriate for the WBW we assessed if, in the study region, there were areas in which a 100 ha area (i.e., 20%) of a 500 ha forest had a high percentage of deciduous trees (>75%), a goal set by the project plan [
13]. To assess whether this was accomplished or not, we overlayed the study region with a 500 × 500 ha grid and counted all the grid cells in which this criterium was fulfilled. Further, we made a density map showing the percentage of deciduous trees in each 25 × 25 m grid to visualize areas with a high proportion of deciduous trees in the study region. In addition, we measured the size of restored sites and assessed the proximity to one another; a few large, or many small, restored sites that are near each other may, together, reach the required 100 ha containing a high percentage of deciduous trees within a 500 ha forest.
ArcGIS 10 was used for data organization and for the analyses. Statistical analyses were performed in R 3.5.0 [
24]; paired t-tests were used to compare each restoration site with its respective buffer and restoration sites at two different time periods. Welch t-tests were used to study differences between other categories, for example between restored sites and protected areas.
4. Discussion
In our case study, the ecologically best sites for restoration, meaning those sites that are likely to reach ideal conditions for the WBW the fastest, should (1) contain older and more deciduous trees than the surrounding landscape at the start of the project, and (2) be at a scale relevant for the WBW. Furthermore, restored sites should have lower tree density and be less dominated by coniferous trees after restoration if they are to sustain a healthy population of WBW. We found that, instead of being older, the stands in restoration sites were younger than in their accompanying buffer zones, the protected areas, and the study region as a whole, in addition to many other stands owned by the forest company. Although data on the average age per tree species were not available, the higher average age in non-restored sites was likely caused by old spruce and Scots pine trees (nearly) ready for harvesting. Because the elimination of coniferous trees may be beneficial to the WBW, it might have been advantageous to also restore some of these older sites because the forest company would make a profit, which could help pay for restoration practices. However, the average volume of all deciduous species was higher in the restored sites than in other areas owned by the forest company before restoration, but there were a number of areas with high average volumes of deciduous trees in sites owned by the forest company that were not selected for restoration. The interviews we conducted revealed that the motive of the company to take part in the WBW habitat restoration was to improve the company’s environmental profile; the WBW would make their environmental efforts more concrete and ‘marketable’. The company ecologist suggested in the interviews setting aside one hundred areas consisting of 100 ha each, a figure that was easy to market and showed that the company was serious about the campaign, for fifty years through voluntary nature protection agreements with the Swedish Forest Agency. The interviews further revealed that the sites were chosen primarily to ensure connectivity with former WBW habitats, and this geographical focus meant that the sites were mostly dominated by spruce. This plan was not successful because moose (Alces alces L.) ate the new shoots and because the restoration measures were not always conducted properly by the entrepreneurs, according to the interviews.
Prior to restoration, a considerable proportion of the restored sites had lower volumes of deciduous tree species than their buffer zones. Only about half of the land in the buffer zones was owned by the forest company, suggesting that coordination between different landowners might be advantageous in order to avoid fragmentation of suitable habitat. Unfortunately, detailed data on the volume of dead deciduous wood were not available; because the availability of ample dead deciduous wood (10 to 20 m
3 ha
−1 [
14]) is an important requirement for the WBW, the lack of these data may have affected the analyses to some extent. However, the average initial levels of dead deciduous wood were 0.9 m
3 ha
−1 [
25] in Värmland, the county in which the study region was located, and 1.8 m
3 ha
−1 [
25] in the whole of Sweden. Even if the initial levels of dead deciduous wood were locally higher than the average, we think it likely that initial levels were not high enough to meet the 10 to 20 m
3 ha
−1 [
18] required by the WBW. We therefore do not think site selection was driven by the initial level of dead deciduous wood, especially since the main objective of the restoration project was the creation of high levels of dead wood [
15], which can be realized relatively easy and quick [
26]. We therefore think that the potential effect on the analyses remains low.
In terms of creating less dense forest and eliminating coniferous trees to create forest dominated by deciduous trees, it appears that not much progress has been made during the course of the study. This lack of progress was confirmed in an interview with a forest company representative. It was also corroborated by a study from Blicharska et al. [
27] who, amongst others, conducted interviews with actors involved in the WBW restoration in Sweden. Their findings revealed that the achievement of the targets set in the action plan was, during 2005–2008, much lower than planned. This was partly explained by lack of knowledge, data, experienced workers, and administrative flexibility [
27]. However, the possible regeneration of deciduous trees after restoration has not been accounted for in our study since we used forest inventory data. Observations on site should take place to inventory saplings of deciduous trees. Interviews we conducted, however, also revealed that moose ate the new shoots, so regeneration of deciduous trees likely remained low. A study by Hämäläinen et al. [
17] on how to maintain deciduous trees in territories of WBW found that in eastern Finland, the removal of spruce did benefit the regeneration of aspen, but not of birch. They therefore concluded that additional measures targeted at benefitting birch may be needed if we are to have successful populations of WBW [
17].
The total volume of standing wood did not significantly change over the years, even though some restored sites were clear-cut. In addition, the volume of both pine species significantly increased rather than decreased. The proportion of spruce did decrease, but only by eight percentage points. This can be explained by the forest company’s lack of focus on the restoration during the time period studied because the land containing restoration sites was sold in 2004. As per the interviews, once a new forest company took over, the work was slowed further, as it had to start anew in organizing its environmental work. We can only speculate about whether there were additional unspoken reasons, such as logistical problems or that the coniferous trees that needed to be removed had not yet reached the age at which they are economically suitable for harvesting, that contributed to the lack of restoration results. Modelling studies reveal that set goals may, however, be reached if appropriate management strategies are chosen, the continuity of the management is safeguarded, and the scale of management is appropriate [
26,
28].
Based on forest inventory data in 2010, not enough suitable forest is available for the WBW to sustain a healthy population in the study region. The aim stipulated in the project plan for the WBW was to have 100 ha of forest with a high percentage of deciduous trees (> 75%) per 500 ha [
13]. We were unable to identify a forested landscape (500 ha) with such a large area of stands with a high proportion of deciduous trees based on the forest inventory data. There were a number of landscapes with about 50 suitable hectares, which may be sufficient to sustain a pair of WBWs according to Aulén [
13] and Carlson [
19]. However, more restored sites are needed to sustain a healthy population of WBWs. For example, common management practices, such as thinning and clear-cutting, are ongoing in the immediate surroundings of many of the restored sites. It is conceivable that restored sites might become isolated islands. Restoring at an inappropriate scale may be a waste of time, effort, and economic resources when the habitat requirements of the species are not met. The forest company’s plan was to connect former WBW habitats by corridors. Unfortunately, as stated above, the interviews revealed that restoration was impeded by the land sale and many mistakes were made by subcontractors, negatively affecting the outcomes.
Trees take a long time to grow. The initial lack of sufficient deciduous trees in the study region, especially old ones, severely limits the possibility of creating suitable WBW habitat quickly. It is highly likely that habitat suiting the WBW to such an extent that the species can maintain itself will not be available in the study region for several decades, especially because existing protected areas did not specifically target the WBW’s habitat needs [
15] and did not provide optimal habitat for the species. However, the question is whether the current restoration plans will still be in effect and prioritized in a future society with different views, opinions, and economic situations. Although the action plan contains a long-term goal of restoring through the year 2070 [
15], the trend has already shifted from mandatory to voluntary set-aside of forest land within the action plan’s time frame as per the interviews. For the success of the WBW project, continuity is important because the ecosystem in the restored sites is currently not self-sustaining. For example, spruce from managed forest adjacent to restored sites regenerates at restored sites. If the project plans and goals are abandoned within the next few decades, the forest will likely revert to its pre-restoration state.
Reliable land cover and habitat inventory data can provide information about spatial and temporal habitat composition and can therefore guide restoration projects in selecting appropriate sites to restore [
4,
29]. The analysis of the forest inventory data suggests that restoration site selection by the forest company was not optimal, given the age and initial tree species composition. However, interpretation and analysis of forest inventory data is based on the assumption that they are reliable. There may be some uncertainty and unreliability in the forest inventory data we used due to miscalculations and misidentification. Therefore, due to a lack of ground truthing, the results should be interpreted with caution. Based on our results, the major driver in the site selection was the plan to connect former WBW habitats through corridors. Restoration was delayed because of the land sale and because of mistakes by the subcontractors conducting the actual restoration measures, because, as revealed by the interviews, coordination with the Forest Agency and follow-up by the forest company was insufficient. Whether and how fast ecological restoration will occur depends not only on initial plans and restoration activities, but also on what is organizationally feasible. This factor was also pointed out in the only external evaluation of the WBW project that we are aware of [
30], suggesting that coordination between different stakeholders could be improved. Because of data limitations, our study only examined site selection by one of the forest companies involved. In order to draw conclusions as to why site selection and distribution were not optimal with regard to the target species’ habitat needs, both quantitative and qualitative data from other stakeholders are needed. The results raise questions about whether, and when, organizational, and/or possibly economic and logistical factors overran ecological concerns in practice. A study by Steinwall [
31] suggests there have been conflicts surrounding the action plans for the WBW restoration, which may have had ecological consequences. Therefore, more studies are needed to look into the motivations of private companies that take part in restoration efforts, with the potential of finding possible synergies that could reinforce restoration efforts. This study was a first step towards finding evaluation measures to assess the ecological appropriateness of restoration site selection, which may aid restoration projects worldwide.


