
Impact of Mixing on the Structural Diversity of Serbian Spruce and Macedonian Pine Endemic to Relict Forest Communities in the Balkan Peninsula


Abstract
:1. Introduction
2. Materials and Methods
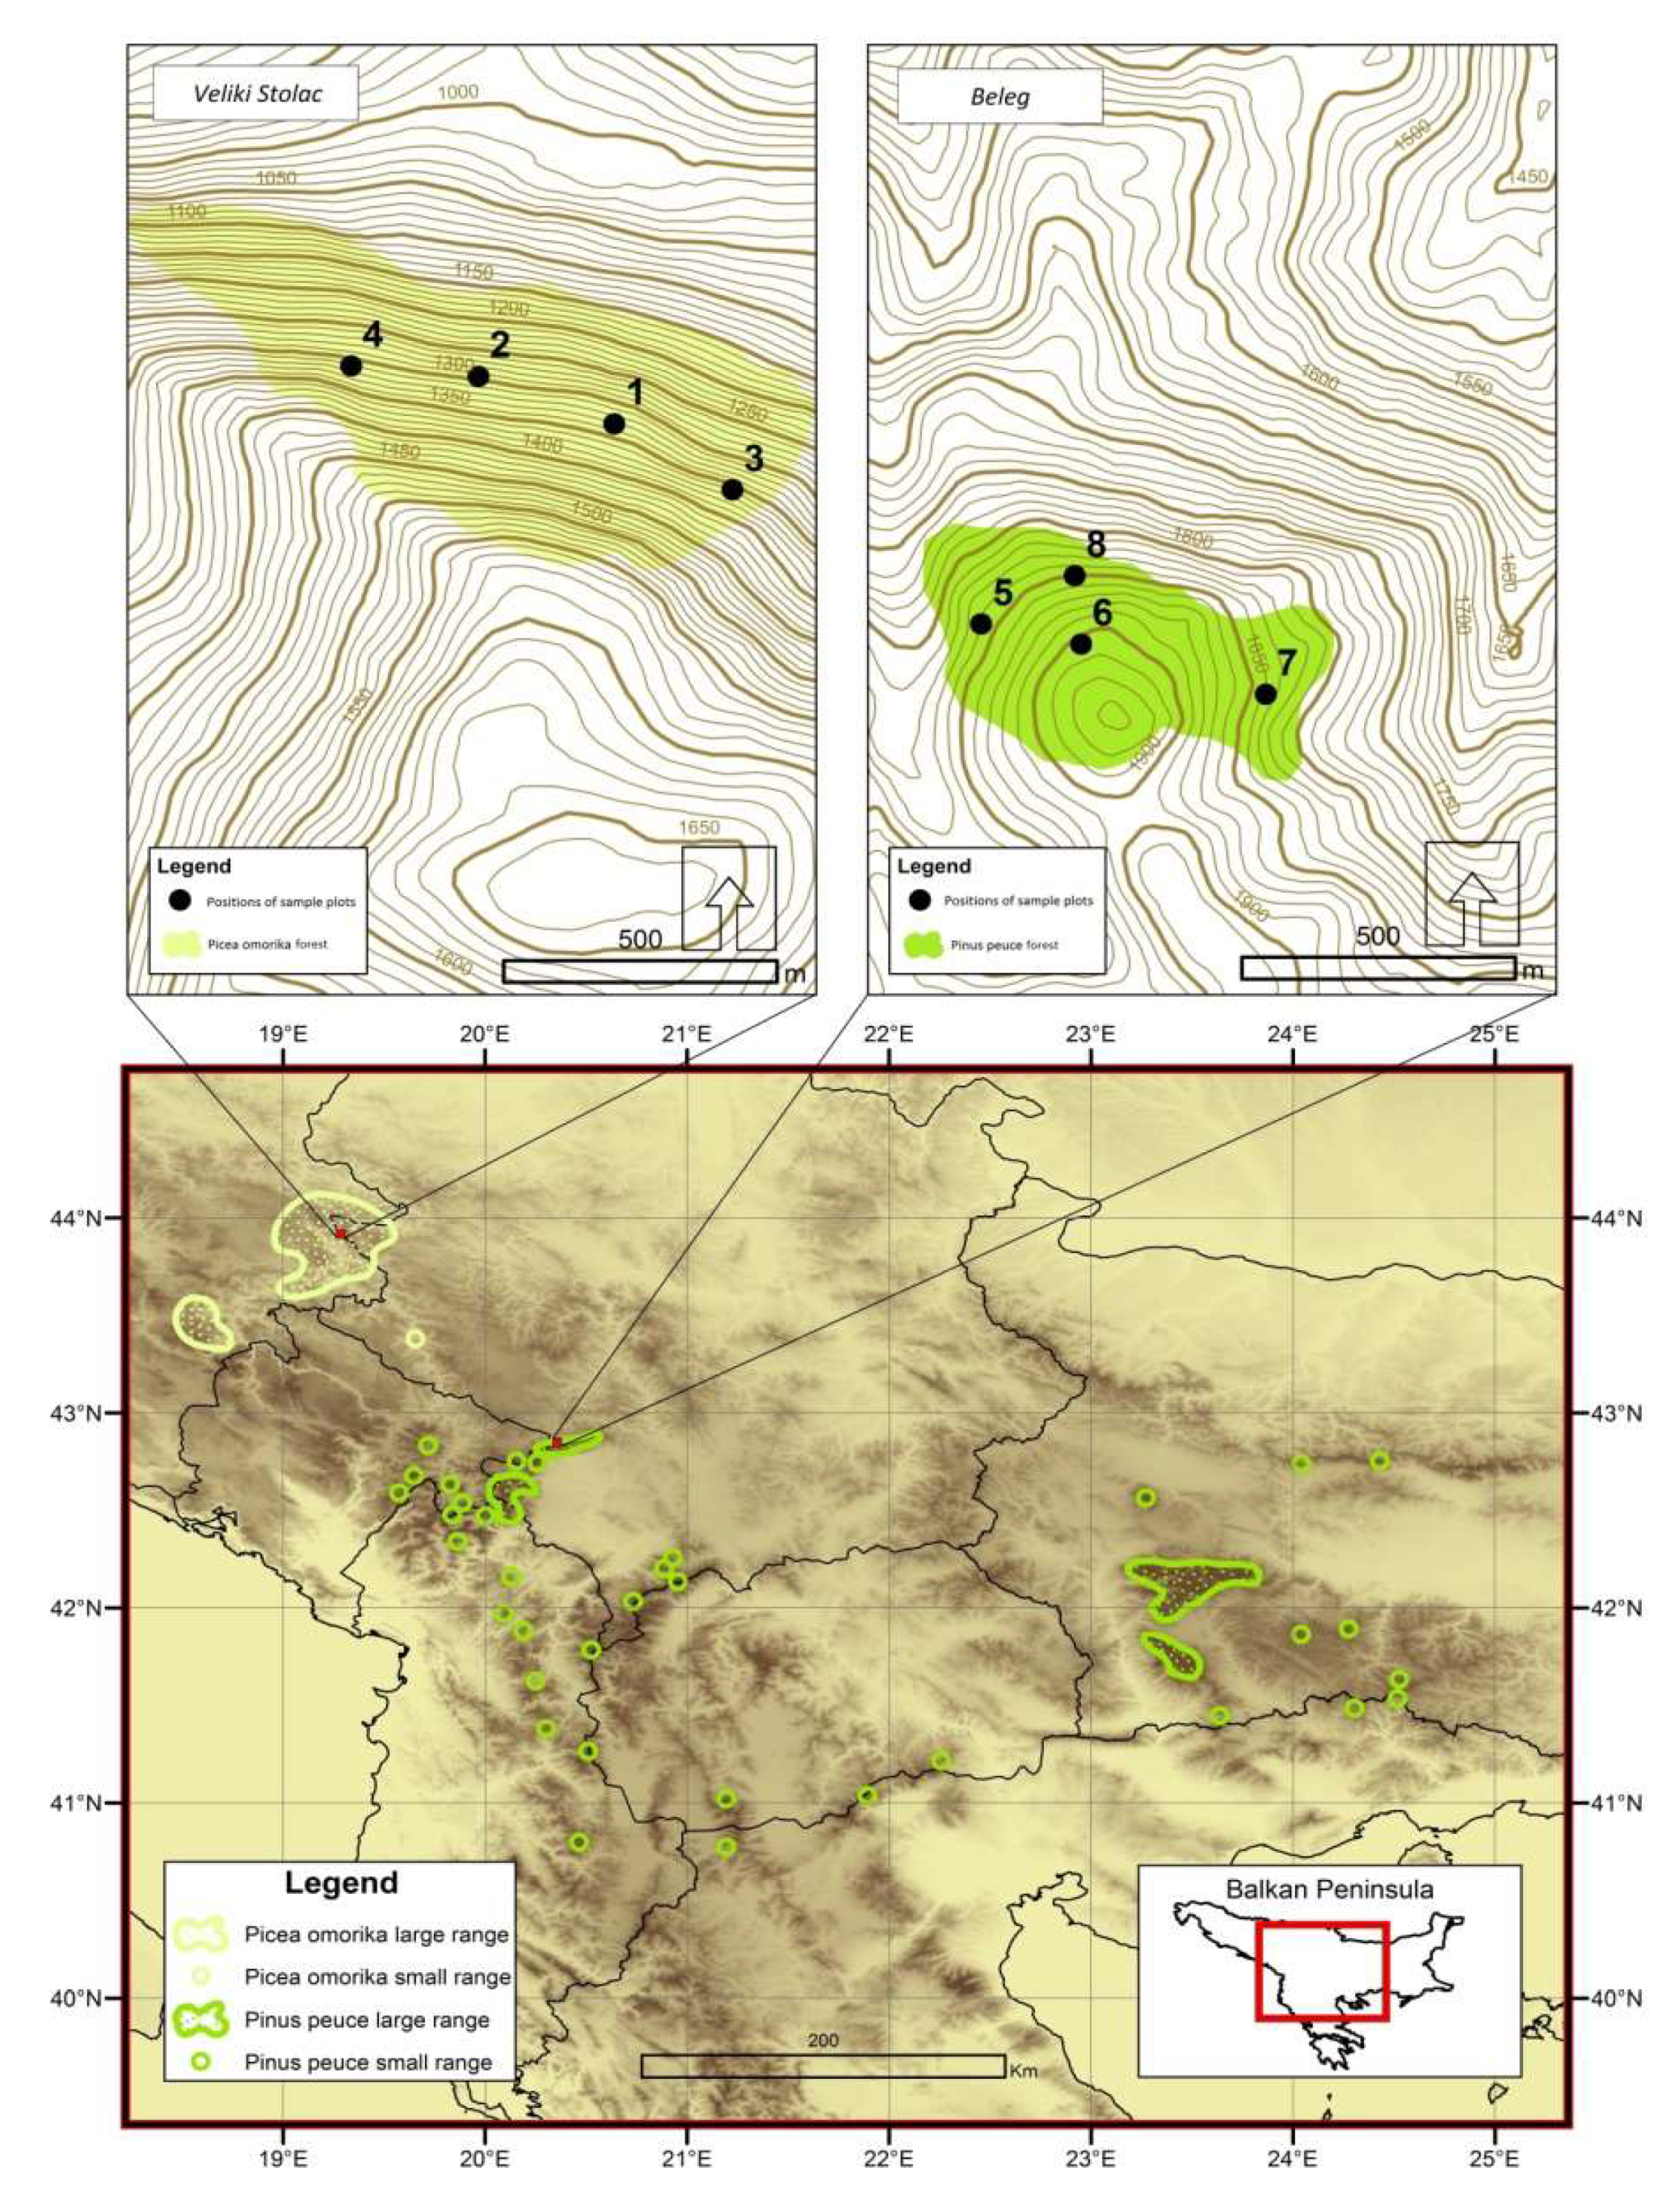
2.1. Research Area
2.2. Data Collection
2.3. Data Processing
2.3.1. The Mixing Effect
2.3.2. Horizontal Structure
2.3.3. Vertical Structure
2.3.4. Diameter Structure
2.4. Statistical Analysis
3. Results
3.1. Dendrometric Characteristics of the Investigated Forest Communities
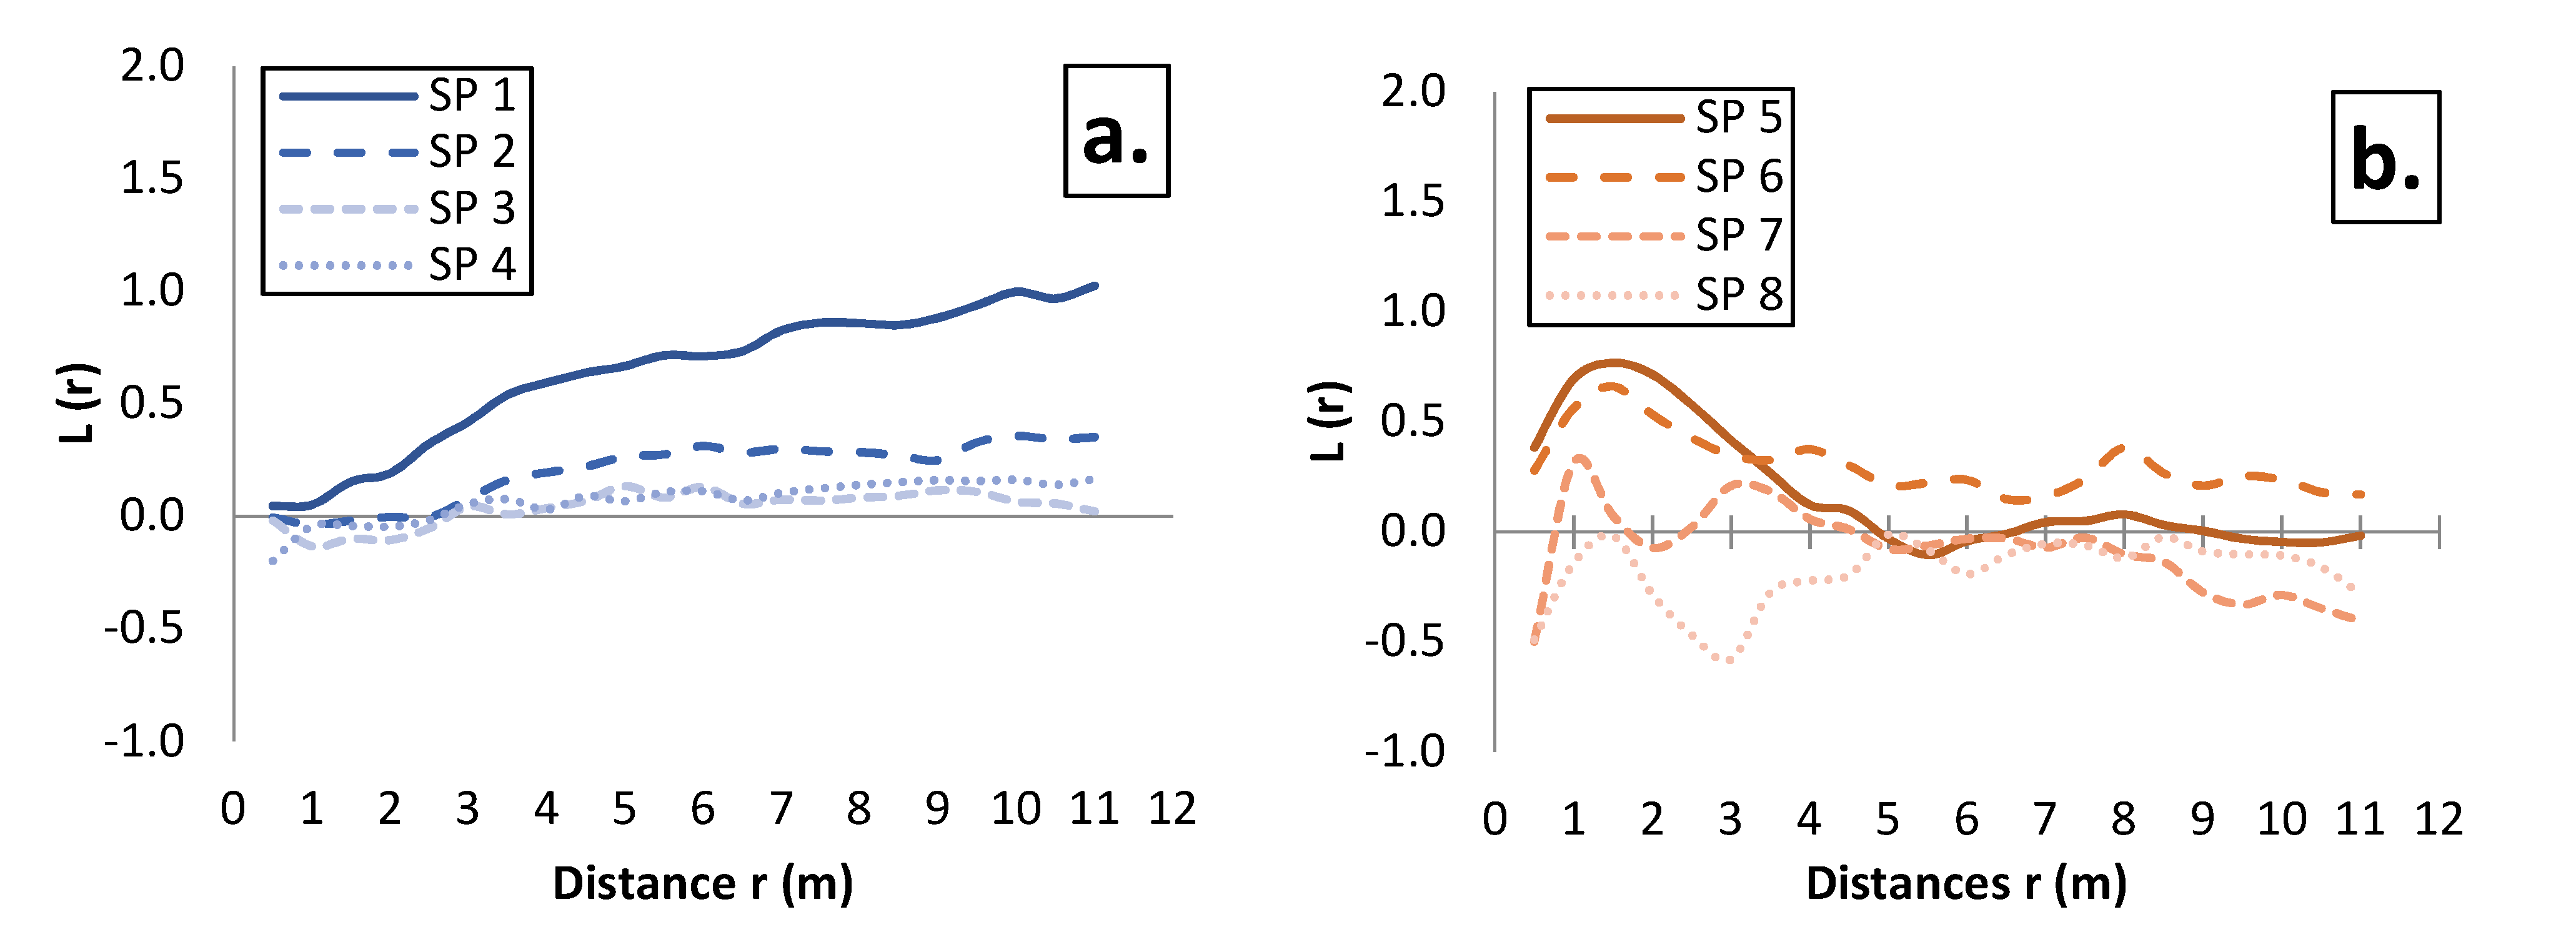
3.2. Spatial Pattern of Tree Distribution in the Investigated Stands
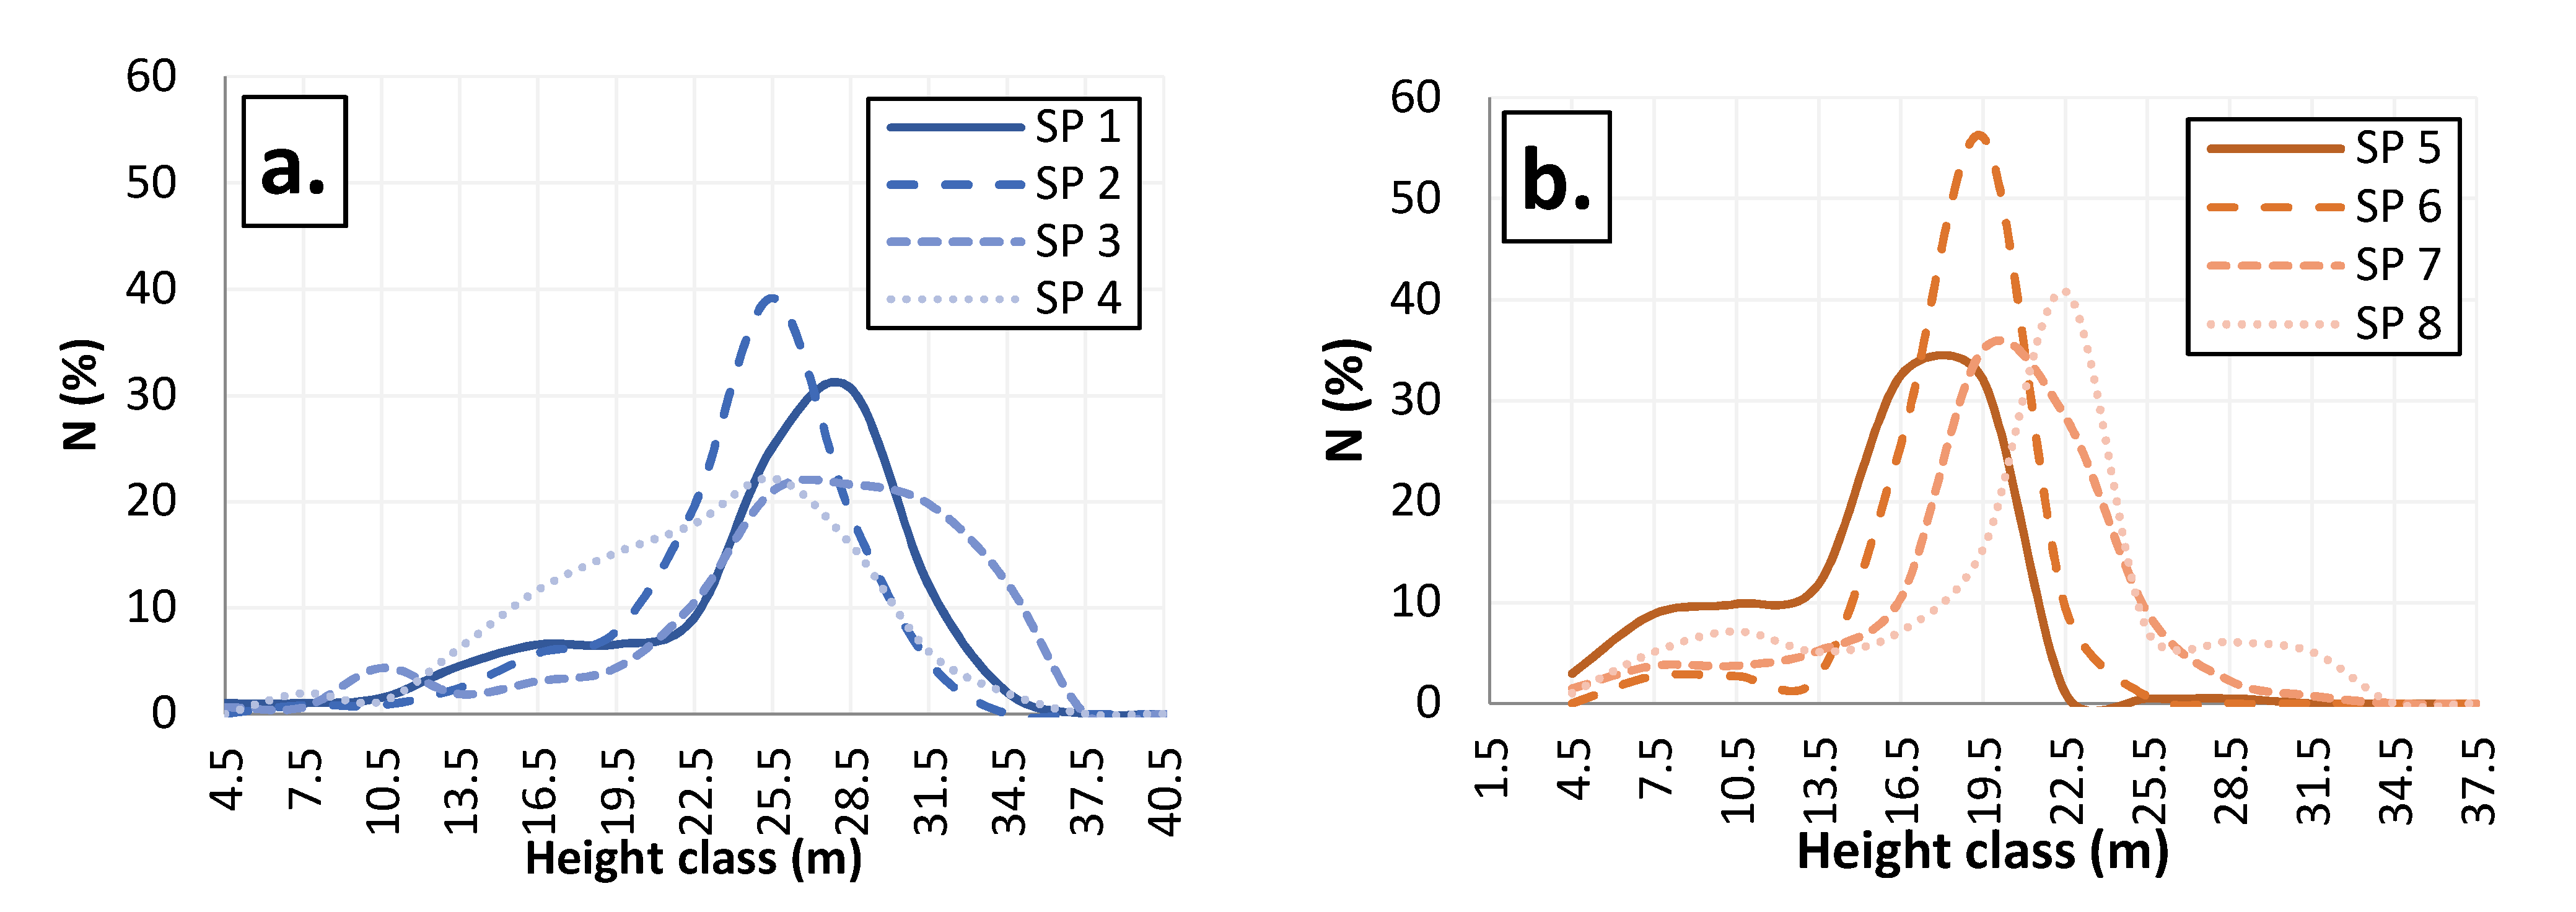
3.3. Vertical Structure
3.4. Diameter Structure
3.5. Parameters of Diameter Diversity
3.6. Spearman’s Correlation Coefficient ρ
4. Discussion
4.1. Differences in the Basic Characteristics between the Researched Stands and Other Stands of the Same Species
4.2. Effect of Mixing on the Spatial Pattern of Tree Distribution
4.3. Diversity Indices as an Appropriate Measure of Stand Differences (Td, GC)
4.4. Impact of Admixed Species on Stand Structure
4.5. Correlation of the Investigated Parameters of Structural Diversity
5. Conclusions
Author Contributions
Funding
Data Availability Statement
Acknowledgments
Conflicts of Interest
References
- Stevanović, V.; Jovanović, S.; Lakušić, D.; Niketić, M. Diversity of the vascular flora of Yugoslavia with an overview of species of international importance. In Biodiversity of Yugoslavia-with an Overview of Species of International Importance; Faculty of Biology: Belgrade, Serbia, 1995; pp. 183–217. [Google Scholar]
- Janković, M. Phytogeography, 2nd ed.; Science Book: Belgrade, Serbia, 1990. [Google Scholar]
- Pommerening, A.; Murphy, S.T. A review of the history, definitions and methods of continuous cover forestry with special attention to afforestation and restocking. Forestry 2004, 77, 27–44. [Google Scholar] [CrossRef] [Green Version]
- Río, M.; Pretzsch, H.; Alberdi, I.; Bielak, K.; Bravo, F.; Brunner, A.; Condés, S.; Ducey, M.J.; Fonseca, T.; von Lüpke, N.; et al. Characterization of the structure, dynamics, and productivity of mixed-species stands: Review and perspectives. Eur. J. For. Res. 2015, 135, 23–49. [Google Scholar] [CrossRef]
- Pretzsch, H. Standard Analysis of Long-Term Experimental Plots. In Forest Dynamics, Growth and Yield: From Measurement to Model; Springer: Berlin/Heidelberg, Germany, 2009; pp. 181–222. [Google Scholar] [CrossRef]
- Whittaker, R.H. Evolution and measurement of species diversity. Taxon 1972, 21, 213–251. [Google Scholar] [CrossRef] [Green Version]
- Gadow, K.V. Forest structure and diversity. Allg. Forst Jagdztg. 1999, 170, 117–122. [Google Scholar]
- Pommerening, A. Approaches to quantifying forest structures. Forestry 2002, 75, 305–324. [Google Scholar] [CrossRef]
- Aguirre, O.; Hui, G.Y.; Gadow, K.; Jimenez, J. An analysis of spatial forest structure using neighbourhood-based variables. For. Ecol. Manag. 2003, 183, 137–145. [Google Scholar] [CrossRef]
- Neumann, M.; Starlinger, F. The significance of different indices for stand structure and diversity in forests. For. Ecol. Manag. 2001, 145, 91–106. [Google Scholar] [CrossRef]
- Gadow, K.V.; Hui, G. Characterising forest spatial structure and diversity. In Sustainable Forestry in Temperate Regions; Proceeding of JUFRO International Workshop Sustainable Forestry in Temperate Regions; Bjoerk, L., Ed.; University of Lund: Lund, Sweden, 2002; pp. 20–30. [Google Scholar]
- McElhinny, C.; Gibbons, P.; Brack, C.; Bauhus, J. Forest and woodland stand structural complexity: Its definition and measurement. For. Ecol. Manag. 2005, 218, 1–24. [Google Scholar] [CrossRef]
- Pommerening, A. Evaluating structural nearest neighbor summary statistics by reversing forest structural analysis. For. Ecol. Manag. 2006, 224, 266–277. [Google Scholar] [CrossRef]
- Hansen, A.J.; Spies, T.A.; Swanson, F.J.; Ohmann, J.L. Conserving biodiversity in managed forests. BioScience 1991, 41, 382–392. [Google Scholar] [CrossRef] [Green Version]
- Kuuluvainen, T.; Penttinen, A.; Leinonen, K.; Nygren, M. Statistical opportunities for comparing stand structural heterogeneity in managed and primeval forests: An example from boreal spruce forest in southern Finland. Silva Fenn. 1996, 30, 315–328. [Google Scholar] [CrossRef] [Green Version]
- Paillet, Y.; Bergès, L.; Hjältén, J.; Ódor, P.; Avon, C.; Bernhardt-Römermann, M.; Bijlsma, R.; de Bruyn, L.; Fuhr, M.; Grandin, U.; et al. Biodiversity differences between managed and unmanaged forests: Meta-analysis of species richness in Europe. Conserv. Biol. 2010, 24, 101–112. [Google Scholar] [CrossRef]
- Pretzsch, H.; Rio, M.; Schutze, G.; Ammer, C.; Annighöfer, P.; Avdagic, A.; Barbeito, I.; Bielak, K.; Brazaitis, G.; Coll, L.; et al. Mixing of Scots pine (Pinus sylvestris L.) and European beech (Fagus sylvatica L.) enhances structural heterogeneity, and the effect increases with water availability. For. Ecol. Manag. 2016, 373, 149–166. [Google Scholar] [CrossRef] [Green Version]
- Pretzsch, H.; Biber, P. Tree species mixing can increase maximum stand density. Can. J. For. Res. 2016, 46, 1179–1193. [Google Scholar] [CrossRef] [Green Version]
- Bravo-Oviedo, A.; Pretzsch, H.; del Río, M. Dynamics, Silviculture and Management of Mixed Forests. In Growth and Structure in Mixed-Species Stands Compared with Monocultures: Review and Perspectives; Bravo-Oviedo, A., Pretzsch, H., Río, M., Eds.; Springer: Cham, Switzerland, 2018; Volume 31, pp. 131–184. [Google Scholar] [CrossRef]
- EUFORGEN. Available online: http://www.euforgen.org/species/picea-omorika/+/pinus-peuce/ (accessed on 17 April 2021).
- Tomić, Z. Forestry Phytocenology; Faculty of Forestry, University of Belgrade: Belgrade, Serbia, 2004. [Google Scholar]
- Pommerening, A.; Stoyan, D. Edge-correction needs in estimating indices of spatial forest structure. Can. J. For. Res. 2006, 36, 1723–1739. [Google Scholar] [CrossRef] [Green Version]
- Illian, J.; Penttinen, A.; Stoyan, H.; Stoyan, D. Statistical Analysis and Modelling of Spatial Point Patterns; John Wiley & Sons: Chichester, UK, 2008. [Google Scholar]
- Motz, K.; Sterba, H.; Pommerening, A. Sampling measures of tree diversity. For. Ecol. Manag. 2010, 260, 1985–1996. [Google Scholar] [CrossRef]
- Magurran, A. Ecological Diversity and Its Measurement; Princeton University Press: Princeton, NJ, USA, 1988. [Google Scholar] [CrossRef]
- Shannon, C.E. A Mathematical Theory of Communication. Bell Syst. Tech. J. 1948, 27, 379–423. [Google Scholar] [CrossRef] [Green Version]
- Pariško, Ž. Wood Productivity of Macedonian Pine (Pinus peuce-Griseb) in Dependence on Habitat Conditions in Pelister. Ph.D. Thesis, Faculty of Agriculture and Forestry, University of Kiril and Metodij, Skopje, North Macedonia, 1962. [Google Scholar]
- Banković, S.; Stojanović, L.J. Two-way volume table for Serbian spruce in SR Serbia. Bull. Fac. For. 1976, 50, 55–66. [Google Scholar]
- Banković, S.; Jović, D.; Medarević, M. Volume tables for beech (Fagus moesiaca Czeczott). Bull. Fac. For. 1989, 71–72, 343–358. [Google Scholar]
- Banković, S. Volume tables for fir (Abies alba Mill.) and spruce (Picea excelsa Link.) in forests of National park Tara. Bull. Fac. For. 1991, 1, 106. [Google Scholar]
- Banković, S.; Medarević, M.; Pantić, D.; Filipović, M. Volume Tables for Spruce in the Region of National Park of Kopaonik, Forestry; Association of Forestry Engineers and Technicians: Belgrade, Serbia, 2003; Volume 3–4, pp. 51–60. [Google Scholar]
- Füldner, K. Describing Forest Structures in Mixed Beech-Ash-Maple-Sycamore Stands. Ph.D. Thesis, University of Göttingen, Göttingen, Germany, 1995. [Google Scholar]
- Albert, M.; Gadow, K. Assessing Biodiversity with New Neighborhood-Based Parameters. In Proceedings of the International Conference on Data Management and Modelling Using Remote Sensing and GIS for Tropical Forest Land Inventory, Jakarta, Indonesia, 26–29 October 1998; pp. 433–445. [Google Scholar]
- Gadow, K.; Zhang, X.H.; Wehenkel, C.; Pommerening, A.; Corral-Rivas, J.; Koral, M.; Myklush, S.; Hui, G.Y.; Kiviste, A.; Zhao, X.H. Forest structure and diversity. In Continuous Cover Forestry; Pukkala, T., Gadow, K., Eds.; Springer Science + Business Media: Berlin/Heidelberg, Germany, 2012; pp. 29–84. [Google Scholar]
- Pommerening, A.; Uria-Diez, J. Do large forest trees tend towards high species mingling? Ecol. Inform. 2017, 42, 139–147. [Google Scholar] [CrossRef]
- Clark, P.J.; Evans, F.C. Distance to nearest neighbour as a measure of spatial relationships in populations. Ecology 1954, 35, 445–453. [Google Scholar] [CrossRef]
- Donnelly, K. Simulations to determine the variance and edge-effect of total nearest neighbour distance. In Simulation Studies in Archaeology; Hodder, I., Ed.; Cambridge University Press: London, UK, 1978; pp. 91–95. [Google Scholar]
- Ripley, B.D. Modelling spatial patterns. J. R. Stat. Soc. Ser. B 1977, 39, 172–192; discussion 192–212. [Google Scholar] [CrossRef]
- Diggle, P.J. Statistical Analysis of Spatial Point Patterns; Hodder Arnold: London, UK, 2003. [Google Scholar]
- Gray, L.; He, F. Spatial point-pattern analysis for detecting density-dependent competition in a boreal chronosequence of Alberta. For. Ecol. Manag. 2009, 259, 98–106. [Google Scholar] [CrossRef]
- Szmyt, J. Spatial pattern of trees of different diameter classes in managed pine stands (Pinus sylvestris L.) of different age. Acta Sci. Pol. Silv. Colendar. Rat. Ind. Lignar. 2010, 9, 37–49. [Google Scholar]
- Ripley, B.D. Tests of randomness for spatial point patterns. J. Roy. Stat. Soc. B 1979, 41, 358–374. [Google Scholar] [CrossRef]
- Pretzsch, H. Analysis and Reproduction of Spatial Stand Structures. Methodic Thoughts on the basis ofMixed Beech-Larch Stands in Lawer Saxony. Cent. Forstwes. 1995, 112, 91–117. [Google Scholar]
- Gadow, K.V. Stand description in the forest management. ForstHolz 1993, 48, 602–606. [Google Scholar]
- Wang, H.; Zhang, G.; Hui, G.; Li, Y.; Hu, Y.; Zhao, Z. The influence of sampling unit size and spatial arrangement patterns on neighborhood-based spatial structure analyses of forest stands. For. Syst. 2016, 25, 4. [Google Scholar] [CrossRef] [Green Version]
- Lexerod, N.L.; Eid, T. An evaluation of different diameter diversity indices based on criteria related to forest management planning. For. Ecol. Manag. 2006, 222, 17–28. [Google Scholar] [CrossRef]
- O’Hara, K.L.; Hasenauer, H.; Kindermann, G. Sustainability in multi-aged stands: An analysis of long-term plenter system. Forestry 2007, 80, 163–181. [Google Scholar] [CrossRef] [Green Version]
- Pommerening, A.; Szmyt, J.; Zhang, G. A new nearest-neighbour index for monitoring spatial size diversity: The hyperbolic tangent index. Ecol. Model. 2020, 435, 109232. [Google Scholar] [CrossRef]
- JASP, Version 0.9.0.1. JASP Team. 2018. Available online: https://jasp-stats.org/ (accessed on 5 February 2021).
- GraphPad Prism. Version 9.0.0 for Windows. GraphPad Software: San Diego, CA, USA; Available online: https://graphpad.com/ (accessed on 20 January 2021).
- Baddeley, A.; Rubak, E.; Turner, R. Spatial Point Patterns. Methodology and Applications with R; CRC Press: Boca Raton, FL, USA, 2016. [Google Scholar]
- R Development Core Team. R: A Language and Environment for Statistical Computing; R Foundation for Statistical Computing: Vienna, Austria, 2018; Available online: https://www.r-project.org/ (accessed on 19 November 2020).
- Stojanović, L.J. Investigation of the Influence of Some Habitat and Stand Factors on the Dynamics of the Development of serbian Spruce Trees in Characteristic Sites in SR Serbia. Master’s Thesis, Faculty of Forestry, University of Belgrade, Belgrade, Serbia, 1972. [Google Scholar]
- Ostojić, D. Ecological Factors of Natural Maintenance and Renewal of Cenopopulations of Serbian Spruce in NP Tara. Ph.D. Thesis, Faculty of Forestry, University of Belgrade, Belgrade, Serbia, 2005. [Google Scholar]
- Velkovski, N.; Krstić, M.; Govedar, Z.; Vasilevski, K.; Bjelanović, I.; Keren, S. Natural regeneration processes in old-growth Pinus peuce forest in the National park “Pelister” on Mt. Baba. Forestry 2013, 1–2, 67–80. [Google Scholar]
- Tomanić, L.; Stojanović, L.J.; Karadžić, D.; Stefanović, V.; Ostojić, D. Phytocenological and stand characteristics of Macedonian pine forests in the reserve Jažinačko lake on Mt. Šara. Nat. Prot. 1998, 50, 305–318. [Google Scholar]
- Ostojić, D.; Krstić, M. Structure, stand productivity and tree development in a mixed Macedonian and Scotch pine forest. In Proceedings of the VII International congress of ecology (INTECOL), Florence, Italy, 19–25 July 1998. [Google Scholar]
- Em, H.; Džekov, S. Macedonian pine forests on Mt. Pelister. In Proceedings of the Symposiumabout Macedonian Pine; Faculty of Agriculture and Forestry, University of “Kiril and Metodij”: Skopje, North Macedonia, 1969; pp. 49–61. [Google Scholar]
- Sterba, H.; Zingg, A. Distance-dependent and distance-independent stand structure description. Allg. Forst Jagdztg. 2006, 177, 169–176. [Google Scholar]
- Bilek, L.; Reemes, J.; Zahradnik, D. Managed vs. unmanaged. Structure of beech forest stands (Fagus sylvatica L.) after 50 years of development, Central Bohemia. For. Syst. 2011, 20, 122–138. [Google Scholar] [CrossRef] [Green Version]
- Szwagrzyk, J.; Czerwezak, M. Spatial Patterns of Trees in Natural Forests of East-Central Europe. J. Veg. Sci. 1993, 4, 469–476. [Google Scholar] [CrossRef]
- Seidling, W.; Travaglini, D.; Meyer, P.; Waldner, P.; Fischer, R.; Granke, O.; Chirici, G.; Corona, P. Dead wood and stand structure–Relationships for forest plots across Europe. iForest 2014, 7, 269–381. [Google Scholar] [CrossRef]
- Matovic, B. Relationship between Structure, Species and Ecosystem Diversity of High Beech Forests in Serbia. Ph.D. Thesis, Faculty of Biology, University of Belgrade, Belgrade, Serbia, 2012; p. 247. [Google Scholar]
- Pommerening, A.; Stoyan, D. Reconstructing spatial tree point patterns from nearest neighbour summary statistics measured in small subwindows. Can. J. For. Res. 2008, 38, 1110–1122. [Google Scholar] [CrossRef] [Green Version]
- Vacek, S.; Vacek, Z.; Bílek, L.; Simon, J.; Remeš, J.; Hůnová, I.; Král, J.; Putalová, T.; Mikeska, M. Structure, regeneration and growth of Scots pine (Pinus sylvestris L.) stands with respect to changing climate and environmental pollution. Silva Fenn. 2016, 50, 1564. [Google Scholar] [CrossRef] [Green Version]
- Vacek, S.; Vacek, Z.; Remeš, J.; Bílek, L.; Hůnová, I.; Bulušek, D.; Putalová, T.; Král, J.; Simon, J. Sensitivly of unmanaged relict pine forest in the Czech Republic to climate change and air pollution. Trees 2017, 31, 1599–1617. [Google Scholar] [CrossRef]
- Vacek, Z. Structure and dynamics of spruce-beech-fir forests in Nature Reserves of the Orlickéhory Mts. in relation to ungulate game. Cent. Eur. For. J. 2017, 63, 23–34. [Google Scholar] [CrossRef] [Green Version]
- Hájek, H.; Vacek, Z.; Vacek, S.; Bílek, L.; Prausovám, R.; Linda, R.; Bulušek, D.; Králíček, I. Changes in diversity of protected scree and herb-rich beech forest ecosystems over 55 years. Cent. Eur. For. J. 2020, 66, 202–217. [Google Scholar] [CrossRef]
- Sterba, H. Diversity indices based on angle count sampling and their interrelationships when used in forest inventories. Forestry 2008, 81, 587–597. [Google Scholar] [CrossRef] [Green Version]
- Keren, S.; Svoboda, M.; Janda, P.; Negel, T. Relationships between Structural Indices and Conventional Stand Attributes in an Old-Growth Forest in Southest Europe. Forests 2020, 11, 4. [Google Scholar] [CrossRef] [Green Version]
- Lee, W.K.; Gadow, V.K.; Akca, A. Forest structure and Lorenz model. Allg. ForstJagdztg. 1999, 170, 220–223. [Google Scholar]
- Matović, B.; Koprivica, M.; Kisin, B.; Stojanović, D.; Kneginjić, I.; Stjepanović, S. Comparison of Stand Structure in Managed and Virgin European Beech Forests in Serbia. Šumarski List 2018, 1–2, 47–57. [Google Scholar] [CrossRef]
- Klopcic, M.; Boncina, A. Stand dynamics of silver fir (Abies alba Mill.)-European beech (Fagus sylvatica L.) forests during the past century: A decline of silver fir? Forestry 2011, 84, 259–271. [Google Scholar] [CrossRef] [Green Version]
- Cristea, V.; Leca, S.; Ciceu, A.; Chivulescu, S.; Badea, O. Structural Features of Old Growth Forest from South EasternCharpathians, Romania. South-East Eur. For. 2019, 10, 159–164. [Google Scholar] [CrossRef]
- Duduman, G. A forest management planning tool to create highly diverse uneven-aged stands. Forestry 2011, 84, 301–314. [Google Scholar] [CrossRef]
- Weiner, J.; Solbring, O. The meaning and measurement of size hierarchies in plant populations. Oecologia 1984, 61, 334–336. [Google Scholar] [CrossRef] [PubMed]
- Dixon, P.M.; Weiner, J.; Mitchell-Olds, T.; Woodley, R. Bootstrapping the Gini coefficient of inequality. Ecology 1987, 68, 1548–1551. [Google Scholar] [CrossRef]
- Hanewinkel, M.; Pretzsch, H. Modelling the conversion from even-aged to uneven-aged sstands of Norway spruce (Piceaabies L. Karst.) with a distance-depadent growth simulator. For. Ecol. Manag. 2000, 134, 55–70. [Google Scholar] [CrossRef]
- Pretzsch, H.; Schutze, G. Effect of tree species mixing on the size structure, density, and yield of forest stands. Eur. J. For. Res. 2015, 135, 1–22. [Google Scholar] [CrossRef]
- Peck, J.E.; Zenner, E.K.; Brang, P.; Zingg, A. Tree size distribution and abundance explain structural complexity differentially within stands of even-aged and uneven-aged structure types. Eur. J. For. Res. 2014, 133, 335–346. [Google Scholar] [CrossRef]


| Species | Picea omorika | Pinus peuce | ||||||
|---|---|---|---|---|---|---|---|---|
| No. of Sample Plot | ||||||||
| 1 | 2 | 3 | 4 | 5 | 6 | 7 | 8 | |
| Abies alba | 5.4 | 9.7 | 9.7 | 7.8 | <1 | <1 | <1 | 2.4 |
| Picea abies | 3.3 | 6.7 | 15.7 | 7.4 | 12.3 | 30.8 | 38.2 | |
| Pinus silvestris | 1.5 | 5.4 | ||||||
| Pinus nigra | 30.3 | |||||||
| Pinus mugo | <1 | |||||||
| Populus tremula | 3.5 | <1 | <1 | |||||
| Acer pseudoplatanus | <1 | 1.4 | 1.6 | 1.4 | ||||
| Fagus moesiaca | <1 | 1.8 | <1 | |||||
| Sorbus aucuparia | <1 | <1 | ||||||
| Sum | 12.5 | 19.5 | 29.5 | 45.8 | 7.8 | 12.7 | 31.2 | 40.6 |
| Stands | Picea omorika | Pinus peuce | ||||||
|---|---|---|---|---|---|---|---|---|
| No. of Sample Plot | 1 | 2 | 3 | 4 | 5 | 6 | 7 | 8 |
| No. of Measured Trees | 299 | 368 | 243 | 386 | 305 | 148 | 134 | 98 |
| E (%) | 25.7 | 30.8 | 45.5 | 51.7 | 28.3 | 32.1 | 46.7 | 68.2 |
| Va (%) | 12.5 | 19.5 | 29.5 | 45.8 | 7.8 | 12.7 | 31.2 | 40.6 |
| N (pcs × ha−1) | 995 | 1225 | 810 | 1285 | 1015 | 493 | 447 | 326 |
| BA (m2 × ha−1) | 52.9 | 58.7 | 57.1 | 65.1 | 80.0 | 60.7 | 62.0 | 50.1 |
| QMD (cm) | 26.0 | 24.7 | 29.9 | 25.4 | 31.8 | 39.6 | 41.9 | 44.2 |
| Do (cm) | 34.0 | 33.4 | 41.3 | 38.4 | 47.7 | 51.5 | 59.8 | 65.0 |
| HQMD (m) | 26.4 | 25.8 | 27.9 | 26.1 | 17.6 | 19.7 | 20.3 | 20.7 |
| HDo (m) | 29.2 | 29.0 | 30.7 | 30.2 | 21.4 | 22.0 | 23.1 | 23.6 |
| HQMD/QMD | 101.5 | 104.4 | 93.3 | 102.7 | 55.3 | 49.7 | 48.4 | 46.8 |
| V(m3 × ha−1) | 649 | 716 | 755 | 794 | 700 | 561 | 596 | 511 |
| Stands | Picea omorika | Pinus peuce | ||||||
|---|---|---|---|---|---|---|---|---|
| No. of Sample Plot | 1 | 2 | 3 | 4 | 5 | 6 | 7 | 8 |
| Mean distances (m) | 1.58 | 1.44 | 1.84 | 1.49 | 1.14 | 1.89 | 2.34 | 3.41 |
| R | 1.0003 | 1.0116 | 1.0501 | 1.0724 * | 0.7286 *** | 0.8426 ** | 1.0041 | 1.1617 * |
| Stands | Picea omorika | Pinus peuce | ||||||
|---|---|---|---|---|---|---|---|---|
| No. of Sample Plot | 1 | 2 | 3 | 4 | 5 | 6 | 7 | 8 |
| Arel (%) | 43.5 | 46.7 | 56.8 | 58.9 | 45.8 | 51.8 | 57.4 | 68.6 |
| Stands | Picea omorika | Pinus peuce | ||||||
|---|---|---|---|---|---|---|---|---|
| No. of Sample Plot | 1 | 2 | 3 | 4 | 5 | 6 | 7 | 8 |
| M | 0.16 | 0.18 | 0.29 | 0.39 | 0.09 | 0.13 | 0.30 | 0.36 |
| Td | 0.25 | 0.24 | 0.26 | 0.31 | 0.32 | 0.22 | 0.31 | 0.33 |
| GC | 0.26 | 0.29 | 0.31 | 0.41 | 0.41 | 0.25 | 0.37 | 0.39 |
| S | 0.41 | 0.44 | 0.65 | 0.78 | 0.51 | 0.50 | 0.57 | 0.40 |
| M | R | Arel | Td | GC | S | |
|---|---|---|---|---|---|---|
| M | — | |||||
| R | 0.87 ** | — | ||||
| Arel | 0.86 * | 0.74 * | — | |||
| Td | 0.32 | 0.25 | 0.37 | — | ||
| GC | 0.41 | 0.23 | 0.48 | 0.85 ** | — | |
| S | 0.26 | 0.01 | 0.24 | 0.03 | 0.42 | — |
Publisher’s Note: MDPI stays neutral with regard to jurisdictional claims in published maps and institutional affiliations. |
© 2021 by the authors. Licensee MDPI, Basel, Switzerland. This article is an open access article distributed under the terms and conditions of the Creative Commons Attribution (CC BY) license (https://creativecommons.org/licenses/by/4.0/).
Share and Cite
Popović, A.; Pantić, D.; Medarević, M.; Šljukić, B.; Obradović, S. Impact of Mixing on the Structural Diversity of Serbian Spruce and Macedonian Pine Endemic to Relict Forest Communities in the Balkan Peninsula. Forests 2021, 12, 1095. https://doi.org/10.3390/f12081095
Popović A, Pantić D, Medarević M, Šljukić B, Obradović S. Impact of Mixing on the Structural Diversity of Serbian Spruce and Macedonian Pine Endemic to Relict Forest Communities in the Balkan Peninsula. Forests. 2021; 12(8):1095. https://doi.org/10.3390/f12081095
Chicago/Turabian StylePopović, Aleksandar, Damjan Pantić, Milan Medarević, Biljana Šljukić, and Snežana Obradović. 2021. "Impact of Mixing on the Structural Diversity of Serbian Spruce and Macedonian Pine Endemic to Relict Forest Communities in the Balkan Peninsula" Forests 12, no. 8: 1095. https://doi.org/10.3390/f12081095
APA StylePopović, A., Pantić, D., Medarević, M., Šljukić, B., & Obradović, S. (2021). Impact of Mixing on the Structural Diversity of Serbian Spruce and Macedonian Pine Endemic to Relict Forest Communities in the Balkan Peninsula. Forests, 12(8), 1095. https://doi.org/10.3390/f12081095