Article

Cold Acclimation Increases Freeze Tolerance in Acacia koa, a Tropical Tree Species Occurring over a Wide Elevational Gradient

1
Hardwood Tree Improvement and Regeneration Center, Department of Forestry and Natural Resources, Purdue University, West Lafayette, IN 47907, USA
2
Hardwood Tree Improvement and Regeneration Center, Northern Research Station, USDA Forest Service, West Lafayette, IN 47907, USA
*
Author to whom correspondence should be addressed.
Forests 2021, 12(8), 1089; https://doi.org/10.3390/f12081089
Submission received: 18 June 2021 / Revised: 22 July 2021 / Accepted: 31 July 2021 / Published: 13 August 2021
(This article belongs to the Special Issue The Scientific Basis of the Target Plant Concept)

Abstract

:
Frost damage is among the major limitations to reforestation and forest restoration projects worldwide. Investigations of environmental and genetic effects on frost resistance have focused on boreal and temperate tree species rather than tropical trees. Koa (Acacia koa A. Gray) is a valuable tropical hardwood tree species endemic to the Hawaiian Islands, USA. Koa occurs across a wide elevational gradient, and newly planted trees are subject to winter frost at high elevations. We sought to determine whether different koa populations show variation in freeze hardiness as a cold-tolerance mechanism, and whether exposure to hardening conditions prior to frost exposure can modify koa cold-tolerance adaptation. Seeds from 13 populations of koa (Acacia koa A. Gray) were collected across an elevational range (603–2050 m) on the Island of Hawai’i. Four-month-old seedlings grown from the 13 population seed sources were divided into control (non-acclimated) and cold-acclimated treatments, maintained at 26 °C/22 °C (day/night) or exposed to gradually decreasing temperatures to 8 °C/4 °C (day/night), respectively. After six weeks, control and cold-acclimated seedlings from each population were tested for freeze tolerance by electrolyte leakage at five test temperatures ranging from 5 °C (control) to −20 °C. Treatment effects were mainly observed at the lowest test temperatures (−15 and −20 °C). A higher index of cold damage occurred in the non-acclimated seedlings for most of the populations. Several of our higher elevation populations showed greater cold tolerance than populations from lower elevations, particularly when cold-acclimated. Our results suggest that cold acclimation may increase frost hardiness in a tropical forest tree species, and that there is likely some adaptive variation in frost tolerance among populations from different elevations. Cold acclimation could be a useful tool to prepare koa seedlings to be planted in high-elevation sites prone to freezing winter temperatures.

1. Introduction

The target plant concept provides a useful framework to help identify and overcome limiting factors in reforestation and forest restoration projects [1,2,3]. Damage from frost is an important limiting site factor on many tree-planting projects worldwide [4,5]. Past research showed that nursery and site preparation treatments, as well as genetic selection, can reduce frost damage [6,7] and increase the likelihood of outplanting success. Most studies used boreal and temperate tree species to study the environmental and genetic effects on frost resistance; there are few investigations in tropical trees.
Koa (Acacia koa A. Gray) is an ecologically, culturally, and economically important tree species native to the tropical Hawaiian Islands. Koa wood is among the most expensive in the world [8]; it is used in furniture, musical instruments, and a wide variety of decorative and craft products. Koa wood was associated with Hawaiian royalty, and has long been used to build the traditional Hawaiian outrigger canoes for fishing, racing, and voyaging [9]. Koa forests provide an important habitat for rare birds [10,11].
Several factors led to the historical reduction of koa forests. The species was excessively harvested because of its valuable wood, reducing its abundance [8,12]. Since the 1850s, high-elevation Hawaiian forests have frequently been converted to cattle pasture [13]. Only ~10% of the original koa forests remain [8], and koa must now compete with introduced invasive grasses such as kikuyu grass (Cenchrus clandestinus (Hochst. ex Chiov.) Morrone) and non-native ungulates [14], further exacerbating challenges to natural regeneration.
Recent interest in koa reforestation was driven by declining profits from ranching, the need to expand habitats for endangered species, and the increasing demand for native saw timber [13,15]. As the Earth’s climate warms, reestablishment of high-elevation forests—particularly on Hawai’i and Maui—is essential to provide native forest birds with a habitat in which to escape from avian malaria [9]. Once established, koa can serve as a nurse crop for other understory native species, which is an important factor to consider when restoration is the objective [13].
Koa ranges from lowland dry forest to montane wet forest [16], but is absent from very wet rainforests [17]. While sea level marked the original lowest elevation of native koa, its current effective range is limited by pests and diseases to elevations above 610 m [18] and below ~2134 m, with scattered trees above 2200 m. At lower elevations, koa trees are susceptible to koa wilt and dieback disease—a serious vascular disease caused by Fusarium oxysporum (Schlecht. emend. Synder & Hansen). Planted stands at elevations below 760 m are the most frequently affected by koa wilt [19].
The most important limiting site factor for the restoration of koa and other native species at high-elevation sites in Hawai’i is exposure of planted seedlings to winter frost. During the winter, plants growing at high elevations (above 1800 m) in Hawai’i are commonly subjected to nocturnal freezing temperatures [13,20,21], although the climate at high elevations in Hawai’i is relatively unpredictable in terms of the duration of subzero temperatures and the lowest nighttime subzero temperature. While frost events are rare below ~1500 m, repeated freezing events occur between December and February at elevations above ~1800 m [20]. The coldest temperature ever recorded in Hawai’i was −11 °C at Mauna Kea, north-central Island of Hawai’i, in 1979 [22]. Mauna Kea and Mauna Loa, the highest mountains on Hawai’i, may be covered with snow during winter. Cold air formed above this snow cover has the potential to drain into local depressions on clear nights, causing low temperatures at higher elevations [23].
Frost is an important limiting factor for forest establishment in Hawai’i, because many sites targeted for forest restoration are high-elevation (1900 and 2200 m), abandoned, open pastures that are particularly prone to winter frost due to lack of canopy cover following deforestation for the ranching industry [13,14]. Frost damage reduces survival [13,20] until seedlings grow tall enough to escape the frost zone concentrated near the soil surface. Significant mortality occurs when koa seedlings are exposed to temperatures of −4 °C or below for some hours, though little is known of the tolerance limits of mature trees to frost [24]. Artificial frost protection devices, consisting of a single layer of vertically oriented shade cloth placed on the east side of seedlings, may reduce frost damage by reducing radiative cooling [13,20], but these devices are expensive and time-consuming to install and maintain.
Endemic plant species in isolated, higher elevation regions on Haleakalā volcano, on the Island of Maui in Hawai’i, were shown to be cold tolerant at −5 to −9 °C [25], so plants there have undergone a degree of natural selection to evolve mechanisms for freeze tolerance [25]. Lipp et al. [25] reported that the range of characteristics leading to tolerance or avoidance of extracellular ice formation appears to be incomplete, however—probably because of the short evolutionary history of these taxa in the isolated Hawaiian archipelago.
Koa populations, irrespective of elevation, are subject to a wide range of temperatures throughout the year [26], but only high-elevation sources are exposed to winter frost. As a result, it is reasonable that koa populations have evolved varying levels of frost tolerance. Specifically, koa populations from higher elevations may be better adapted to freezing temperatures, but the genecology of koa is not well studied. A previous study using 9-year-old trees detected no differences between koa families in terms of frost tolerance [27], but this study included a limited number of populations. Rueda Krauss [27] did, however, detect significant seasonal variation (i.e., summer to winter) in frost tolerance, indicating responsiveness to phenological cues and the potential for cold acclimation to increase frost tolerance [28,29]. Selecting genetic sources of koa that exhibit high cold tolerance during the establishment phase of regeneration may help to improve the efficiency and success of restoration. Frost tolerance is not isolated from other traits of interest, because it is correlated with growth [30] and other metabolic plant functions, so its importance to koa forest development likely extends beyond the frost tolerance of regeneration.
Koa in Hawai’i represents a unique case study of a tropical forest tree species for which frost serves as a major limitation to forest restoration in high-elevation pasturelands. The objective of this study was to assess the differences in freeze-tolerance responses between koa populations occurring across an elevational range on the Island of Hawai’i, as well as to determine whether exposure to hardening conditions prior to frost exposure can modify cold tolerance adaptation. We accomplished this objective by measuring frost tolerance for koa seedlings representing a range of elevation zones using electrolyte leakage, which provides an effective measure of cold tolerance in forest trees [31], and has been used previously with koa [27]. Specific research questions were as follows: (1) Do koa populations from all altitudinal zones develop freeze hardiness as a mechanism to tolerate frost? (2) Do populations of koa from higher elevations show greater freeze tolerance than koa populations from lower elevations? (3) To what extent does induction of hardening via cold acclimation affect the freeze tolerance of koa?

2. Materials and Methods

2.1. Plant Material

Koa (Acacia koa A. Gray) seeds were collected from 13 populations located across an elevational gradient between 603 m and 2050 m on the Island of Hawai’i (Table 1). Seeds were transferred to the laboratory at Purdue University (West Lafayette, IN) for storage. Every population corresponded to a single elevation (Table 1).
Seeds were scarified with hot water and later germinated on moist paper towels at 19–20 °C in darkness. Upon the emergence of the radicle and before it reached 1 cm, seedlings were transferred into plastic pots of 6 × 7 cm diameter and 25 cm depth (D40L/D40H; Stuewe and Sons, Inc., Tangent, OR, USA), filled with growing media of coarse sphagnum peat moss (60–70%), bark, and perlite (BM7; Berger, Saint-Modeste, QC, Canada). Seedlings were grown in a Purdue University greenhouse at the Department of Horticulture and Landscape Architecture’s Plant Growth Facility during July 2018.
For the first two weeks after germination, seedlings from each population were irrigated every 1–2 days to saturation with 30% dilution of the fertigation water formulation (Petunia Special with Black Iron 20-3-19; ICL Specialty Fertilizers, Dublin, OH, USA), alternating with water. After two weeks, seedlings were irrigated every 1–2 days to saturation, alternating undiluted fertigation water and water.
There were three to four trays (with 20 seedlings in each tray) per population, which were distributed randomly on the benches in the greenhouse. After 1.5 months, seedlings were thinned to 10 per tray.

2.2. Acclimation Treatments

In November 2018, after four months of growth in the greenhouse, we selected 20 seedlings per population of average shoot height, discarding larger or smaller plants of each population, and then divided them into two groups. Ten seedlings of each of the thirteen populations were put into two growth chambers (Conviron, Inc., Model E8) for 1.5 months of cold acclimation, with reduced photoperiod and lower temperature (Table 2). The other half of the seedlings from each population (10 seedlings) remained in the greenhouse at ~26 °C/22 °C (day/night), with 14 h of photoperiod and light of 500 μmol/m2/s. The seedlings of each population were distributed between the two growth chambers.
To gradually expose the greenhouse-grown seedlings to changes in chilling and light regime upon transfer to the growth chambers, the temperatures were gradually lowered according to the specifications of Table 2, to final temperatures of 8 °C/4 °C (day/night), with the photoperiod reset to 11 h light/13 h dark, and light intensity of 200 μmol/m2/s (Table 2).

2.3. Freezing Tests and Conductivity Measurements

After six weeks of cold acclimation, 20 seedlings per population (10 acclimated and 10 non-acclimated) were used in tests of freezing tolerance. The fourth fully expanded leaf from the top of each seedling was collected in resealable plastic bags with deionized water, and then the plastic bags were placed in a cooler to decrease water loss from the leaves. Once in the laboratory, the cooler was placed in a refrigerator at ~4 °C overnight. The collected leaves of each seedling were sectioned. Two sections of leaflets ~3.5 cm in length were assigned without a specific order to each of five different test temperatures (described below).
The tissue samples consisting of the leaflets’ sections were placed in 20-mL polypropylene scintillation vials that contained 15 mL of room-temperature distilled water. Water was added to each vial to prevent desiccation during freezing, and then the vials were capped. Five sets of vials were prepared per repetition (one set for each test temperature). Five test temperatures—consisting of one control temperature and four below-freezing temperatures (−5, −10, −15, and −20 °C)—were selected based on the expected hardiness of the samples. The control samples were placed in a refrigerator at ~4 °C for 24 h. The samples designated for freezing were placed into a programmable freezer (Scientemp Corp., Model 40-21 B) set to ~4 °C. Temperature was thereafter decreased at a rate of 5 °C per hour. When the freezer temperature reached −2 °C, the vials were gently shaken to promote ice nucleation.
Electrolyte leakage (EL), which quantifies the amount of tissue damage as a measure of the proportion of cell solutes lost due to freezing damage at a range of temperatures [31], was used to assess frost tolerance. Upon reaching each freeze test temperature, corresponding leaflet samples were maintained in the freezer for 60 min, removed, and placed in a refrigerator to thaw at ~4 °C for 24 h. Sample vials of all test temperatures were then placed at room temperature for 18 h for complete thawing. Initial electroconductivity was then measured with an electrical conductivity (EC) meter (Mettler Toledo, LLC, Model InLab730); the EC meter probe was introduced to the vial containing the tissue sample in the deionized water, then softly shaken, and after 10 s the value was recorded. After the initial measurement, the samples were placed in a refrigerator at ~4 °C overnight. The following day, samples were autoclaved (which achieves 100% electrolyte leakage) at 120 °C for 20 min and then allowed to cool at room temperature. Once the vials were cooled, electroconductivity was measured again to determine maximum EL. Electrolyte leakage of samples from each test temperature (freeze-induced EL) was expressed as a percentage of maximum EL. The percentage of index of damage (Id) was calculated using the following formula [32]:
Id (%) = (freeze-induced EL/maximum EL) × 100

2.4. Statistical Analyses

We fit linear mixed-effect regression models to evaluate the influence of population elevation (continuous, fixed), test temperature (continuous, fixed), acclimation treatment (categorical, fixed), test day (day when EL was measured—categorical, random), and plant identification (each plant within a population, assigned to one of the acclimation treatments—categorical, random) on the damage index (continuous, response variable) of the tissue samples. Interaction effects of the predictors on the damage index were also analyzed. Variables were kept in the model if significant.
After conducting a residual analysis of the response variable damage index, we found that residuals were not normally distributed; furthermore, we found that the assumption of homogeneity of variance was also violated. Therefore, non-parametric analyses were used, and the response variable damage index was log-transformed.
After performing the mixed-effects regression model, a non-parametric bootstrap was conducted to obtain confidence intervals of the parameters. The following model was used:
y = population elevation + test temperature + acclimation treatment + (test temperature)2 + population elevation ∗ test temperature + test temperature ∗ acclimation treatment + (1|test day) + (1|plant identification) + ε
Statistical analyses were carried out to determine whether seedlings of populations from higher elevations show higher freeze tolerance than populations from lower elevations, and how this may interact with cold acclimation. All analyses were performed using R Statistical Software (Version 3.5.3., Vienna, Austria) [33]. Differences were considered significant at p < 0.05. The package “lme4” was used to evaluate the fixed effects and random effects on the damage index [34]. We used the package “lmerTest” to obtain p-values for the analyses performed with the package “lme4” [35].

3. Results

The interaction effect between cold acclimation and test temperature on the damage index was significant (p < 0.001; Figure 1, Table 3). Cold-acclimated plants had a lower damage index than non-acclimated plants at −15 °C and −20 °C, but there were no differences between 5 °C and −10 °C (Figure 1). In contrast, the main effect of cold acclimation on the damage index was non-significant.
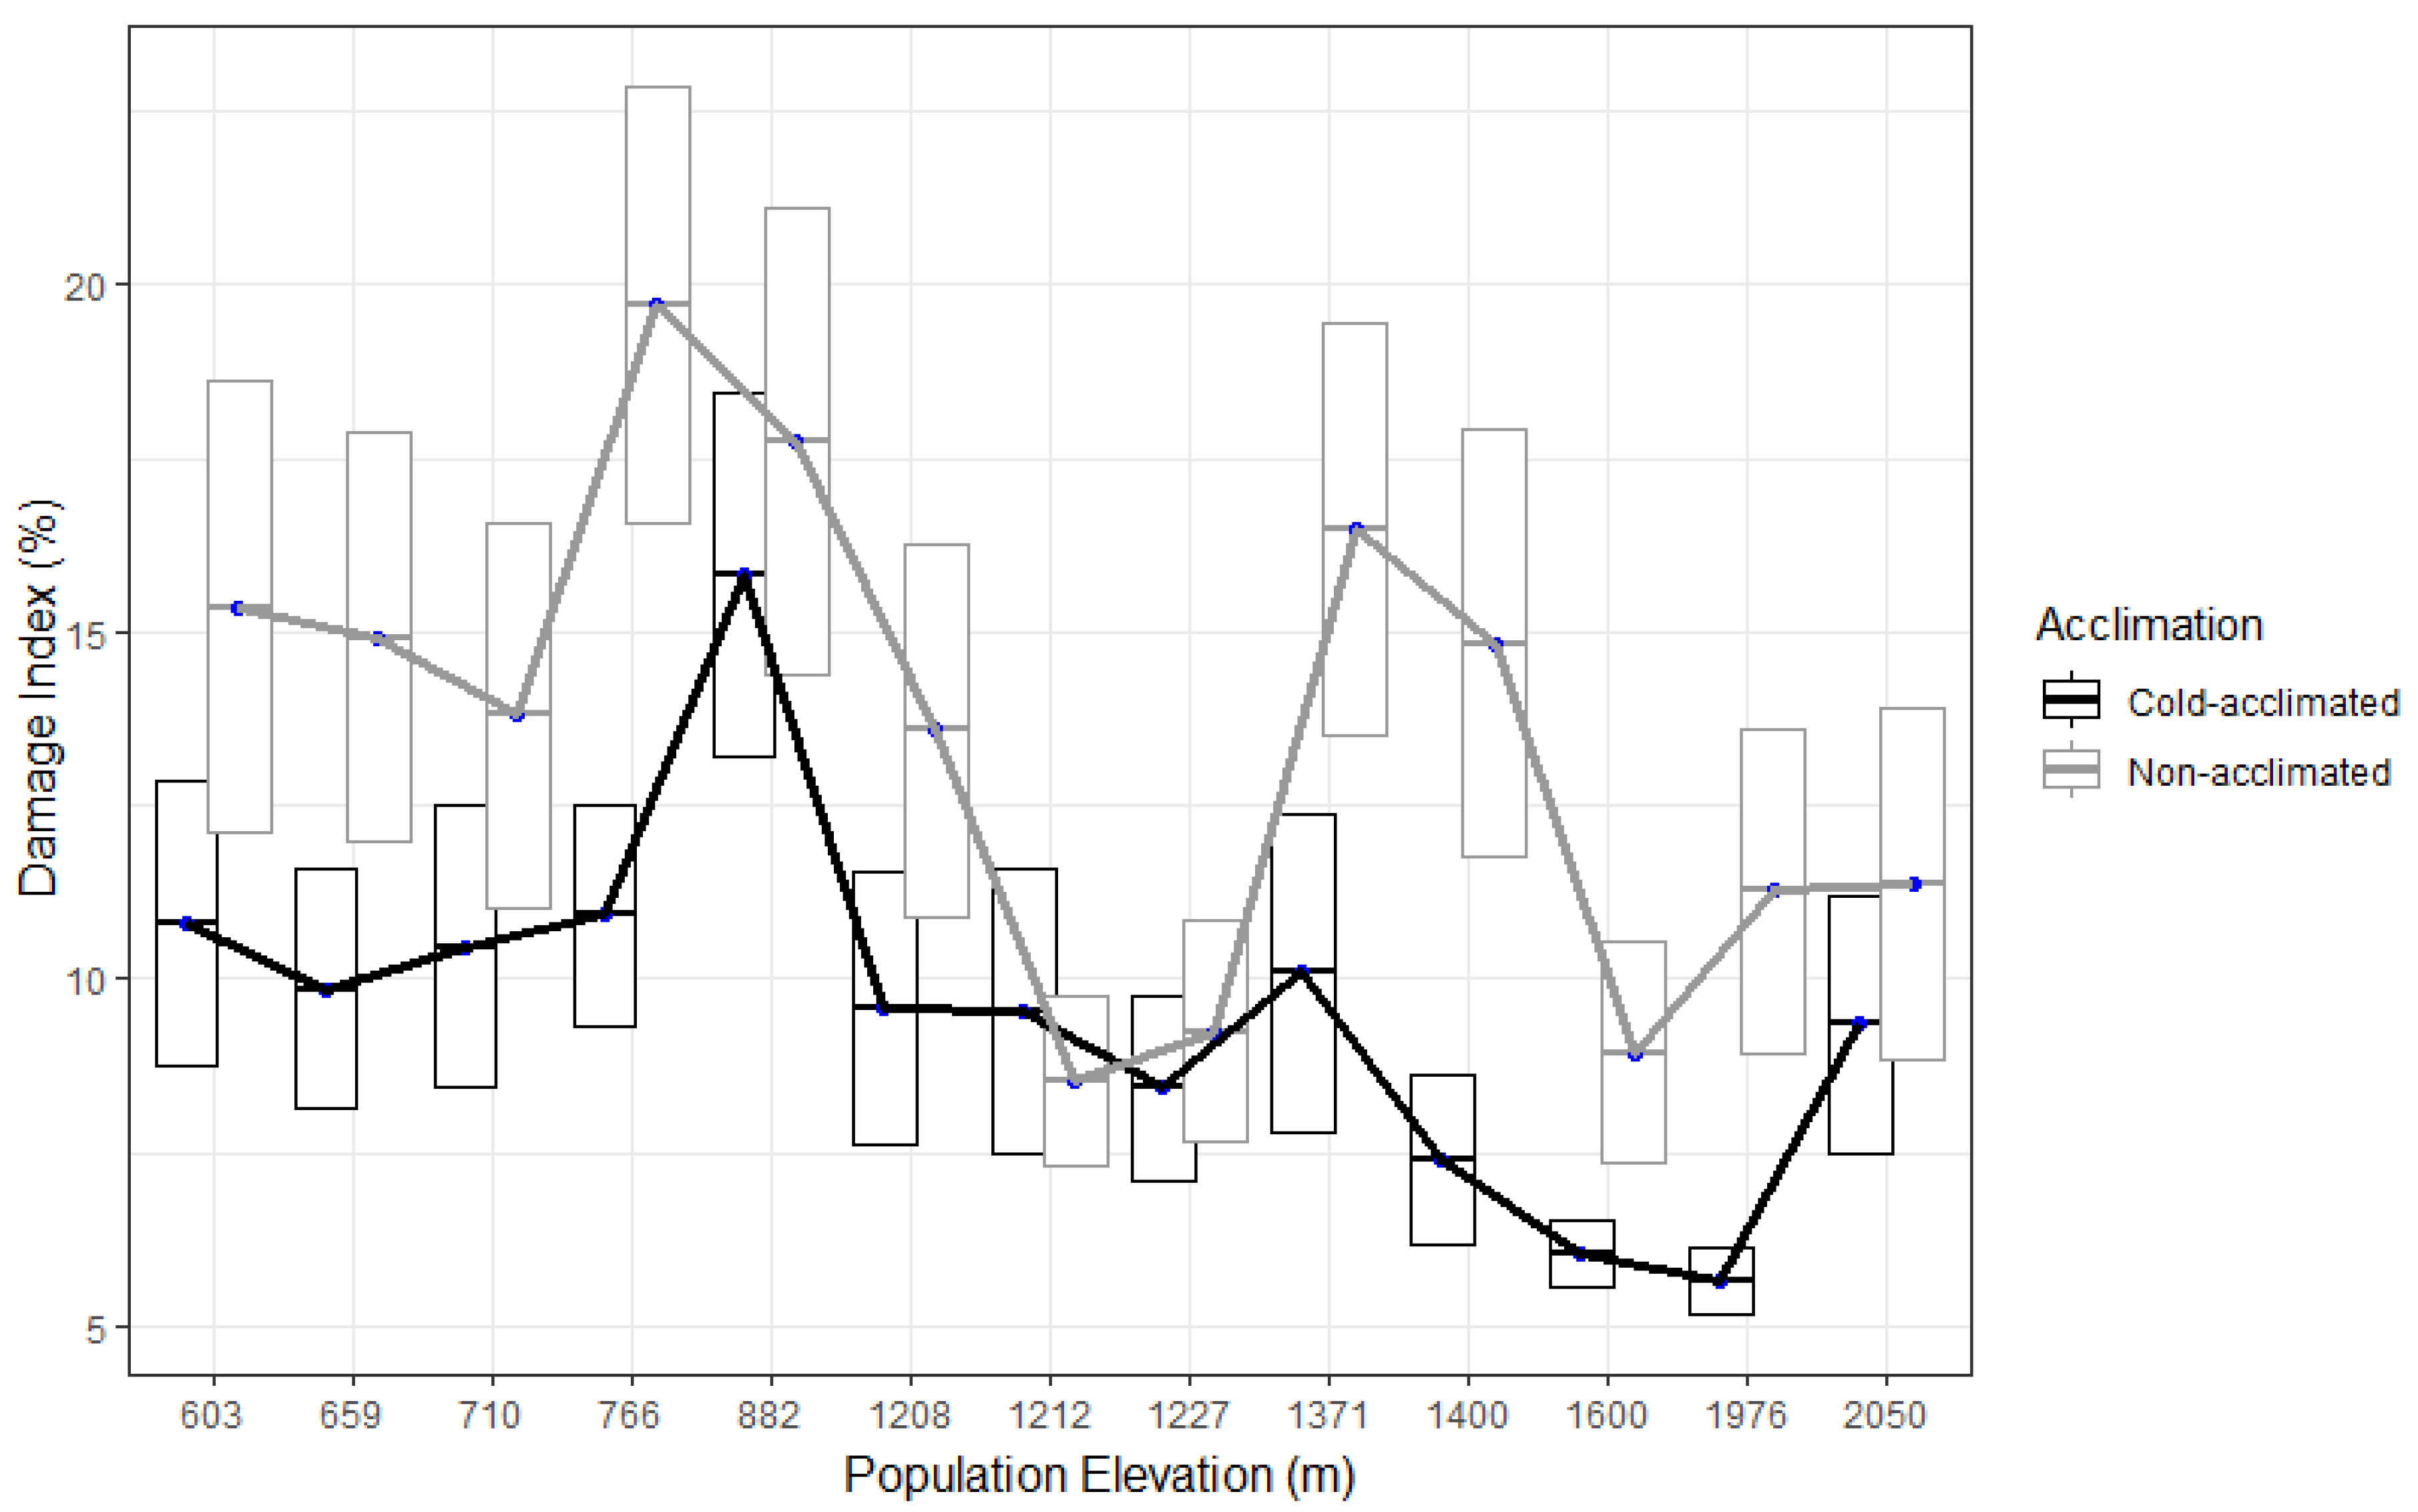
When averaged across test temperatures, cold-acclimated seedlings from nearly all of the populations distributed across elevations included in the experiment developed cold hardiness, showing significantly lower damage (p < 0.001, Table 3) than the samples of non-acclimated seedlings (Figure 2). The only exceptions were for samples corresponding to the populations BK-MLSR 1 and BK-MLSR 2, located at elevations of 1227 m and 1212 m, respectively (Figure 2).
The main effects of population elevation on the damage index were significant (p < 0.0001, Table 3). The interaction effect between population elevation and test temperature on the damage index was also significant (p < 0.001, Table 3). Damage index differed between freeze test temperatures for both acclimated and non-acclimated seedlings. Differences in damage were significant when comparing samples exposed to a test temperature of −20 °C with samples exposed to all of the other test temperatures (p < 0.001, Table 3). Differences in damage were most pronounced among samples of different populations at test temperatures of −15 °C, and especially at −20 °C.
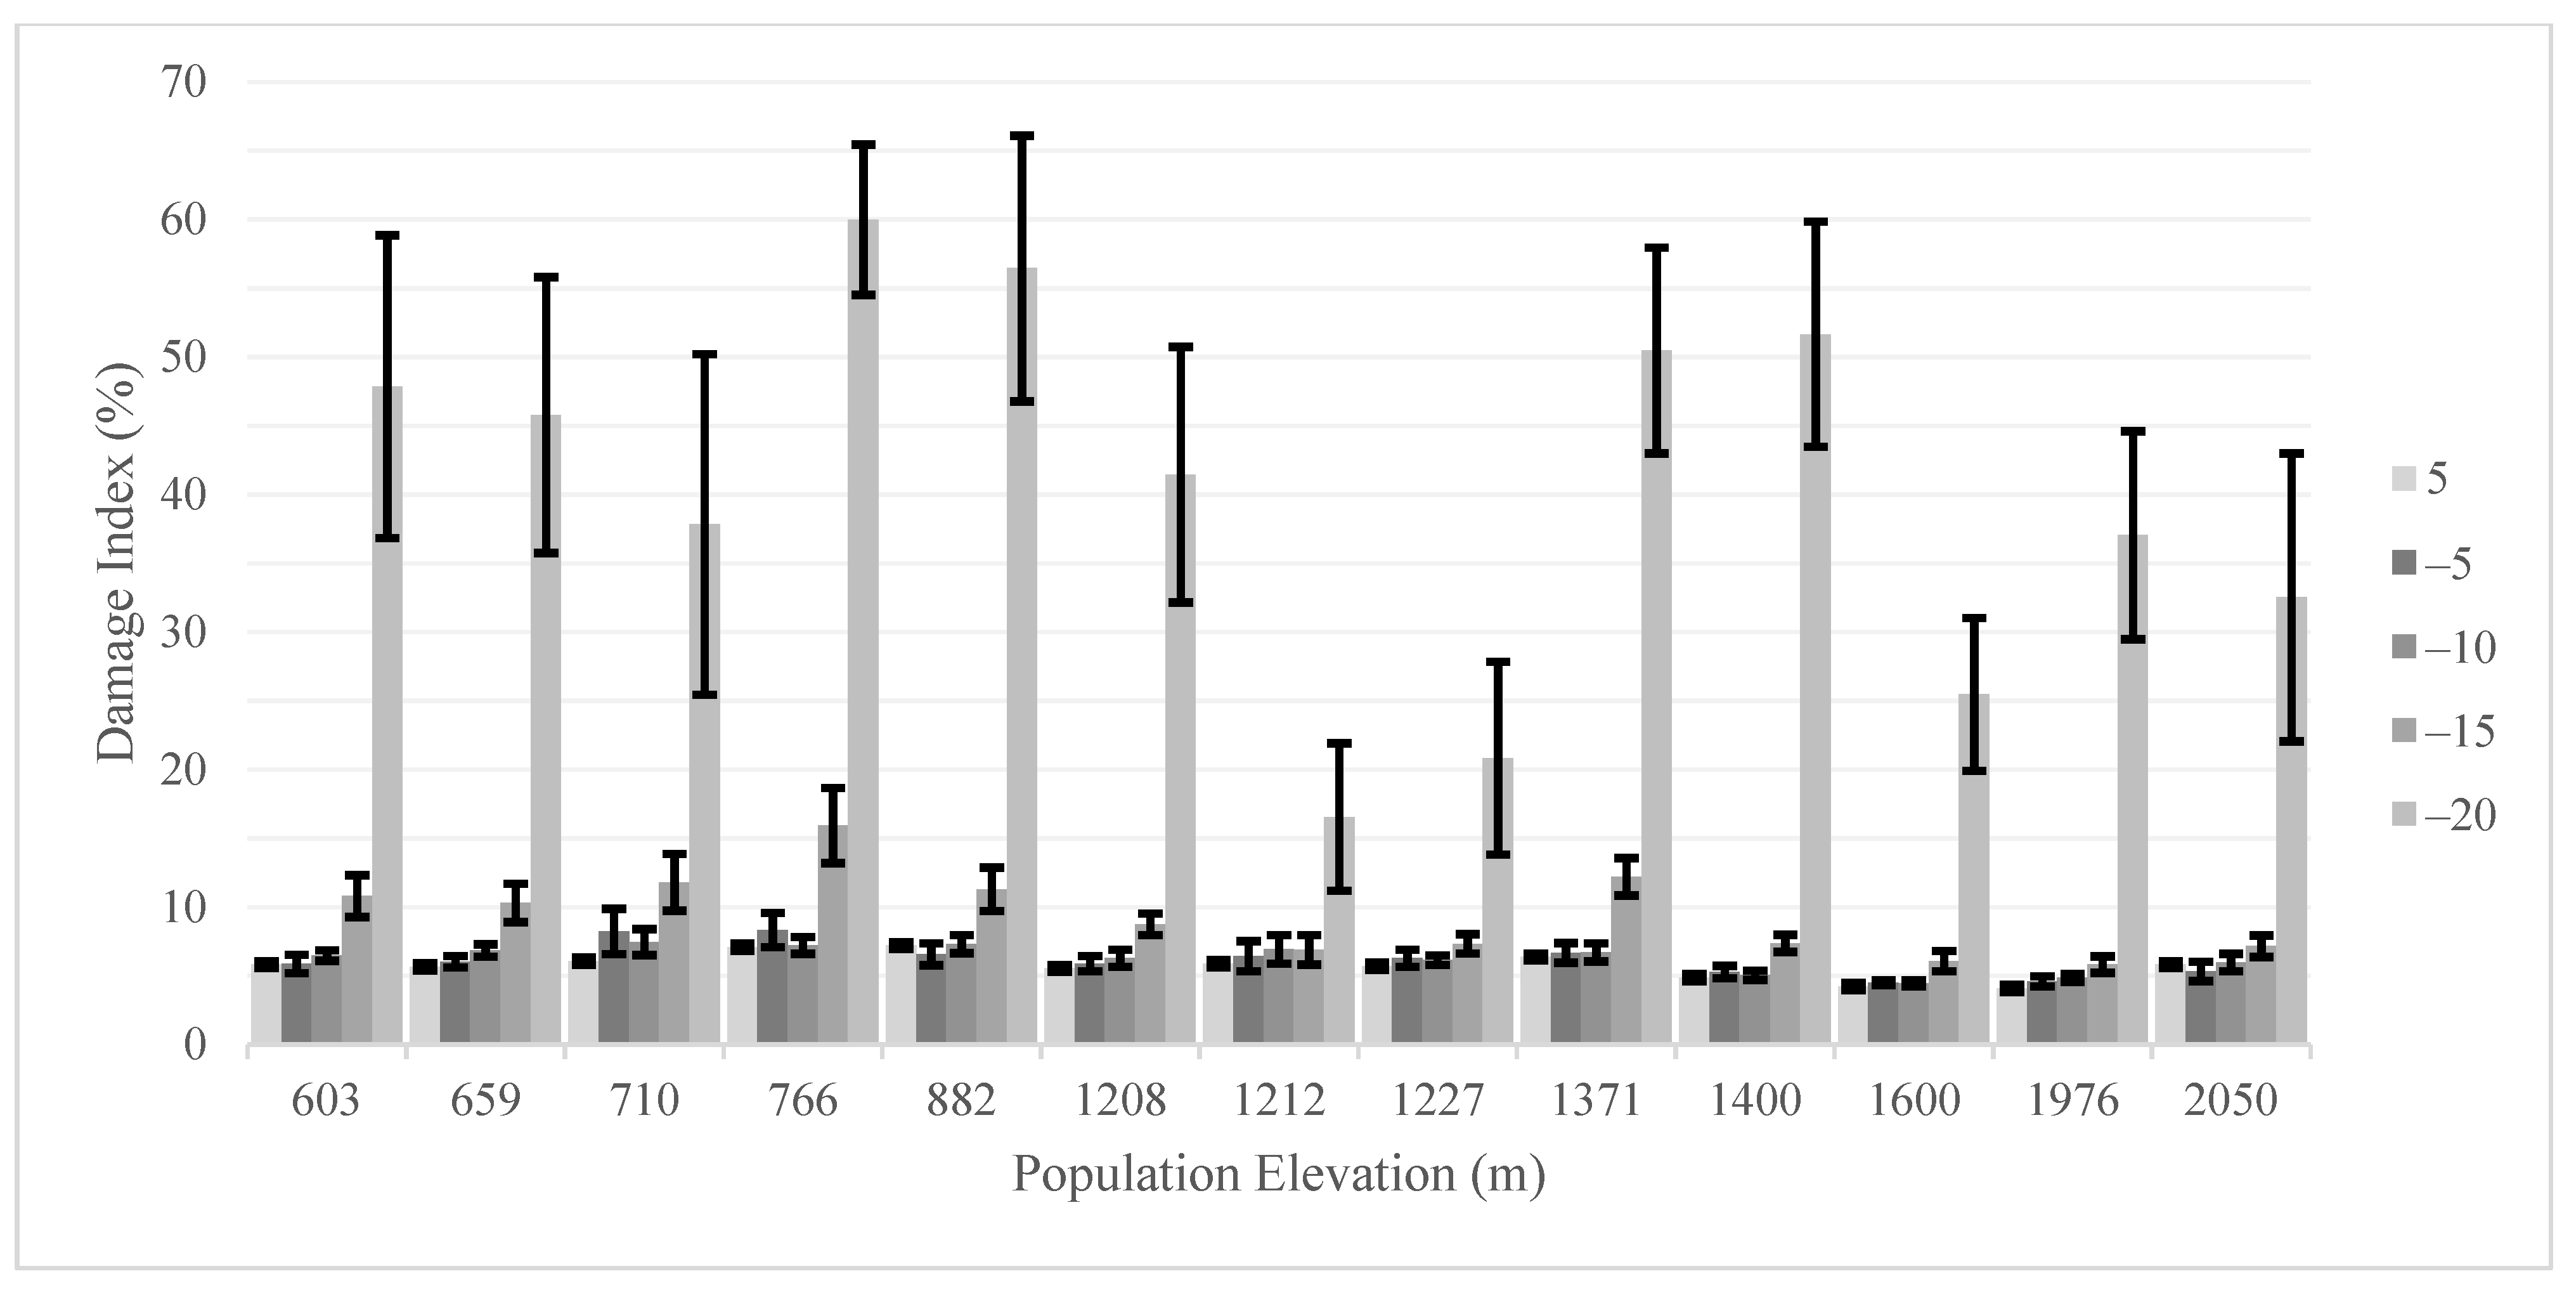
Cold-acclimated samples of populations from elevations of 1600 m and 1976 m showed significantly lower frost damage at −20 °C than samples of populations from nearly all the other elevations, except for the population from an elevation of 1400 m (Figure 3). When exposed to a test temperature of −15 °C, populations from elevations of 603–882 m showed significantly higher frost damage than the populations from higher elevations, except for the populations from elevations of 1208 m, 1371 m, and 2050 m (Figure 3).
Non-acclimated samples of populations from elevations of 603–1208 m showed significantly higher frost damage at −20 °C than the population from an elevation of 1212 m (Figure 4). When exposed to a test temperature of −15 °C, populations from elevations of 603–882 m showed significantly higher frost damage than the populations from higher elevations, except for samples from elevations of 1208 m and 1371 m. When exposed to a test temperature of −10 °C, samples of populations from elevations of 603 m–882 m showed significantly higher frost damage than the samples of populations from elevations of 1400–1976 m (Figure 4).
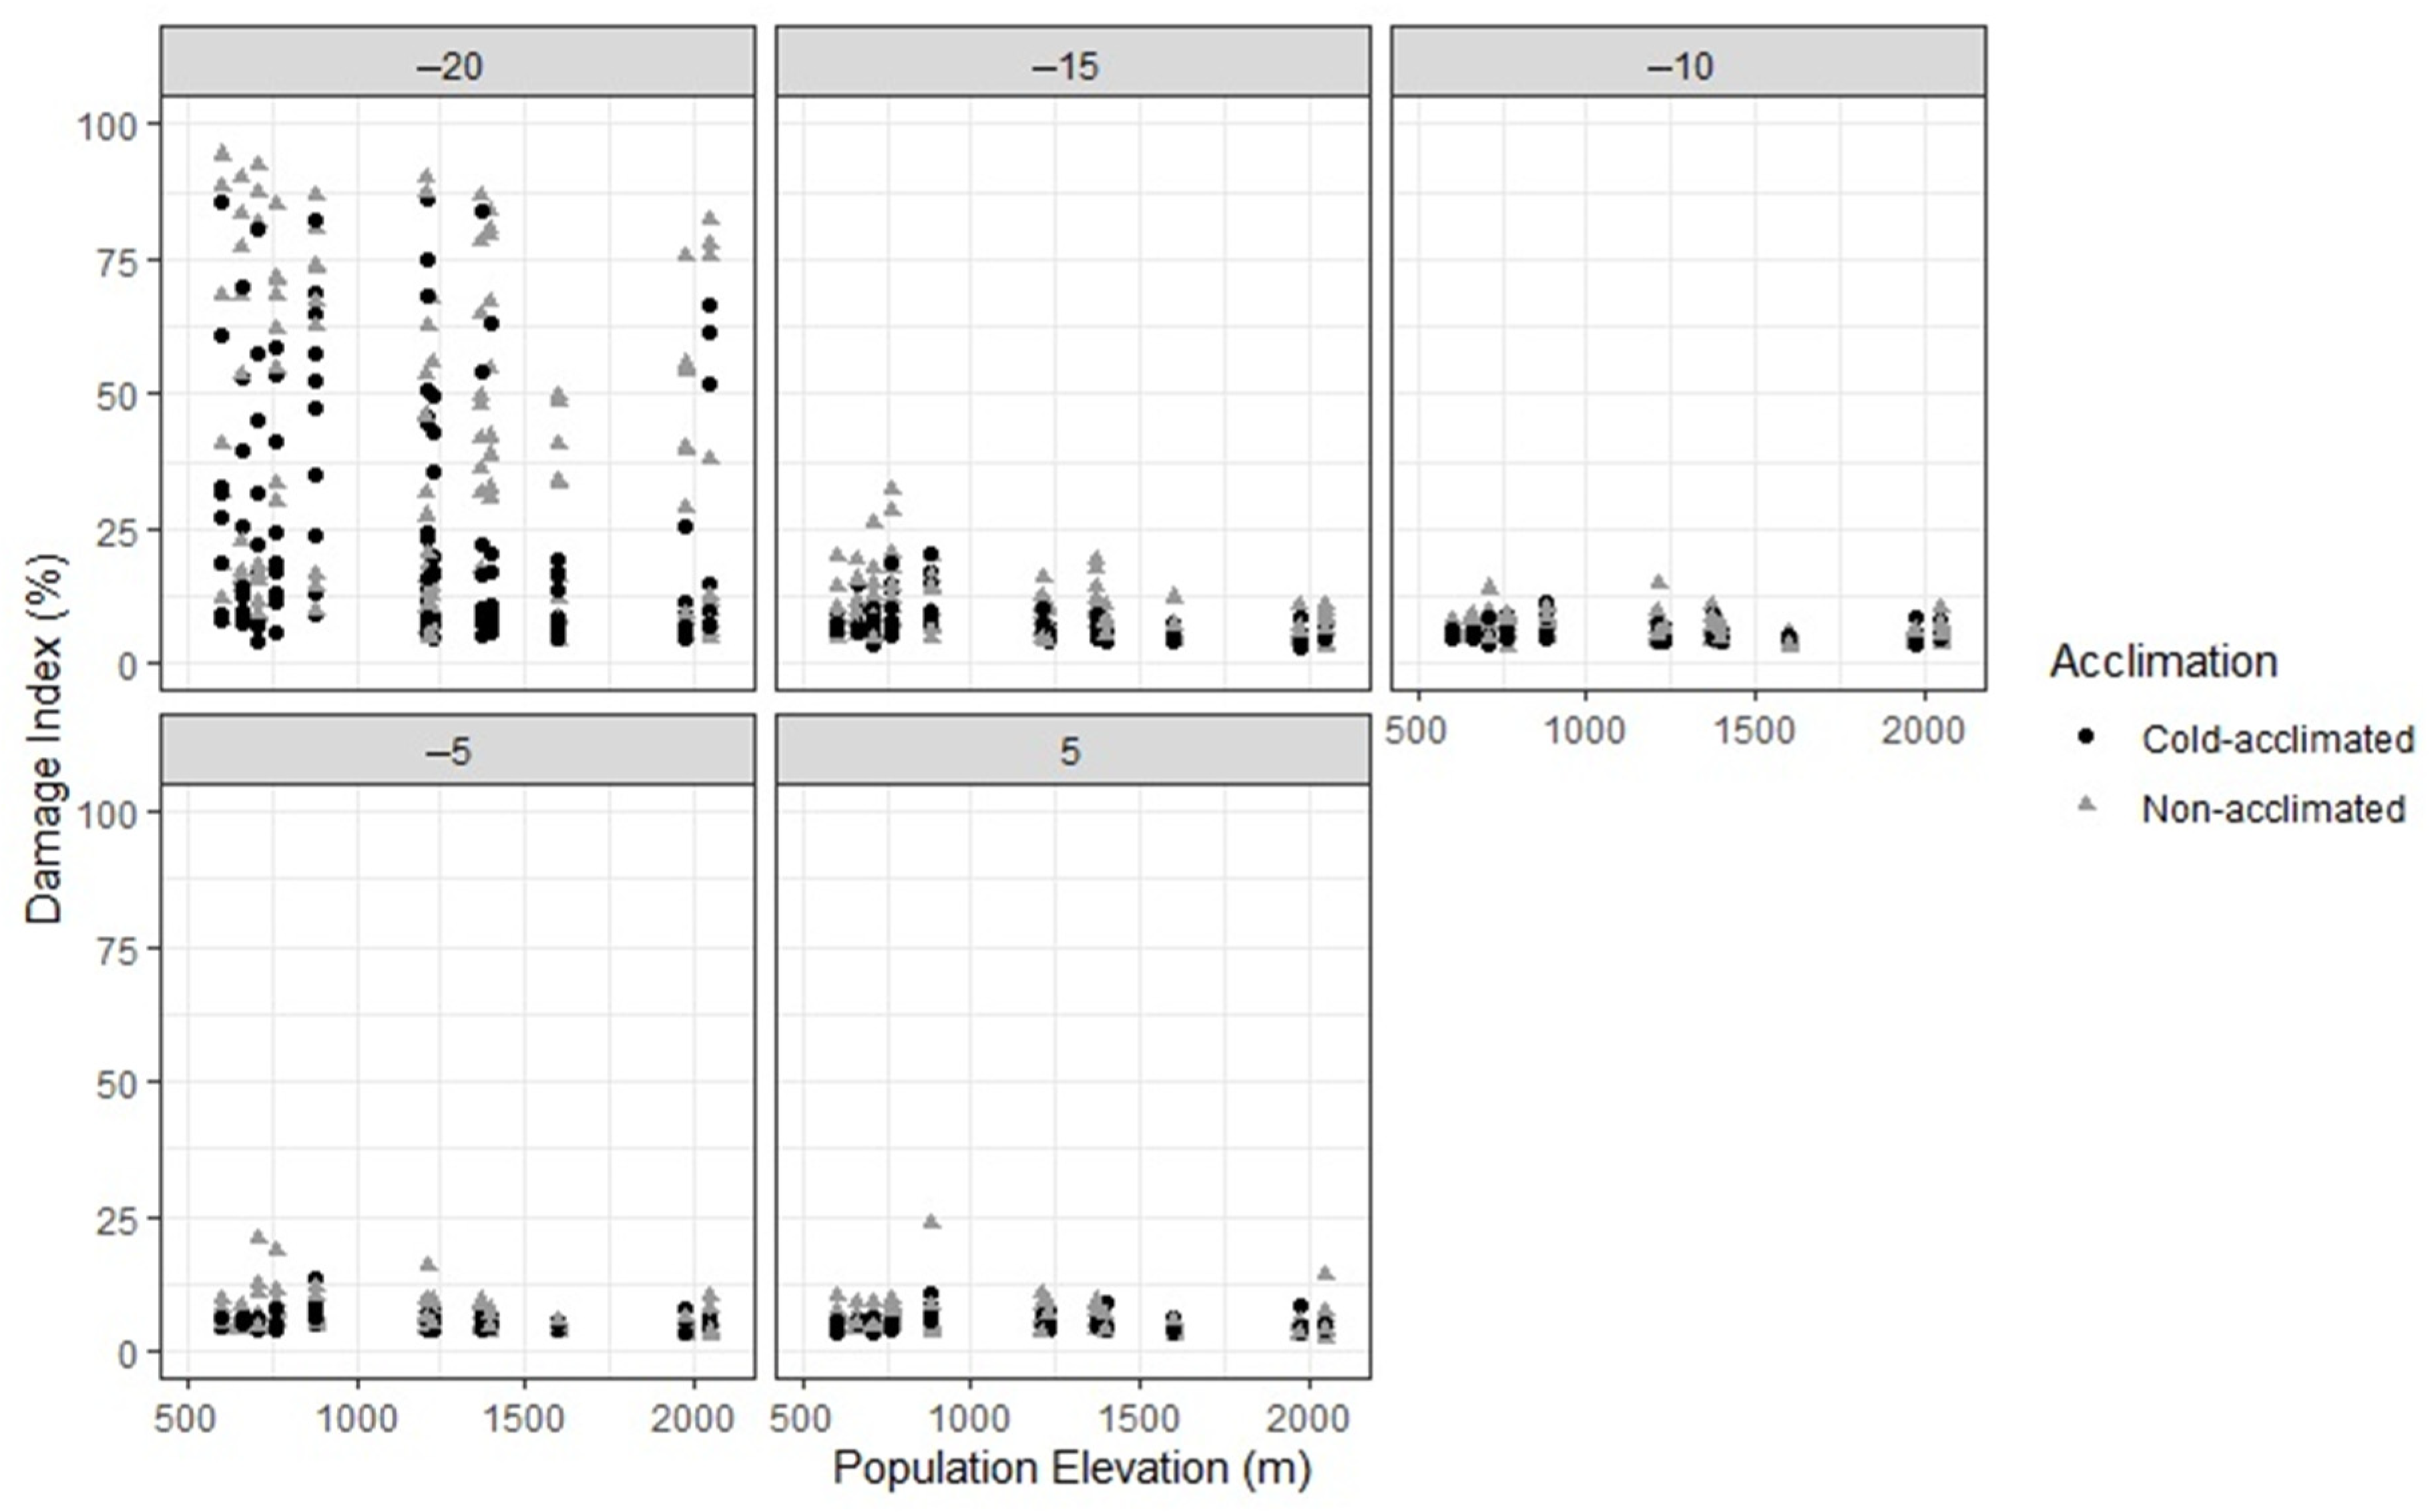
Samples from some of the populations reached 50% freeze damage (LT50), but only when exposed to the lowest test temperatures of −20 °C (Figure 5). Thus, we could not calculate LT50, because not all the populations reached an average of 50% damage. Non-acclimated seedlings from populations corresponding to the elevations of 603 m, 659 m, 710 m, 766 m, 882 m, 1208 m, 1371 m, and 1400 m reached an average of 50% damage when exposed to −20 °C. On the other hand, only samples corresponding to the elevation of 882 m in the cold-acclimated group reached an average of 50% damage when exposed to −20 °C.

4. Discussion

Results from our study on koa showed a higher index of cold damage in non-acclimated seedlings for most of the populations at the coldest test temperatures. These results are consistent with those of a previous study showing that koa trees at higher elevations undergo hardening during winter under ambient field conditions in Hawai’i, i.e., winter LT50 values averaged −16.6 °C compared to −12.3 °C during summer [27]. Our results are also consistent with those of Loik and Redar [36], who tested cold acclimation and freezing tolerance of the Great Basin Desert shrub Artemisia tridentata using electrolyte leakage. They observed that when shifting air temperatures from 25 °C/15 °C to 15 °C/5 °C day/night, a significant degree of acclimation (1.5° C) occurred for plants from all three altitudes; seedlings from the highest elevation exhibited the greatest acclimation change. Similarly, a study with Arabidopsis thaliana across a wide range of geographical clines reported that non-acclimated plants showed lower freezing tolerance, estimated from EL measurements [29]. Reduced frost injury in clones of Eucalyptus globulus was also detected in acclimated vs. non-acclimated plants, i.e., when trees were acclimated using progressively lowered air temperatures (10 °C/−2 °C vs. 24 °C/16 °C (day/night)) [28].
We found that several higher elevation koa populations exhibited less frost damage compared to lower elevation populations when subjected to the lowest test temperatures (−15 and −20 °C). These results differed from those of Rueda Krauss [27], who reported no differences in cold hardiness among koa families. Rueda Krauss [27] used 9-year-old trees rather than seedlings as in our study, however, and tested koa families from higher elevations (1583–2041 m) compared to the range in our study (603–2050 m). Our findings were similar to the population-specific differences in freezing resistance observed in the dominant Hawaiian forest tree species Metrosideros polymorpha (Gaudich.) [37]. Samples for that study were collected along an elevational gradient from sea level to tree line (approximately 2500 m) on the eastern flank of the Mauna Loa volcano, on the Island of Hawai’i [37]. In the study by Melcher et al. [37], leaves of low-elevation field plants exhibited damage at −2 °C—before the onset of ice formation, which occurred at −5.7 °C—while leaves of high-elevation plants exhibited damage at approximately −8.5 °C, concurrent with ice formation in the leaf tissue. They concluded that differences among sources in the capacity for supercooling resulted in resistance to freezing under native conditions.
We could not calculate LT50 from our data because not all of the koa populations reached 50% average freeze damage (LT50). However, given that our samples reached 50% damage only when exposed to −20 °C, we conclude that the LT50 of many of the populations ranged between −20 and −15 °C. Our ability to calculate LT50 would have been improved by decreasing the lowest temperature to −25 °C and concentrating our test temperatures between −15 and −25 °C. In measuring leakage from well-acclimated woody plants, however, the maximum values obtained at the lowest test temperatures often remain well below the 50% level [38,39,40]. Although most studies of cold tolerance use 50% EL as the critical viability threshold, many plants perish after suffering more than 30% EL [41,42,43].
Our data produced several results that were difficult to explain. For example, while cold-acclimated seedlings showed lower frost damage than non-acclimated seedlings for nearly all populations, two of our populations (from elevations of 1212 m and 1227 m) were exceptions to this trend (Figure 2). Additionally, the frost tolerance of our cold-acclimated seedlings from the highest elevation population (2050 m) was not significantly different from that of the lower elevation populations (Figure 4). These results may have been associated with the adaptation of the different populations to the specific land cover, microclimate, and topographical characteristics of the collection sites. This represents an avenue for future study.

5. Conclusions

We found evidence of responsiveness to cold acclimation and adaptation for frost tolerance among populations of koa—a tropical forest tree species that occurs over a wide elevational gradient in Hawai’i. For most populations, at the lowest freeze test temperatures we observed lower cold damage overall in cold-acclimated seedlings than in non-acclimated seedlings. When acclimated to cold, some higher elevation populations showed greater cold tolerance than populations from lower elevations. Based on our results, we suggest that cold acclimation could be a useful tool to prepare koa seedlings to be planted in high-elevation areas prone to freezing winter temperatures. Practically, this could be accomplished by transporting seedlings from lower elevation nurseries to acclimate at higher elevation zones representative of the planting sites at least several weeks prior to planting.

Author Contributions

Conceptualization, L.M.A.-J. and D.F.J.; data curation, L.M.A.-J.; formal analysis, L.M.A.-J.; funding acquisition, L.M.A.-J. and D.F.J.; investigation, L.M.A.-J., K.E.W. and D.F.J.; methodology, L.M.A.-J., K.E.W. and D.F.J.; project administration, D.F.J.; resources, D.F.J.; software, L.M.A.-J.; supervision, K.E.W. and D.F.J.; validation, L.M.A.-J., K.E.W. and D.F.J.; visualization, L.M.A.-J., K.E.W. and D.F.J.; writing—original draft, L.M.A.-J.; writing—review and editing, K.E.W. and D.F.J. All authors have read and agreed to the published version of the manuscript.

Funding

This research was funded by the USDA National Institute of Food and Agriculture, McIntire Stennis project IND011535, the USDA Forest Service, the National Program of Foreign Postgraduate Scholarships “Don Carlos Antonio López” (BECAL), and the Fulbright Foreign Student Program.

Data Availability Statement

The data presented in this study are openly available in Purdue University Research Repository at doi:10.4231/02BW-DK53, https://purr.purdue.edu/publications/3847/1.

Acknowledgments

We give thanks to Brian Beheler, Andrea Brennan, Nieves Brunet, Nicholas Carpita, Clément Charuel, Nathan Deppe, Aziz Ebrahimi, JB Friday, Nathan Hilliard, Utsav Jain, Yiwei Jiang, Bradley Kaufmann, Daniel Little, Akane Ota, Patrick O’Neil, Indira Paudel, Caleb Redick, Andrés Sanabria, Weston Schempf, Anna Sugiyama, Emily Thyroff, Mario Torres, Rosario Uribe, Mercedes Uscola, Mariam Valladares, Tania Vargas, and Yueyun Zhang for their valuable assistance with this project.

Conflicts of Interest

The authors declare no conflict of interest. The use of trade names is for the information and convenience of the reader, and does not imply official endorsement or approval by the USDA or the Forest Service of any product to the exclusion of others that may be suitable.

References

  1. Rose, R.; Carlson, W.C.; Morgan, P. The Target Seedling Concept. In Proceedings of the Target Seedling Symposium, Combined Meeting of the Western Forest Nursery Assoc. Gen. Tech. Rep. RM-200, Roseburg, OR, USA, 13–17 August 1990; Rose, R., Campbell, S.J., Landis, T.D., Eds.; US Dept Agric Forest Serv Rocky Mtn Forest Range Exp Sta: Ft Collins, CO, USA, 1990. 286p. [Google Scholar]
  2. Landis, T.D.; Dumroese, R.K. Applying the target plant concept to nursery stock quality. In Plant Quality: A Key to Success in Forest Establishment; MacLennan, L., Fennessy, J., Eds.; National Council Forest Res Develop: Dublin, Ireland, 2006; pp. 1–10. [Google Scholar]
  3. Dumroese, R.K.; Landis, T.D.; Pinto, J.R.; Haase, D.L.; Wilkinson, K.W.; Davis, A.S. Meeting forest restoration challenges: Using the target plant concept. Reforesta 2016, 1, 37–52. [Google Scholar] [CrossRef] [Green Version]
  4. Warrington, I.J.; Rook, D.A. Evaluation of techniques used in determining frost tolerance of forest planting stock: A review. N. Z. J. For. Sci. 1980, 10, 116–132. [Google Scholar]
  5. Krasowski, M.J.; Simpson, D.G. Frost-Related Problems in the Establishment of Coniferous Forests. In Conifer Cold Hardiness; Bigras, F.J., Colombo, S.J., Eds.; Springer: Dordrecht, The Netherlands, 2001; pp. 253–285. [Google Scholar] [CrossRef]
  6. Wallin, E.; Gräns, D.; Jacobs, D.F.; Lindström, A.; Verhoef, N. Short-day photoperiods affect expression of genes related to dormancy and freezing tolerance in Norway spruce seedlings. Annals For. Sci. 2017, 74, 59. [Google Scholar] [CrossRef] [Green Version]
  7. Malmqvist, C.; Wallertz, K.; Johansson, U. Survival, early growth and impact of damage by late-spring frost and winter desiccation on Douglas-fir seedlings in southern Sweden. New For. 2018, 49, 723–736. [Google Scholar] [CrossRef] [PubMed] [Green Version]
  8. Wilkinson, K.M.; Elevitch, C.R. Growing Koa, a Hawaiian Legacy Tree, 1st ed.; Permanent Agriculture Resources (PAR): Holualoa, HI, USA, 2003. [Google Scholar]
  9. Baker, P.J.; Scowcroft, P.G.; Ewel, J.J. Koa (Acacia koa) Ecology and Silviculture, General Technical Report; United States Department of Agriculture Forest: Washington, DC, USA, 2009.
  10. Scott, J.M.; Mountainspring, S.; Ramsey, F.L.; Kepler, C.B. Forest bird communities of the Hawaiian Islands: Their dynamics, ecology, and conservation. Stud. Avian Biol. 1986, 9, 1–431. [Google Scholar]
  11. Little, E.L.; Skolmen, R.G. Common Forest Trees of Hawaii (Native and Introduced). In USDA Forest Service Agriculture Handbook No; U.S. Department of Agriculture: Washington, DC, USA, 1989; Volume 679. [Google Scholar]
  12. Yanagida, J.F.; Friday, J.B.; Illukpitiya, P.; Mamiit, R.J.; Edwards, Q. Economic value of Hawai’i’s forest industry in 2001. Econ. Issues 2004, 7, 1–3. [Google Scholar]
  13. Scowcroft, P.G.; Jeffrey, J. Potential significance of frost, topographic relief, and Acacia koa stands to restoration of mesic Hawaiian forests on abandoned rangeland. For. Ecol. Manag. 1999, 114, 447–458. [Google Scholar] [CrossRef]
  14. Friday, J.B.; Cordell, S.; Giardina, C.P.; Inman-Narahari, F.; Koch, N.; Leary, J.J.K.; Litton, C.M.; Trauernicht, C. Future directions for forest restoration in Hawaii. New For. 2015, 46, 733–746. [Google Scholar] [CrossRef]
  15. Pejchar, L.; Press, D.M. Achieving conservation objectives through production forestry: The case of Acacia koa on Hawaii Island. Environ. Sci. Policy 2006, 9, 439–447. [Google Scholar] [CrossRef]
  16. Wagner, W.L.; Herbst, D.R.; Sohmer, H.S. Manual of the Flowering Plants of Hawaii; Bernice, P., Ed.; University of Hawaii Press: Bishop Museum Press: Honolulu, HI, USA, 1990. [Google Scholar]
  17. Mueller-Dombois, D. Forest dynamics in Hawai’i. Trends Ecol. Evol. 1987, 2, 216–220. [Google Scholar] [CrossRef]
  18. Elevitch, C.R.; Wilkinson, K.M.; Friday, J.B. Acacia koa (koa) and Acacia koaia (koai‘a). In Species Profiles for Pacific Island Agroforestry; Elevitch, C.R., Ed.; Permanent Agriculture Resources (PAR): Holualoa, HI, USA, 2006. [Google Scholar]
  19. Dudley, N.S.; Jones, T.C.; James, R.L.; Sniezko, R.A.; Cannon, P.; Borthakur, D. Applied disease screening and selection program for resistance to vascular wilt in Hawaiian Acacia koa. South. For. 2015, 77, 65–73. [Google Scholar] [CrossRef]
  20. Scowcroft, P.G.; Meinzer, F.C.; Goldstein, G.; Melcher, P.J.; Jeffrey, J. Moderating night radiative cooling reduces frost damage to Metrosideros polymorpha seedlings used for forest restoration in Hawaii. Rest. Ecol. 2000, 8, 161–169. [Google Scholar] [CrossRef]
  21. Rose, K.M.E.; Friday, J.B.; Oliet, J.A.; Jacobs, D.F. Canopy openness affects microclimate and performance of underplanted trees in restoration of high-elevation tropical pasturelands. Agric. For. Meterol. 2020, 292–293, 108105. [Google Scholar] [CrossRef]
  22. National Climatic Data Center, n.d. Hawaii Annual Temperatures and Extremes. Available online: http://coolweather.net/statetemperature/hawaii_temperature.htm (accessed on 4 May 2019).
  23. Western Regional Climate Center, n.d. Climate of Hawaii. Available online: https://wrcc.dri.edu/narratives/HAWAII.htm (accessed on 4 May 2019).
  24. Allen, J.A. Acacia koa A. Gray. In Tropical Tree Seed Manual: Part II, Species Descriptions; U.S. Department of Agriculture: Washington, DC, USA, 2002; pp. 253–255. [Google Scholar]
  25. Lipp, C.C.; Goldstein, G.; Meinzer, F.C.; Niemczura, W. Freezing tolerance and avoidance in high-elevation Hawaiian plants. Plant Cell Environ. 1994, 17, 1035–1044. [Google Scholar] [CrossRef]
  26. University of Hawai’i at Manoa. Mean Annual Air Temperature-State of Hawaii. 2014. Available online: http://evapotranspiration.geography.hawaii.edu/assets/files/MapImages/AirTemp_MeanAnn.jpg (accessed on 23 October 2018).
  27. Rueda Krauss, O. Parent Tree Selection and Evaluation of Frost Resistance, Wood Quality, and Seed Relatedness of Acacia koa. Open Access Theses 245. 2014. Available online: http://docs.lib.purdue.edu/open_access_theses/245 (accessed on 19 June 2018).
  28. Costa e Silva, F.; Shvaleva, A.; Broetto, F.; Ortuño, M.F.; Rodrigues, M.L.; Almeida, M.H.; Chaves, M.M. and Pereira, J.S. Acclimation to short-term low temperatures in two Eucalyptus globulus clones with contrasting drought resistance. Tree Physiol. 2009, 29, 77–86. [Google Scholar] [CrossRef]
  29. Zuther, E.; Schulz, E.; Childs, L.H.; Hincha, D.K. Clinal variation in the non-acclimated and cold-acclimated freezing tolerance of Arabidopsis thaliana accessions. Plant Cell Environ. 2012, 35, 1860–1878. [Google Scholar] [CrossRef]
  30. Ritchie, G.A. Measuring Cold Hardiness. In Techniques and Approaches in Forest Tree Ecophysiology; Lassoie, J.P., Hinckley, T.M., Eds.; CRC Press: Boca Raton, FL, USA, 1991; pp. 557–582. [Google Scholar]
  31. Haase, D.L. Seedling phenology and cold hardiness: Moving targets. In National Proceedings: Forest and Conservation Nursery Associations-2010; Riley, L.E., Haase, D.L., Pinto, J.R., Eds.; Proc. RMRS-P-65; USDA Forest Service, Rocky Mountain Research Station: Fort Collins, CO, USA, 2011; pp. 121–127. [Google Scholar]
  32. Jacobs, D.F.; Wilson, B.C.; Ross-Davis, A.L.; Davis, A.S. Cold hardiness and transplant response of Juglans nigra seedlings subjected to alternative storage regimes. Ann. For. Sci. 2008, 65, 606. [Google Scholar] [CrossRef] [Green Version]
  33. R Core Team. A Language and Environment for Statistical Computing; R Foundation for Statistical Computing: Vienna, Austria, 2019. [Google Scholar]
  34. Bates, D.; Mächler, M.; Bolker, B.M.; Walker, S.C. Fitting linear mixed-effects models using lme4. J. Stat. Softw. 2015, 67. [Google Scholar] [CrossRef]
  35. Kuznetsova, A.; Brockhoff, P.B.; Christensen, R.H.B. lmerTest Package: Tests in Linear Mixed Effects Models. J. Stat. Softw. 2017, 82. [Google Scholar] [CrossRef] [Green Version]
  36. Loik, M.E.; Redar, S.P. Microclimate, freezing tolerance, and cold acclimation along an elevation gradient for seedlings of the Great Basin Desert shrub, Artemisia tridentata. J. Arid Environ. 2003, 54, 769–782. [Google Scholar] [CrossRef] [Green Version]
  37. Melcher, P.J.; Cordell, S.; Jones, T.J.; Scowcroft, P.G.; Niemczura, W.; Giambelluca, T.W.; Goldstein, G. Supercooling capacity increases from sea level to tree line in the Hawaiian tree species Metrosideros polymorpha. Int. J. Plant Sci. 2000, 161, 369–379. [Google Scholar] [CrossRef] [PubMed]
  38. Hadley, J.L.; Amundson, R.G. Effects of radiational heating at low air temperature on water balance, cold tolerance, and visible injury of red spruce foliage. Tree Physiol. 1992, 11, 1–17. [Google Scholar] [CrossRef]
  39. Sutinen, M.-L.; Palta, J.P.; Reich, P.B. Seasonal differences in freezing stress resistance of needles of Pinus nigra and Pinus resinosa: Evaluation of the electrolyte leakage method. Tree Physiol. 1992, 11, 241–254. [Google Scholar] [CrossRef] [Green Version]
  40. Islam, M.A.; Apostol, K.G.; Jacobs, D.F.; Dumroese, R.K. Fall fertilization of Pinus resinosa seedlings: Nutrient uptake, cold hardiness, and morphological development. Ann. For. Sci. 2009, 66, 7. [Google Scholar] [CrossRef] [Green Version]
  41. Palta, J.P.; Jensen, K.G.; Li, P.H. Cell membrane alterations following a slow freeze-thaw cycle: Ion leakage, injury and recovery. In Plant Cold Hardiness and Freezing Stress. Mechanisms and Crop Implications; Li, P.H., Sakai, A., Eds.; Academic Press: New York, NY, USA, 1982; Volume 2, pp. 221–242. [Google Scholar]
  42. Peixoto, M.M.; Friesen, P.C.; Sage, R.F. Winter cold-tolerance thresholds in field-grown Miscanthus hybrid rhizomes. J. Exp. Bot. 2015, 66, 4415–4425. [Google Scholar] [CrossRef] [PubMed] [Green Version]
  43. Peixoto, M.D.M.; Sage, R.F. Improved experimental protocols to evaluate cold tolerance thresholds in Miscanthus and switchgrass rhizomes. GCB Bioenergy 2016, 8, 257–268. [Google Scholar] [CrossRef] [Green Version]
Figure 1. Interaction effects between test temperature (5, −5, −10, −15, and −20 °C) and acclimation treatment on the damage index (%) of samples averaged across koa population elevations (from 603 m to 2050 m). Each box represents the mean (±SE, standard error) damage index (%). Black dashes inside the boxes represent the means.
Forests 12 01089 g001
Figure 2. Interaction effects between the elevation (m) of koa populations and acclimation treatment on the damage index (%) of samples averaged across test temperatures (from 5 to −20 °C). Each box represents the mean (±SE, standard error) damage index (%). Black dashes inside the boxes represent the means.
Forests 12 01089 g002
Figure 3. Mean (±SE, standard error) damage index (%) of frost damage for koa population from a range of elevations and test temperatures. Tissue samples were from cold-acclimated seedlings from 13 populations. Test temperatures consisted of a control at 5 °C, and four freezing temperatures: −5, −10, −15, and −20 °C.
Forests 12 01089 g003
Figure 4. Mean (±SE, standard error) damage index (%) of frost damage for koa populations from a range of elevations and test temperatures. Tissue samples were from non-acclimated seedlings from 13 populations. Test temperatures consisted of a control at 5 °C, and four freezing temperatures: −5, −10, −15, and −20 °C.
Forests 12 01089 g004
Figure 5. Comparison of damage index (%) of cold-acclimated and non-acclimated koa leaf samples. Results at each test temperature (5, −5, −10, −15, and −20 °C) are pooled across all population elevations.
Forests 12 01089 g005
Table 1. Sources, elevation, location, and land cover of the koa populations studied.
PopulationElevation (m)Annual Rainfall (mm)CoordinatesLand Cover
LatitudeLongitude
BK-Saddle 1603570719.67932° N,155.182° WLowland rainforest
BK-Saddle 2659573319.67932° N,155.1899° WLowland rainforest
BK-Saddle 3710577919.69229° N,155.2015° WLowland rainforest
BK-Saddle 4766590319.69476° N,155.2144° WLowland rainforest
BK-Saddle 5882622719.70094° N,155.2353° WLowland rainforest
BK-MLSR 31208187119.43908° N,155.3005° WMontane-subalpine mesic forest
BK-MLSR 21212184619.43338° N,155.2957° WMontane-subalpine dry shrubland
BK-MLSR 11227203619.43358° N,155.2811° WMontane-subalpine mesic forest
Gaspar’s Dairy137189219.48653° N,155.8261° WMontane-subalpine mesic forest
Kona Hema 140080919.19974° N,155.795° WMontane-subalpine mesic forest
Umikoa1600199219.92584° N,155.3476° WIntroduced perennial grassland
BIR1976159319.8569° N,155.3401° WPerennial grassland
BK-MLSR 42050163119.49243° N,155.3865° WMontane-Subalpine Dry Shrubland
Table 2. Conditions of non-acclimated and cold-acclimated koa seedlings. There was a gradual change in the variables per condition during the cold-acclimation procedure.
ConditionsPhotoperiod (Hours)Temp. Day (°C)Temp. Night (°C)RH (%)Watering Interval (Days)Light Intensity (μmol/m2/s)
Greenhouse14~25.5~22.2<~801–2~500
Week 1 growth chamber111510~80–854200
Week 2 growth chamber11126~80–8510200
Week 3 growth chamber1184~80–8510200
Week 4 growth chamber1184~80–8510200
Week 5 growth chamber1184~80–8510200
Week 6 growth chamber1184~80–8510200
Table 3. Results of linear mixed-effects regression.
Fixed EffectsEstimateStd. Error dft ValuePr(>|t|)
(Intercept) 7.961 × 10−13.048 × 10−23.183 × 1026.123<0.001
Population elevation −7.400 × 10−51.889 × 10−51.266 × 10³−3.917<0.001
Test temperature −3.106 × 10−22.086 × 10−31.266 × 10³−14.888<0.001
Acclimation−9.003 × 10−32.838 × 10−26.115 × 10−0.3170.762
(Test temperature)24.658 × 102.149 × 10−11.266 × 10321.672<0.001
Pop. elev. × Test temperature 5.472 × 10−61.519 × 10−61.266 × 1033.603<0.001
Test temperature × Acclimation 8.225 × 10−31.398 × 10−31.266 × 1035.885<0.001
Note: Bold font indicates significant difference.
Publisher’s Note: MDPI stays neutral with regard to jurisdictional claims in published maps and institutional affiliations.