Abstract
Background: The visual forms of individual trees in peri-urban forests are driven by a complex array of simultaneous cause-and-effect relationships. Materials and Methods: Structural Equation Modeling (SEM), as a specialized analytical technique, was used to model and understand the complex interactions. It was applied to find out responses of visual forms to neighboring competition in a peri-urban forest dominated by Cotinus coggygria var. cinerea Engl. in Beijing, China. Research Highlights: Light interception and space extrusion have substantial effects on visual forms, expressed as crown forms and foliage forms. The structural model in SEM tested hypothetical correlations among latent variables, namely neighboring competition, crown forms, and foliage forms. Results: The fitted model suggested a direct negative effect of neighboring competition on crown forms and an insignificant negative direct effect on foliage forms. Moreover, an indirect positive effect on foliage forms mediated by crown forms was revealed. Conclusions: The fitted SEM and associated findings should facilitate peri-urban forest landscape management by providing insight into causal mechanisms of visual forms of individual trees and thereby assisting in the visual quality promotion.
1. Introduction
The peri-urban forest provides a way for people to connect with nature, and visually attractive landscapes make places more enjoyable for outdoor leisure and entertainment [1,2]. Viewing natural plants is linked to human health improvement and stress reduction [3].
Relationships between tree form and aesthetic preference exist. Varied tree forms effectively improve the attractiveness of forest landscapes and enhance tourist experiences [4]. However, researchers concentrated on growth forms in most of the studies about tree forms. Visual forms of trees were less studied because its complication in describing and representing. In this paper, visual forms were used to represent forms of objects that can be discerned under light [5,6,7] and represent the visual aspect of tree forms. Generally, visual forms of trees are determined by genes and adaptation to environmental conditions [8]. Moreover, the diversity of visual forms of the same tree species is affected by many factors such as slope, stand density, genetics, and environmental conditions [9,10]. Besides the influence of stand density and species diversity, it is well known that the size-asymmetric competition by neighboring plants also affects visual forms of crown and trunk [11,12].
Despite the widely recognized negative trends in growth-competition relationships in forests [13,14,15,16], it remains unclear how visual forms respond to neighboring competition. The processes to assess visual forms’ response to neighboring competition involve complicated interactions and many causal relationships. Standard statistical methods, such as analysis of variance [17] (pp. 19–46) and multiple regression [18], may not be enough to follow the mechanisms linking visual forms to the living conditions of trees. A structural equation model (SEM) offers an alternative way to test complicated interactions [19]. Timilsina et al. [20] used SEM to analyze the causal factors of carbon stores of subtropical plants, which used biometric and ecological relationships as part of the model.
In this study, Cotinus coggygria var. cinerea Engl. was treated as the subject tree to investigate the role of neighboring competitions on visual forms of the individual trees in forests. The neighboring competition was described and evaluated in the competitive unit, containing one subject tree and four neighboring trees. Moreover, visual forms described by several traits in core visual parts of trees and trends in relationships between every trait and competition indicators were focused on. Using SEM, 218 competitive units in the Cotinus coggygria forest were set and analyzed to answer the following questions: (i) How do neighboring competitions affect visual forms? (ii) How do crown forms and foliage forms respond to neighboring competition, respectively? (iii) What peri-urban forest managers could do to promote the visual quality of tree forms.
2. Materials and Methodology
2.1. Study Area and Data Collection
The study was carried out in a forest dominated by Cotinus coggygria var. cinerea Engl. in Badaling National Forest Park, Yanqing District, Beijing, China (40°20′46.01″ N, 116°0′52.20″ E). The park encompasses 2933.3 hectares with a 780-m average elevation and experiences a continental monsoon climate zone with semi-humid and warm temperate climates. A mean 10.8 °C annual average temperature occurs with a 160-days frost-free period and 454 mm average annual precipitation mainly concentrated from July to August. The park was the first ecological public welfare forest passed FSC (Forest Stewardship Council) Certification, and there are 539 species of wild vascular plants and 158 species of wild vertebrates in it. Ninety-six percent of the land in the park is covered by trees and plants, which consist of pure Cotinus coggygria forests, broad-leaved mixed forests of Cotinus coggygria with Armeniaca sibirica, and coniferous and broad-leaved mixed forests of Cotinus coggygria with Platycladus orientalis. The stand density is between 1212 trees·ha−1 and 2688 trees·ha−1, the average canopy area is between 0.17 m2 and 58.26 m2, and the average tree height is between 0.7 m and 10.2 m.
In the park, seven 50 m × 50 m sample plots (0.25 ha) of broad-leaved mixed forest of Cotinus coggygria were set with poles and measuring ropes aided by compass. A coordinate system was set in each plot with the origin at the corner with magnetic azimuth 215° of the plot. The X-axis was oriented to magnetic azimuth 90°, and the Y-axis was oriented to magnetic azimuth 0°. Besides, the vertical lines where χ = 0, χ = 10, χ = 20, χ = 30, χ = 40, and χ = 50 and the horizontal lines where y = 0, y = 10, y = 20, y = 30, y = 40, and y = 50 were marked out by measuring ropes. Then, the Cotinus coggygria (stem collar diameter > 2 cm), whose trunk was closest to the intercept point of two measuring ropes, was marked as the subject tree. When all subject trees in a plot were marked, remove all measuring ropes in the plot. The competitive units were set using the point-centered quarter method [21]. The subject tree was treated as the center of the competitive unit, around which four 90° quarters were set clockwise from magnetic azimuth 0° [22] (pp. 86–87). In each quarter, the tree (stem collar diameter > 2 cm) in any species whose trunk was closest to the trunk of the subject tree was chosen as a neighboring tree. In total, 218 competitive units were chosen in the park. All the competitive units were indexed from 1 to 218.
Data were collected as follows. For all five trees in each competitive unit, stem collar diameter was measured at 0.1 m above ground with a diameter tape. Height to the lowest live branch was measured from the ground with a tape. Tree height was measured with a laser altimeter. Crown width was measured with a tape parallel to ground from the trunk to the most distant point in four directions (east, west, south, and north). Additionally, distances between trunks of neighboring trees and the trunk of the subject tree were measured with tape. Moreover, current year twig and leaves were sampled from the upper, middle, and lower layers of the crown of the subject tree at a random direction according to the particular order. If the index of a competitive unit was divided by 4 with a reminder of 0, the north crown was selected, and 1 for the east, 2 for the south, 3 for the west. The base diameter of the current year twig was measured with an electronic vernier caliper. The fresh and dry weight of leaves were measured with an electronic balance. A scanner (EPSON V39) and Image J (National Institutes of Health, https://imagej.nih.gov/ij/ accessed on 10 August 2019) software were employed to quantify the area of leaves after removing petioles. Moreover, fresh leaves were killed at 80 °C in a drying baker and dried to constant weight at 105 °C, and the fresh and dry leaves were weighed with an electronic balance. The measurement accuracy and named abbreviation of measured traits are shown in Table 1.

Table 1.
Named abbreviation (Abbr.) and measurement accuracy of measured traits.
2.2. Overview of Our Approach
To describe visual forms of the subject tree, six primary traits of crown, leaves, and twigs were selected. The definition of visual forms was suggested as a unified whole to present the visual aspects of tree forms (see Section 2.3). Cotinus coggygria, as a multiple-branching deciduous tree with an open, spreading, irregular crown, was treated as subject trees. It is more complicated to estimate and evaluate the competition it suffered from neighboring trees than a single trunk deciduous tree with a broad, rounded crown. Therefore, we redefined competition caused by neighboring trees referring to the proposed competition indexes (see Section 2.4). To determine the relevancy of visual traits and neighboring competition, each competition indicator was divided into four continuous disjoint intervals by their quartiles (0–25%, 25–50%, 50–75%, 75–100%). Furthermore, all selected traits in every interval were summarized, respectively).
A structural equation model (SEM) was used for testing hypothetical relationships among all observed variables [19,23] in this study. As the application of SEM requires a set of well-defined hypotheses generated from theoretical considerations, previous knowledge, and personal observation [24], three hypotheses about neighboring competition and visual forms (see Section 2.5) were proposed. We transformed complex interactions into directional path networks for linking observed variables and then constructed latent variables and the structural model based on proposed hypotheses (see Section 2.6).
The SEM was evaluated from multivariate data collected in 218 competitive units. Moreover, some basic fit statistics were selected from the comprehensive listing of indexes and criteria provided by Kline [25] and Schumacker and Lomax [23] to assess model fit. Furthermore, results that indicate the cause-and-effect relationships were analyzed with the proposed hypotheses.
2.3. Visual Forms of the Individual Tree
In visual arts, form refers to three-dimensional objects with a volume of height, width, and depth [26]. Visual forms in this paper represent the visual aspects of individual trees, which were considered the three-dimensional physical entity with aesthetic value. Visual forms used in the study idealized some structural complexity of tree shapes, which referred to the reciprocal arrangement between the different organs. For example, the geometry and topology of the tree crown were abstracted as a simple circle.
The height of a dominant tree species and the shape of its foliage determine the overall landscape of many terrestrial plant communities [27]. This paper described the visual forms of a tree as two different systematic units, namely crown forms and foliage forms. Owing to the multiple-branch features, the trunks of Cotinus coggygria are generally short, so crown forms in this study were represented as the combination of trunk form and crown form. Furthermore, the visual forms of an individual tree were roughly divided into four categories according to the value of crown form and foliage form. In Figure 1, we see four different categories of visual forms laid out along two dimensions. The dimension on the horizontal axis is concerned with crown forms, whereas the ones on the vertical axis address foliage forms. The foliage forms of trees in the categories on top are dense, while the foliage forms in the bottom categories are sparse. The trees in categories on the left are with a small crown, and the ones on the right are with a large crown.
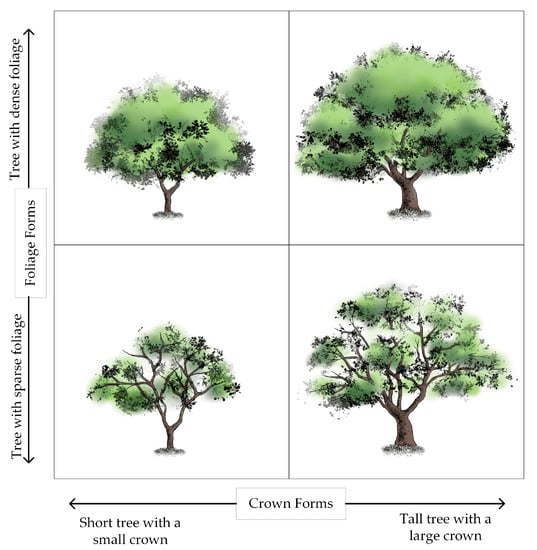
Figure 1.
Some visual forms of an individual tree, organized into four categories. Four different visual forms were laid out along two dimensions, referred to crown forms and foliage forms.
In this study, three traits, namely tree height, crown width, and crown length, were selected from collected data to depict crown forms. Moreover, dry weight and total area of leaves on current year twigs and the base diameter of current year twigs were another three primary traits selected to represent foliage forms. Table 2 presents descriptive statistics of observed variables used to depict crown forms and foliage forms.
Table 2.
Descriptive statistics of visual form traits (n = 218).
2.4. Neighboring Competition
Neighboring competition in this paper referred to that trees in a competitive unit compete for growing space and sunlight. The growth states and visual forms of subject trees were directly linked to their capability to obtain growing space and presumably resource uptake [28,29]. Moreover, the crown structure of a subject tree could be affected by neighboring trees that occupy growing space [30] and absorb sunlight [31].
Trees in a competitive unit share growing space. Bella [32] proposed a model, competitive influence zone overlap, to describe and evaluate inter-tree competitions. Moreover, the influence zone was defined as an area over which the tree obtains or competes for site factors [33]. In the study, competitive influence zone overlap was used as a measurable surrogate for space competition. Figure 2 shows the influence zone overlap between trees in a competitive unit. The maximum zone of influence of a species is related to its open-grown crown size [32]. Tree crowns were simplified as circles with a radius calculated from the average crown width in four directions [34]. The space competition (SC) could be calculated in formula 1, in which AOi, the overlapping area of the ith neighboring tree, could be calculated by the law of cosines and sector area formula. The A0 refers to the crown projected area of the subject tree.
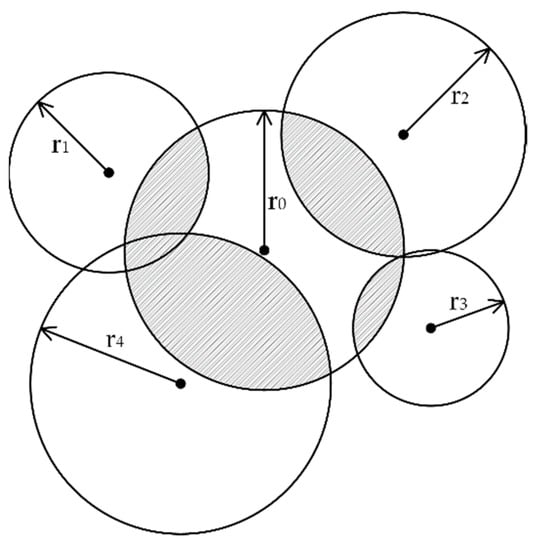
Figure 2.
Overlap area of subject tree (the dark part). The crown width of subject tree was r0, crown widths of neighboring trees were r1, r2, r3, and r4.
Each tree attempts to maximize the net productivity under the light environment, which is determined by neighboring trees [27]. Trees with a higher crown than their neighbors can avoid shading by competitors and will enjoy likely be more productive. More accurately, sunlight intensity would increase with relative tree height, as a relatively tall tree with taller neighbors would still be shaded. In the broad-leaved forest, crown shyness, which describes the phenomenon whereby tree crowns avoid growing into each other, producing a puzzle-like pattern of complementary tree crowns in the canopy [35], was found between individual trees [36]. As competitions lead to trees growing asymmetrical crowns instead of their ideal symmetrical shape, measurements related to tree size rather than that representative of the ideal symmetrical shape were chosen. Therefore, the stem collar diameter of neighboring trees (CDi) and distances (disti) between neighboring trees and the subject tree should be considered. Sunlight competition (LC) in Formula 2 from Smith and Bell [37].
When two trees of different sizes compete in a forest stand, they do not affect each other equally. To maintain a higher growth rate with a generally lower metabolic efficiency, the larger tree must exploit the site considerably beyond what is proportional to its size [38]. In other words, trees with larger biomass usually dominate the competitive units [39]. Moreover, the smaller tree with a lower growth rate and higher metabolic efficiency can exist on fewer resources than its proportional share. Thus, the growth state of trees should also be considered in the description and evaluation of inter-tree competition. Relative competitiveness (RC) was defined to depict the relative pressure subject trees suffered to obtain living resources in a competitive unit. The relative competitiveness could be calculated in Formula 3, where CW0 refers to the crown width of the subject tree, and the CWi refers to the crown width of the ith neighboring tree. Table 3 presents descriptive statistics of three neighboring competition indicators used in the study.
Table 3.
Descriptive statistics of neighboring competition indicators (n = 218).
2.5. Hypotheses
According to theoretical considerations, previous knowledge, and personal observation, three hypotheses about neighboring competition and visual forms of trees were proposed.
Hypothesis 1 (H1).
Neighboring competition directly affects crown forms.
Trees growing under different light conditions have very different crown shapes, which has been explained as an optimal strategy [40]. For example, the crown of an isolated oak tree is of a hemispherical shape, in which the amount of trunk and branches appear to be the minimum necessary to keep the leaves apart from each other. In contrast, a dominant oak of the same species growing in a dense forest has a long trunk, and the foliage is more so at the top part of the trunk. Additionally, a tree with a long trunk and a higher crown than its neighbors can avoid shading by competitors and will likely result in greater photosynthetic productivity [27]. A similar hypothesis could be suggested in the forest dominated by Cotinus coggygria.
Hypothesis 2 (H2).
Neighboring competition affects foliage forms directly and indirectly mediated by crown forms.
Trees compete with each other and with other plants for the sunlight available on a site. When trees get over-topped and shaded by others, their access to sunlight is reduced or eliminated. The leaves on shaded conduct reduced photosynthesis but still cost the plant energy, nutrients, and water to maintain. These branches generally die and may self-prune after they can no longer maintain themselves. Therefore, it is hypothesized that neighboring competition directly affects foliage forms.
Plant growth was a process in which leaves grow, and then more light was captured through photosynthesis to produce and continue the plant growth as estimated by dry mass [41]. The total leaf area should be coordinated with stem diameter for both mechanical [42] and hydraulic reasons [43]. Moreover, the higher part of the foliage shades the lower part, but the lower does not affect the higher. So, foliage forms were also affected by crown forms.
Hypothesis 3 (H3).
Crown forms and foliage forms respond differently to neighboring competition.
Competitive interactions between plants were mediated by their growth states [44]. Different parts of trees respond differently to neighboring competition. In uncrowded groups, tree height has a linear relation with total leaf area or branch length, but this relation becomes curvilinear or discontinuous in overcrowded groups [44]. Furthermore, inter-specific leaf size variation includes space pressures and environment adaptations associated with optimizing photosynthesis. It could be inferred that neighboring competition affects crown forms and foliage forms differently.
2.6. SEM and Measurement Models
Generally, SEM presents two components, a measurement model for evaluating unobserved latent variables or linear function structures of observed variables and a structural model indicating the direction and strength of the relationship of latent variables [45] (pp. 141–152).
In Figure 3, ovals and rectangles represented latent variables and observed variables, respectively. Unobserved latent variables were evaluated as linear function structures of observed variables. The neighboring competition was treated as a multifaceted concept with three observed variables measuring its different facets. Space competition, sunlight competition, and relative competitiveness were used as reflective indicators to construct the latent variable named neighboring competition. Tree height, crown width, and crown length were used as reflective indicators to construct the latent variable named crown forms. The dry weight of leaves, area of leaves, and base diameter of current year twigs were used as reflective indicators to construct the latent variable named foliage forms.
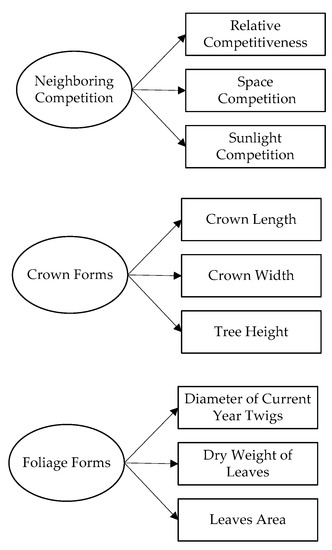
Figure 3.
The measurement model used in this study with the ovals depicting a latent variable and the rectangles depict observed variables. Single arrowheads from the latent variable to the observed variables represent direct effects.
Analysis of a Moments Structure (AMOS) version 20 (IBM, Chicago, IL, USA) was used to estimate path coefficients and test effects among variables in the SEM. Confirmatory factor analysis was used to evaluate measurement models. The construct reliability (CR) was evaluated with Cronbach’s alpha. Discriminant validity was evaluated with average variance extracted (AVE) [23,25].
Regression coefficients of each SEM path were estimated with the maximum likelihood method, and four basic fit statistics were chosen to assess model fit are as follows. A chi-squared (χ2) difference between observed and estimated covariance matrices was used to test the significance of the overall model fit. The Goodness of Fit Index (GFI) measures the relative amount of variance and covariance jointly accounted for by the model, and GFI ranges from 0 to 1.0, with 1.0 indicating the best fit. Root Mean Square Error of Approximation (RMSEA) measures the degree of misspecification per model degree of freedom, adjusted for sample size. Browne and Cudeck [46] suggested that RMSEA ≤ 0.05 indicated a close approximation or fit, a value between 0.05 and 0.08 indicated a reasonable approximation, and a value ≥ 0.1 suggested a poor fit.
3. Results
In this paper, six primary observed traits were used as reflective indicators to construct latent variables that illustrate visual forms of individual trees. We constructed the neighboring competition from three different facets that differ in living resources for which trees competed. Moreover, 218 competitive units covering most of the growth stage of subject trees were set in total.
3.1. Bivariate Relationships among Visual Forms Traits and Competition Indicators
The three competition indicators (space competition, sunlight competition, and relative competitiveness) influence crown forms quite intensely but differing in their intensity for different traits. Increasing competition intensity results in decreasing crown forms trait (Figure 4a). The high potential relativity of crown forms traits and relative competitiveness was found (R2 > 0.18, Figure 5). The effects of space competition on crown form traits are less pronounced than the sunlight competition and relative competitiveness (Figure 4a and Figure 5).
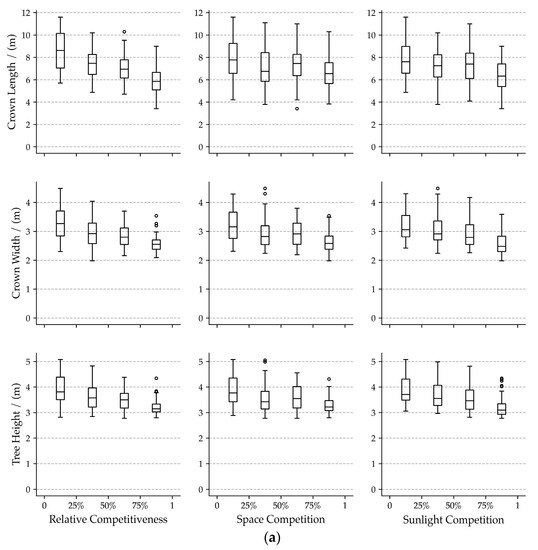
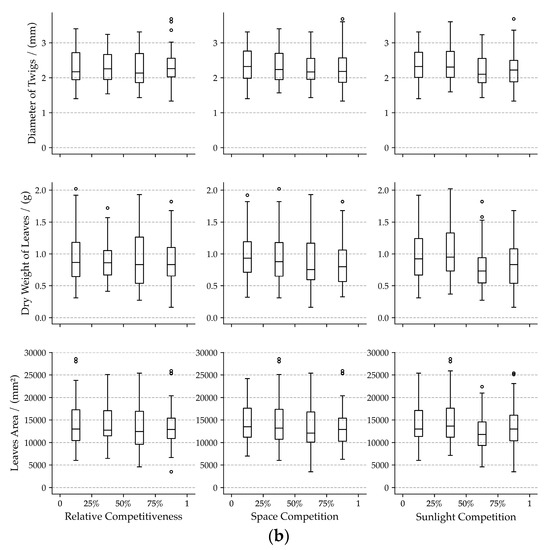
Figure 4.
Box-plots of crown form traits (a) and foliage form traits (b) for each neighboring competition indicator. In the subplots, 25%, 50%, and 75% indicate the lower quartile, median, and upper quartile of each neighboring competition indicator.
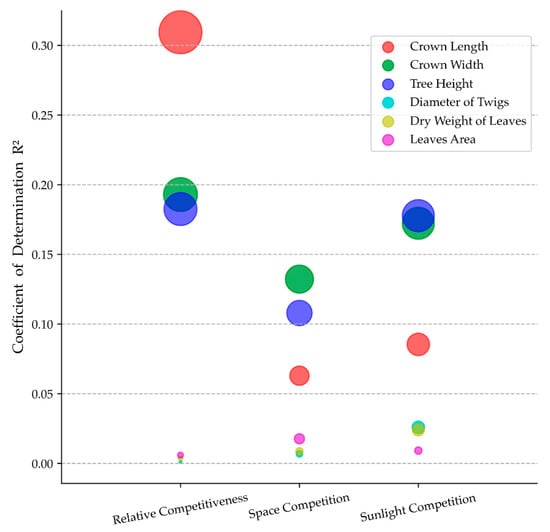
Figure 5.
Bubble plot of coefficient of determination (R2) in linear regression models of each visual form traits and neighboring competition indicators. The size of the bubble was positively related to R2.
The competition indicators hardly influence foliage form traits. The medians of leaves area and twig diameter remain relatively constant in different intervals of competition indicators (Figure 4b). The median of the dry weight of leaves varies a bit. Especially in the third interval of space competition and sunlight competition, medians of the dry weight of leaves were less than that in the other three intervals. Slight correlations between competition indicators and foliage form traits (R2 < 0.03, Figure 5) were found.
3.2. Confirmatory Factor Analysis of SEM
Confirmatory factor analysis results were shown in Table 4. All observed variables measured the constructs well as determined by the Cronbach’s alpha > 0.7 (p-value < 0.05), CR > 0.7 (p-value < 0.05), and AVE > 0.5 (p-value < 0.05). Thus, it was not necessary to delete or modify any variables. The latent variables loaded well on their constructs and measurement models (Figure 3) were sufficient to test the path coefficients [47].
Table 4.
Results of confirmatory factor analysis for the reliability and validity of constructs.
The model converged with indexes indicating a good overall model fit. The chi-square corrected by the degrees of freedom (χ2/df) was 1.68 (the χ2 = 40.2 with df = 23). The GFI was 0.960, and CFI was 0.990, with 1.0 indicating the best fit. Moreover, the RMSEA was 0.059, indicating a reasonable approximation (Table 5).
Table 5.
Overall fitness of the proposed model and recommended values (n = 218).
3.3. Effects of the Structural Model in SEM
Estimated unstandardized path coefficients depicted the effects among variables in the structural model (Figure 6). To facilitate comparison between relative magnitudes of effects, the width of each arrow in the diagram corresponds to the value of the respective standardized solution; that is, wider arrows indicate more significant standardized coefficients and thus stronger relative effects.
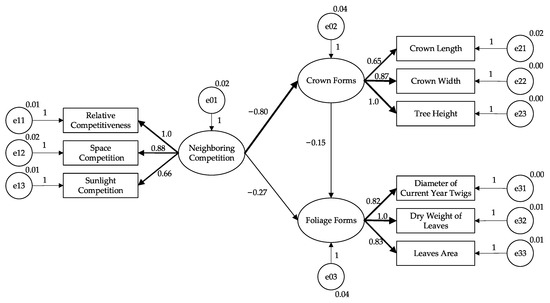
Figure 6.
Structural equation model for the response of visual forms to the neighboring competition. Ovals and rectangles represent latent variables and observed variables, respectively. Circles represent the error variables. The numbers by the path are the unstandardized path factor loading. The arrows represent the cause-and-effect paths; the width of each arrow in the diagram corresponds to the value of the respective standardized solution.
Neighboring competition effects on crown forms were primarily direct, supported by a significant direct effect (−0.8, p-value < 0.001, Table 6). It means a 1% increase in neighboring competition directly reduced crown forms by 0.8%.
Table 6.
Estimated total effects in the SEM, along with p-values (see Figure 6).
Neighboring competition affected foliage forms directly and indirectly, but the indirect effect mediated by crown forms was weaker than the direct effect. The indirect effect was estimated as the product of the direct effects of neighboring competition on crown forms and crown forms on foliage forms or approximately 0.12 (Figure 6, Table 6). In other words, a 1% increase in neighboring competition directly reduced foliage forms by 0.27% (Table 6) and indirectly increased by 0.12% (0.12 = −0.27 × −0.15, Figure 6). Hence, the total effect of neighboring competition, which included the direct effect and all possible indirect effects, was negative (−0.15, p-value < 0.01, Table 6).
4. Discussion
Our findings demonstrated the potential relevance between visual forms of an individual tree and competitive pressure from its neighboring trees by means of the bivariate analysis and the SEM. Cotinus coggygria is an adaptive species that can modify its tree forms to improve sunlight capture and space occupation.
4.1. Effects of Neighboring Competition on Visual Forms
Our analysis of bivariate correlations between each primarily selected trait and neighboring competition indicators and the SEM analysis with three latent variables show that neighboring competition is the dominating driver of visual forms of individual trees for the analyzed data.
Crown forms were negatively affected by neighboring competition, supporting Hypothesis 1 (Neighboring competition directly affects crown forms). We found an 80% decrease in crown forms with neighboring competitive pressure increase within the SEM. What is more, Pearson correlation coefficient for crown width with space competition (r = −0.36), crown length with relative competitiveness (r = −0.56), and tree height with sunlight competition (r = −0.42) indicated a solid negative relevance. Other research of tree growth and competition processes revealed similar negative correlations. González et al. [48] and Kahriman et al. [49] found that tree growth slows or halts when shaded by neighboring trees. Trees growing in completely open conditions with full lighting all around have crowns that may grow reflective of the trees’ genetic disposition. However, Kramer et al. [50] found crown shape was affected when lower branches of shaded trees tend to become suppressed, decline, and die in the shade of upper branches of neighboring trees [15].
For foliage forms, neighboring competition has less significant total effects than crown forms, partially supporting Hypothesis 2 (Neighboring competition affects foliage forms directly and indirectly mediated by crown forms). In the 218 competitive units, no significant trends were found between foliage form traits and relative competitiveness (the best R2 is 0.01). Additionally, we got similar results for sunlight competition with the diameter of current year twigs and dry weight of leaves. All three competition indicators could not explain foliage form traits (the best R2 is 0.03). Poorter et al. [51] found that environmental conditions have a significant impact on leaf traits. Leaves are affected not only by space [52] and light [53] but also by non-competition factors such as the soil nutrients (e.g., nitrogen, phosphorus, potassium), soil microbes, and organic matter [54,55]. However, these non-competition factors were outside the scope of this paper and not included in constructing the neighboring competition latent variable. Thus, their effects on foliage forms were not in consideration. Nevertheless, the error terms could partly account for these non-competition effects within the study site in SEM analysis. The direct effect of neighboring competition on foliage forms was −0.27, which indicates that foliage forms weakly negatively correlated with the neighboring competition. At the same time, the indirect effects mediated by crown forms were positive (0.12). It conformed to trade-offs between twigs and leaves, which interact with each other to improve light utilization and enhance defense capabilities [56]. In other words, leaves and twigs in large crowns shared crowded space and intercepted light. Thus, foliage forms negatively related to crown size. In SEM, the indirect effect is estimated as the product of the chain of direct effects [25]. Therefore, the positive indirect effects on foliage forms (0.12) were estimated as the product of negative effects of neighboring competition on crown forms (−0.8) and negative effects of crown forms on foliage forms (−0.15).
Moreover, the results completely supported Hypothesis 3 (Crown forms and foliage forms respond differently to neighboring competition). Total effects of neighboring competition on crown forms and foliage forms varied by 81.3% (81.3% = (0.8−0.15)/0.8 × 100%). Thus, the difference would represent the distinct responses of different parts that affect visual forms to neighboring competition, even with measurement errors.
4.2. Application of SEM
Visual forms of individual trees were defined as a system in which crown forms and foliage forms interrelated and interacted with each other. Trees with the same crown forms may look different with different foliage forms (Figure 1). The bivariate analysis of each visual form trait and competition indicator could not reveal the complex inter-relationships. The best R2 of bivariate correlations between foliage form traits and competition indicators are all minor and less than 0.05. In contrast, the direct effect of neighboring competition on foliage forms in the SEM indicated a slightly negative correlation. Furthermore, the indirect effect mediated by crown forms was eliminated in the bivariate analysis.
The realistic interrelationships between neighboring competition and visual forms could be complex and challenging to manipulate and test experimentally. The application of SEM made a way to understand the implications of neighboring competition on visual forms. Development of the “competition-visual form” model drew on published univariate models, theory, and expert knowledge to establish a set of working hypotheses on the interactions of different latent variables. Then, the hypotheses were translated into a mathematical model and fitted the latter to data collected from peri-urban forests dominated by Cotinus coggygria. The blend of confirmatory and exploratory SEM analyses provided insights into the complexity imposed by cascading effects of the different parts of trees.
The SEM was fitted by maximum likelihood. Because maximum likelihood was a complete information method, all processes and interactions represented in the model were considered simultaneously during model estimation [25]. This aspect of SEM was critical as the mechanisms for visual form responding to the competition were interactive and rarely dominated by one specific ecological factor [57]. As a result, sunlight attenuation and growing space competition were identified simultaneously as essential drivers of the observed patterns.
Unlike multiple regression, however, model parsimony was not the ultimate goal of SEM. Empirical re-specification of a model by dropping paths that were not significantly increased the chance of over-fitting a model to a specific data set. For example, the statistically insignificant path might be due to random variation or unique attributes of the analyzed dataset [25]. As mentioned above, a path was evaluated simultaneously in other paths; thus, its significance was meaningful only in the presence of other paths represented in the model. Therefore, empirical re-specification was not recommended, and a researcher should not feel compelled to drop insignificant paths from a model until replication of the results with other datasets or sufficient accumulation of evidence from related research indicated otherwise [25].
The SEM developed in this study explained competition effects and responses in terms of mechanisms that were not measured directly. For example, space competition was represented by simplified crown circle overlap area rather than a direct measurement of realistic crown dimensions of trees in competitive units. To the extent that more direct mechanisms and ultimate variables are becoming more directly observable, the dominating processes and mechanisms can be inferred with greater confidence.
4.3. Suggestions on Peri-Urban Forest Management
Forest landscapes are considered as a complex web of interactions whose threads are, for example, air, water, soil, vegetation, wildlife, insects, and microorganism-based. Thus, it becomes challenging to focus on every specific individual. The management implications of visual forms and competition are profound. The SEM model proposed in this study explored the causal relationship between neighboring competition and visual forms, improving computer-based technology suitable for handling problems about forest visual resources, promoting qualitative management decision-making processes.
In peri-urban forests, neighboring competition is inevitable, but it can be managed. Thus, visual forms of trees can be adjusted by regulating competition relations by spacing through density management. As trees growing in open conditions, their dense crowns tend to be more visually attractive [58]. Reducing planting density by removing some diseased trees is beneficial to mature trees for crown form development. Thinning dominant trees with little aesthetic value in peri-urban forests could effectively allow sunlight to reach shaded trees and improve visual quality.
Since monotonous, repetitive visual forms are prone to aesthetic fatigue [59,60], increasing the diversity and difference of visual forms is an effective way to improve the visual attraction of peri-urban forests [61]. Adjusting competition intensity by punning branches and leaves will reshape crown forms and foliage forms. Promoting the health of trees by increasing the growing space and number of leaves would likely increase the visual quality of peri-urban forests [62].
The color of leaves is one of the essential characteristics of foliage forms and should be considered in the visual quality promotion. Leaves of Cotinus coggygria turn from green to red gradually when fall approaches, making a unique scenery of red leaves. Leaf color changing occurs mainly due to anthocyanin, temperature, and day length and has little to do with neighboring competition. However, increasing the area and number of leaves is still a reasonable choice to improve the visual quality of a peri-urban forest dominated by Cotinus coggygria. The data was collected in summer when appealing red leaves did not arise, and the color of leaves was not considered in the “competition-visual form” model. Still, the effects of color on visual appeal should be considered and studied [63] (pp. 149–186).
5. Conclusions
An exploratory attempt was made to apply SEM to understand visual forms of individual trees in a peri-urban forest landscape responding to the neighboring competition. As a multifaceted concept, the neighboring competition was constructed by space competition, sunlight competition, and relative competitiveness in this study. Moreover, visual forms of trees were analyzed from two different perspectives—the crown and foliage forms. The results indicated that neighboring competition, such as sunlight interception, space extrusion, dramatically affects the crown forms of trees. However, effects on foliage forms were relatively weaker than that on crown forms. Additionally, foliage forms and crown forms interact with each other. The SEM model and associated findings should facilitate peri-urban forest landscape management by providing insight into the causal mechanisms of visual forms of trees, thereby assisting in the visual quality promotion.
It is necessary to note that neighboring competition is not the only cause of variation in visual forms of trees in peri-urban forests. Factors such as soil, temperature, and moisture, would be worth a further investigation to quantify causal effects on visual forms of trees. However, these factors were outside the scope of this paper.
Author Contributions
Conceptualization, Y.C. and C.X.; methodology, Y.C. and C.X.; software, Y.C.; validation, Y.C. and C.X.; formal analysis, Y.C. and C.X.; investigation, Y.C. and J.Z.; resources, C.X.; data curation, Y.C.; writing—original draft preparation, Y.C.; writing—review and editing, Y.C. and R.J.H.; supervision, C.X.; project administration, Y.C., J.Z. and C.X. All authors have read and agreed to the published version of the manuscript.
Funding
This research was funded by the special programs for public welfare of Forestry in China, grant number 20140430102.
Data Availability Statement
The data presented in this study are available on request from the corresponding author. The data are not publicly available due to confidentiality.
Acknowledgments
Special thanks to the Short-term International Student Program for Postgraduates of Forestry First-Class Discipline (2019XKJS0501).
Conflicts of Interest
The authors declare no conflict of interest.
References
- Haase, D.; Larondelle, N.; Andersson, E.; Artmann, M.; Borgström, S.; Breuste, J.; Gomez-Baggethun, E.; Gren, Å.; Hamstead, Z.; Hansen, R.; et al. A quantitative review of urban ecosystem service assessments: Concepts, models, and implementation. Ambio 2014, 43, 413–433. [Google Scholar] [CrossRef] [PubMed] [Green Version]
- Schirpke, U.; Meisch, C.; Marsoner, T.; Tappeiner, U. Revealing spatial and temporal patterns of outdoor recreation in the European Alps and their surroundings. Ecosyst. Serv. 2018, 31, 336–350. [Google Scholar] [CrossRef]
- Hartig, T.; Evans, G.W.; Jamner, L.D.; Davis, D.S.; Gärling, T. Tracking restoration in natural and urban field settings. J. Environ. Psychol. 2003, 23, 109–123. [Google Scholar] [CrossRef]
- Deng, Z.J.; Cheng, H.Y.; Song, S.Q. Effects of temperature, scarification, dry storage, stratification, phytohormone and light on dormancy-breaking and germination of Cotinus coggygria var. cinerea (Anacardiaceae) seeds. Seed Sci. Technol. 2010, 38, 572–584. [Google Scholar] [CrossRef]
- Zhang, Q. Basic Design the Dynamics of Visual Form from the First Generation Modernism Constructs the Master Reading the Building Constitute Beautiful. Master’s Thesis, Tianjin University, Tianjin, China, 2006. [Google Scholar]
- Dong, W.X. Visual Form Semantics; Shanghai University Press: Shanghai, China, 2007. [Google Scholar]
- Li, W. Study on Skin Renewal Design of the Old Industrial Buildings. Master’s Thesis, Qingdao University of Technological, Qingdao, China, 2012. [Google Scholar]
- Rowe, N.; Speck, T. Plant growth forms: An ecological and evolutionary perspective. New Phytol. 2005, 166, 61–72. [Google Scholar] [CrossRef] [PubMed]
- Umeki, K. A comparison of crown asymmetry between Picea abies and Betula maximowicziana. Can. J. For. Res. 1995, 25, 1876–1880. [Google Scholar] [CrossRef]
- Getzin, S.; Wiegand, K. Asymmetric tree growth at the stand level: Random crown patterns and the response to slope. For. Ecol. Manag. 2007, 242, 165–174. [Google Scholar] [CrossRef]
- Grams, T.E.E.; Andersen, C.P. Competition for resources in trees: Physiological versus morphological plasticity. Prog. Bot. 2007, 68, 356–381. [Google Scholar] [CrossRef]
- Wu, J.; Chen, Y.; Liu, H.X.; Xu, L.J.; Jin, G.X.; Xu, C.Y. Effects of stand density and mingling intensity on tree morphology in natural scenic forest in Changbai Mountain. Sci. Silvae Sin. 2018, 54, 12–21. [Google Scholar] [CrossRef]
- Kang, H.J.; Chen, Z.L.; Liu, P.; Zhang, Z.X.; Zhou, J.H. Intra-specific competition of Emmenopterys henryi and its accompanying species in the Dapanshan national nature reserve of Zhejiang province. Acta Ecol. Sin. 2008, 28, 3456–3463. [Google Scholar] [CrossRef]
- Oheimb, G.V.; Lang, A.C.; Bruelheide, H.; Forrester, D.I.; Wäsche, I.; Yu, M.J.; Härdtle, W. Individual-tree radial growth in a subtropical broad-leaved forest: The role of local neighbourhood competition. For. Ecol. Manag. 2011, 261, 499–507. [Google Scholar] [CrossRef]
- Yin, D.S.; Ge, W.Z.; Zhang, F.H.; Shen, H.L. Competition relationship of populations of natural secondary Acer mono forest. Bull. Bot. Res. 2012, 32, 105–109. [Google Scholar]
- Yu, L.; Song, M.Y.; Lei, Y.B.; Korpelainen, H.; Niinemets, Ü.; Li, C.Y. Effects of competition and phosphorus fertilization on leaf and root traits of late-successional conifers Abies fabri and Picea brachytyla. Environ. Exp. Bot. 2019, 162, 14–24. [Google Scholar] [CrossRef] [Green Version]
- Grace, J.B.; Youngblood, A.; Scheiner, S.M. Structural equation modeling and ecological experiments. In Real World Ecology: Large-Scale and Long-Term Case Studies and Methods; Miao, S.L., Carstenn, S., Nungesser, M., Eds.; Springer: New York, NY, USA, 2009; pp. 19–46. [Google Scholar]
- Shipley, B. Cause and Correlation in Biology: A User’s Guide to Path Analysis, Structural Equations and Causal Inference with R.; Cambridge University Press: Cambridge, UK, 2016. [Google Scholar]
- Grace, J.B. Structural equation modeling for observational studies. J. Wildl. Manag. 2008, 72, 14–22. [Google Scholar] [CrossRef]
- Timilsina, N.; Escobedo, F.J.; Staudhammer, C.L.; Brandeis, T. Analyzing the causal factors of carbon stores in a subtropical urban forest. Ecol. Complex. 2014, 20, 23–32. [Google Scholar] [CrossRef]
- Cottam, G.; Curtis, J.T. The use of distance measures in phytosociological sampling. Ecology 1956, 37, 451–460. [Google Scholar] [CrossRef]
- Zhang, J.E. Experimental Research Methods and Techniques Are Commonly Used in Ecology; Chemical Industry Press: Beijing, China, 2007; pp. 86–87. [Google Scholar]
- Schumacker, R.E.; Lomax, R.G. A Beginner’s Guide to Structural Equation Modeling; Routledge: New York, NY, USA, 2010. [Google Scholar]
- Lam, T.Y.; Maguire, D.A. Structural equation modeling: Theory and applications in forest management. Int. J. Forestry Res. 2012, 1–16. [Google Scholar] [CrossRef] [Green Version]
- Kline, R.B. Principles and Practice of Structural Equation Modeling, 3rd ed.; The Guilford Press: New York, NY, USA, 2011. [Google Scholar]
- Roxo, J. Elements of Art: Interpreting Meaning through the Language of Visual Cues. Doctoral Thesis, State University of New York at Stony Brook, New York, NY, USA, 2018. [Google Scholar]
- Iwasa, Y.; Cohen, D.; Leon, J.A. Tree height and crown shape, as results of competitive games. J. Theor. Biol. 1984, 112, 279–297. [Google Scholar] [CrossRef]
- Lindh, B.C.; Gray, A.N.; Spies, T.A. Responses of herbs and shrubs to reduced root competition under canopies and in gaps: A trenching experiment in old-growth Douglas-fir forests. Can. J. Forest Res. 2003, 33, 2052–2057. [Google Scholar] [CrossRef] [Green Version]
- Riegel, G.M.; Miller, R.F.; Krueger, W.C. Competition for resources between understory vegetation and overstory Pinus ponderosa in northeastern Oregon. Ecol. Appl. 1992, 2, 71–85. [Google Scholar] [CrossRef] [PubMed]
- Olivier, M.D.; Robert, S.; Fournier, R.A. Response of sugar maple (Acer saccharum, Marsh.) tree crown structure to competition in pure versus mixed stands. For. Ecol. Manag. 2016, 374, 20–32. [Google Scholar] [CrossRef]
- Lieffers, V.J.; Messier, C.; Stadt, K.J.; Gendron, F.; Comeau, P.G. Predicting and managing light in the understory of boreal forests. Can. J. For. Res. 1999, 29, 796–811. [Google Scholar] [CrossRef]
- Bella, I.E. A new competition model for individual trees. For. Sci. 1971, 17, 364–372. [Google Scholar]
- Opie, J.E. Predictability of individual tree growth using various definitions of competing basal area. For. Sci. 1968, 14, 314–323. [Google Scholar] [CrossRef]
- Smith, W.R.; Farrar, R.M., Jr.; Murphy, P.A.; Yeiser, J.L.; Meldahl, R.S.; Kush, J.S. Crown and basal area relationships of open-grown southern pines for modeling competition and growth. Can. J. For. Res. 1992, 22, 341–347. [Google Scholar] [CrossRef]
- Van der Zee, J.; Lau, A.; Shenkin, A. Understanding crown shyness from a 3-D perspective. Ann. Bot. 2021, 3, 1–11. [Google Scholar] [CrossRef]
- Onoda, Y.; Bando, R. Wider crown shyness between broad-leaved tree species than between coniferous tree species in a mixed forest of Castanopsis cuspidata and Chamaecyparis obtusa. Ecol. Res. 2021, 36, 733–743. [Google Scholar] [CrossRef]
- Smith, S.H.; Bell, J.F. Using competitive stress index to estimate diameter growth for thinned Douglas-fir stands. For. Sci. 1983, 29, 491–499. [Google Scholar] [CrossRef]
- Baskerville, G.L. Dry-matter production in immature balsam fir stands: Roots lesser vegetation, and total stand. For. Sci. 1966, 12, 49–53. [Google Scholar] [CrossRef]
- Weiner, J.; Damgaard, C. Size-asymmetric competition and size-asymmetric growth in a spatially explicit zone-of-influence model of plant competition. Ecol. Res. 2006, 21, 707–712. [Google Scholar] [CrossRef]
- Horn, H.S. The Adaptive Geometry of Trees; Princeton University Press: Princeton, NJ, USA, 1971. [Google Scholar]
- Westoby, M.; Wright, I.J. The leaf size-twig size spectrum and its relationship to other important spectra of variation among species. Oecologia 2003, 135, 621–628. [Google Scholar] [CrossRef]
- Niklas, K.J. Size-dependent allometry of tree height, diameter and trunk-taper. Ann. Bot. 1995, 75, 217–227. [Google Scholar] [CrossRef]
- Tyree, M.T.; Ewers, F.W. The hydraulic architecture of trees and other woody plants. New Phytol. 1991, 119, 345–360. [Google Scholar] [CrossRef]
- Weiner, J.; Berntson, G.M.; Thomas, S.C. Competition and growth form in a woodland annual. J. Ecol. 1990, 78, 459–469. [Google Scholar] [CrossRef]
- Dell’Olio, L. Structural equation models. In Public Transportation Quality of Service; Dell’Olio, L., Ibeas, A., de Oña, J., de Oña, R., Eds.; Elsevier: Amsterdam, The Netherlands, 2018; pp. 141–152. [Google Scholar] [CrossRef] [Green Version]
- Browne, M.W.; Cudeck, R. Alternative ways of assessing model fit. Sociol. Method. Res. 1992, 21, 230–258. [Google Scholar] [CrossRef]
- Gerbing, D.W.; Anderson, J.C. Monte Carlo evaluations of goodness of fit indices for structural equation models. Sociol. Method. Res. 1992, 21, 132–160. [Google Scholar] [CrossRef]
- González de Andrés, E.; Camarero, J.J.; Blanco, J.A.; Imbert, J.B.; Lo, Y.H.; Sangüesa-Barreda, G.; Castillo, F.J. Tree-to-tree competition in mixed European beech-Scots pine forests has different impacts on growth and water-use efficiency depending on site conditions. J. Ecol. 2018, 106, 59–75. [Google Scholar] [CrossRef] [Green Version]
- Kahriman, A.; Şahin, A.; Sönmez, T.; Yavuz, M. A novel approach to selecting a competition index: The effect of competition on individual-tree diameter growth of Calabrian pine. Can. J. For. Res. 2018, 48, 1217–1226. [Google Scholar] [CrossRef]
- Kramer, R.D.; Sillett, S.C.; Van Pelt, R.; Franklin, J.F. Neighborhood competition mediates crown development of Picea sitchensis in Olympic rainforests: Implications for restoration management. For. Ecol. Manag. 2019, 441, 127–143. [Google Scholar] [CrossRef]
- Poorter, H.; Niinemets, Ü.; Poorter, L.; Wright, I.; Villar, R. Causes and consequences of variation in leaf mass per area (LMA): A meta-analysis. New Phytol. 2009, 182, 565–588. [Google Scholar] [CrossRef]
- Lee, T.D.; Bazzaz, F.A. Effects of defoliation and competition on growth and reproduction in the annual plant Abutilon theophrasti. J. Ecol. 1980, 68, 813–821. [Google Scholar] [CrossRef]
- Mekonnen, Z.A.; Riley, W.J.; Grant, R.F. Accelerated nutrient cycling and increased light competition will lead to 21st century shrub expansion in North American Arctic tundra. J. Geophys. Res. Biogeo. 2018, 123, 1683–1701. [Google Scholar] [CrossRef]
- Longstreth, D.J.; Nobel, P.S. Nutrient influences on leaf photosynthesis: Effects of nitrogen, phosphorus, and potassium for Gossypium hirsutum L. Plant Physiol. 1980, 65, 541–543. [Google Scholar] [CrossRef] [Green Version]
- Reich, P.B.; Ellsworth, D.S.; Walters, M.B. Leaf structure (specific leaf area) modulates photosynthesis-nitrogen relations: Evidence from within and across species and functional groups. Funct. Ecol. 1998, 12, 948–958. [Google Scholar] [CrossRef]
- Long, J.Y.; Zhao, Y.M.; Kong, X.Q.; Chen, Z.Y.; Wang, X.S.; Zhao, K.; Cao, R.; Huang, L.S.; Lü, J.; Cui, Y.; et al. Trade-offs between twig and leaf traits of ornamental shrubs grown in shade. Acta Ecol. Sin. 2018, 38, 1–9. [Google Scholar] [CrossRef]
- Kocher, S.D.; Harris, R. Forest Stewardship Series 5: Tree Growth and Competition; University of California Agriculture and Natural Resources: California, CA, USA, 2007; pp. 1–10. [Google Scholar]
- Coomes, D.A.; Allen, R.B. Testing the metabolic scaling theory of tree growth. J. Ecol. 2009, 97, 1369–1373. [Google Scholar] [CrossRef]
- Lai, Y.B. On the phenomenon of “aesthetic fatigue” in the perspective of consumer society. Mov. Lit. 2011, 21, 17–18. [Google Scholar]
- Feng, X.L. Aesthetics in the System of Human Life; Anhui Education Press: Hefei, China, 2004. [Google Scholar]
- Xue, X. A Study on Aesthetic Fatigue of Forest Landscapes of Tourists Based on EEG. Master’s Thesis, Central South University of Forestry and Technology, Changsha, China, 2015. [Google Scholar]
- Hull, R.B.; Buhyoff, G.J. The scenic beauty temporal distribution method: An attempt to make scenic beauty assessments compatible with forest planning efforts. For. Sci. 1986, 32, 271–286. [Google Scholar]
- Bell, S.; Blom, D.; Rautamäki, M.; Castel-Branco, C.; Simson, A.; Olsen, I.A. Design of urban forests. In Urban Forests and Trees: A Reference Book; Konijnendijk, C.C., Nilsson, K., Randrup, T.B., Schipperijn, J., Eds.; Springer: Berlin/Heidelberg, Germany, 2005; pp. 149–186. [Google Scholar]
Publisher’s Note: MDPI stays neutral with regard to jurisdictional claims in published maps and institutional affiliations. |
© 2021 by the authors. Licensee MDPI, Basel, Switzerland. This article is an open access article distributed under the terms and conditions of the Creative Commons Attribution (CC BY) license (https://creativecommons.org/licenses/by/4.0/).