Article

Low Cost Automatic Reconstruction of Tree Structure by AdQSM with Terrestrial Close-Range Photogrammetry

1
School of Information Science and Technology, Beijing Forestry University, Beijing 100083, China
2
Engineering Research Center for Forestry-oriented Intelligent Information Processing, National Forestry and Grassland Administration, Beijing 100083, China
3
National Geomatics Center of China, Beijing 100830, China
4
College of Natural Resources and Environment, Northwest A&F University, Yangling 712100, China
5
The Third Branch, Beijing Institute of Surveying and Mapping, Beijing 100038, China
*
Authors to whom correspondence should be addressed.
Forests 2021, 12(8), 1020; https://doi.org/10.3390/f12081020
Submission received: 26 May 2021 / Revised: 23 July 2021 / Accepted: 28 July 2021 / Published: 31 July 2021
(This article belongs to the Special Issue Modelling of Forests Structure and Biomass Distribution)

Abstract

:
The quantitative structure model (QSM) contains the branch geometry and attributes of the tree. AdQSM is a new, accurate, and detailed tree QSM. In this paper, an automatic modeling method based on AdQSM is developed, and a low-cost technical scheme of tree structure modeling is provided, so that AdQSM can be freely used by more people. First, we used two digital cameras to collect two-dimensional (2D) photos of trees and generated three-dimensional (3D) point clouds of plot and segmented individual tree from the plot point clouds. Then a new QSM-AdQSM was used to construct tree model from point clouds of 44 trees. Finally, to verify the effectiveness of our method, the diameter at breast height (DBH), tree height, and trunk volume were derived from the reconstructed tree model. These parameters extracted from AdQSM were compared with the reference values from forest inventory. For the DBH, the relative bias (rBias), root mean square error (RMSE), and coefficient of variation of root mean square error (rRMSE) were 4.26%, 1.93 cm, and 6.60%. For the tree height, the rBias, RMSE, and rRMSE were—10.86%, 1.67 m, and 12.34%. The determination coefficient (R2) of DBH and tree height estimated by AdQSM and the reference value were 0.94 and 0.86. We used the trunk volume calculated by the allometric equation as a reference value to test the accuracy of AdQSM. The trunk volume was estimated based on AdQSM, and its bias was 0.07066 m3, rBias was 18.73%, RMSE was 0.12369 m3, rRMSE was 32.78%. To better evaluate the accuracy of QSM’s reconstruction of the trunk volume, we compared AdQSM and TreeQSM in the same dataset. The bias of the trunk volume estimated based on TreeQSM was −0.05071 m3, and the rBias was −13.44%, RMSE was 0.13267 m3, rRMSE was 35.16%. At 95% confidence interval level, the concordance correlation coefficient (CCC = 0.77) of the agreement between the estimated tree trunk volume of AdQSM and the reference value was greater than that of TreeQSM (CCC = 0.60). The significance of this research is as follows: (1) The automatic modeling method based on AdQSM is developed, which expands the application scope of AdQSM; (2) provide low-cost photogrammetric point cloud as the input data of AdQSM; (3) explore the potential of AdQSM to reconstruct forest terrestrial photogrammetric point clouds.

1. Introduction

The tree model reconstructed by 3D point clouds can be used for quantitative analysis of tree size, tree structure, and other attributes, so as to improve the estimate accuracy of forest stock, above-ground biomass (AGB), and carbon storage [1]. Cutting down trees is the most direct and accurate, but destructive and costly way to measure trunk volume [2,3,4,5]. Allometric equation established by destructive sampling is an indirect measurement method to estimate the volume, but the uncertainty of the measurement result is difficult to quantify or even unknown [6]. Nondestructive obtaining trunk volume with high precision, minimum cost and time is an important content of forestry research. In the past ten years, light detection and ranging (LiDAR) and photogrammetry have received widespread attention as two different point clouds acquisition methods [7,8]. LiDAR point clouds lack texture and spectral information, which is of great significance in tree species identification, tree photosynthetic, and non-photosynthetic components separation, etc. Photogrammetry can obtain rich texture and spectral information. The combination of the above two kinds of data can better achieve complementary advantages [9]. So it is necessary to fully combine the 3D structural features obtained by LiDAR and the texture information obtained from images [10,11]. Some researchers have made new achievements in the fusion of LiDAR and photogrammetry point clouds [12,13]. LiDAR, as an active remote sensing technology, has achieved satisfactory results in forest attributes extraction by virtue of its high-precision advantages. Researchers have developed a series of algorithms for extracting forest parameters from LiDAR point clouds, opening up new possibilities for forest research [14]. Studies have shown that LiDAR and SfM (structure from motion) are the most effective and accurate methods for individual tree attributes estimation at a medium scale [15]. Airborne laser scanning (ALS) can provide wide coverage, but the accuracy of tree detection and shape is limited [7,16]. Terrestrial laser scanning (TLS) provides a large number of accurate information on forest structure parameters, such as DBH, tree height, and sub-branch height [17,18]. This technology fills the gap between tree-scale manual measurements and large airborne LiDAR measurements [19,20]. However, at present, LiDAR technology is still an expensive operation method in forest resource surveys. Purchasing LiDAR instruments and manual training will incur high costs [21,22,23]. Photographs taken by digital cameras have become another source of point clouds [24]. In some cases, photogrammetry may seem to be a more economical alternative to LiDAR, especially for small and rapid forest inventory [25,26,27].
Terrestrial close-range photogrammetry (TP) and SfM technology can be used to generate 3D point clouds from a large number of overlapping photos to assist in tree volume estimation [10,28,29]. The SfM technology is one of the most effective and accurate non- destructive methods in forest research [30], and is gradually being used to estimate forest attributes [31,32]. Sometimes it may be more economical to use the TP point clouds generated based on SfM as the input data for QSM than the TLS point clouds [25,29]. In the field of photogrammetry, the data collection cost of TP is lower than that of UAV or aerial photogrammetry [33,34]. It only needs a few hundred dollars of digital cameras, and even ordinary non-measurement cameras can complete photo collection. At present, some QSM algorithms based on TLS point clouds have been developed and can accurately extract tree attributes. The QSM method reconstructs the geometric structure and topology of the branches [35]. It can directly derive the tree (branch or trunk) volume from the reconstructed model. It can also calculate the length and volume of branches, the volume and size of crown and other tree parameters. TreeQSM is relatively well-known and constantly improved [36,37]. TreeQSM performs cylindrical fitting to the topological structure of the entire tree based on the point clouds of individual tree, calculates the volume of each cylindrical part, and then calculates the volume of the trunk and branches of each tree. In addition, there are other tree modeling methods such as PypeTree and SimpleTree [38,39].
Shenglan Du et al. proposed a method called AdTree [40], which provides a geometric basis for the automatic, detailed, and accurate reconstruction of a 3D tree model. Guangpeng Fan et al. updated and extended the AdTree method [41], and proposed a new quantitative estimation method of tree attributes to extract DBH, tree height, and volume [42], and the improved model is called AdQSM [41]. LiDAR point clouds and destructive tree measurement data were used to test the accuracy of AdQSM’s estimation of tree attributes such as DBH, tree height, branch length, branch number, volume, and AGB [41,42,43]. Generally, TLS point clouds is used for accurate modeling using QSM algorithm, so using TP point clouds modeling based on this algorithm will be a new attempt. Using TP point clouds as the input data of AdQSM will reduce the cost of tree 3D reconstruction, because TP point clouds are more economical to obtain. We found that there are a few related studies on modeling point clouds from tree images based on the QSM method [28]. Both the LiDAR point clouds and the photogrammetry point clouds are composed of a series of coordinate points, and the point clouds contain data in three directions: X axis, Y axis, and Z axis [44,45].
We used AdQSM to reconstruct TP point clouds. This paper presents an automatic AdQSM method for low-cost input data, which improves the versatility and application range of AdQSM. We also compared the tree characteristics reconstructed by AdQSM and TreeQSM. The accuracy of the two QSM methods is compared in the same dataset. The research objectives of this paper include the following: (1) Open AdQSM and develop automatic modeling methods for it, which is conducive to its use by more people; (2) develop a new low-cost tree structure modeling technology.

2. Materials and Methods

2.1. Data Preparation

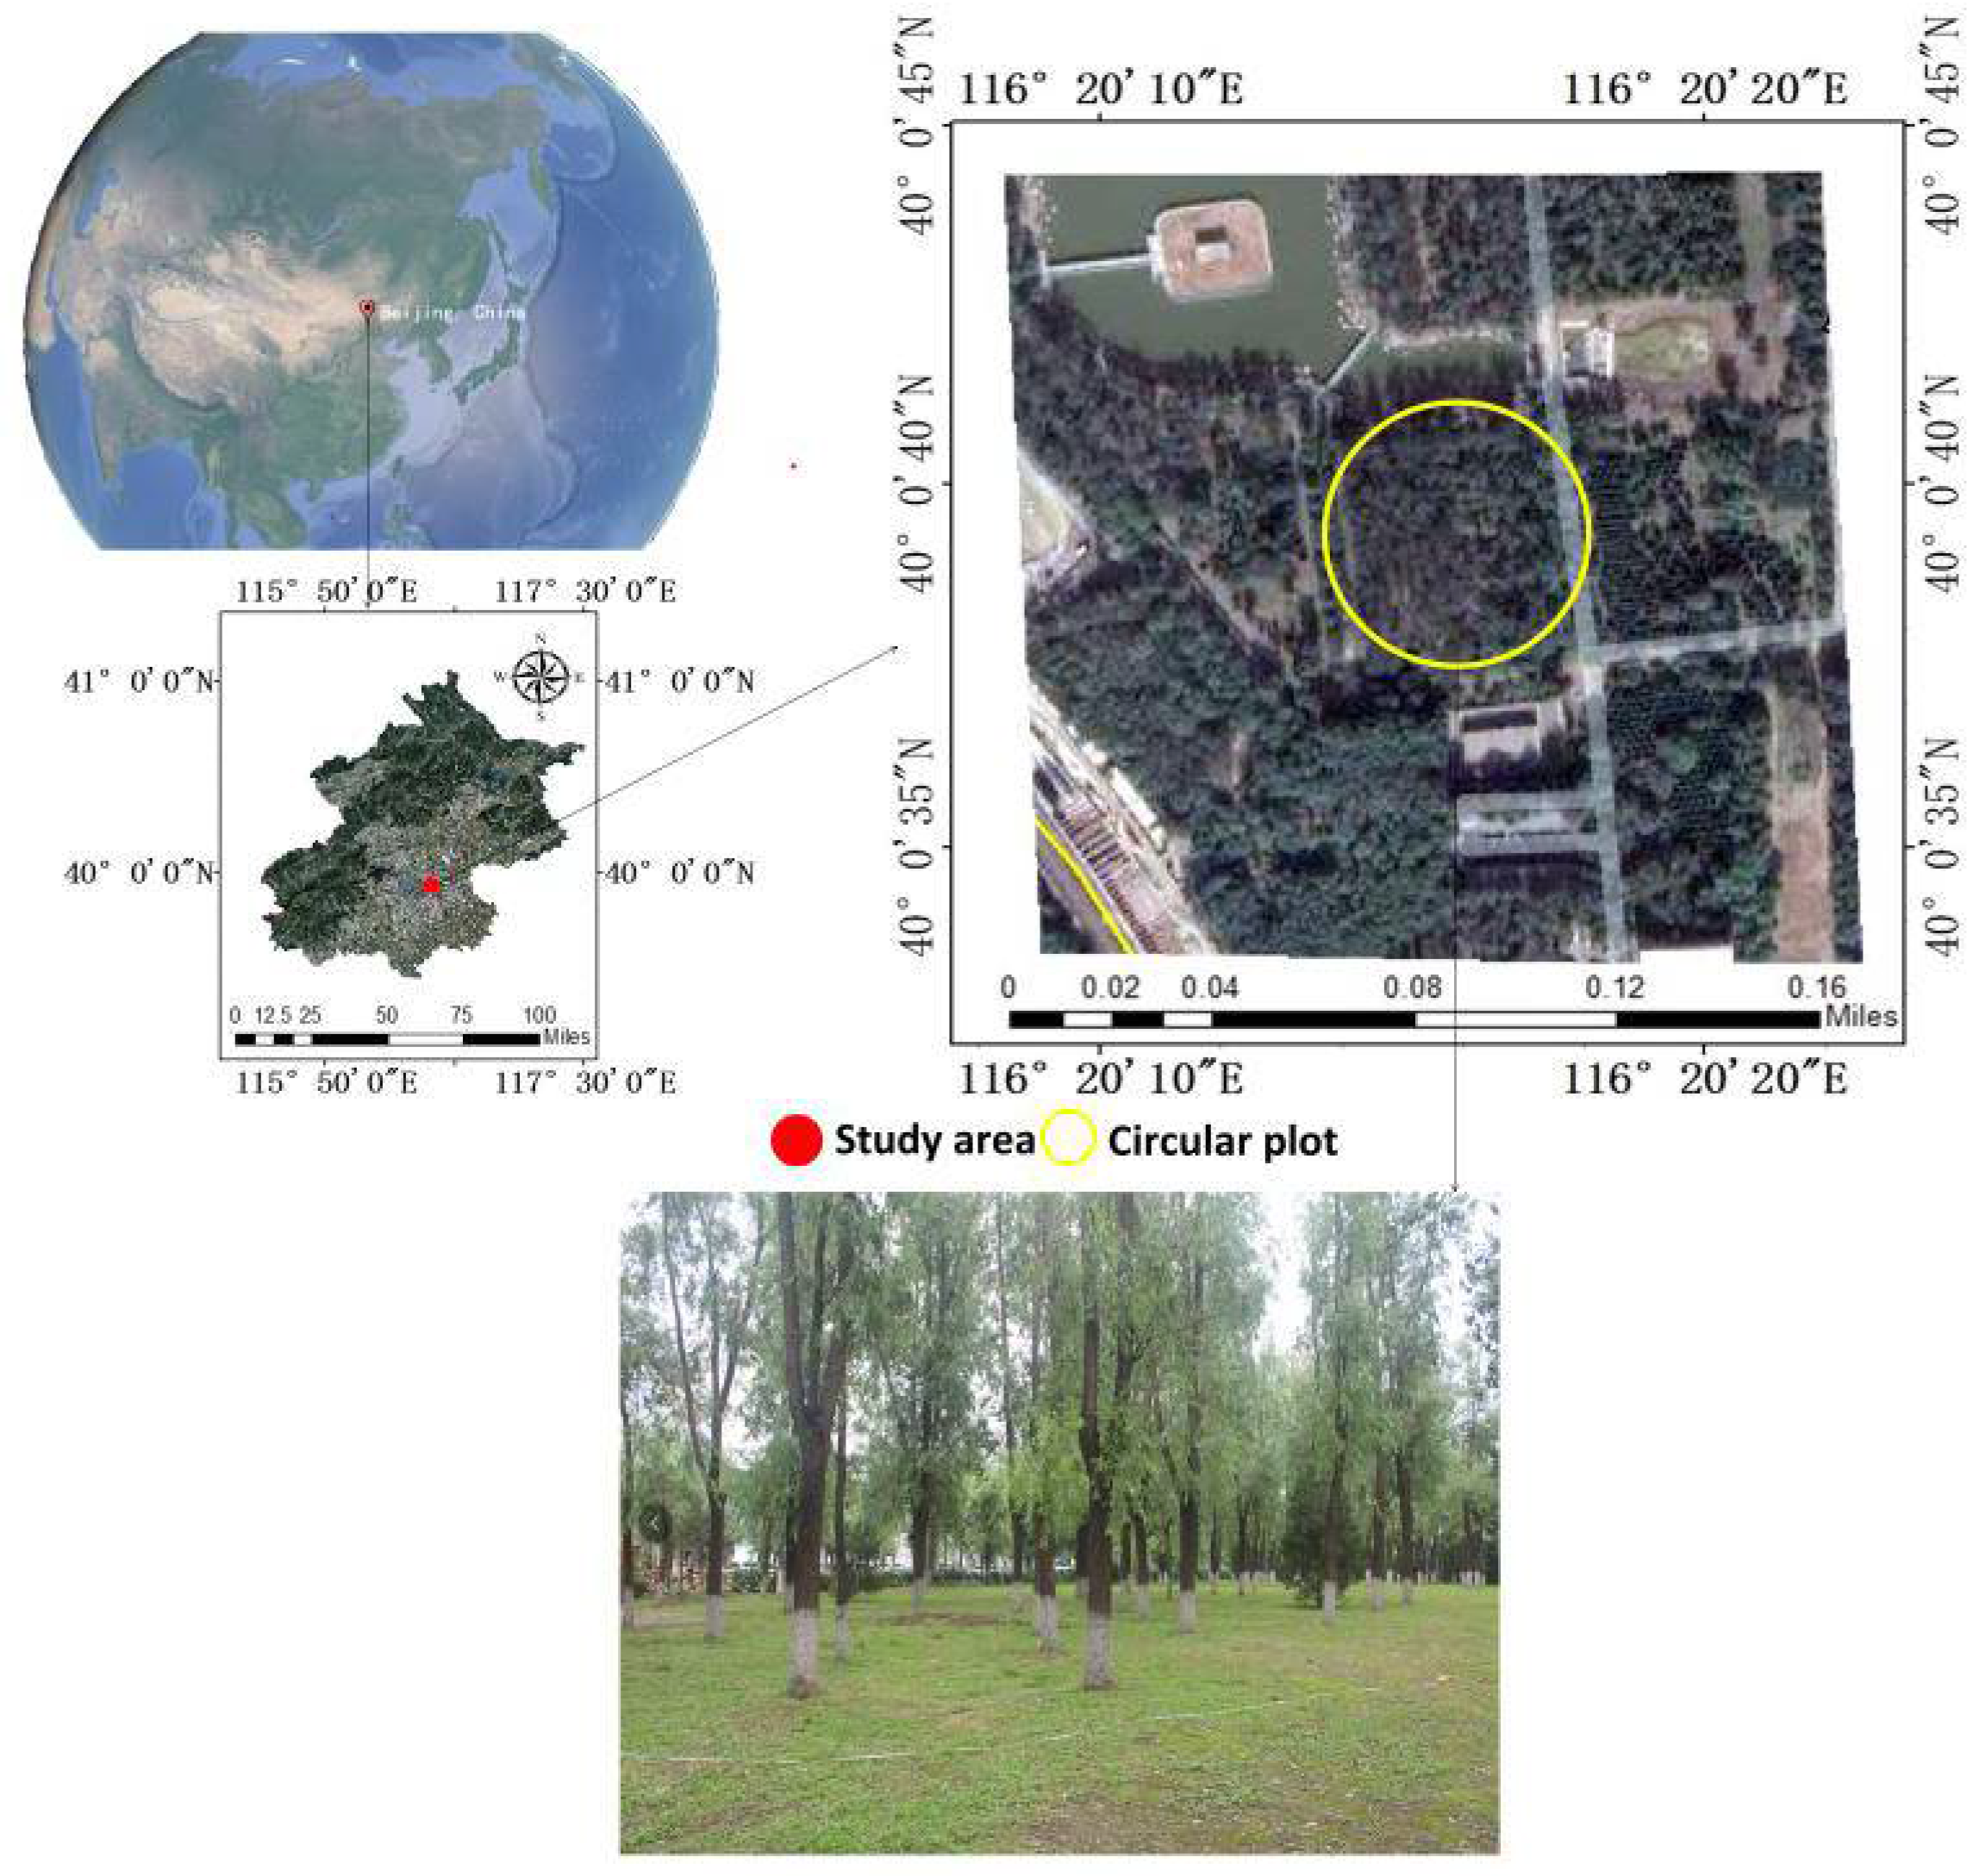
2.1.1. Forest Inventory Data

The study area is located in a broad-leaved plantation in Haidian District, Beijing (40°00′40” N, 116°20′20” E), and the altitude ranges from 20 to 1500 m. We collected plot data in June 2019 and built a circular plot with 25 m radius. The main tree species in the plot is Salix matsudana Koidz., and there are only a few herbs on the ground, Figure 1. The height of the herb plants is less than 1 m, which has no effect on the point clouds collection of the trunk. The average and standard deviation of tree height are 13.53 m and 2.07 m, respectively. The average and standard deviation of DBH are 29.2 cm and 5.7 cm, respectively. This article used KTS-442LLCN total station (Guangdong Kolida Instrument Co., Ltd., Guangzhou, China, http://www.kolida.com.cn/productsDetail4-0302-67.html (accessed on 30 July 2021)) to measure tree height based on the principle of triangulation [42]. We use a forestry tape to measure the DBH.

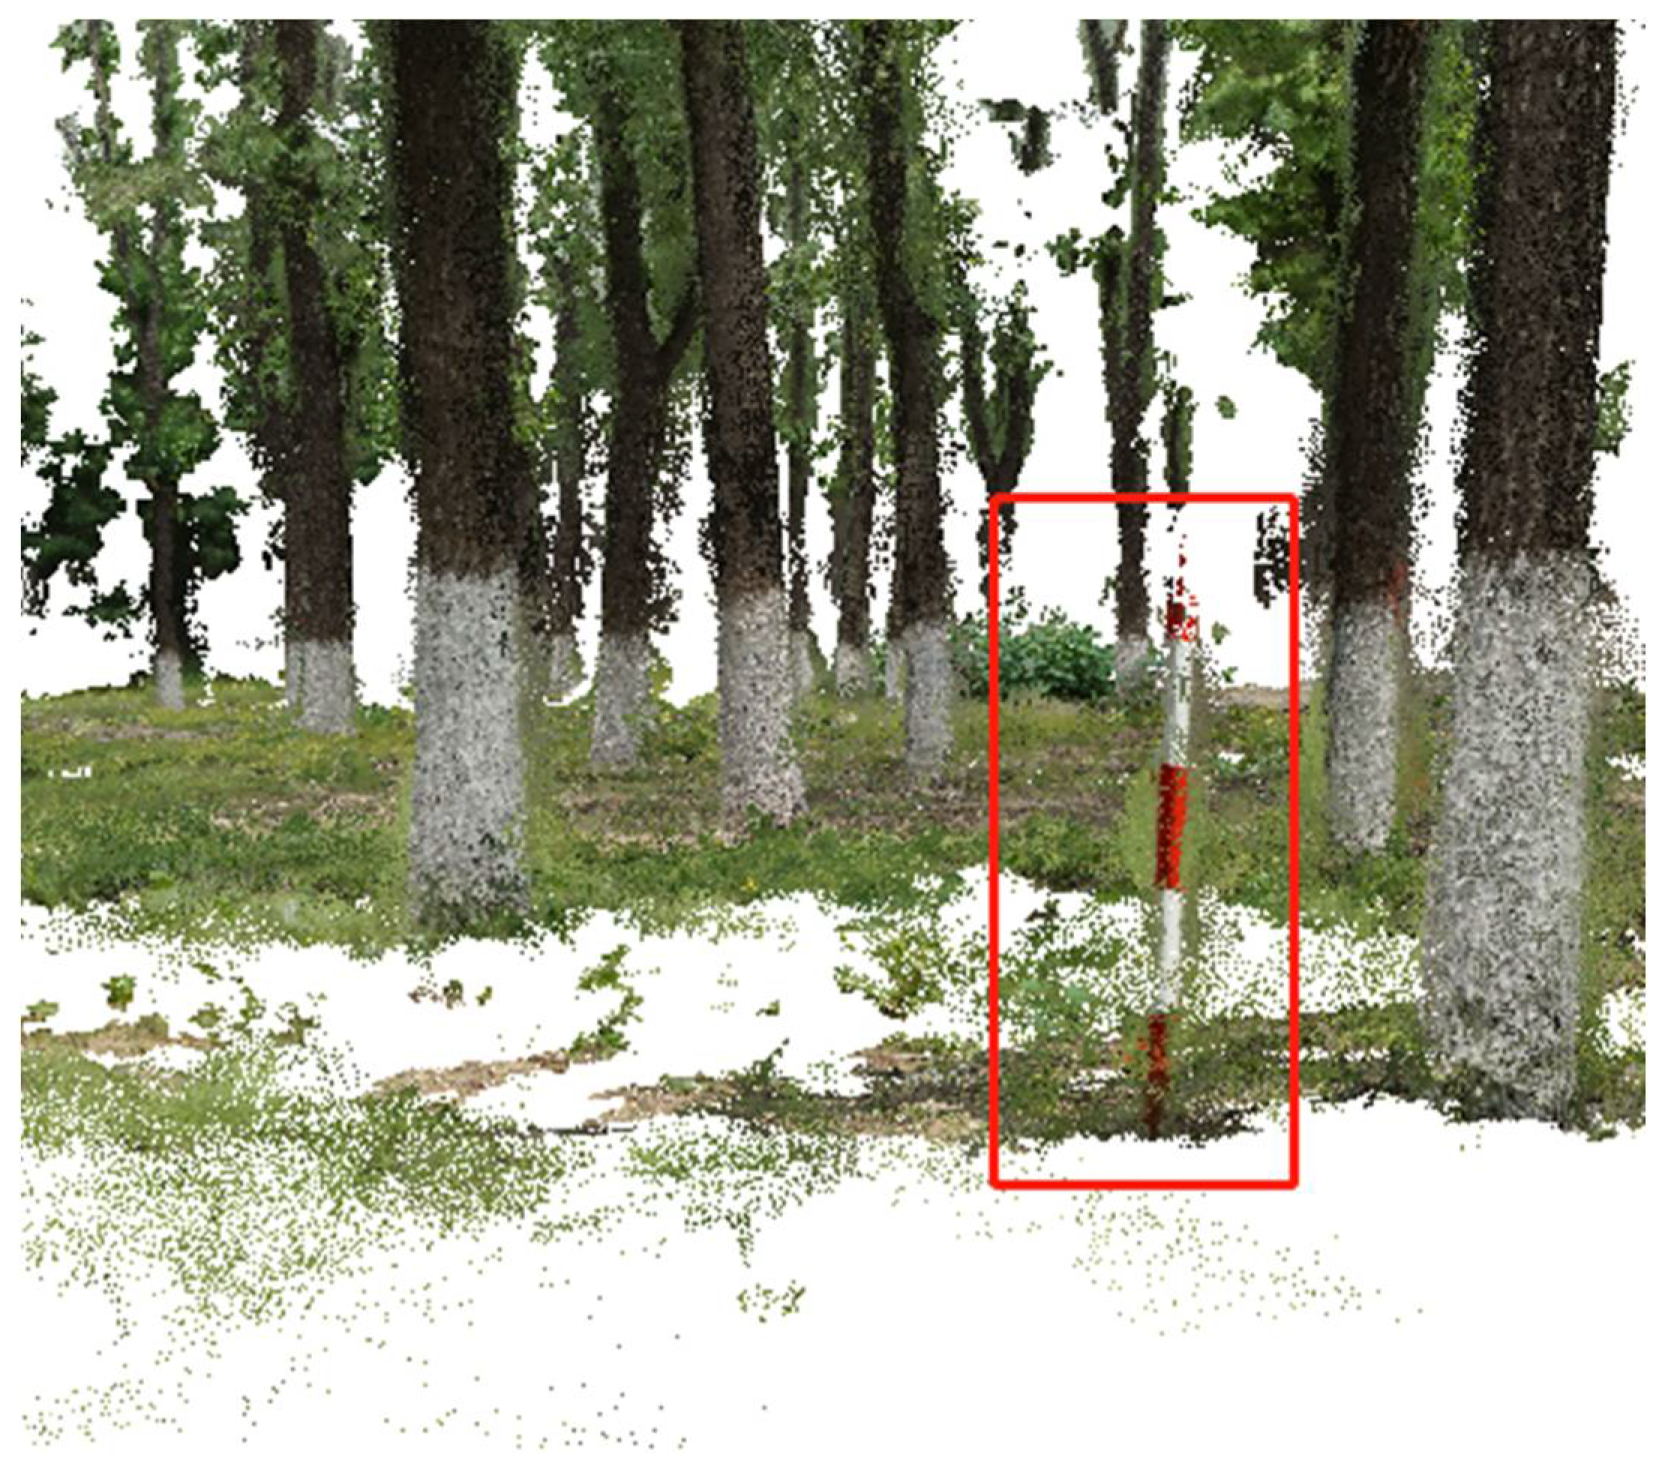
2.1.2. Collection and Processing of TP Point Clouds
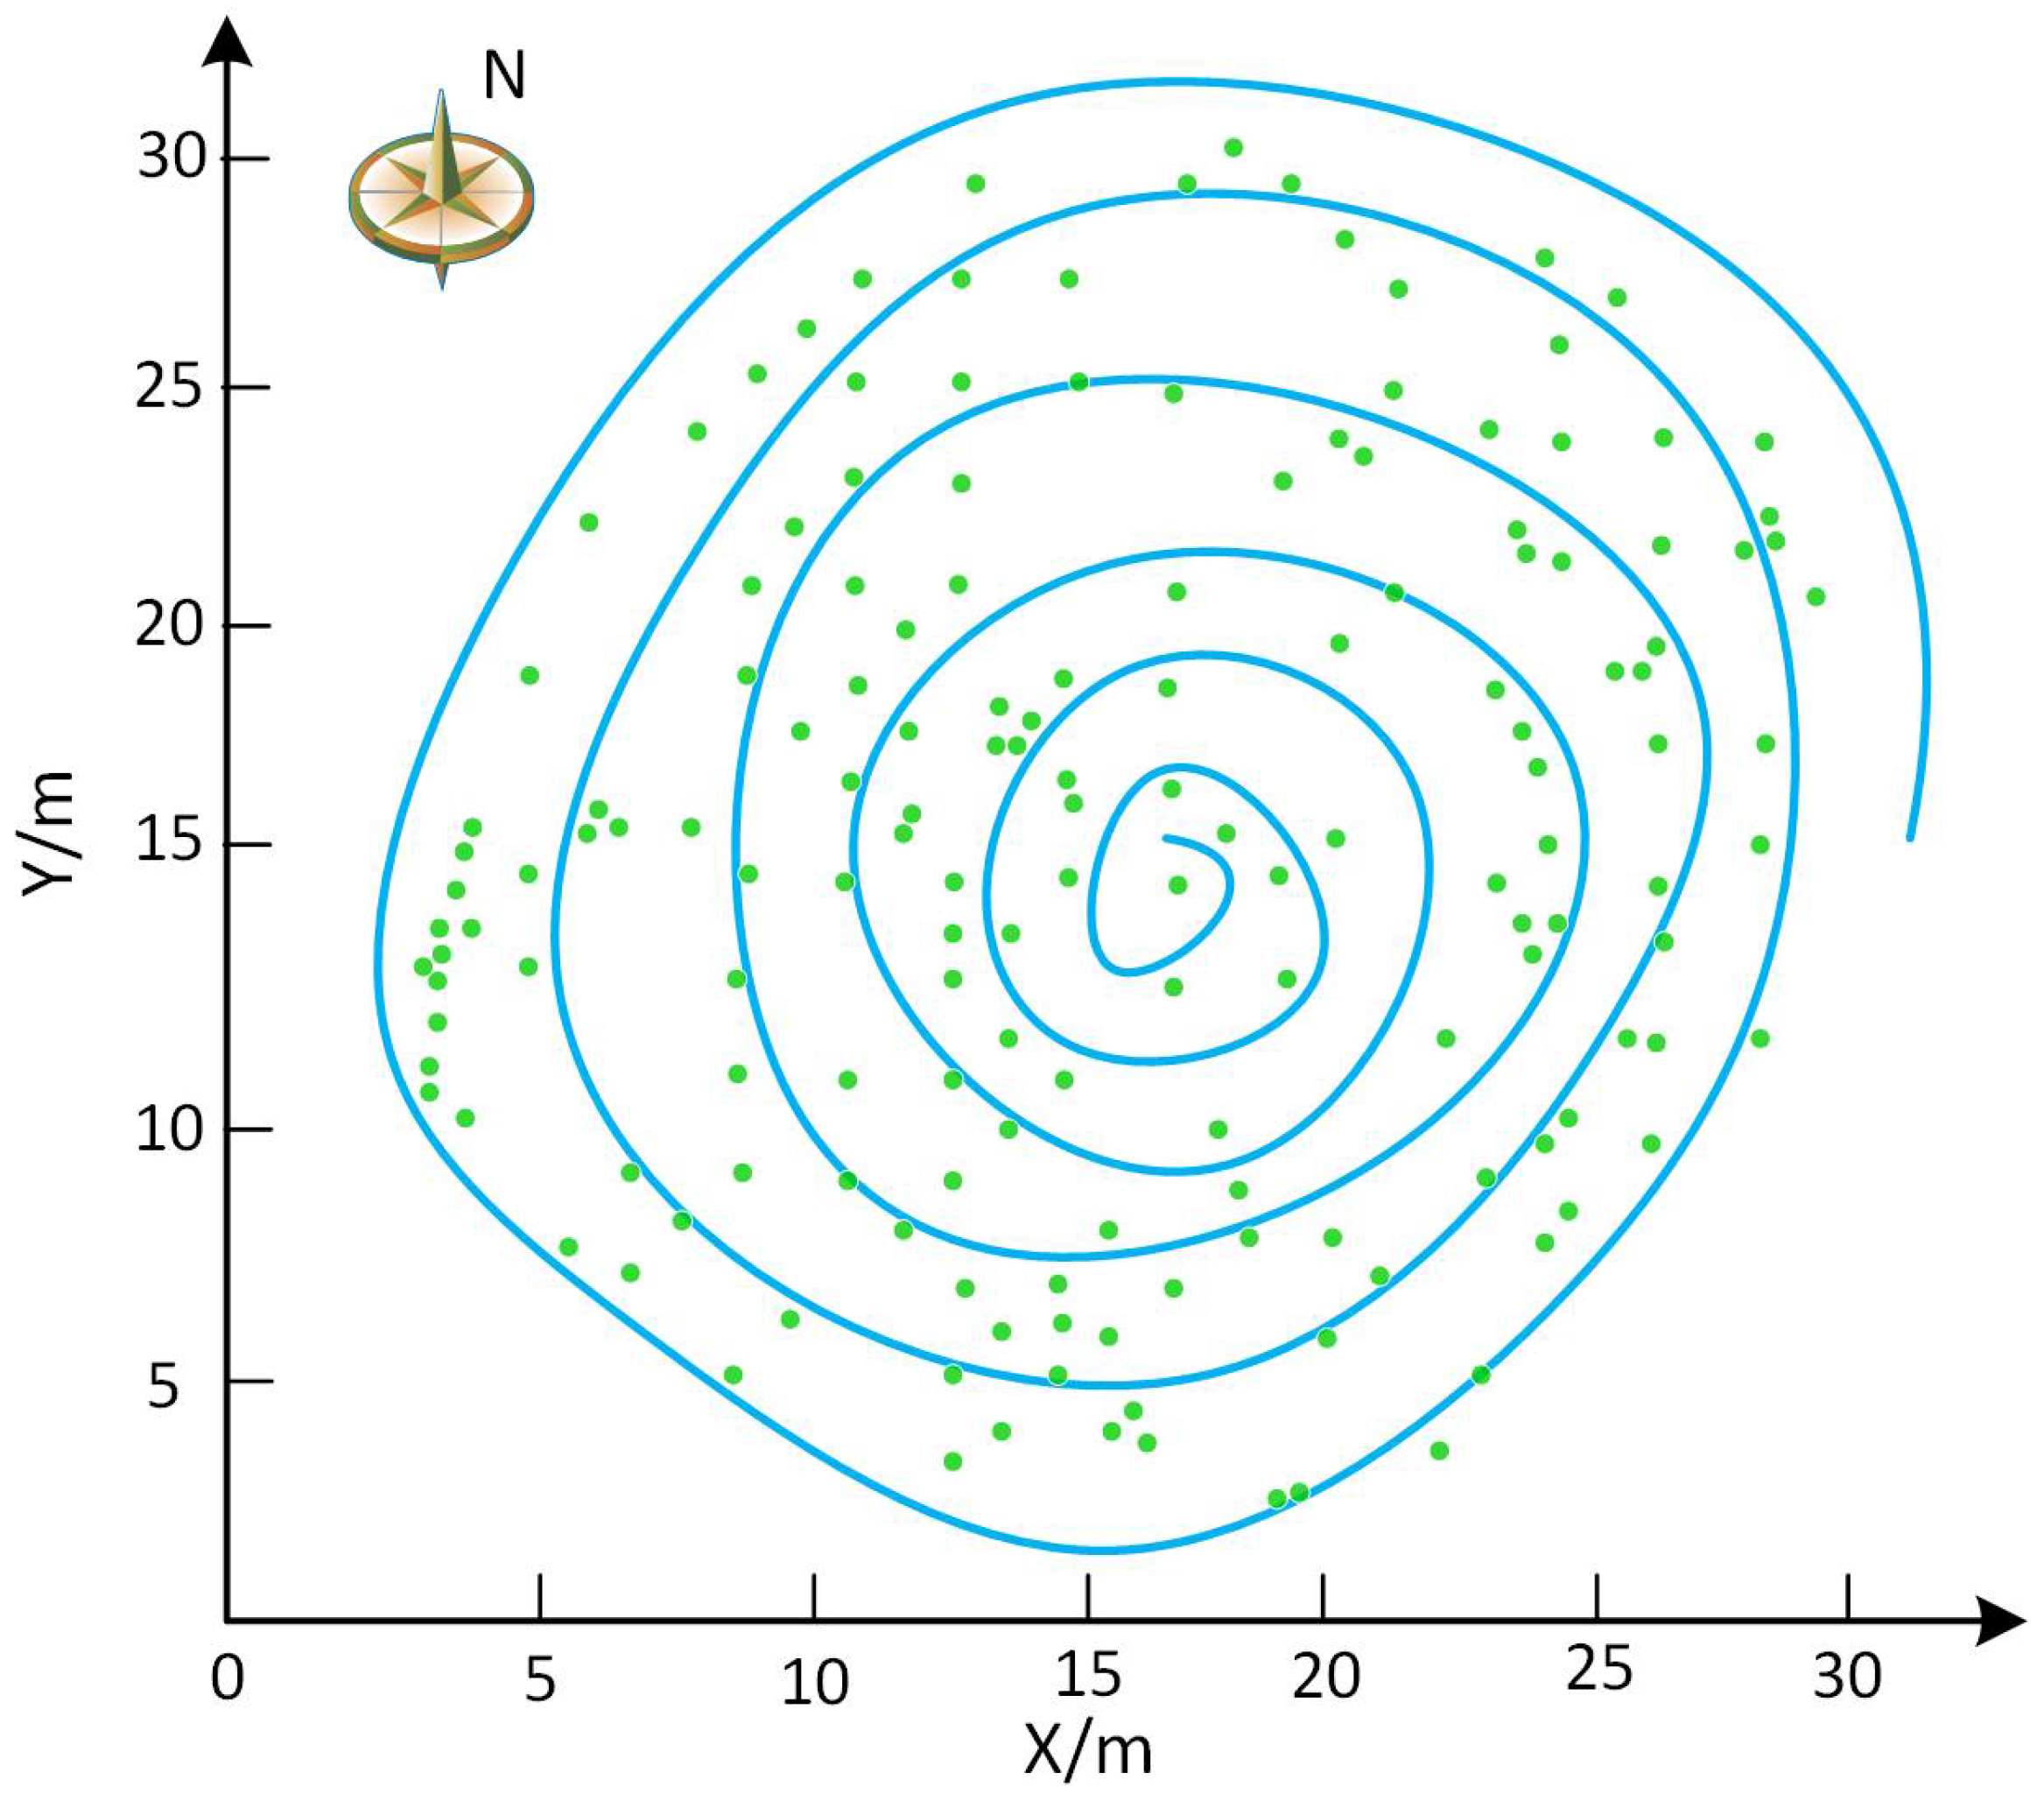
Photo Collection

On 14 July 2019, we fixed two Kodak PixPro SL25 lens cameras (Eastman Kodak Company, Rochester, New York, NY, USA, www.kodakpixpro.com (accessed on 30 July 2021)) to a stick with a length of 60 cm. The SL25 has a 25x optical zoom and is equipped with a 16.76 million pixel back-illuminated CMOS sensor. Before working, the camera needs to be calibrated and corrected by software named GML Camera Calibration Toolbox 0.75 (Lomonosov Moscow State University, Moscow, Russia, https://web.archive.org/web/20190103151950/ http://graphicscs.msu.ru/en/node/909 (accessed on 30 July 2021)). To make the two cameras work synchronously, connect to the smartphone software named PixPro Remote Viewer 2.6.5 (Eastman Kodak Company, Rochester, New York, https://kodakpixpro.com/support/pixpro-app-downloads (accessed on 30 July 2021)) through the built-in WiFi of the camera, and transfer the captured pictures to the phone or save to the camera’s SD card. To measure the generated 3D point clouds, it is necessary to set the real world reference scale to the point clouds. Due to the occlusion of the forest canopy, Global Navigation Satellite System (GNSS) coordinate information was not introduced in the data-collection process. To match the forest inventory data with the TP point clouds, we evenly placed five target poles, Figure 2, in the sample plot. Each three-meters pole was placed perpendicular to the ground. Every two poles were visible to each other, and we took photos of five target poles. Using the total station, the coordinates of the trees in the plot are obtained one by one. To collect pictures of trees, we adopted the “spiral curve” route to take photos in the sample plot Figure 3. To better obtain tree canopy information, the two lens cameras point to the target tree and the main optical axes were in the same vertical plane, the lower lens was horizontally forward, and the main optical axis of the upper lens was tilted up 30° from the horizontal. Starting from the center of the plot, the method of scanning from inside to outside was adopted to reach the outermost periphery of the plot. The scanning path consists of several irregular concentric circles. Starting from the north of the plot, the path rotates clockwise around the central tree. To keep the camera stable, the walking speed is controlled at 1 m/s, and it took 60 min to complete the collection of 1108 tree photos.

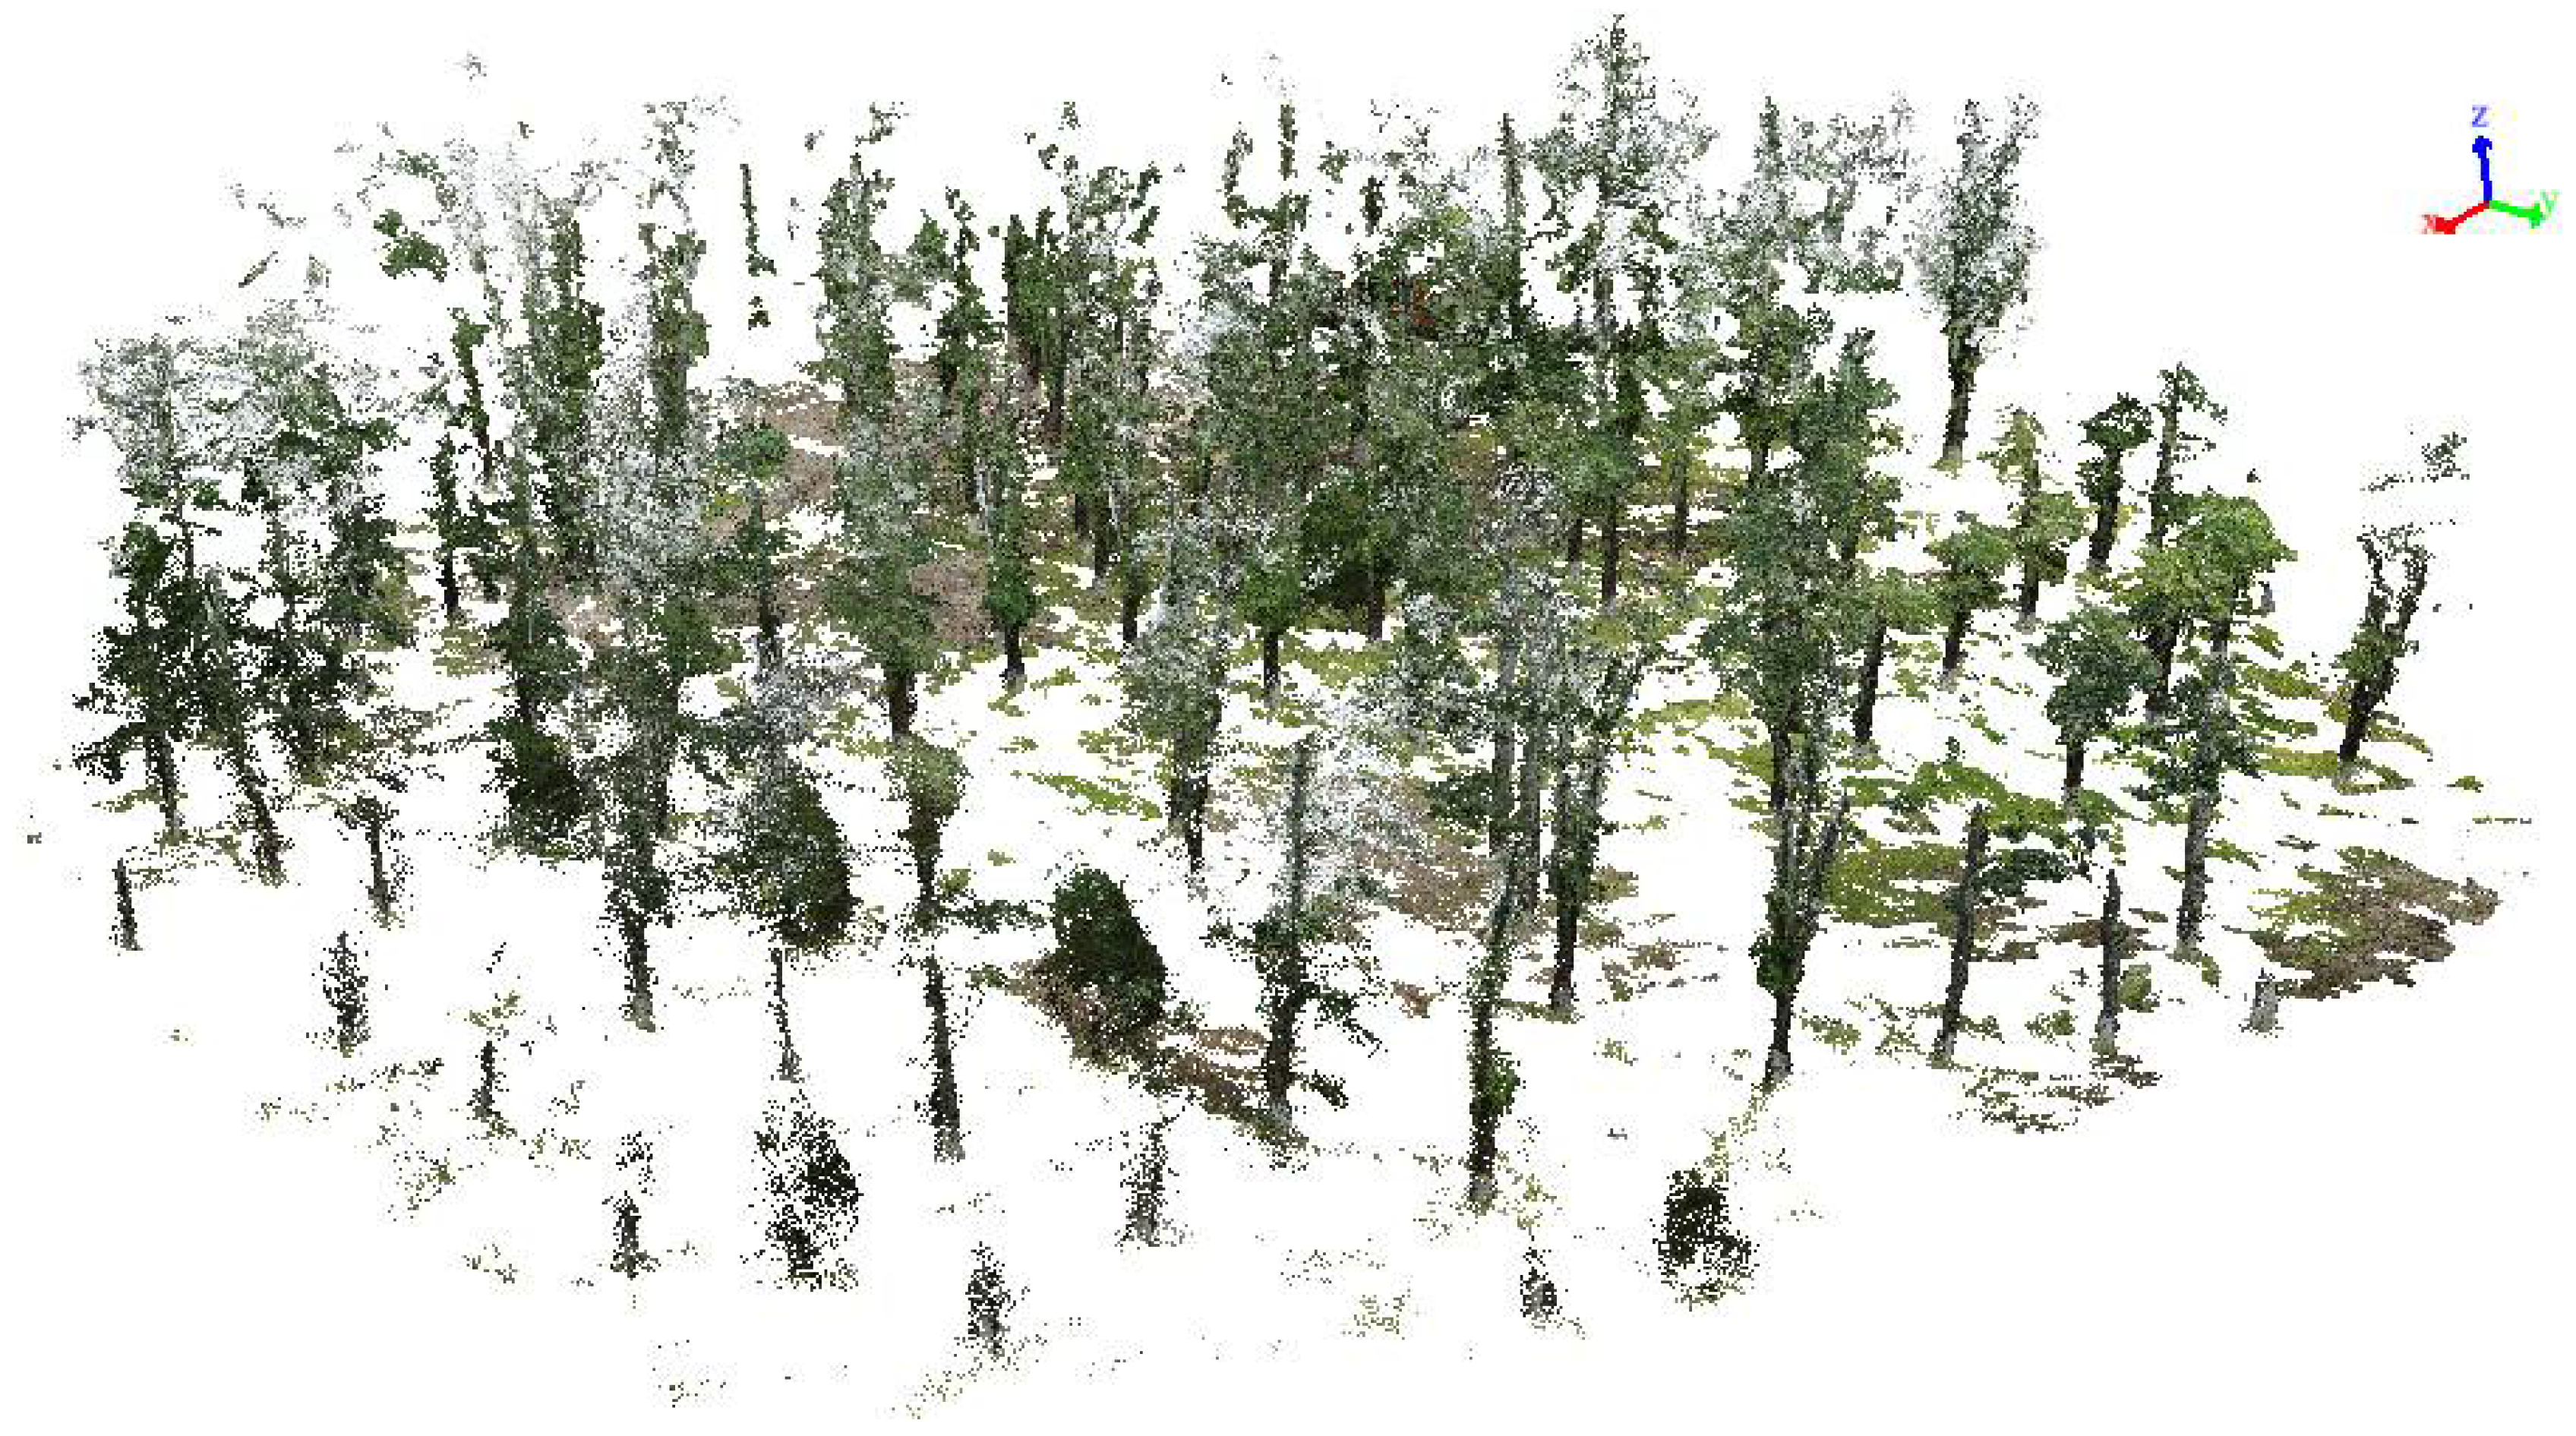
3D Point Cloud Generation Based on Photos

After we collected the photos, we used the SfM to construct dense point clouds. In this paper, the commercial software Pix4D mapper 4.5.2 (Pix4D company, Prilly, Switzerland, www.pix4d.com (accessed on 30 July 2021)) was used to automatically realize the SfM process in 30 min, which generated a 3D point cloud of the plot from the disordered 2D photo by searching for feature points. In the photo-matching process, the Scale Invariable Feature Transformation (SIFT) algorithm matched data based on the feature points between the stereo pairs [28,44]. The model is optimized by bundle block adjustment and nonlinear least squares algorithm [46]. However, the established 3D point clouds only had the image space coordinates system, but there are seven unknown parameters, such as one scale, three translations, and three rotations. We establish and define a local reference system, starting from true north. Therefore, the target poles can provide absolute scale for the point clouds and realize the transformation between the image space coordinate and the object space coordinate. According to the quality report automatically generated by Pix4D software, the point density is checked. After the data were preprocessed, the 3D-rendering effect of plot was obtained, Figure 4. The height of these tree point clouds ranged from 5.27 m to 16.05 m.

Individual Tree Segmentation

The segmented individual tree point clouds will be used as the input data of QSM. This paper used LiDAR360 software V3.1 (Beijing Digital Green Earth Technology Co., Ltd., Beijing, China, http://greenvalleyintl.com (accessed on 30 July 2021)) to extract individual tree from the point clouds of the plot. The main pre-processing steps of extracting individual tree from the point clouds at the plot level included ground point filtering, resampling, the digital elevation model (DEM) generation [45,46]. First, the point clouds were resampled by using the minimum point spacing method [47]. Then the improved asymptotically encrypted triangulation filtering algorithm was used to classify the ground points, and the DEM was established through the irregular triangulation interpolation algorithm [47,48]. After completing operations such as normalization of the plot point clouds, the seed points were obtained through the clustering algorithm. The individual trees are divided one by one according to the seed points. Finally, we got 72 individual tree point clouds.
The accuracy of individual tree segmentation will directly affect the accuracy of the QSM, and further affect the estimation accuracy of tree attributes. In this paper, the individual tree point clouds after segmentation were checked one by one. The incorrectly classified trees were manually re-segmented. The trees with incomplete point clouds were eliminated by visual method. The point clouds distribution of some trees was obviously abnormal, and these noise points were manually removed. Finally, a total of 44 trees were used for structural modeling and attributes calculation.

2.2. Enable AdQSM to Automatically Rebuild Tree Structure

In 2019, the AdTree method reconstructed the accurate 3D geometry and topological structure of trees [40]. In 2020, the AdQSM method was updated and extended based on the AdTree method [41]. Guangpeng Fan et al. [42] proved that AdQSM and TreeQSM have similar or slightly higher accuracy in extracting large tropical tree volume
The minimum spanning tree (MST) between the Delaunay triangulation edges of point clouds was found [49,50]. The length of edge defined in Euclidean space weighted all edges. The Dijkstra’s shortest path algorithm was used to extract tree initial skeletons. The main branching points are predetermined and concentrated to improve the quality of the skeleton [51,52]. To reconstruct the final lightweight skeleton, the vertices and edges were assigned weight values and small noisy components were removed based on this value. Adjacent vertices were merged by iteratively checking the proximity between adjacent vertices. A series of cylindrical fitting points were used to approximate the geometry of tree trunks and branches. The main modeling process of AdQSM is shown in Figure 5a–f.

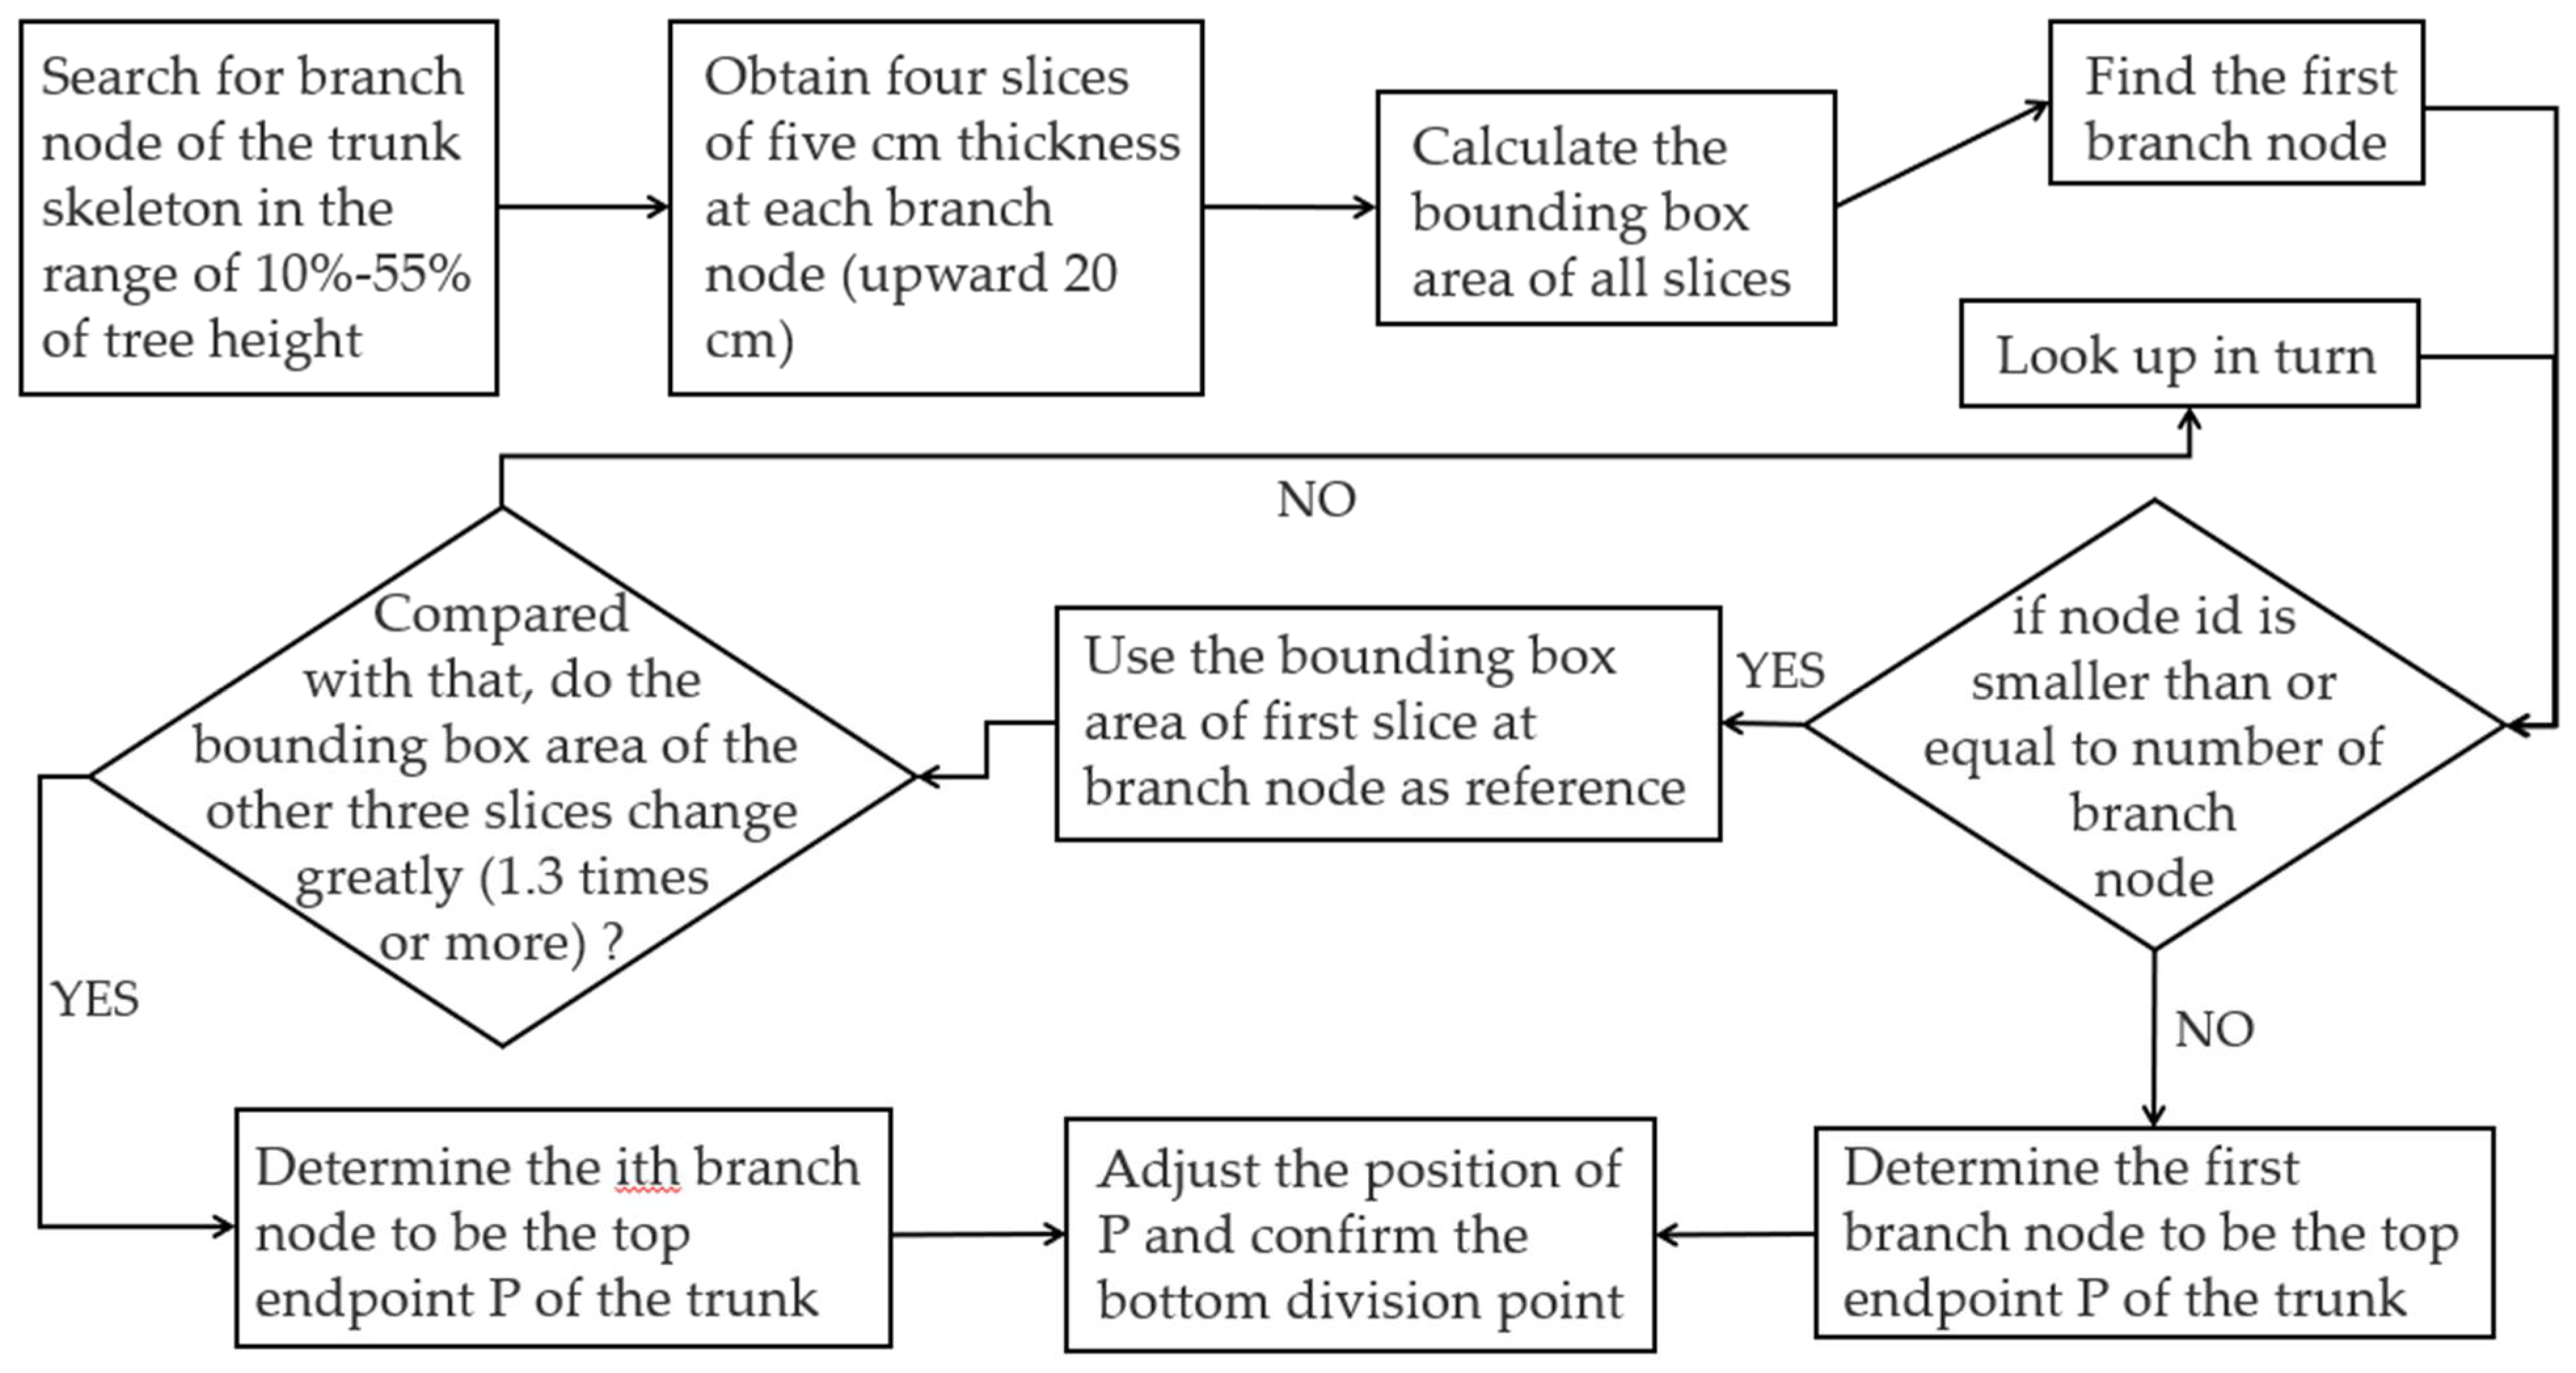
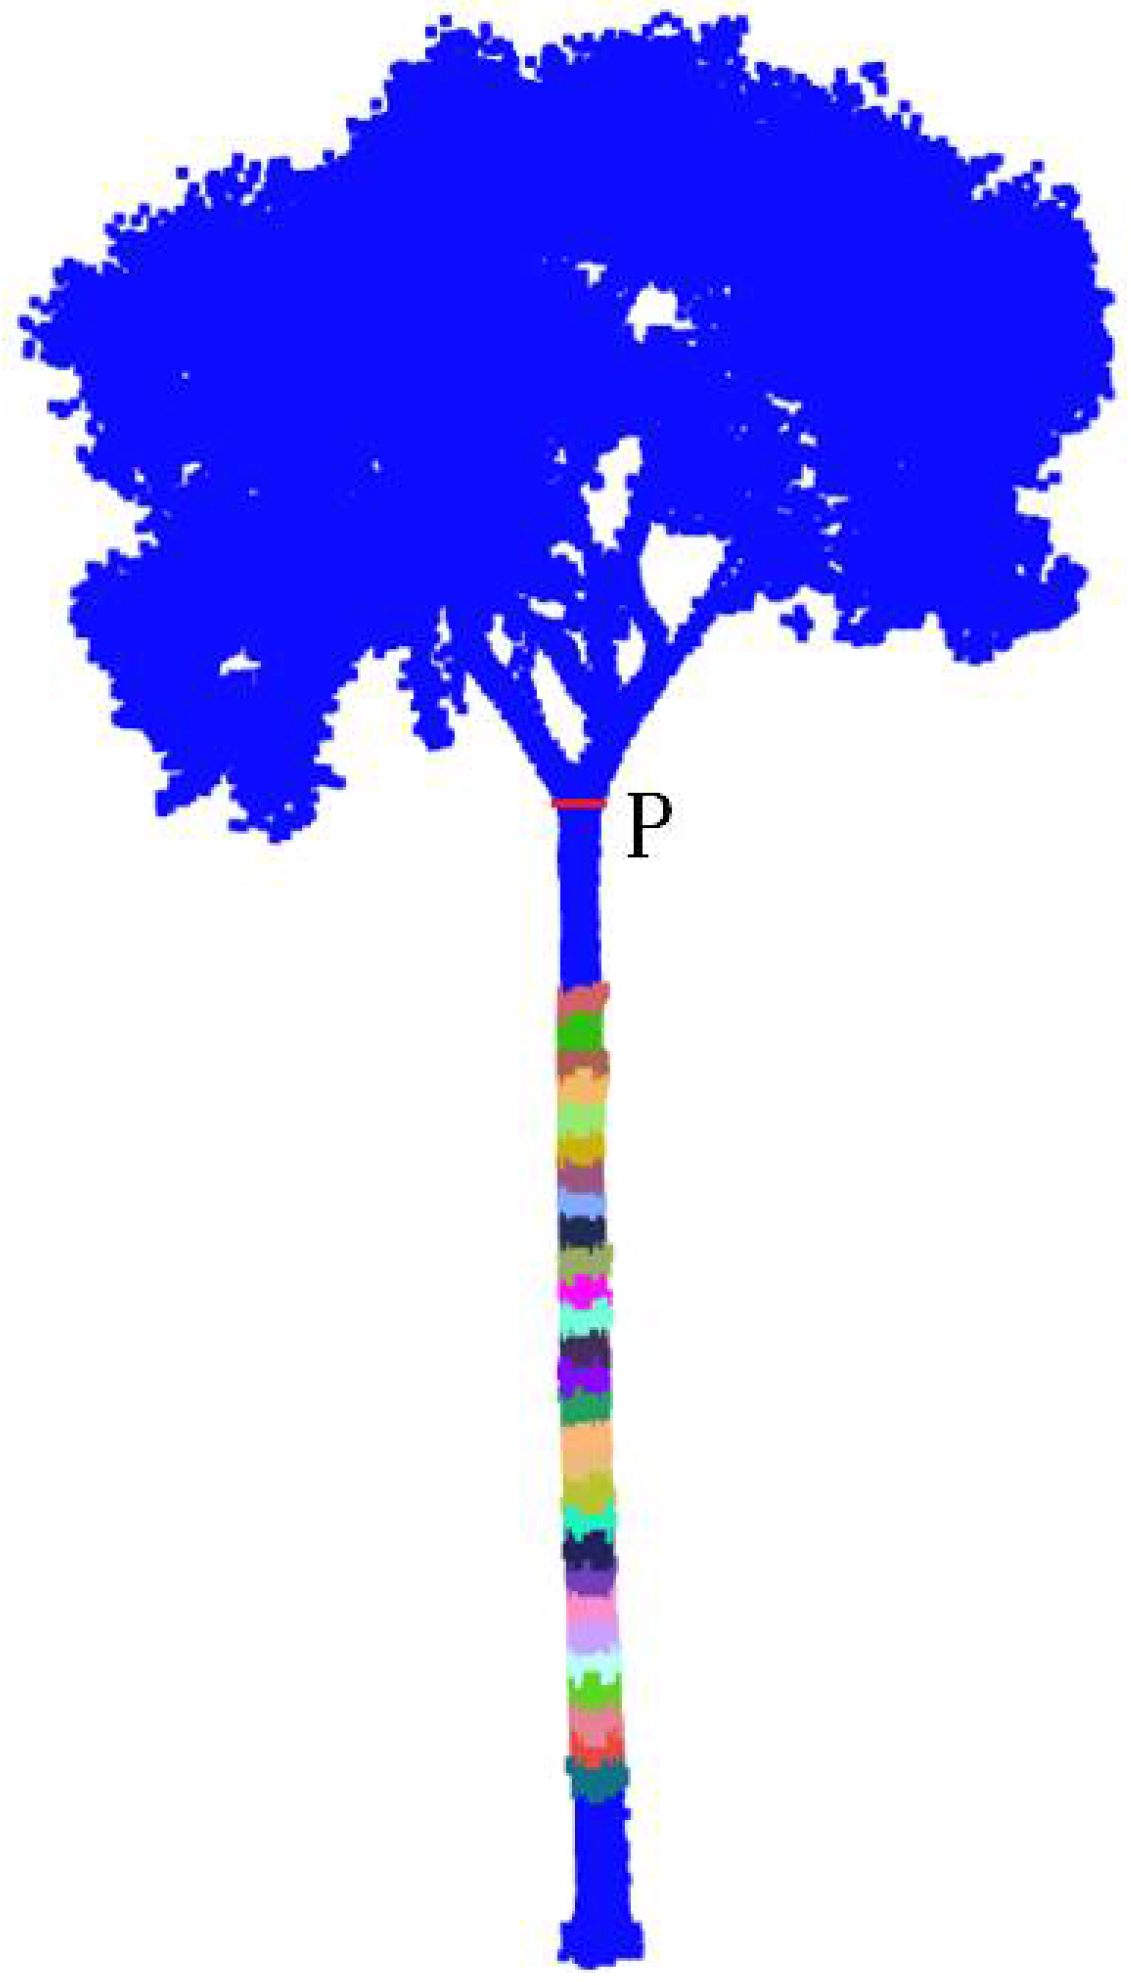
2.2.1. Automatic Trunk Recognition

In our previous research, it was necessary to manually select part of the tree trunk during the AdQSM modeling process. AdQSM reconstructs the cylinder of the branch geometry from the bottom up and needs to accurately calculate the initial cylinder radius at the bottom of tree trunk. Fit the first cylinder at the bottom of trunk by manually selecting the point cloud of the tree trunk (the point cloud marked by different colors in Figure 5g). To reduce user intervention, this paper implements the AdQSM automatic modeling method. Different from the manual modeling in previous studies, the work shown in Figure 5g can accurately identify and segment the tree trunk point clouds. Based on the distribution of tree skeleton nodes and combined with the distribution of the height to crown base (HCB), we identified the places where the change of tree trunk point cloud was relatively stable. The design and process of the algorithm are as follows, Figure 6.
(1) Take 20 cm upward from each branch node of the trunk skeleton and cut the point clouds of the entire trunk horizontally into slices with a thickness of 5 cm. There will be four slices at each branch node. The search range for the bifurcation nodes of the skeleton is 10–55% of the tree height. The slices of all branching vertices in this range are obtained, and the bounding box area of all slices is calculated.
(2) Since the first fork node of the trunk skeleton is more likely to be the top end of the trunk, the first fork node is judged first. The bounding box area of the first slice at the first fork node was used as the reference point. If the bounding box area of the other three slices changed significantly (1.3 times or more), the first fork node was used as the top endpoint P of the trunk.
(3) If the situation in (2) is not met, follow the principle of “compare itself first, then others”. Take the bounding box area of the first slice of the ith (i = 2,3,4...) node as the reference, if the bounding box area of the other three slices changes significantly (1.3 times or more), then the ith node is taken as the top endpoint P of the trunk.
(4) If the ith node does not satisfy the condition of (3), compare the bounding box area of 1 slice of the ith node with the bounding box area of the first slice of the (i-1)th node. If there is a large change (1.3 times or more), the ith node is considered to be the top endpoint P of the trunk Figure 7.
(5) If all the fork nodes do not meet the condition of (4), the first node will be taken as the fork point, that is, the top endpoint P of the trunk fork.
(6) In order to ensure that the tree trunk point cloud participating in fitting the initial cylinder is more reliable, move the position of point P down for 1 5 h , and the bottom is divided from ( 1 1 5 ) h × 1 6 .

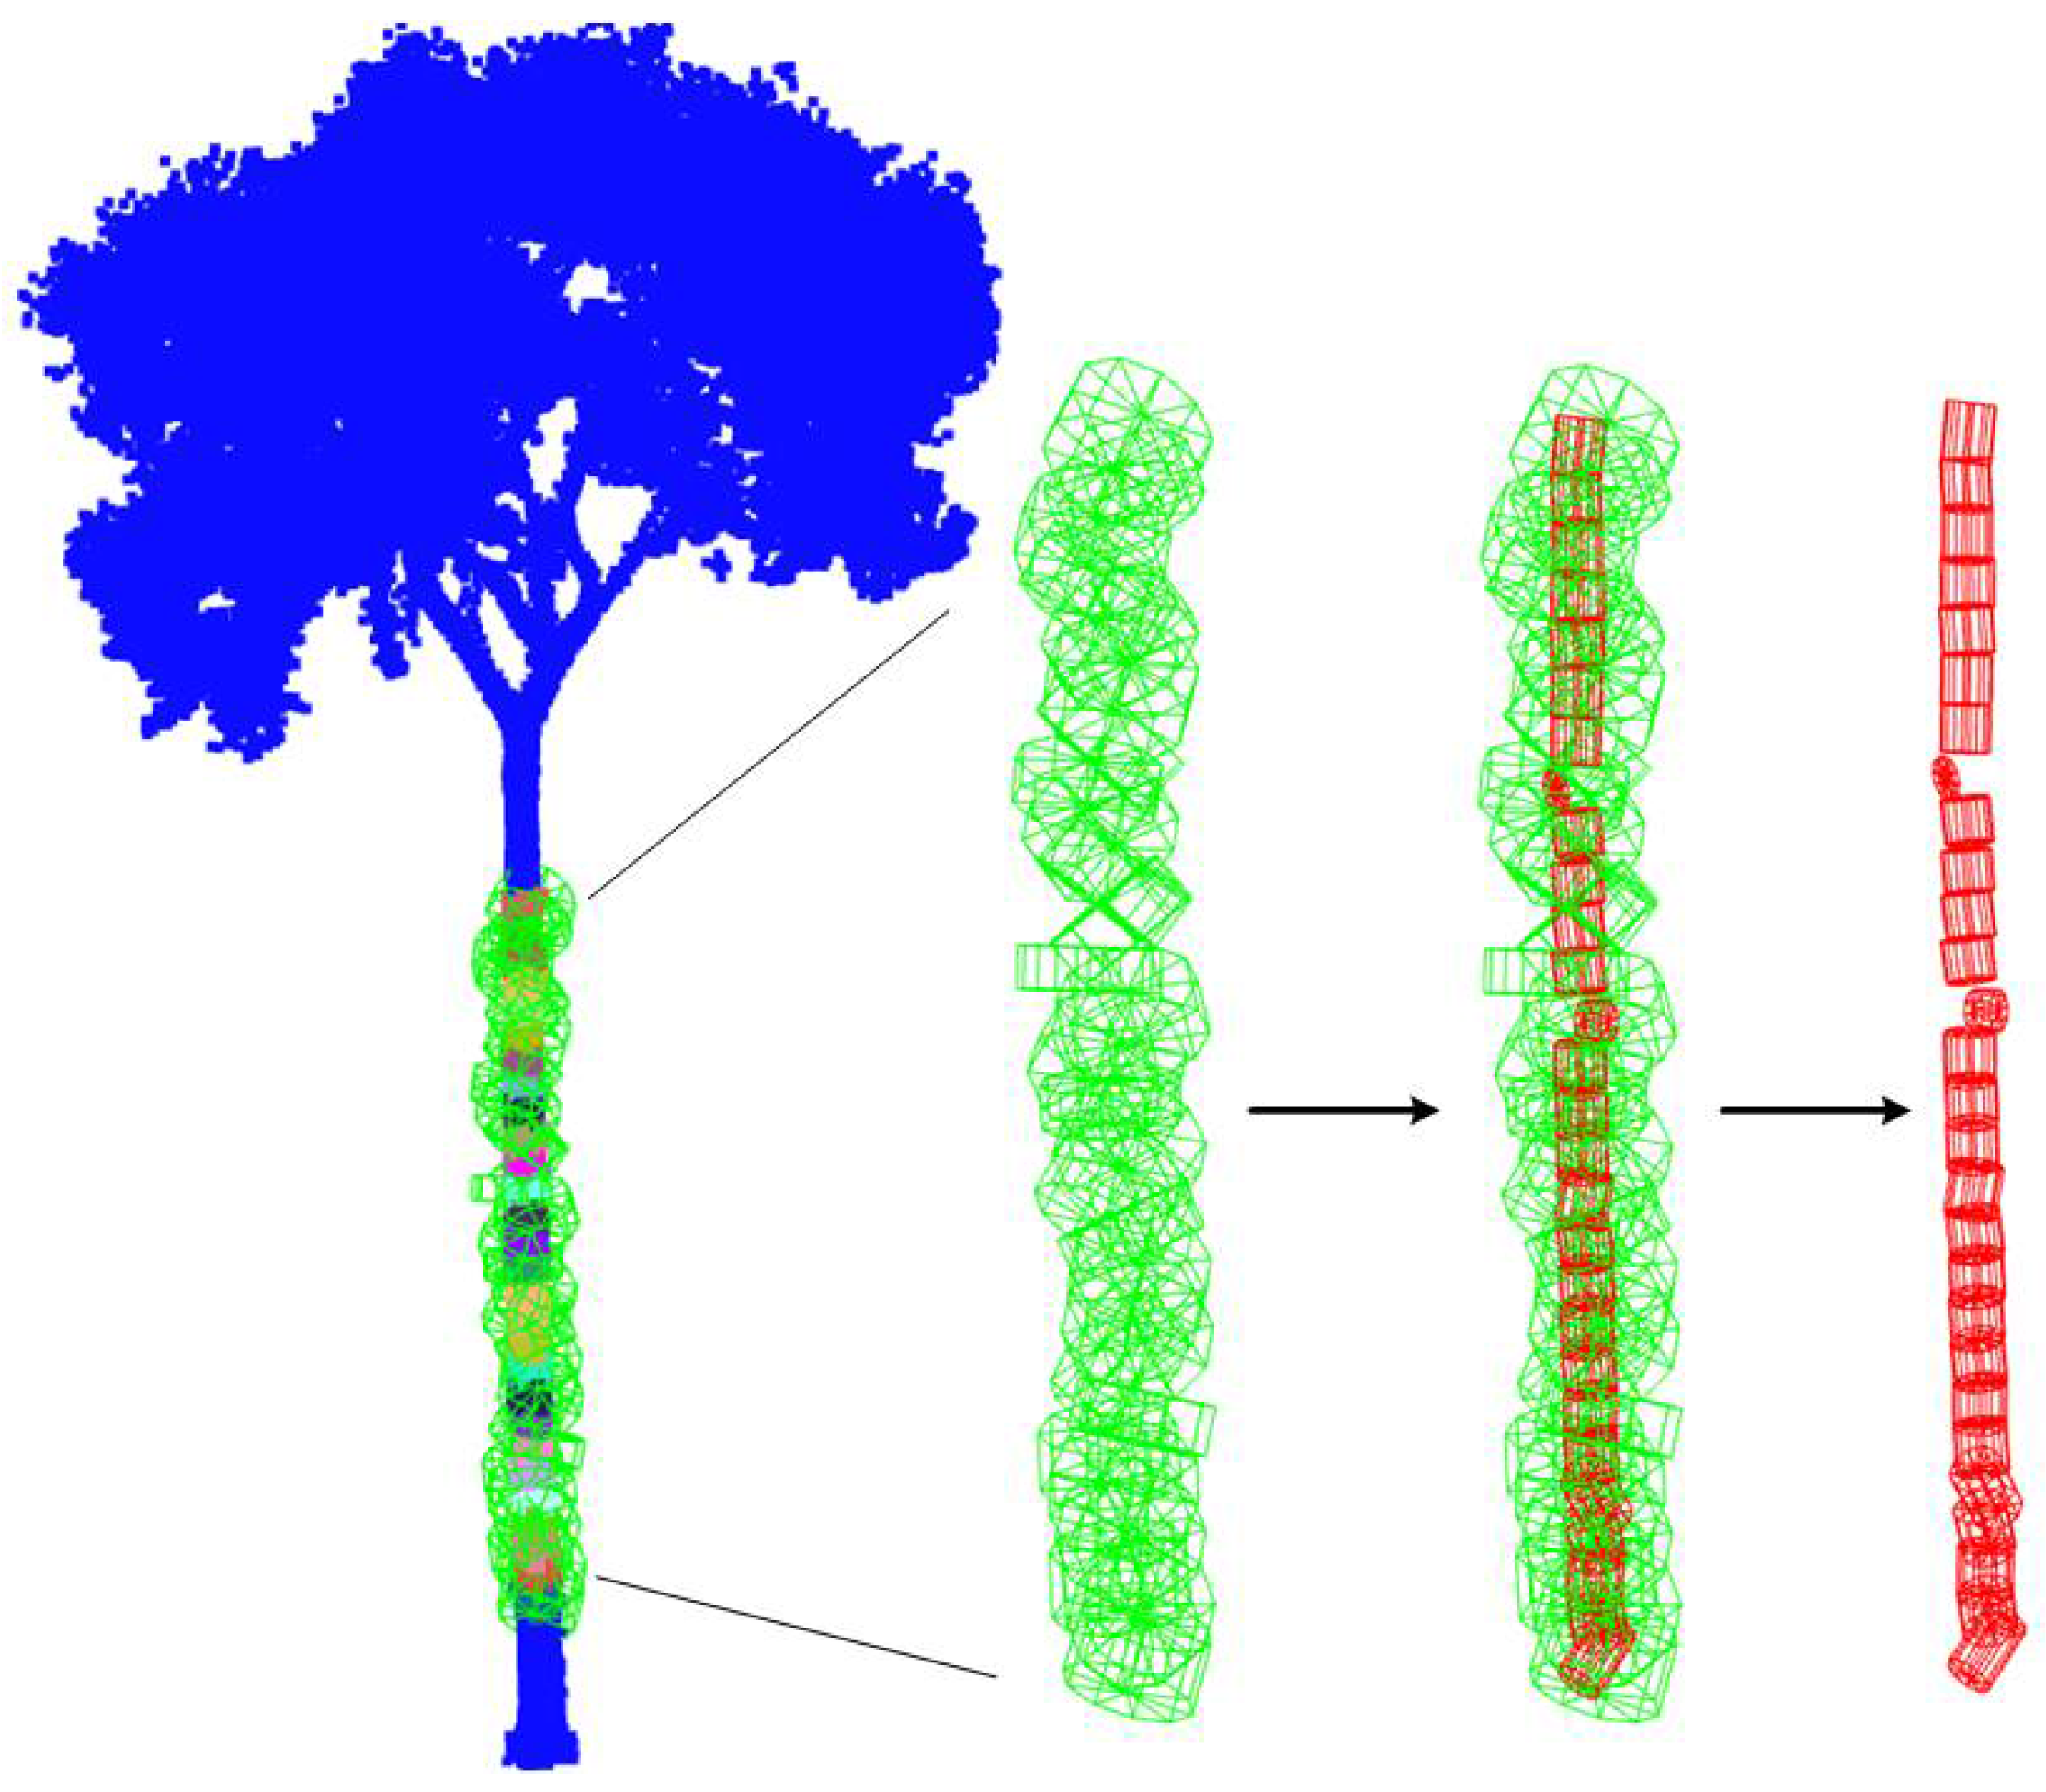
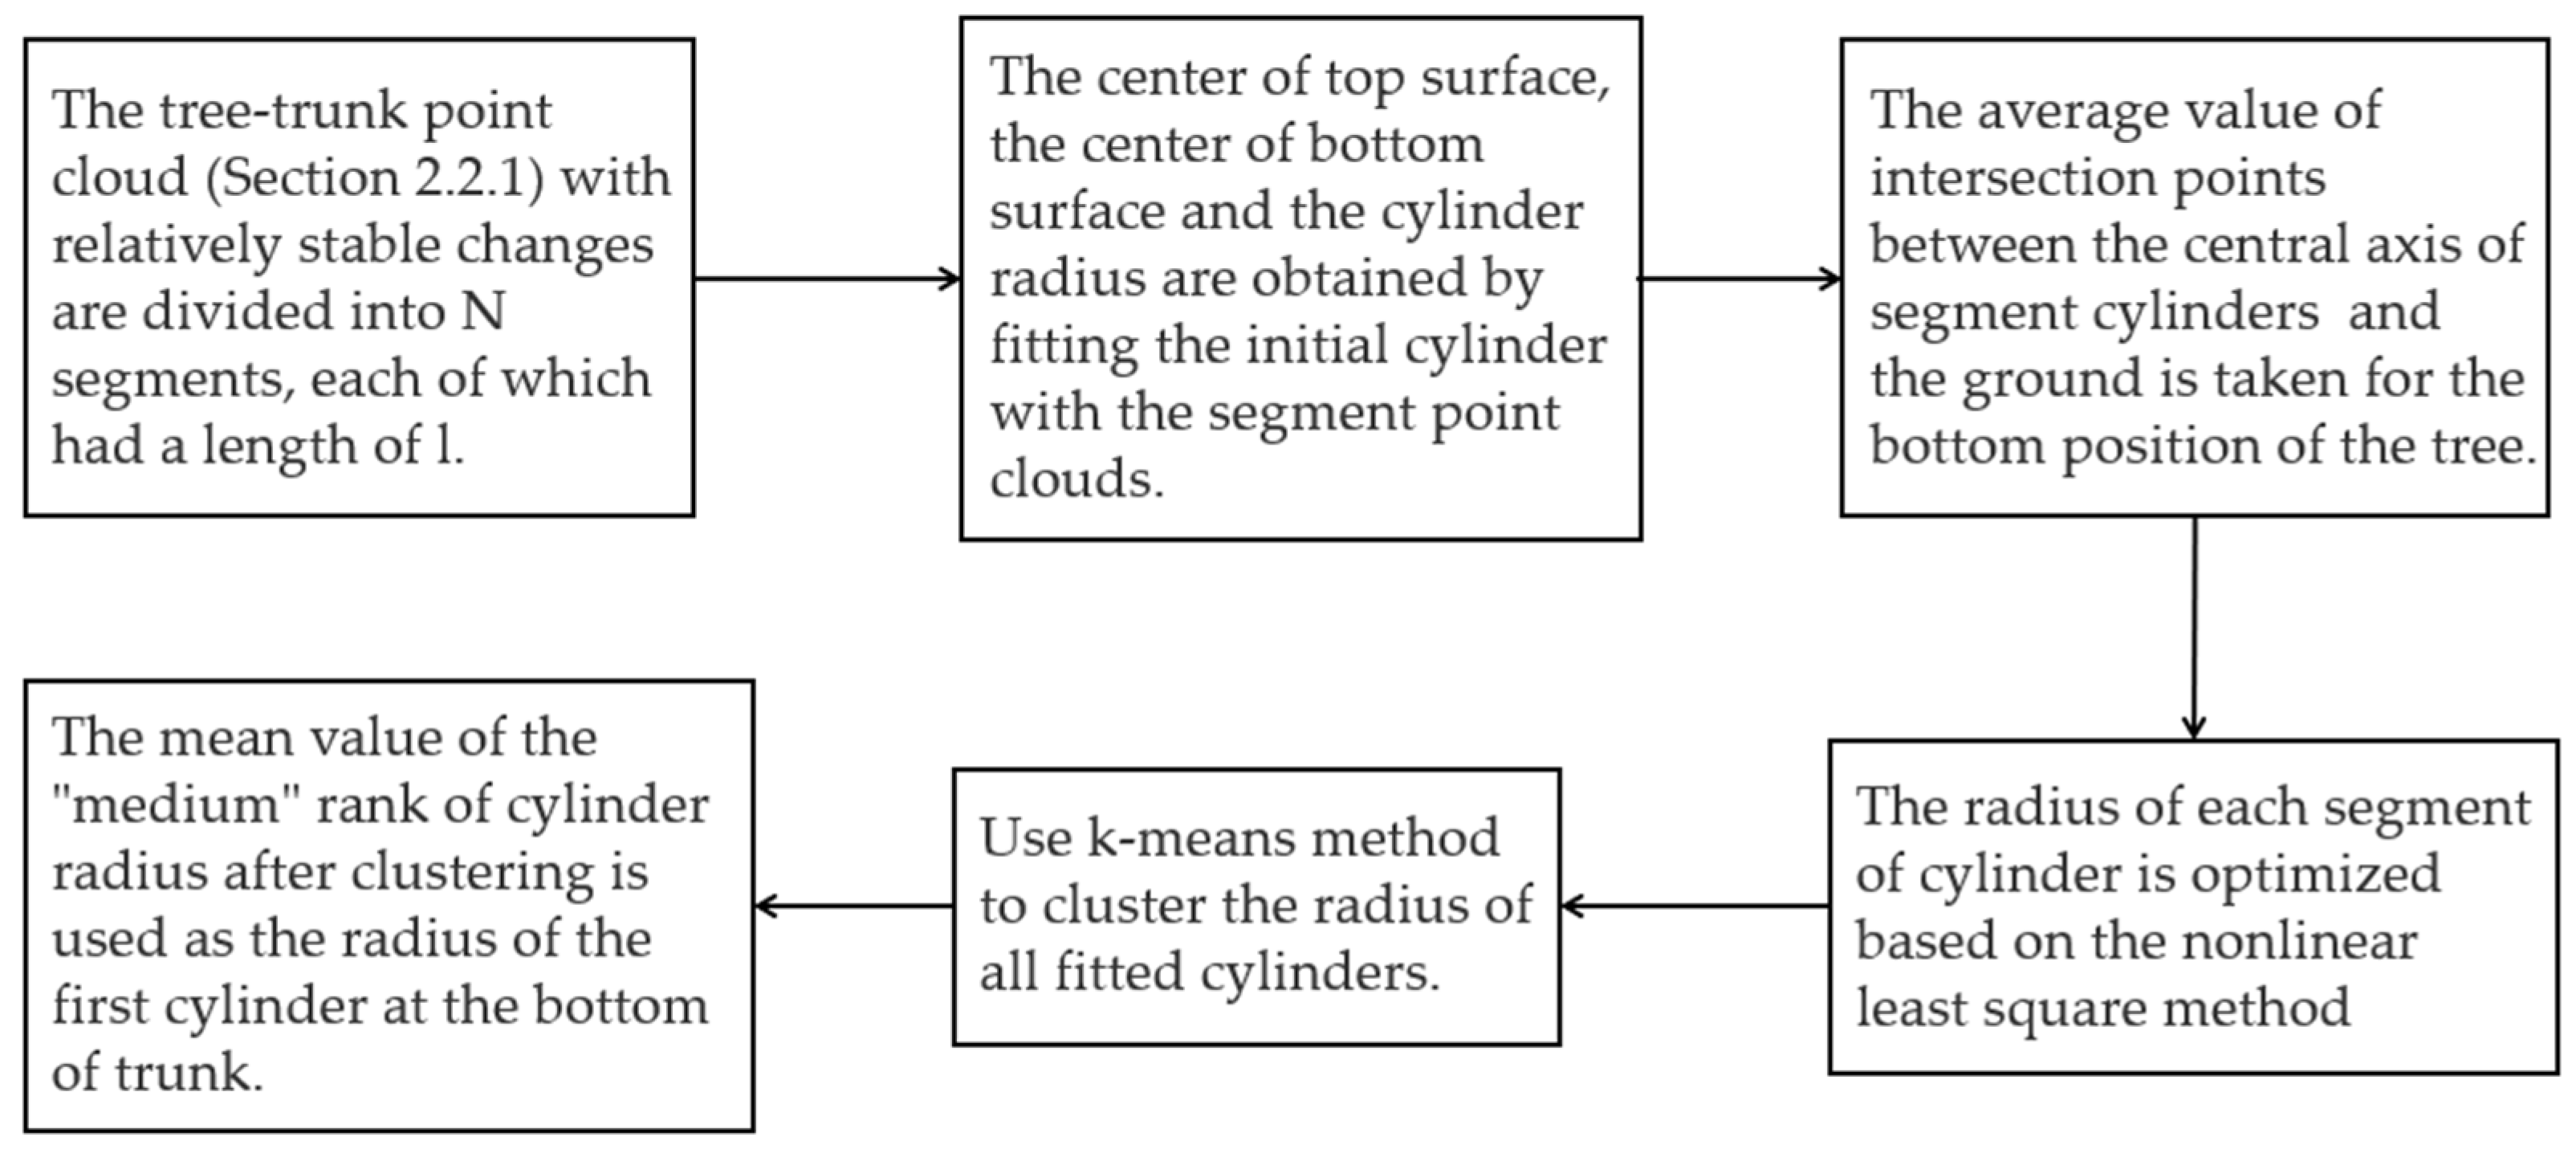
2.2.2. Initial Cylinder Radius Clustering

To fit the first cylinder at the bottom of the trunk, Section 2.2.1 designed and implemented an algorithm to automatically select a relatively stable segment of the point clouds of the trunk. The tree trunk with relatively stable point cloud changes was identified and marked, and the top end point P of the tree trunk was found. The initial cylinder is fitted to calculate its radius accurately. In this paper, the identified point clouds are divided equally by different lengths, l , in cm (10, 20, 30, 40, …, 100). According to the distribution law of the cylinder radius fitted by each segment of the marked point cloud, the radius of the initial cylinder is clustered. The number of cylinders participating in the initial cylinder radius of clustering Figure 8 is N, which is calculated by N = L l . L is the total length of the segmented trunk point cloud.
The process of tree branch structure fitting and optimization is as follows, Figure 9.
(1) The method of Section 2.2.1 was used to search the top endpoint P of the trunk from bottom to top, and the point cloud of the trunk was evenly divided by fixed length l to obtain the point cloud of N segments without interval.
(2) In segmented point clouds (used to fit the initial cylinder), the point with the largest Z-value is set as the center of the top surface, and the point with the smallest Z-value is set as the center of the bottom surface. Taking half of the length or width (the maximum of both) of the minimum envelopment box of segmented clouds as the radius, the initial cylinder is determined, including the center of the cylinder’s top surface, the center of the cylinder’s bottom surface, and the radius.
(3) Determine the intersection point between the central axis of the N cylinder segments and the ground after extending downward, and take the average of the N intersection points as the position of the bottom of the tree. After obtaining the rough radius of the cylinder, the radius of each segment of the cylinder is calculated based on the nonlinear least square method.
(4) Fit N segments of point clouds (equal length) into N cylinders. K-means method was used to cluster all cylinder radius, so as to ensure the accuracy of the initial cylinder radius of the fitted tree trunk as much as possible. We divide the size of cylinder radius into three levels: large, medium, and small. The average value of the clustered radius (medium level) is used as the initial radius of the first cylinder at the bottom of the trunk.
After the completion of step (2), fitting the cylinder (the red cylinder in Figure 8) participating in the initial cylinder radius of clustering based on the segmented and identified trunk point cloud belongs to a typical nonlinear least square problem. The specific calculation method can refer to our previous research [41].
This paper will use AdQSM to reconstruct the tree trunk volume from the TP point clouds. At present, the AdQSM program based on C++ can automatically estimate tree height, DBH, tree (trunk and branches) volume, length of trunk, length of branches, total number of branches, the height of living crown, tree crown volume, and other tree attributes.

2.3. Comparision of Trunk Volume

QSM method can directly estimate trunk volumes from reconstructed tree model. The most difference from the allometric equation is that tree height and DBH are not required as parameter inputs. We compare the trunk volume estimated by AdQSM with the reference value of the trunk volume calculated by the allometric equation. TreeQSM was also used to model the same dataset and compared the accuracy of AdQSM and TreeQSM in estimating the trunk volume.

2.3.1. Allometric Equation

This paper uses an allometric equation based on destructive measurement data [48] to estimate the trunk volume as a reference value for the QSM method. The accuracy of the allometric equation is 95.2%, and the RMSE is 0.00145 m3.
V trunk = 0.000047     D 1.79211     H 1.11376

2.3.2. TreeQSM

TreeQSM is a method of reconstructing the wooden structure of trees developed by Raumonen et al. [1] and further developed by Calders, Newnham, and Raumonen et al. [49]. This method firstly segments TLS point cloud, reconstructs topological branch structure of the whole tree, and then reconstructs surface and volume of segments by fitting each segment to cylinder. The cylindrical model is used to automatically calculate entire woody part volume of an individual tree (trunk and branch). Under certain constraints, TreeQSM can reconstruct original length and volume with a relative error of less than 2%. TreeQSM performs cylindrical fitting of topological structure of the whole tree based on point cloud of an individual tree, Figure 10. After calculating the volume of each cylinder, the volume of trunk and branch of each tree are further calculated.
TreeQSM has two important input parameters, d and l. These two parameters define the patch size and relative length for the second cover. We randomly selected 10 trees from 44 sample trees and modeled each tree for ten times to determine relatively stable PatchDiam (i.e., surface patches diameter). The version we used of TreeQSM is 2.3.2. In the process of modeling TreeQSM based on MATLAB R2018b, some parameters are further optimized, PatchDiam1 is set to 0.1, which represents the patch size of the first unified size coverage set. PatchDiam2Min is set as 0.02, which represents the minimum patch size of the second cover set. PatchDiam2Max is set as 0.06, which represents the maximum patch size of the stem base in the second cover set. Lcyl that represents the relative (length/radius) length of cylinder is set to three.

2.4. Accuracy Evaluation

We used Bias, rBias, RMSE and rRMSE as test indicators to evaluate accuracy of AdQSM in estimating DBH, tree height, and trunk volume. The DBH and tree height of forest inventory were taken as reference values of DBH and tree height estimated by AdQSM. Trunk volume is one of the most important parameters provided by the QSM method. To evaluate the trunk volume more accurately, we took trunk volume derived from allometric equation as reference value in Section 2.3.1. CCC estimated by variance components based on R language is used to evaluate consistency between reconstructed trunk volume value by QSM and reference value.
Bias = 1 n i = 1 n ( y i y r i )
RMSE = ( y i y r i ) 2 n
rBias = Bias y r × 100 %
rRMSE = R M S E y r × 100 %
C C C = 2 ρ σ x σ y σ x 2 + σ y 2 + ( μ x + μ y ) 2
y i represents the estimated value from the ith tree of QSM. y r i represents reference measurements. y ¯ represents average of reference measurements. n represents the number of trees.   μ x and μ y are the means for the two variables. σ x 2 and σ y 2 are the corresponding variances. ρ is the correlation coefficient between the two variables.

3. Results

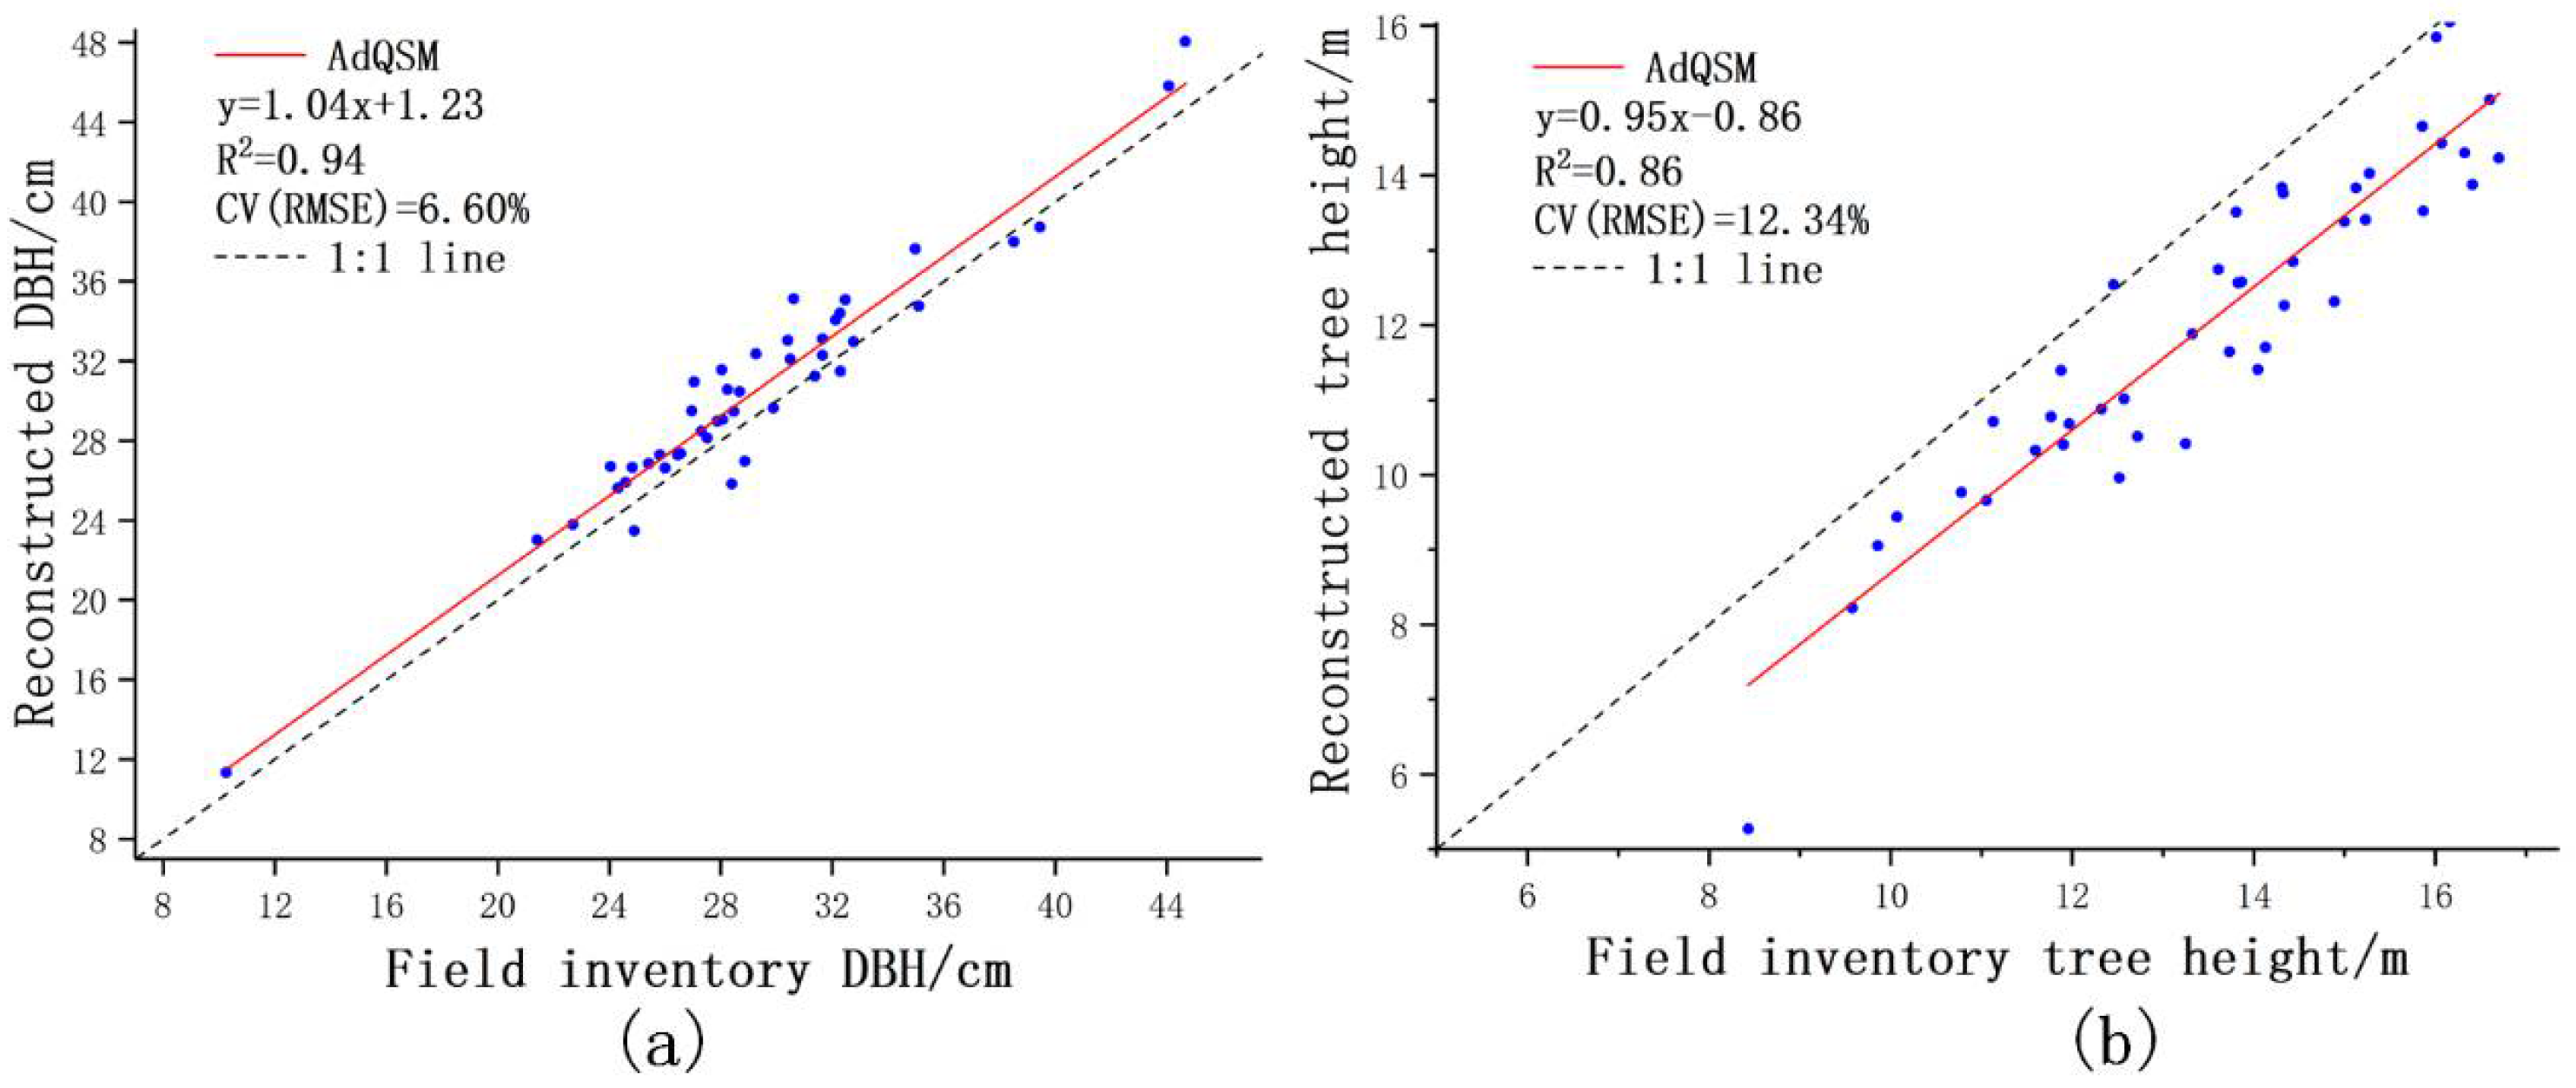
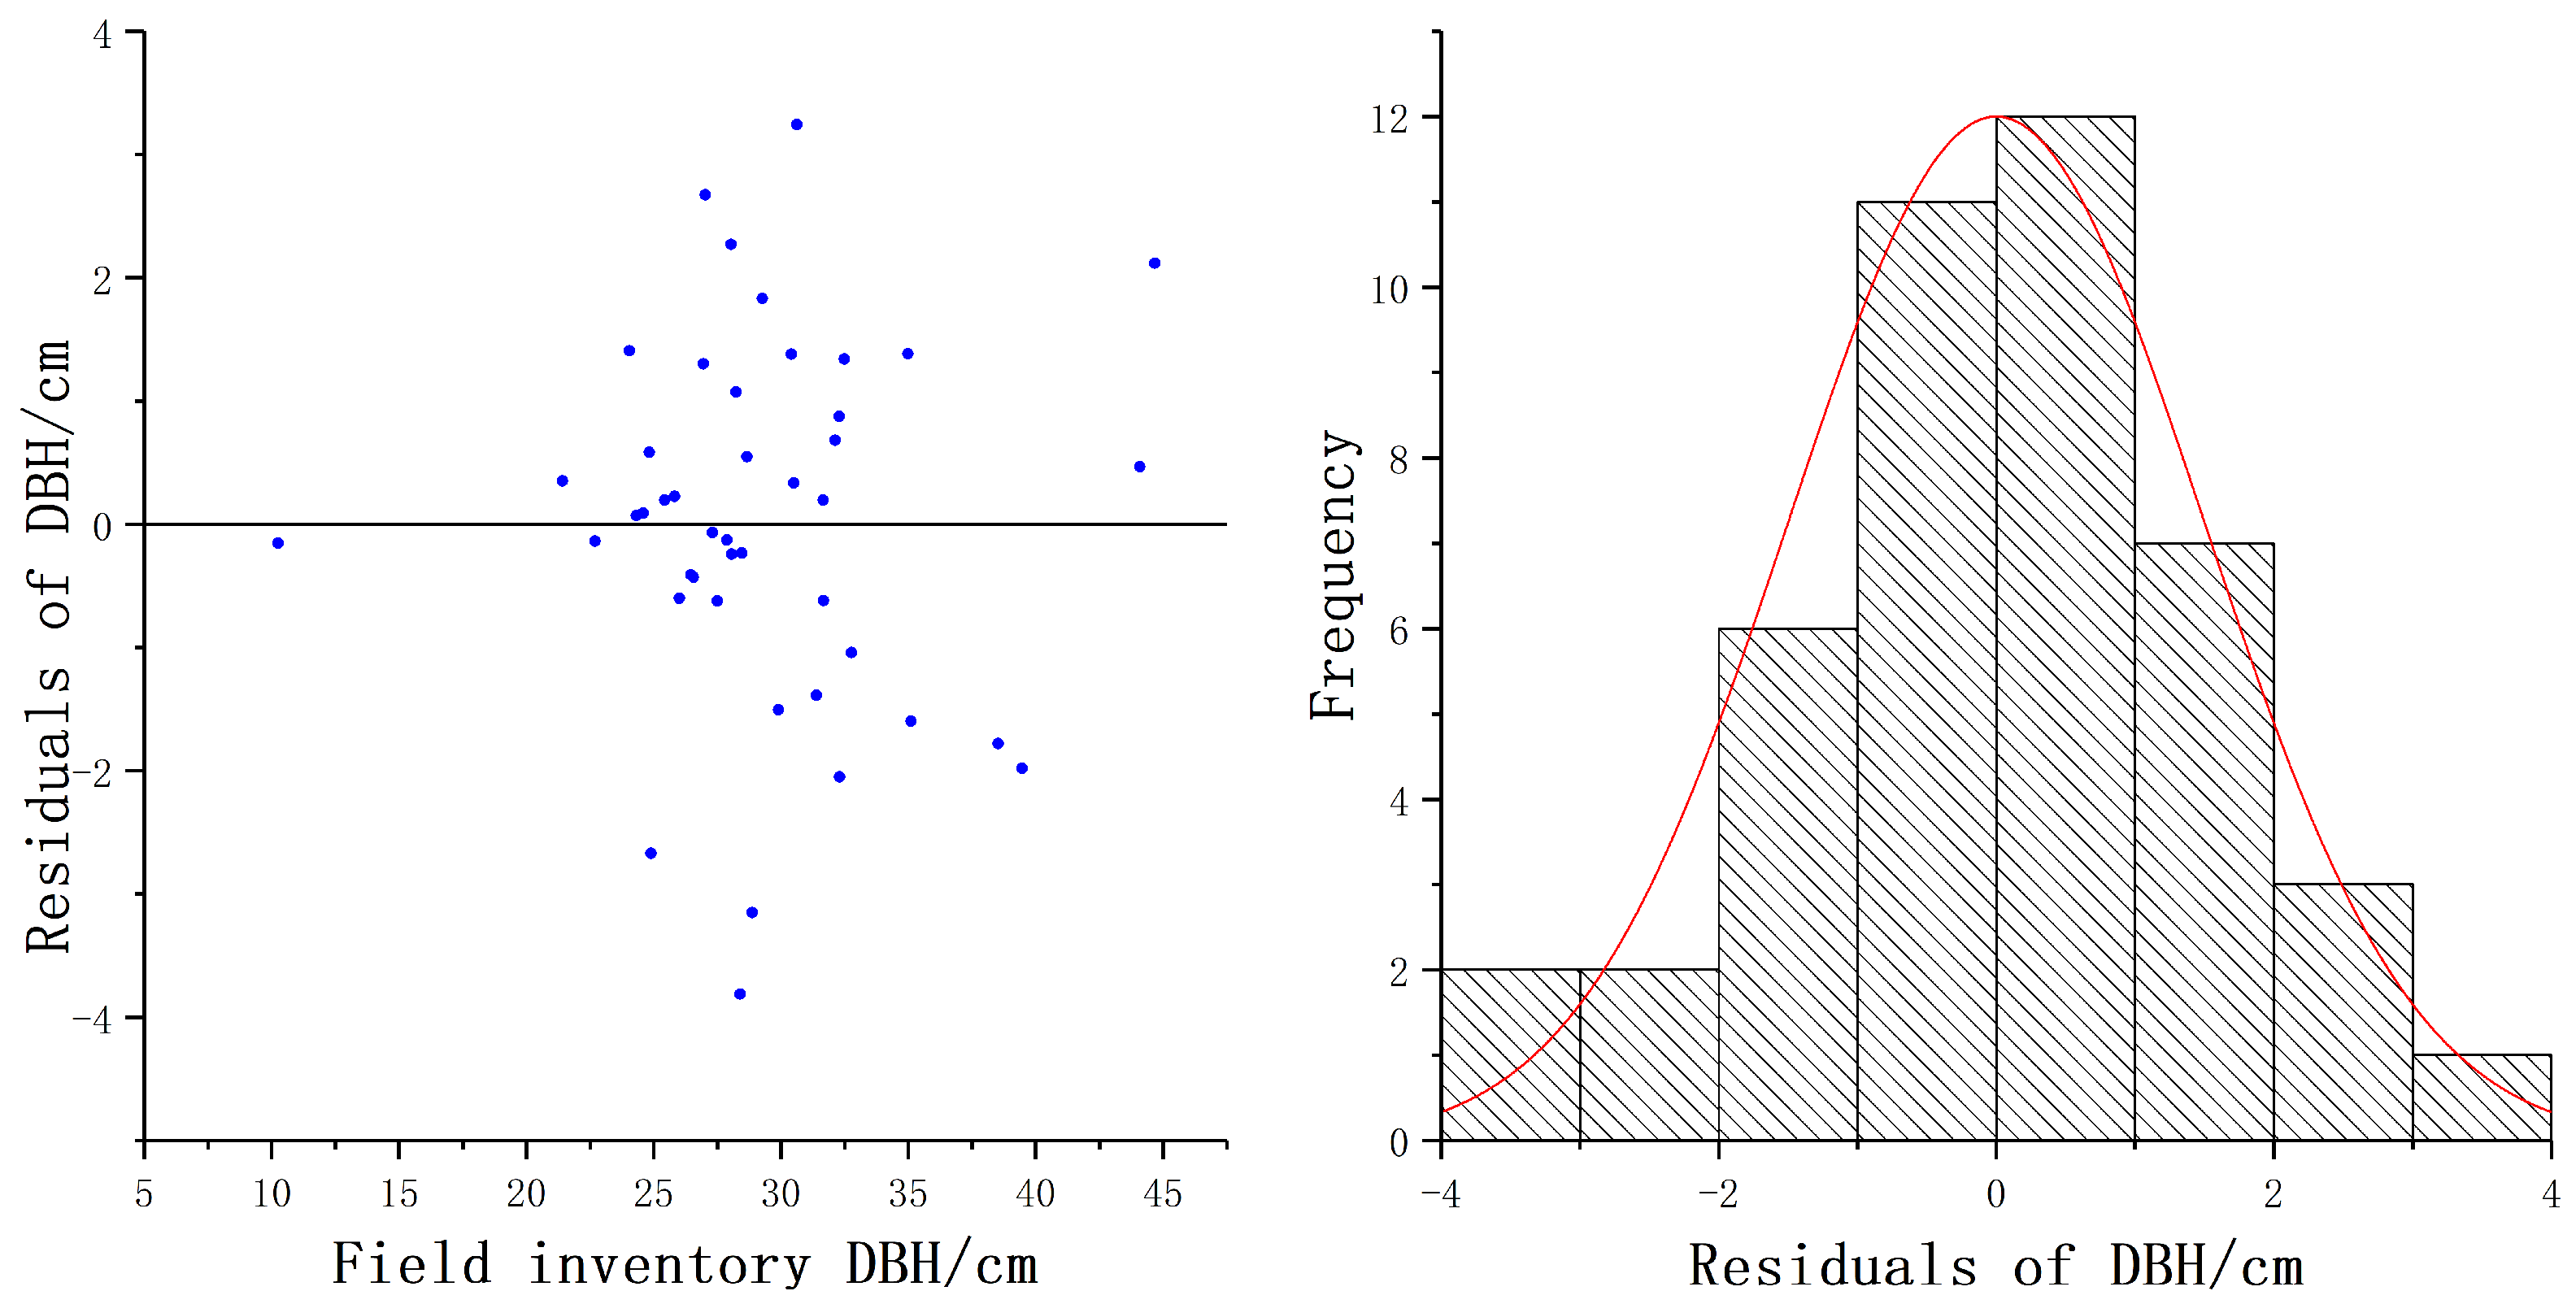
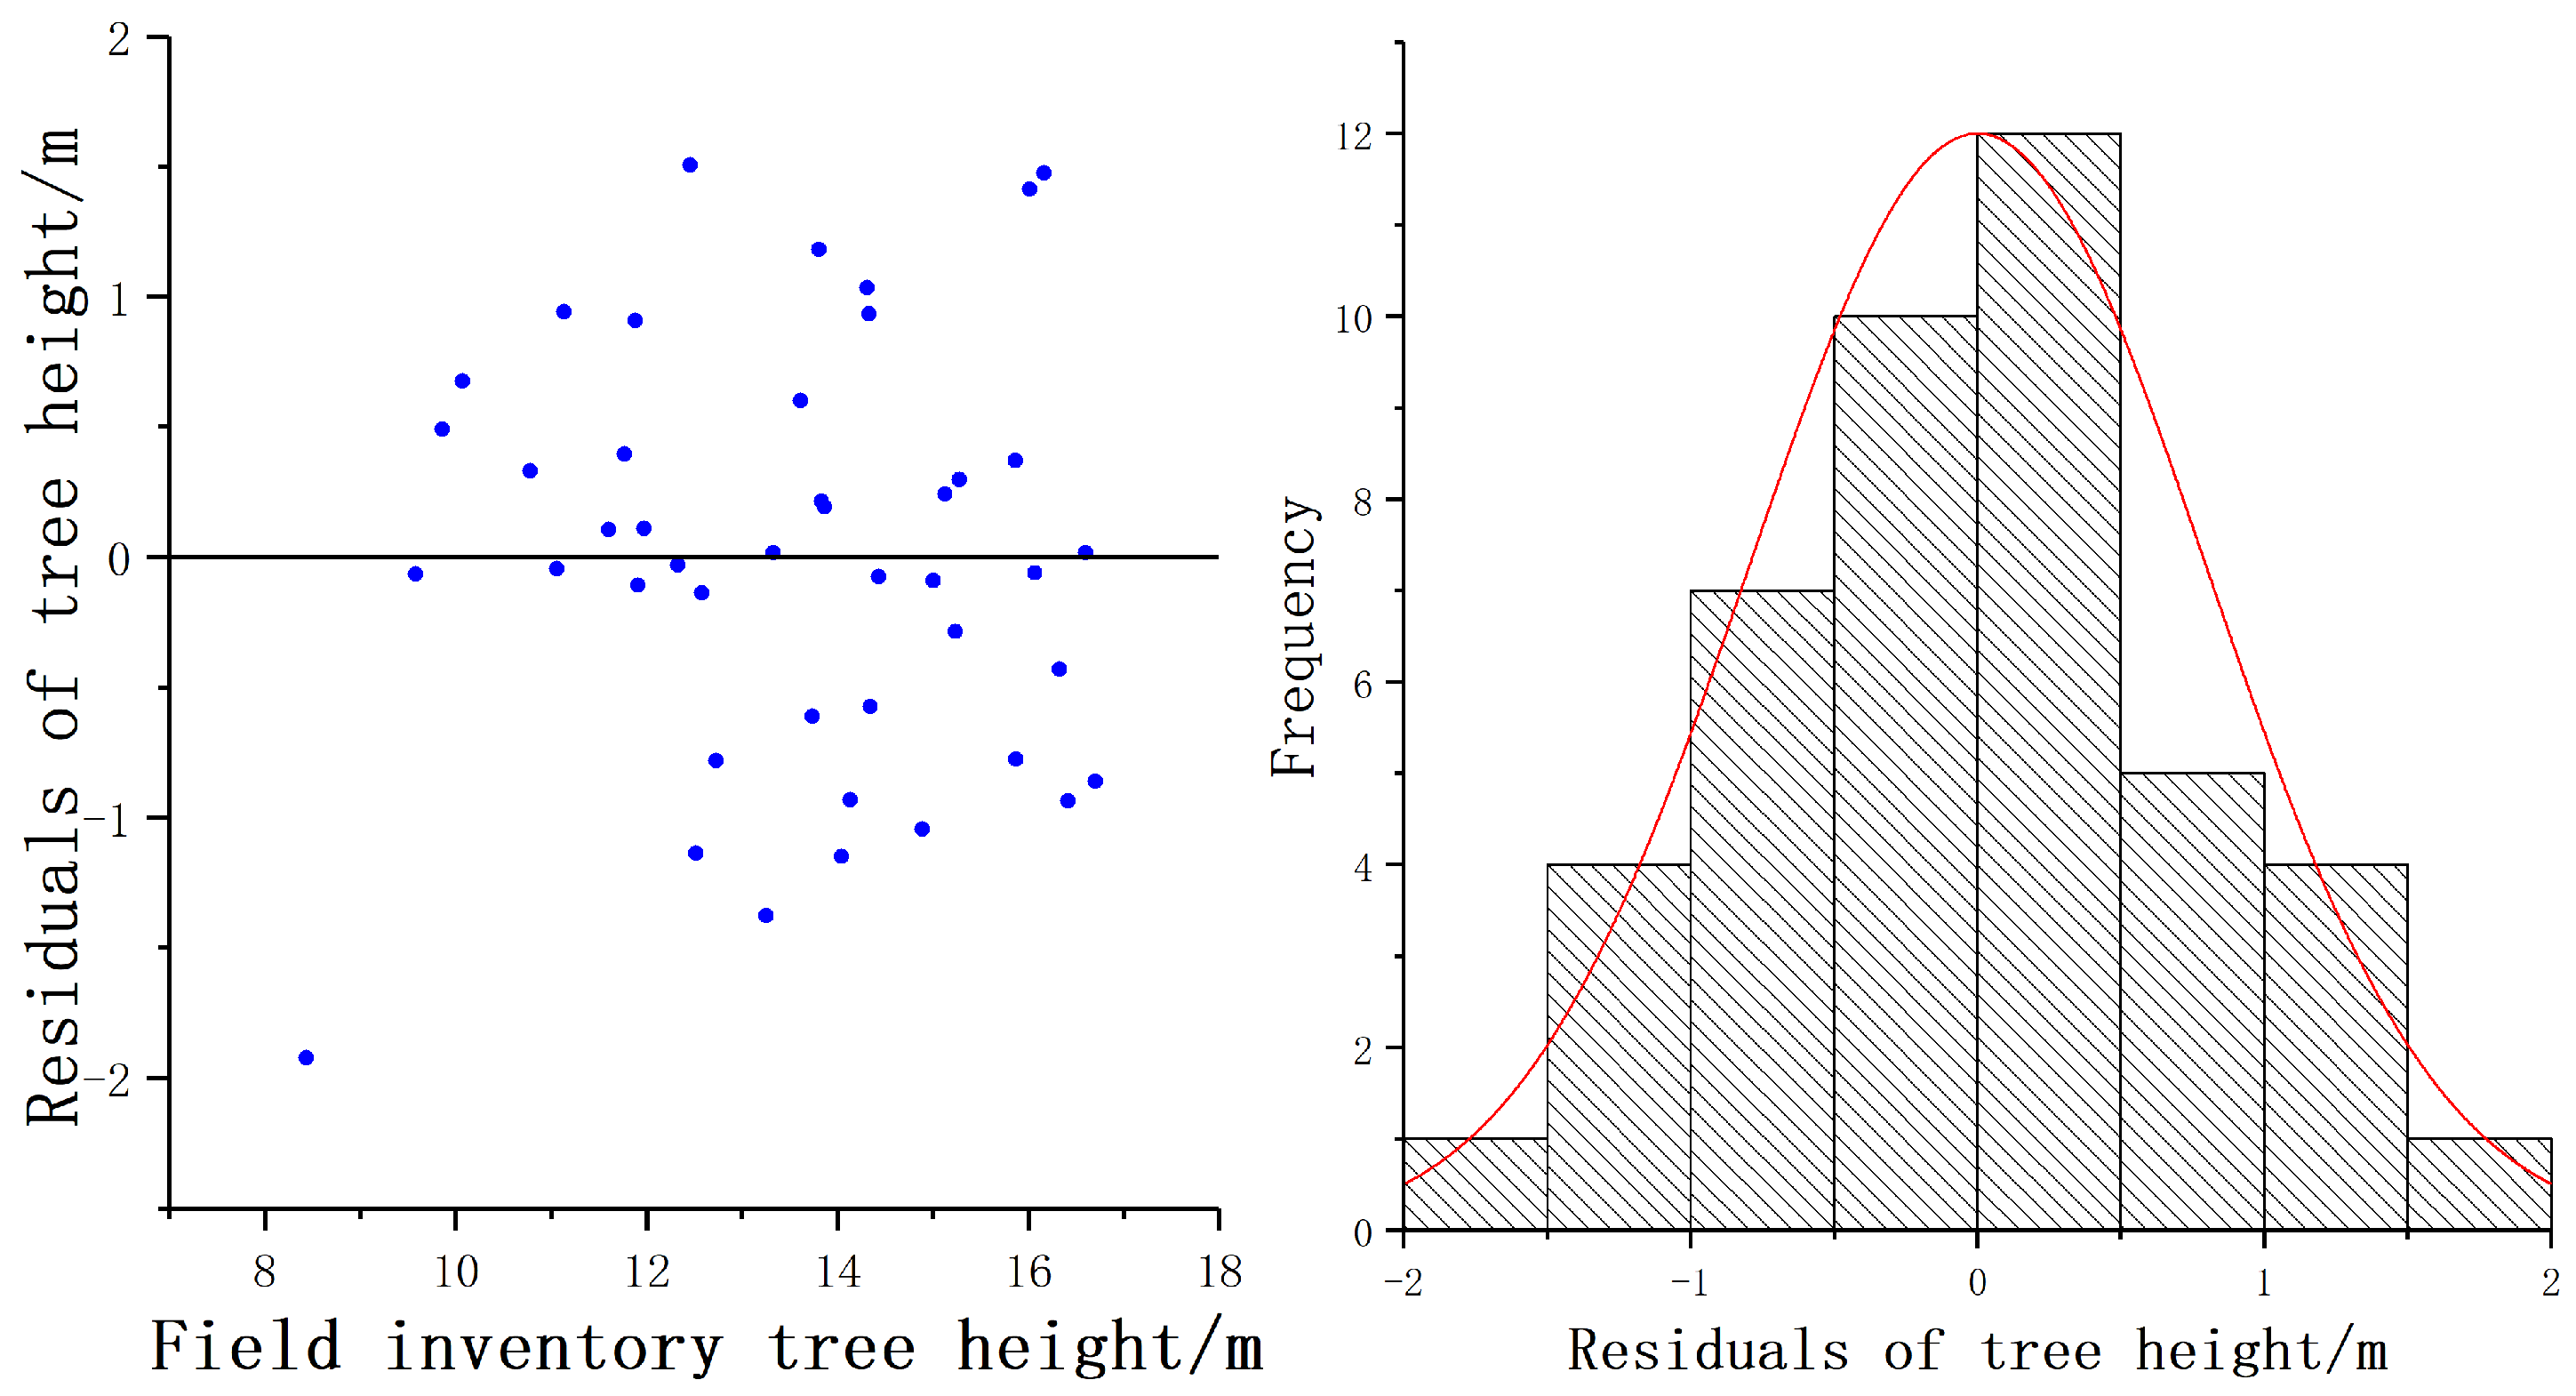
3.1. DBH and Tree Height
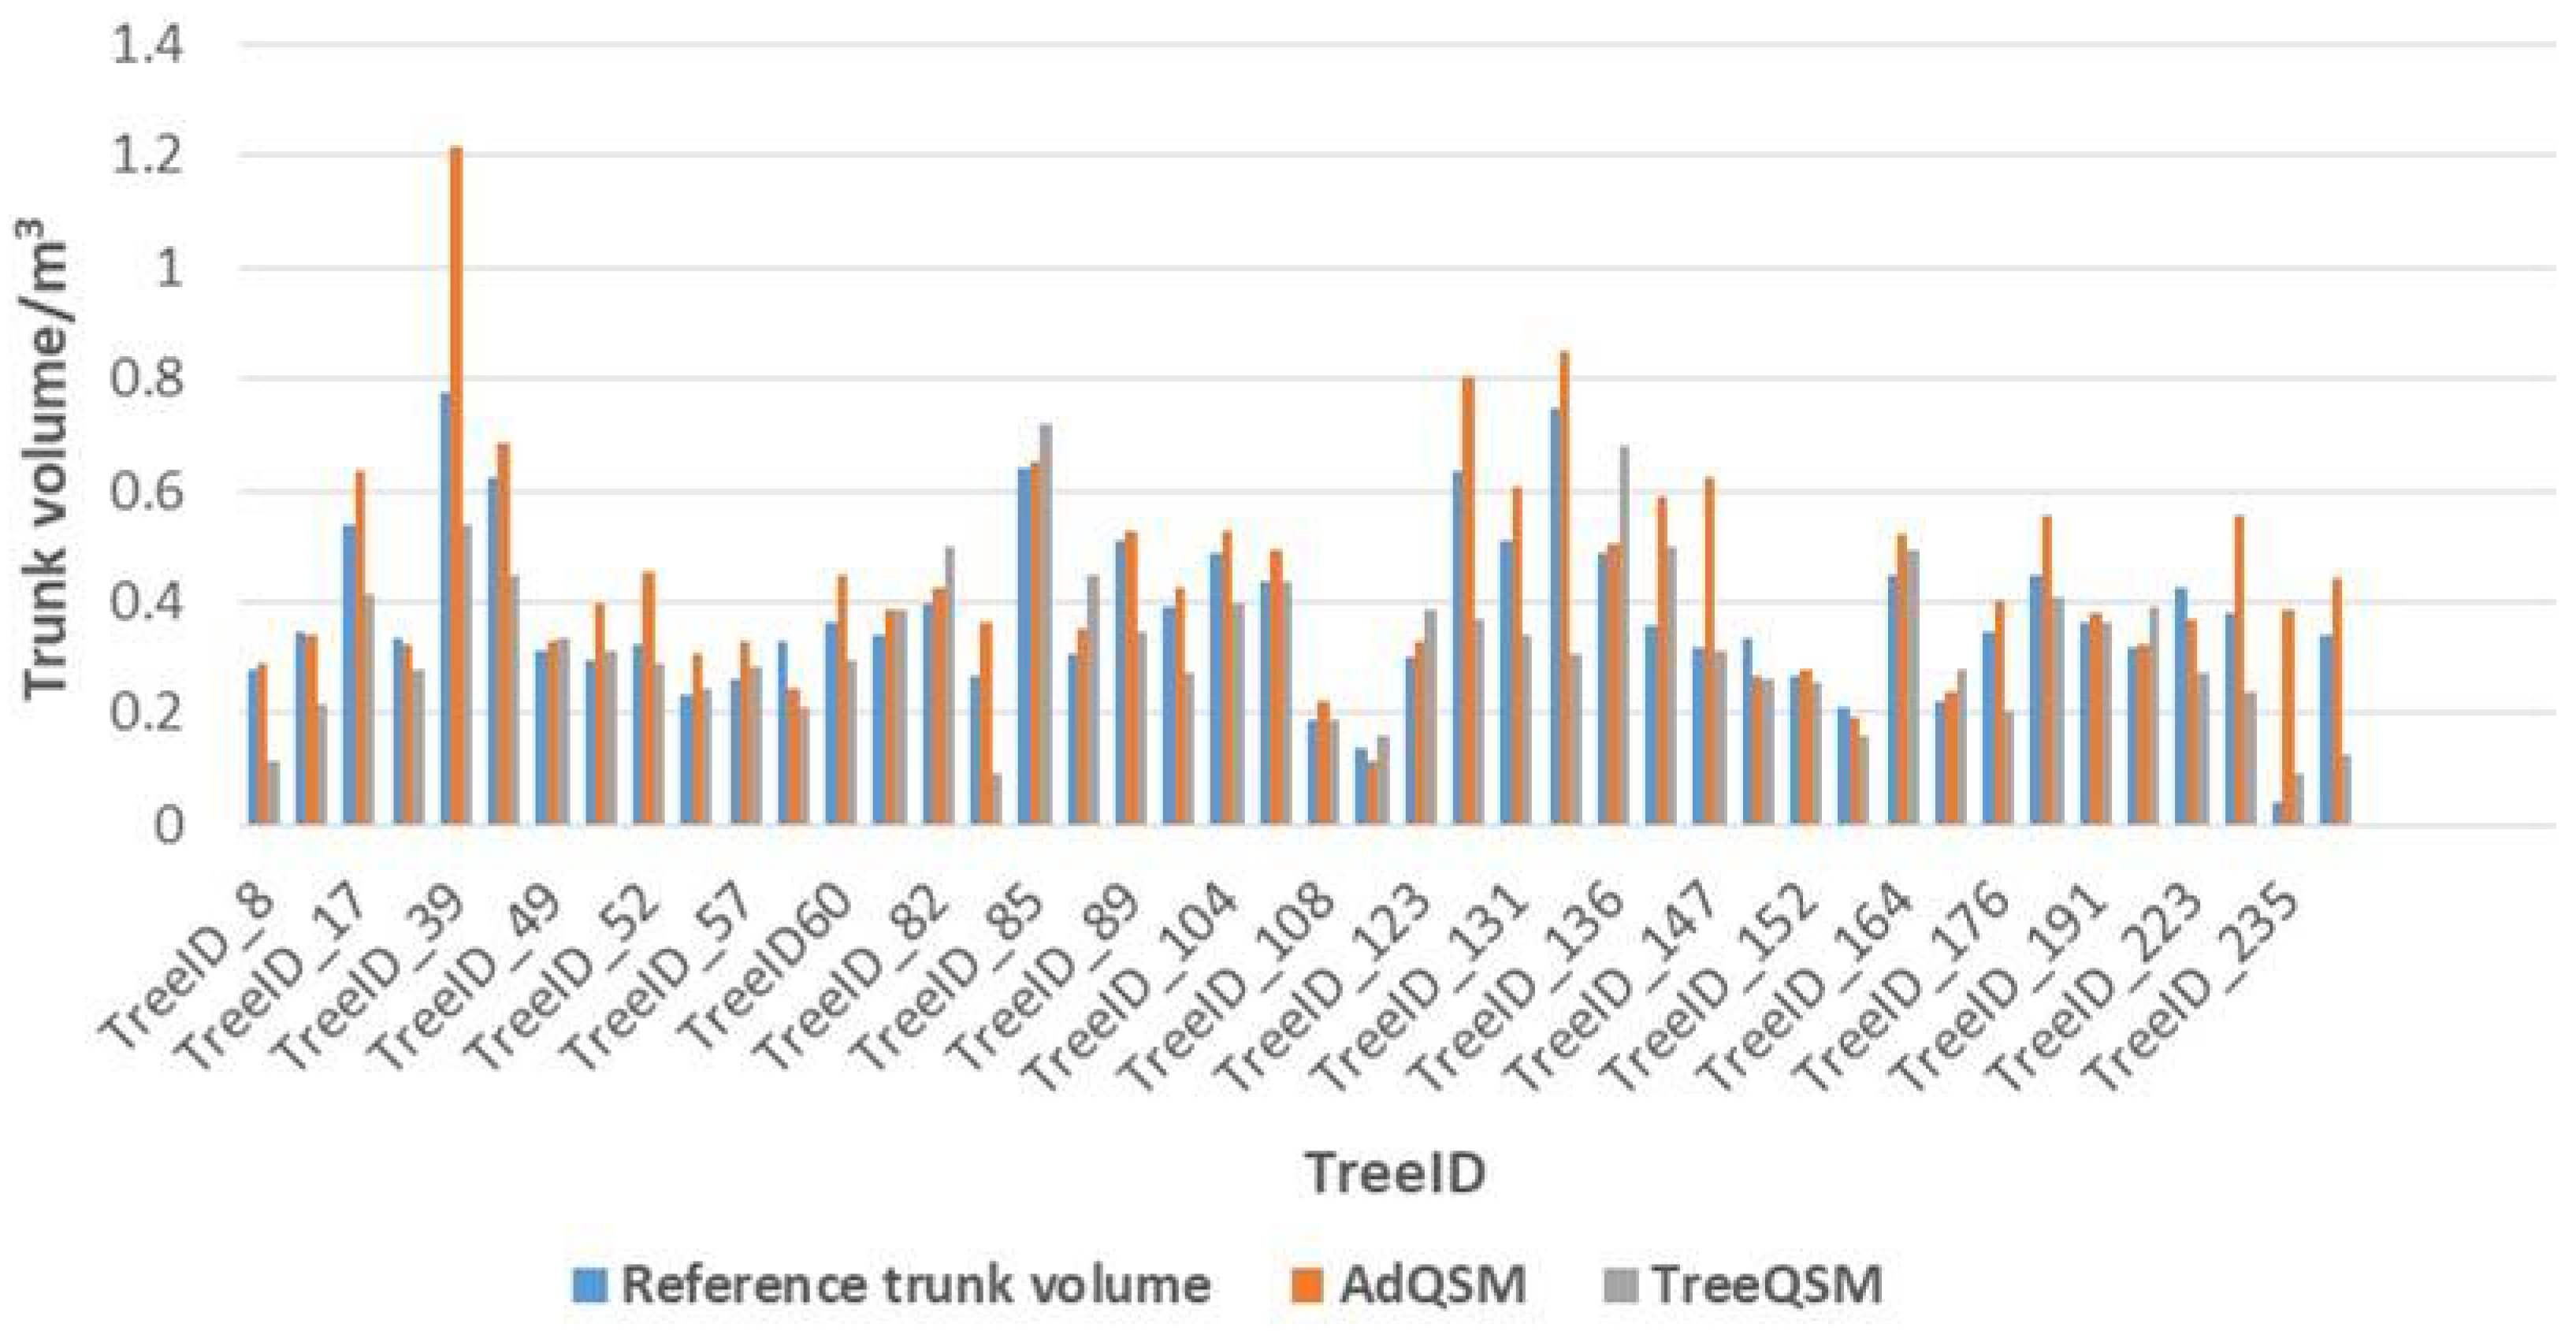
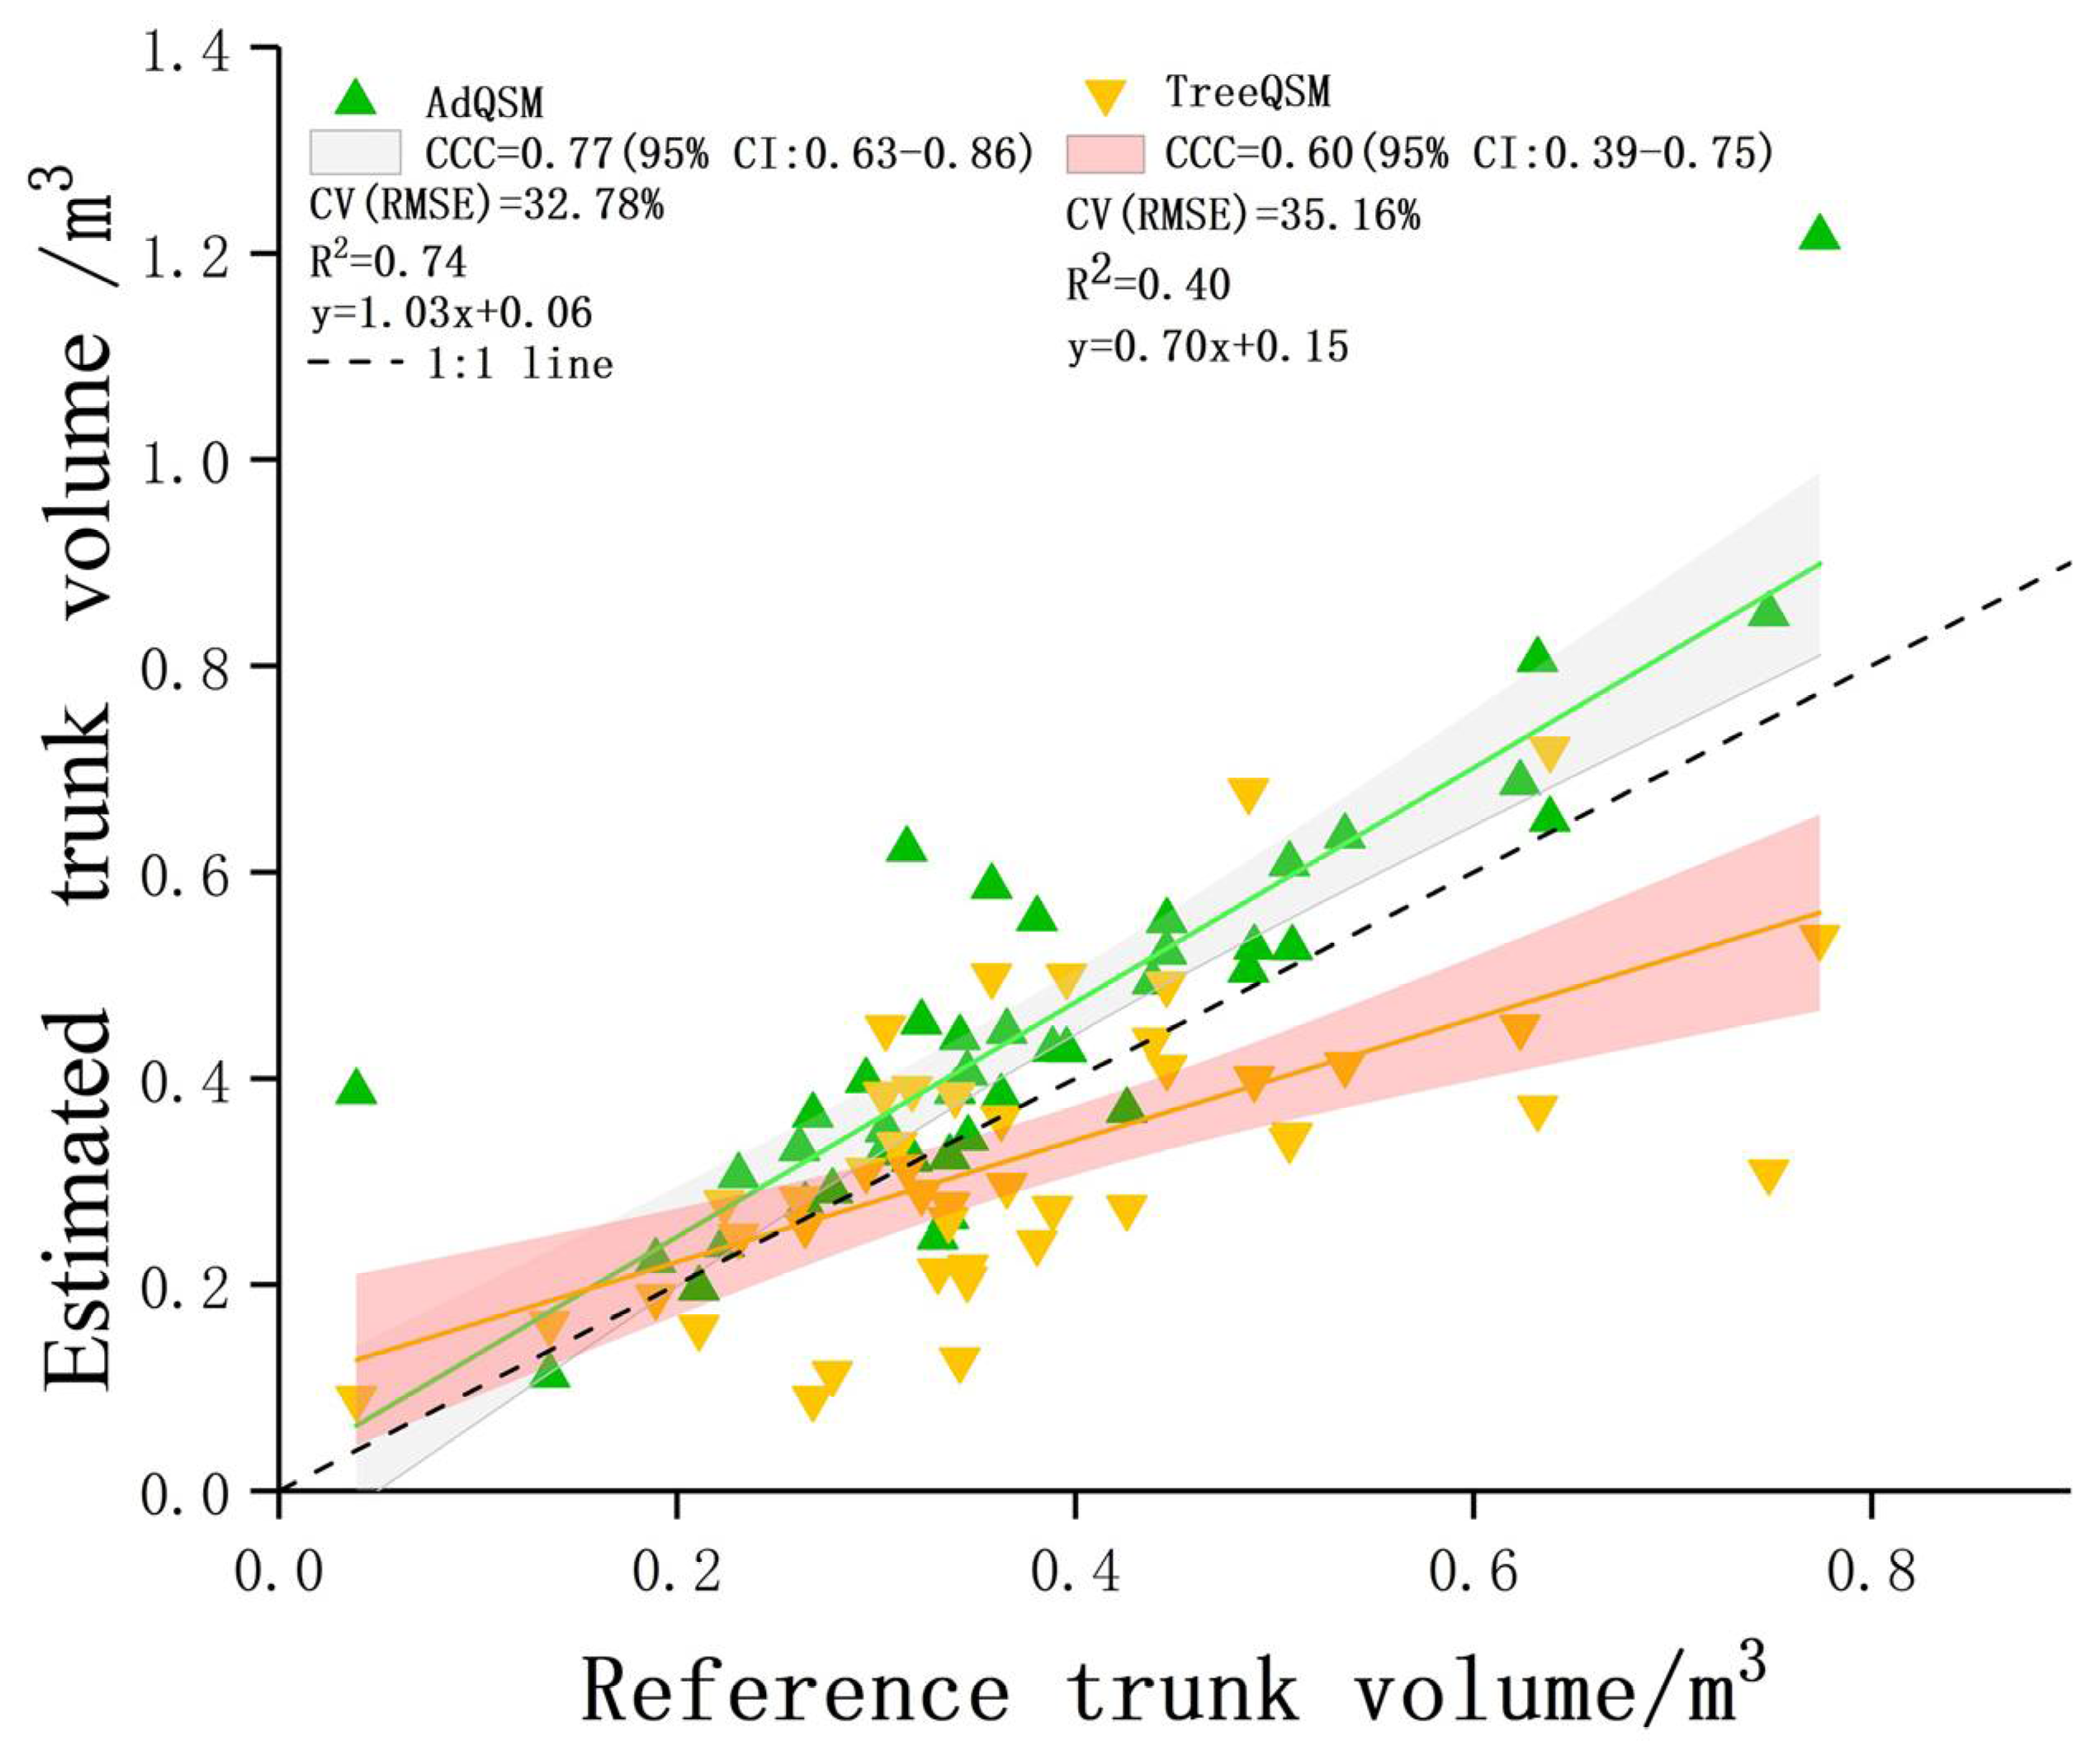
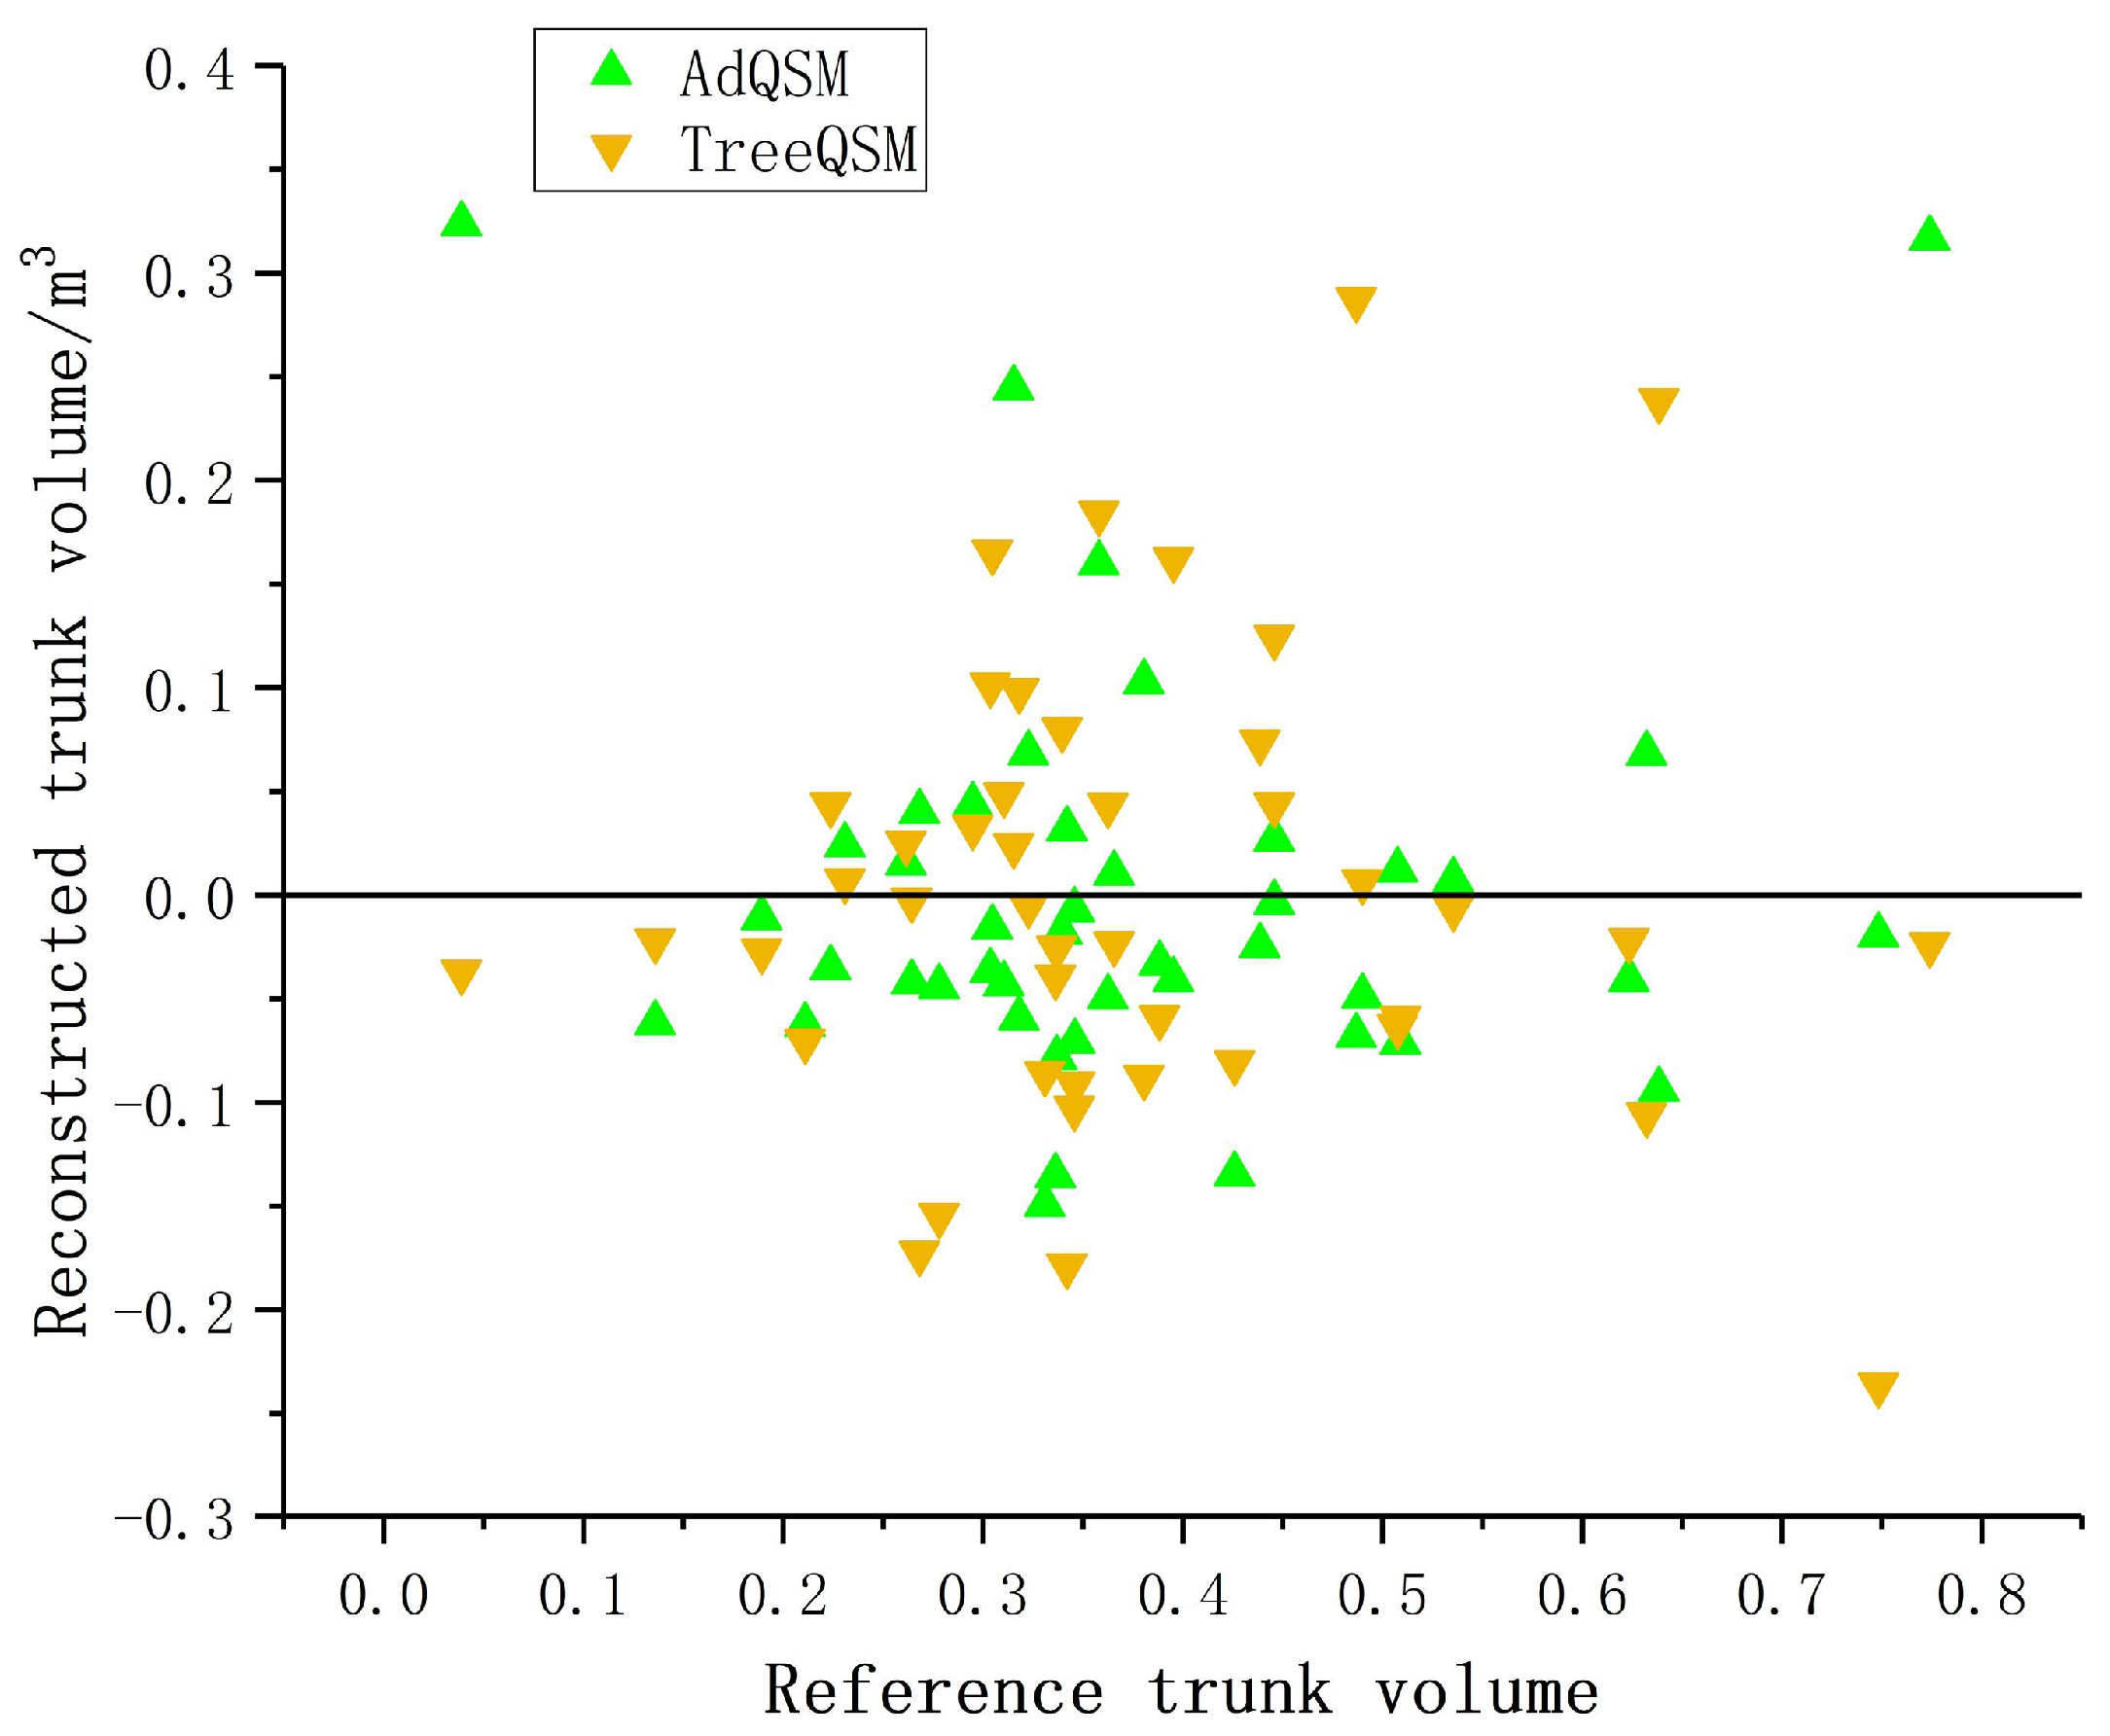
We used DBH and tree height of 44 trees from forest inventory as reference values of AdQSM. The estimated DBH ranged from 11.3 cm to 48.0 cm, and the estimated tree height ranged from 5.27 m to 16.05 m. Figure 11a shows that R2 of linear fitting between the DBH estimate from AdQSM and reference value was 0.94, with a slope of 1.04. Estimation of DBH by AdQSM does not change significantly with increase of DBH. The estimated value of DBH fits well with the reference value of forest inventory. Figure 11b shows that R2 of linear fitting between estimated tree height of AdQSM and reference value was 0.86, with a slope of 0.95. The tree height reconstructed by AdQSM underestimates the reference tree height. In general, AdQSM has no larger deviation in the estimation of DBH and tree height with different tree size.
Figure 12 shows residual distribution of DBH. The DBH residual of 84.1% trees ranged from 2.0 cm to 2.0 cm. The residual value distribution range showed no significant difference with increase of DBH and was evenly distributed on both sides of y = 0 line. Figure 13 shows that most residual values of tree height ranged from −1 m to 1 m. There was no significant difference in the distribution range of residuals with the increase of the reference tree height. The residuals are evenly distributed on both sides of the y = 0 line. AdQSM’s estimation of DBH and tree height performed similarly in all sample trees.
The accuracy of DBH and tree height were estimated based on AdQSM Table 1. The DBH was calculated by least square method, the Bias and RMSE were 1.25 cm and 1.93 cm respectively. The DBH deviation of 70.5% of all sample trees was less than 1.93 cm. The Bias and RMSE of tree height were −1.47 m and 1.67 m. The tree height deviation of 68.2% of all sample trees was less than 1.67 m.

3.2. Trunk Volume

To test the accuracy of QSM method in estimating trunk volume from TP point clouds, we compared reconstructed trunk volume values of AdQSM and TreeQSM with reference trunk volume of the allometric equation respectively, Figure 14. Reference volume values from trunk range from 0.03896 m3 to 0.77398 m3, and AdQSM estimated volume values range from 0.11195 m3 to 1.21568 m3. The estimated volume values of TreeQSM range from 0.08946 m3 to 0.71900 m3.
Figure 15 shows that the R2 of the linear fit between the estimated volume of AdQSM and the reference value was 0.74. The slope is 1.03, indicating that AdQSM slightly overestimates the trunk volume. The RMSE was 0.12369 m3, and the average trunk volume was 0.37732 m3, resulting in a rRMSE of 32.78%. The R2 of the linear fit between the estimated volume of TreeQSM and the reference value was 0.40. The slope is 0.70, indicating that TreeQSM underestimates the trunk volume. The RMSE was 0.13267 m3, and rRMSE was 35.16%. At 95% confidence interval level, the consistency between the estimated trunk volume of AdQSM and the reference value (CCC = 0.77) was higher than that of TreeQSM (CCC = 0.60).
Figure 16 shows the distribution of trunk volume residuals estimated by AdQSM and TreeQSM respectively. Most volume residuals of AdQSM were more evenly distributed on both sides of y = 0 line, and residuals of 84.1% trees were between −0.1 m3 and 0.1 m3. Most volume residuals of TreeQSM are more evenly distributed on both sides of y = 0 line, and residuals of 77.3% trees are between −0.1 m3 and 0.1 m3. Figure 17 shows the distribution of trunk volume frequency distribution of AdQSM and TreeQSM. There was no significant difference in residual distribution range with increase of reference trunk volume.
Table 2 provides accuracies of AdQSM and TreeQSM reconstructed trunk volumes. The Bias and rBias reconstructed by AdQSM were 0.07066 m3 and 18.73%, respectively. The trunk volume deviation of 84.1% of all sample trees was less than 0.12369 m3. The tree trunk volume Bias and rBias based on TreeQSM were −0.05071 m3 and −13.44% respectively. The trunk volume deviation of 65.9% of all sample trees was less than 0.13267 m3.

4. Discussion

4.1. Results Analysis

Shenglan Du and Guangpeng Fan et al. provided a new, accurate, and detailed QSM (AdQSM) [40,41]. At present, AdQSM has attracted more and more people’s attention [50,51,52,53]. AdQSM needs to be tested using photogrammetric point clouds. AdQSM was originally designed to reconstruct 3D topology and geometry of trees from LiDAR point clouds [1,38]. Both TP point clouds and LiDAR point clouds contain the spatial relationship of tree geometric structure. Compared with LiDAR point clouds, it may be more economical to choose TP point clouds to reconstruct tree structure. The performance of AdQSM has been further improved, laying the foundation for the opening software. This paper extends a relatively low-cost method for AdQSM to reconstruct tree structure and estimate forest attributes.
To analyze the potential of TP point clouds as input in QSM for assessment of trunk volume of individual trees, this paper attempts to model TP point clouds of trees using the AdQSM method. Based on cylinder fitting principle, we used AdQSM to reconstruct 3D models of 44 trees and extracted DBH, tree height, and trunk volume. DBH estimated from AdQSM were compared with DBH of forest inventory. The R2 and rRMSE fitted linearly were 0.94 and 6.60%, respectively. The fitting effect of DBH estimated by AdQSM and reference value is satisfactory. The estimated tree heights from AdQSM were compared with the forest inventory data. The R2 and rRMSE fitted linearly were 0.95 and 12.34%. The estimated tree height of AdQSM is slightly lower than reference value because of the weak ability of TP to obtain canopy or branch information.
The largest difference between QSM and allometric equation is that DBH or tree height are not required as input parameters. Using trunk volume derived from allometric equation based on destructive sampling as reference value, we evaluated the accuracy of AdQSM and TreeQSM to calculate trunk volume respectively. At the 95% confidence interval level, the CCC between AdQSM estimated trunk volume and reference value was 0.77, which was greater than that of TreeQSM (CCC = 0.60). The Bias of AdQSM and TreeQSM in estimating trunk volume was 0.07066 m3 and −0.05071 m3 respectively. rBias was 18.73% and −13.44%. RMSE was 0.12369 m3 and 0.13267 m3. rRMSE was 32.78% and 35.16%. In general, AdQSM and TreeQSM have similar reconstruction performance using TP point clouds. Our experiments showed that tree reconstruction based on QSM did not systematically overestimate or underestimate DBH, tree height, and trunk volume for different sizes of tree.

4.2. Limitations and Application Potential

Our method cannot estimate the total tree volume or branch volume. This is due to the limitations of TP. TP as a passive remote sensing, is easy to be influenced by light and surrounding environment [54,55]. TP has a weak ability to obtain information about branches or tree canopy [56]. As an active remote sensing technology, TLS can be sampled point by point. It has strong vegetation penetration ability and can penetrate through narrow gaps of vegetation [35,57]. Compared with previous QSM studies based on TLS, the accuracy of trees reconstructed from TP point clouds may not have obvious advantages [1,58,59]. The quality of input point cloud directly affects modeling effect, thus affecting the accuracy of QSM estimation of tree attributes. This conclusion is applicable not only to QSM modeling based on TLS point cloud, but also to the modeling based on TP point clouds in this paper. The cost of image-based point clouds acquisition is more economical, and the required equipment is easy to carry [60]. In some cases, shrub or grass interference and camera obstruction observation will limit applicability and accuracy of our method in dense forests. Our method cannot accurately estimate branch or twig volume, because TP does not provide enough detailed information about branches. Obviously, due to the lack of branch information in original input point clouds, QSM is impossible to reconstruct accurate branches. Such limitations and errors are unavoidable, so quality of original input point clouds can only be guaranteed as far as possible to improve QSM modeling accuracy. We have the following suggestions that might improve the quality of original input point clouds: (1) Increase the number of cameras to obtain as much tree information as possible; (2) take as many photos as possible in the same photography site to increase image points with the same name; (3) slow down walking speed (1 m/s was used in this study) to improve pixel quality of photos. The motion blur can be improved by appropriate exposure time [61]. The accuracy of estimating tree attributes with QSM needs to be verified by tree-cutting experiments, so as to ensure that QSM can be applied to anyone’s research. Cutting down trees, measuring trunks and all branches are the only way to get the most realistic tree attributes [5,16]. Due to the limitations of experimental conditions and local policies, this paper does not consider cutting down trees. Especially in the trunk volume experiment of Section 3.2, we only took trunk volume estimated by the allometric equation (Section 2.3.1) as the reference value. Even if accuracy of the allometric equation is 95.2%, this still creates uncertainty [8]. On the premise that quality of original input point cloud is guaranteed, we propose to use destructive tree measurement experiment to further evaluate the potential of TP point clouds as input to QSM. In the future, we will compare the construction of AdQSM by TLS data and TP point clouds acquired from the same study site.
However, we still proved the potential of inputting TP point clouds into QSM to evaluate trunk volume. This paper uses QSM algorithm to model the TP point clouds of trees and estimate tree attributes. At present, many studies have used QSM to reconstruct tree models from TLS point clouds and estimate tree volumes [58,62]. The TP point clouds are used for the first time as the input point clouds of QSM to evaluate the trunk volume. On the one hand, in field of forest 3D point clouds modeling, our research extends the universality of QSM algorithm. We successfully used tree reconstruction method originally used for TLS point clouds to model TP point clouds. We analyze the potential of TP point clouds as QSM input and further illustrate its applicability. On the other hand, our method can significantly reduce the cost of 3D tree reconstruction. The acquisition cost of image-based point clouds is more economical than LiDAR point clouds [63,64]. The cost of professional training and equipment purchase is reduced. Our method only requires two or even one digital camera, which costs only a few hundred dollars. The required equipment is easy to carry, the on-site measurement is simple, and the later data processing is automated. Therefore, our method is more suitable for 3D reconstruction of trunk with low cost. It is worth trying to sacrifice little accuracy to reduce the cost of 3D modeling of trees. This paper reduces current representativeness lack of reconstructing tree 3D models from TP point clouds. QSM method does not presuppose the tree structure and rely on the finite tree structure parameters to reconstruct the 3D tree model [62]. This is important because QSM can not only monitor natural gradual changes in biomass, but also can monitor sudden changes caused by storm damage, harvesting, fire or disease, which is essential for formulating effective forest management strategies [65]. Our research focuses particularly on the rapid and accurate determination of high-value trees’ trunk attributes [66,67].

5. Conclusions

To open AdQSM, this paper develops an automatic modeling method for AdQSM. In this paper, a low-cost 3D reconstruction technique based on AdQSM for forest terrestrial close-range photogrammetry is also proposed. The potential of inputting TP point clouds into AdQSM to evaluate tree trunk volume was also analyzed. We evaluated the performance of terrestrial close-range photogrammetry point clouds in QSM, and the results show that our method is more suitable for some low-cost tree structure reconstruction. This paper provides a more economical and rapid method of tree structure reconstruction for forest ground-surveying techniques, with particular emphasis on rapid and accurate determination of the trunk properties of high-value trees. Therefore, this research has many meanings.

Author Contributions

Conceptualization, G.F. and Y.D.; methodology, G.F. and J.L.; software, Y.D.; validation, Y.D., G.F., Y.W., and J.L.; formal analysis, Y.D.; investigation, G.F.; resources, Z.Z. and J.L.; data curation, Z.Z., Y.W., and J.L.; writing—original draft preparation, G.F. and Y.D.; writing—review and editing, Y.D., G.F., and Z.Z.; visualization, G.F. and Y.D.; supervision, G.F. and F.C.; project administration, F.C.; funding acquisition, F.C and G.F. All authors have read and agreed to the published version of the manuscript.

Funding

This research was jointly supported by the National Natural Science Foundation of China (No. 32001249).

Data Availability Statement

AdQSM model can be found here: https://github.com/GuangpengFan/AdQSM (accessed on 26 July 2021).

Acknowledgments

We thank the AdQSM developers and those who worked on the manuscript.

Conflicts of Interest

The authors declare no conflict of interest.

References

  1. Calders, K.; Newnham, G.; Burt, A.; Murphy, S.; Raumonen, P.; Herold, M.; Culvenor, D.; Avitabile, V.; Disney, M.; Armston, J. Nondestructive estimates of above-ground biomass using terrestrial laser scanning. Methods Ecol. Evol. 2015, 6, 198–208. [Google Scholar] [CrossRef]
  2. Zhang, F.; Johnson, D.M.; Wang, J.; Yu, C. Cost, energy use and GHG emissions for forest biomass harvesting operations. Energy 2016, 114, 1053–1062. [Google Scholar] [CrossRef]
  3. Attiwill, P.M.; Ovington, J.D. Determination of Forest Biomass. For. Sci. 1968, 14, 13–15. [Google Scholar]
  4. Chave, J.; Réjou-Méchain, M.; Búrquez, A.; Chidumayo, E.; Colgan, M.S.; Delitti, W.B.C.; Duque, A.; Eid, T.; Fearnside, P.M.; Goodman, R.C.; et al. Improved allometric models to estimate the aboveground biomass of tropical trees. Glob. Chang. Biol. 2014, 20, 3177–3190. [Google Scholar] [CrossRef]
  5. Disney, M.I.; Boni Vicari, M.; Burt, A.; Calders, K.; Lewis, S.L.; Raumonen, P.; Wilkes, P. Weighing trees with lasers: Advances, challenges and opportunities. Interface Focus 2018, 8, 20170048. [Google Scholar] [CrossRef] [Green Version]
  6. Hackenberg, J.; Wassenberg, M.; Spiecker, H.; Sun, D. Non Destructive Method for Biomass Prediction Combining TLS Derived Tree Volume and Wood Density. Forests 2015, 6, 1274–1300. [Google Scholar] [CrossRef]
  7. Lovell, J.L.; Jupp, D.L.B.; Culvenor, D.S.; Coops, N.C. Using airborne and ground-based ranging lidar to measure canopy structure in Australian forests. Can. J. Remote Sens. 2003, 29, 607–622. [Google Scholar] [CrossRef]
  8. Takoudjou, S.M.; Ploton, P.; Sonké, B.; Hackenberg, J.; Griffon, S.; de Coligny, F.; Kamdem, N.G.; Libalah, M.; Mofack, G.I.; Moguédec, G.L.; et al. Using terrestrial laser scanning data to estimate large tropical trees biomass and calibrate allometric models: A comparison with traditional destructive approach. Methods Ecol. Evol. 2018, 9, 905–916. [Google Scholar] [CrossRef]
  9. Briechle, S.; Krzystek, P.; Vosselman, G. Classification of Tree Species and Standing Dead Trees by Fusing Uav-Based LIDAR Data and Multispectral Imagery in the 3d Deep Neural Network POINTNET++. ISPRS Ann. Photogramm. Remote Sens. Spat. Inf. Sci. 2020, 2, 203–210. [Google Scholar] [CrossRef]
  10. Piermattei, L.; Karel, W.; Wang, D.; Wieser, M.; Mokroš, M.; Surový, P.; Koreň, M.; Tomaštík, J.; Pfeifer, N.; Hollaus, M. Terrestrial Structure from Motion Photogrammetry for Deriving Forest Inventory Data. Remote Sens. 2019, 11, 950. [Google Scholar] [CrossRef] [Green Version]
  11. Liang, X.; Jaakkola, A.; Wang, Y.; Hyyppä, J.; Honkavaara, E.; Liu, J.; Kaartinen, H. The Use of a Hand-Held Camera for Individual Tree 3D Mapping in Forest Sample Plots. Remote Sens. 2014, 6, 6587–6603. [Google Scholar] [CrossRef] [Green Version]
  12. Yogender; Raghavendra, S.; Kushwaha, S.K.P. Role of Ground Control Points (GCPs) in Integration of Terrestrial Laser Scanner (TLS) and Close-range Photogrammetry (CRP). In Applications of Geomatics in Civil Engineering; Ghosh, J.K., da Silva, I., Eds.; Springer: Singapore, 2020; pp. 531–537. [Google Scholar]
  13. Asvadi, A.; Garrote, L.; Premebida, C.; Peixoto, P.; Nunes, U.J. Multimodal vehicle detection: Fusing 3D-LIDAR and color camera data. Pattern Recognit. Lett. 2018, 115, 20–29. [Google Scholar] [CrossRef]
  14. Chen, W.; Xiang, H.; Moriya, K. Individual Tree Position Extraction and Structural Parameter Retrieval Based on Airborne LiDAR Data: Performance Evaluation and Comparison of Four Algorithms. Remote Sens. 2020, 12, 571. [Google Scholar] [CrossRef] [Green Version]
  15. Guerra-Hernández, J.; Cosenza, D.N.; Rodriguez, L.C.E.; Silva, M.; Tomé, M.; Díaz-Varela, R.A.; González-Ferreiro, E. Comparison of ALS- and UAV(SfM)-derived high-density point clouds for individual tree detection in Eucalyptus plantations. Int. J. Remote Sens. 2018, 39, 5211–5235. [Google Scholar] [CrossRef]
  16. Yao, W.; Krzystek, P.; Heurich, M. Tree species classification and estimation of stem volume and DBH based on single tree extraction by exploiting airborne full-waveform LiDAR data. Remote Sens. Environ. 2012, 123, 368–380. [Google Scholar] [CrossRef]
  17. Newnham, G.J.; Armston, J.D.; Calders, K.; Disney, M.I.; Lovell, J.L.; Schaaf, C.B.; Strahler, A.H.; Danson, F.M. Terrestrial Laser Scanning for Plot-Scale Forest Measurement. Curr. For. Rep. 2015, 1, 239–251. [Google Scholar] [CrossRef] [Green Version]
  18. Liang, X.; Kankare, V.; Hyyppä, J.; Wang, Y.; Kukko, A.; Haggrén, H.; Yu, X.; Kaartinen, H.; Jaakkola, A.; Guan, F.; et al. Terrestrial laser scanning in forest inventories. ISPRS J. Photogramm. Remote Sens. 2016, 115, 63–77. [Google Scholar] [CrossRef]
  19. Ghimire, S.; Xystrakis, F.; Koutsias, N. Using Terrestrial Laser Scanning to Measure Forest Inventory Parameters in a Mediterranean Coniferous Stand of Western Greece. PFG 2017, 85, 213–225. [Google Scholar] [CrossRef]
  20. Wallace, L.; Hillman, S.; Reinke, K.; Hally, B. Non-destructive estimation of above-ground surface and near-surface biomass using 3D terrestrial remote sensing techniques. Methods Ecol. Evol. 2017, 8, 1607–1616. [Google Scholar] [CrossRef] [Green Version]
  21. Lin, Y.; Jiang, M.; Yao, Y.; Zhang, L.; Lin, J. Use of UAV oblique imaging for the detection of individual trees in residential environments. Urban. For. Urban. Green. 2015, 14, 404–412. [Google Scholar] [CrossRef]
  22. Rosnell, T.; Honkavaara, E. Point Cloud Generation from Aerial Image Data Acquired by a Quadrocopter Type Micro Unmanned Aerial Vehicle and a Digital Still Camera. Sensors 2012, 12, 453–480. [Google Scholar] [CrossRef] [Green Version]
  23. Forsman, M.; Börlin, N.; Holmgren, J. Estimation of Tree Stem Attributes Using Terrestrial Photogrammetry with a Camera Rig. Forests 2016, 7, 61. [Google Scholar] [CrossRef]
  24. Bożek, P.; Janus, J.; Mitka, B. Analysis of Changes in Forest Structure using Point Clouds from Historical Aerial Photographs. Remote Sens. 2019, 11, 2259. [Google Scholar] [CrossRef] [Green Version]
  25. Surový, P.; Yoshimoto, A.; Panagiotidis, D. Accuracy of Reconstruction of the Tree Stem Surface Using Terrestrial Close-Range Photogrammetry. Remote Sens. 2016, 8, 123. [Google Scholar] [CrossRef] [Green Version]
  26. Marzulli, M.I.; Raumonen, P.; Greco, R.; Persia, M.; Tartarino, P. Estimating tree stem diameters and volume from smartphone photogrammetric point clouds. Forestry (London) 2020, 93, 411–429. [Google Scholar] [CrossRef]
  27. Liang, X.; Wang, Y.; Jaakkola, A.; Kukko, A.; Kaartinen, H.; Hyyppä, J.; Honkavaara, E.; Liu, J. Forest Data Collection Using Terrestrial Image-Based Point Clouds From a Handheld Camera Compared to Terrestrial and Personal Laser Scanning. IEEE Trans. Geosci. Remote Sens. 2015, 53, 5117–5132. [Google Scholar] [CrossRef]
  28. Ye, N.; van Leeuwen, L.; Nyktas, P. Analysing the potential of UAV point cloud as input in quantitative structure modelling for assessment of woody biomass of single trees. Int. J. Appl. Earth Obs. Geoinf. 2019, 81, 47–57. [Google Scholar] [CrossRef]
  29. Mikita, T.; Janata, P.; Surový, P. Forest Stand Inventory Based on Combined Aerial and Terrestrial Close-Range Photogrammetry. Forests 2016, 7, 165. [Google Scholar] [CrossRef] [Green Version]
  30. Mokroš, M.; Výbošťok, J.; Grznárová, A.; Bošela, M.; Šebeň, V.; Merganič, J. Non-destructive monitoring of annual trunk increments by terrestrial structure from motion photogrammetry. PLoS ONE 2020, 15, e0230082. [Google Scholar] [CrossRef] [PubMed]
  31. Schumann, G.J.-P.; Muhlhausen, J.; Andreadis, K.M. Rapid Mapping of Small-Scale River-Floodplain Environments Using UAV SfM Supports Classical Theory. Remote Sens. 2019, 11, 982. [Google Scholar] [CrossRef] [Green Version]
  32. Domingo, D.; Ørka, H.O.; Næsset, E.; Kachamba, D.; Gobakken, T. Effects of UAV Image Resolution, Camera Type, and Image Overlap on Accuracy of Biomass Predictions in a Tropical Woodland. Remote Sens. 2019, 11, 948. [Google Scholar] [CrossRef] [Green Version]
  33. Bauwens, S.; Fayolle, A.; Gourlet-Fleury, S.; Ndjele, L.M.; Mengal, C.; Lejeune, P. Terrestrial photogrammetry: A non-destructive method for modelling irregularly shaped tropical tree trunks. Methods Ecol. Evol. 2017, 8, 460–471. [Google Scholar] [CrossRef]
  34. Mulverhill, C.; Coops, N.C.; Tompalski, P.; Bater, C.W.; Dick, A.R. The utility of terrestrial photogrammetry for assessment of tree volume and taper in boreal mixedwood forests. Ann. For. Sci. 2019, 76, 1–12. [Google Scholar] [CrossRef] [Green Version]
  35. Dassot, M.; Colin, A.; Santenoise, P.; Fournier, M.; Constant, T. Terrestrial laser scanning for measuring the solid wood volume, including branches, of adult standing trees in the forest environment. Comput. Electron. Agric. 2012, 89, 86–93. [Google Scholar] [CrossRef]
  36. Raumonen, P.; Kaasalainen, M.; Åkerblom, M.; Kaasalainen, S.; Kaartinen, H.; Vastaranta, M.; Holopainen, M.; Disney, M.; Lewis, P. Fast Automatic Precision Tree Models from Terrestrial Laser Scanner Data. Remote Sens. 2013, 5, 491–520. [Google Scholar] [CrossRef] [Green Version]
  37. Markku, Å.; Raumonen, P.; Kaasalainen, M.; Casella, E. Analysis of Geometric Primitives in Quantitative Structure Models of Tree Stems. Remote Sens. 2015, 7, 4581–4603. [Google Scholar] [CrossRef] [Green Version]
  38. Hackenberg, J.; Spiecker, H.; Calders, K.; Disney, M.; Raumonen, P. SimpleTree —An Efficient Open Source Tool to Build Tree Models from TLS Clouds. Forests 2015, 6, 4245–4294. [Google Scholar] [CrossRef]
  39. Delagrange, S.; Jauvin, C.; Rochon, P. PypeTree: A Tool for Reconstructing Tree Perennial Tissues from Point Clouds. Sensors 2014, 14, 4271–4289. [Google Scholar] [CrossRef] [PubMed] [Green Version]
  40. Du, S.; Lindenbergh, R.; Ledoux, H.; Stoter, J.; Nan, L. AdTree: Accurate, Detailed, and Automatic Modelling of Laser-Scanned Trees. Remote Sens. 2019, 11, 2074. [Google Scholar] [CrossRef] [Green Version]
  41. Fan, G.; Nan, L.; Dong, Y.; Su, X.; Chen, F. AdQSM: A New Method for Estimating Above-Ground Biomass from TLS Point Clouds. Remote Sens. 2020, 12, 3089. [Google Scholar] [CrossRef]
  42. Fan, G.; Nan, L.; Chen, F.; Dong, Y.; Wang, Z.; Li, H.; Chen, D. A New Quantitative Approach to Tree Attributes Estimation Based on LiDAR Point Clouds. Remote Sens. 2020, 12, 1779. [Google Scholar] [CrossRef]
  43. Tanago, J.G.d.; Lau, A.; Bartholomeus, H.; Herold, M.; Avitabile, V.; Raumonen, P.; Martius, C.; Goodman, R.C.; Disney, M.; Manuri, S.; et al. Estimation of above-ground biomass of large tropical trees with terrestrial LiDAR. Methods Ecol. Evol. 2018, 9, 223–234. [Google Scholar] [CrossRef] [Green Version]
  44. Akpo, H.A.; Atindogbé, G.; Obiakara, M.C.; Gbedolo, M.A.; Laly, F.G.; Lejeune, P.; Fonton, N.H. Accuracy of tree stem circumference estimation using close range photogrammetry: Does point-based stem disk thickness matter? Trees For. People 2020, 2, 100019. [Google Scholar] [CrossRef]
  45. Wang, D.; Takoudjou, S.M.; Casella, E. LeWoS: A universal leaf-wood classification method to facilitate the 3D modelling of large tropical trees using terrestrial LiDAR. Methods Ecol. Evol. 2020, 11, 376–389. [Google Scholar] [CrossRef]
  46. Stal, C.; Tack, F.; De Maeyer, P.; De Wulf, A.; Goossens, R. Airborne photogrammetry and lidar for DSM extraction and 3D change detection over an urban area—a comparative study. Int. J. Remote Sens. 2013, 34, 1087–1110. [Google Scholar] [CrossRef] [Green Version]
  47. Li, W.K.; Guo, Q.; Jakubowski, M.K.; Kelly, M. A New Method for Segmenting Individual Trees from the Lidar Point Cloud. Photogramm. Eng. Remote Sens. 2012, 78, 75–84. [Google Scholar] [CrossRef] [Green Version]
  48. Qiu, Z.; Wang, C.; Zhang, X. Working out the tree volume table of Sect matsudana in Taian. J. Jiangsu For. Sci. Technol. 1990, 03, 33–37. [Google Scholar]
  49. Raumonen, P.; Casella, E.; Calders, K.; Murphy, S.; Åkerbloma, M.; Kaasalainen, M. Massive-Scale Tree Modelling from Tls Data. ISPRS Ann. Photogramm. Remote Sens. Spat. Inf. Sci. 2015, 3, 189–196. [Google Scholar] [CrossRef] [Green Version]
  50. Bohn Reckziegel, R.; Larysch, E.; Sheppard, J.P.; Kahle, H.-P.; Morhart, C. Modelling and Comparing Shading Effects of 3D Tree Structures with Virtual Leaves. Remote Sens. 2021, 13, 532. [Google Scholar] [CrossRef]
  51. Lecigne, B.; Delagrange, S.; Taugourdeau, O. Annual Shoot Segmentation and Physiological Age Classification from TLS Data in Trees with Acrotonic Growth. Forests 2021, 12, 391. [Google Scholar] [CrossRef]
  52. Adams, T.; Bruton, R.; Ruiz, H.; Barrios-Perez, I.; Selvaraj, M.G.; Hays, D.B. Prediction of Aboveground Biomass of Three Cassava (Manihot esculenta) Genotypes Using a Terrestrial Laser Scanner. Remote Sens. 2021, 13, 1272. [Google Scholar] [CrossRef]
  53. Meunier, F.; Krishna Moorthy, S.M.; Peaucelle, M.; Calders, K.; Terryn, L.; Verbruggen, W.; Liu, C.; Saarinen, N.; Origo, N.; Nightingale, J.; et al. Using terrestrial laser scanning to constrain forest ecosystem structure and functions in the Ecosystem Demography model (ED2.2). Geosci. Model. Dev. Discuss. 2021, 1–33. [Google Scholar] [CrossRef]
  54. Wallace, L.; Lucieer, A.; Malenovský, Z.; Turner, D.; Vopěnka, P. Assessment of Forest Structure Using Two UAV Techniques: A Comparison of Airborne Laser Scanning and Structure from Motion (SfM) Point Clouds. Forests 2016, 7, 62. [Google Scholar] [CrossRef] [Green Version]
  55. Liu, J.; Feng, Z.; Yang, L.; Mannan, A.; Khan, T.U.; Zhao, Z.; Cheng, Z. Extraction of Sample Plot Parameters from 3D Point Cloud Reconstruction Based on Combined RTK and CCD Continuous Photography. Remote Sens. 2018, 10, 1299. [Google Scholar] [CrossRef] [Green Version]
  56. Roberts, J.; Koeser, A.; Abd-Elrahman, A.; Wilkinson, B.; Hansen, G.; Landry, S.; Perez, A. Mobile Terrestrial Photogrammetry for Street Tree Mapping and Measurements. Forests 2019, 10, 701. [Google Scholar] [CrossRef] [Green Version]
  57. Moskal, L.M.; Zheng, G. Retrieving Forest Inventory Variables with Terrestrial Laser Scanning (TLS) in Urban Heterogeneous Forest. Remote Sens. 2012, 4, 1–20. [Google Scholar] [CrossRef] [Green Version]
  58. Bienert, A.; Georgi, L.; Kunz, M.; Maas, H.-G.; von Oheimb, G. Comparison and Combination of Mobile and Terrestrial Laser Scanning for Natural Forest Inventories. Forests 2018, 9, 395. [Google Scholar] [CrossRef] [Green Version]
  59. Saarinen, N.; Kankare, V.; Vastaranta, M.; Luoma, V.; Pyörälä, J.; Tanhuanpää, T.; Liang, X.; Kaartinen, H.; Kukko, A.; Jaakkola, A.; et al. Feasibility of Terrestrial laser scanning for collecting stem volume information from single trees. ISPRS J. Photogramm. Remote Sens. 2017, 123, 140–158. [Google Scholar] [CrossRef]
  60. Ganz, S.; Käber, Y.; Adler, P. Measuring Tree Height with Remote Sensing—A Comparison of Photogrammetric and LiDAR Data with Different Field Measurements. Forests 2019, 10, 694. [Google Scholar] [CrossRef] [Green Version]
  61. Wang, Z.; Yao, Z.; Wang, Q. Improved scheme of estimating motion blur parameters for image restoration. Digit. Signal. Process. 2017, 65, 11–18. [Google Scholar] [CrossRef]
  62. Lau, A.; Bentley, L.P.; Martius, C.; Shenkin, A.; Bartholomeus, H.; Raumonen, P.; Malhi, Y.; Jackson, T.; Herold, M. Quantifying branch architecture of tropical trees using terrestrial LiDAR and 3D modelling. Trees 2018, 32, 1219–1231. [Google Scholar] [CrossRef] [Green Version]
  63. Cao, L.; Liu, H.; Fu, X.; Zhang, Z.; Shen, X.; Ruan, H. Comparison of UAV LiDAR and Digital Aerial Photogrammetry Point Clouds for Estimating Forest Structural Attributes in Subtropical Planted Forests. Forests 2019, 10, 145. [Google Scholar] [CrossRef] [Green Version]
  64. Shen, X.; Cao, L.; Yang, B.; Xu, Z.; Wang, G. Estimation of Forest Structural Attributes Using Spectral Indices and Point Clouds from UAS-Based Multispectral and RGB Imageries. Remote Sens. 2019, 11, 800. [Google Scholar] [CrossRef] [Green Version]
  65. Chen, S.; Feng, Z.; Chen, P.; Ullah Khan, T.; Lian, Y. Nondestructive Estimation of the Above-Ground Biomass of Multiple Tree Species in Boreal Forests of China Using Terrestrial Laser Scanning. Forests 2019, 10, 936. [Google Scholar] [CrossRef] [Green Version]
  66. Stovall, A.E.L.; Vorster, A.G.; Anderson, R.S.; Evangelista, P.H.; Shugart, H.H. Non-destructive aboveground biomass estimation of coniferous trees using terrestrial LiDAR. Remote Sens. Environ. 2017, 200, 31–42. [Google Scholar] [CrossRef]
  67. Olagoke, A.; Proisy, C.; Féret, J.-B.; Blanchard, E.; Fromard, F.; Mehlig, U.; de Menezes, M.M.; dos Santos, V.F.; Berger, U. Extended biomass allometric equations for large mangrove trees from terrestrial LiDAR data. Trees 2016, 30, 935–947. [Google Scholar] [CrossRef] [Green Version]
Figure 1. The circular plot location map and natural landscape of the study area.
Forests 12 01020 g001
Figure 2. A target pole in sample plot.
Forests 12 01020 g002
Figure 3. Photogrammetric route and trees distribution in the plot.
Forests 12 01020 g003
Figure 4. 3D point clouds of sample plot.
Forests 12 01020 g004
Figure 5. The process of modeling individual tree TP point clouds by AdQSM. (a) TP point clouds, (b) Delaunay triangulation, (c) weighted all edges and constructed minimum spanning tree, (d) skeleton initialization, (e) skeleton simplification, (f) fitting tree branch cylinder, (g) automatic identification of point cloud in modeling process.
Forests 12 01020 g005
Figure 6. The algorithm process of finding the top endpoint P of the trunk.
Forests 12 01020 g006
Figure 7. Automatically identify the relatively stable part of the curve of the trunk point cloud. P is the top endpoint of the trunk.
Forests 12 01020 g007
Figure 8. Generate all cylinders participating in the clustering initial cylinder radius from the labeled point cloud. Green represents a rough cylinder that participated in two optimizations by nonlinear least square method. The red represents the optimized cylinder, which will be used for clustering to fit the initial cylinder radius of the trunk.
Forests 12 01020 g008
Figure 9. The process of tree branch structure fitting and optimization.
Forests 12 01020 g009
Figure 10. The tree model reconstructed by TreeQSM. (a) TP point clouds of trees, (b) reconstructed cylinder model.
Forests 12 01020 g010
Figure 11. Comparison of DBH and tree height estimated by AdQSM with reference values of field measured: (a) DBH, (b) tree height.
Forests 12 01020 g011
Figure 12. The residuals distribution of DBH.
Forests 12 01020 g012
Figure 13. The residuals distribution of tree height.
Forests 12 01020 g013
Figure 14. The reference value based on the allometric equation and QSM estimates for each tree.
Forests 12 01020 g014
Figure 15. The trunk volume of trees estimated by two QSM methods was compared with the reference measurements. The green line represents fitted linear regression model between estimation of AdQSM and reference values, and the orange line represents fitted linear regression model between estimation of TreeQSM and reference values. The gray band represents 95% confidence interval for AdQSM regression. The orange band represents 95% confidence interval for TreeQSM regression.
Forests 12 01020 g015
Figure 16. Trunk volume residual distribution of AdQSM and TreeQSM.
Forests 12 01020 g016
Figure 17. Trunk volume residual frequency distribution of (a) AdQSM and (b) TreeQSM.
Forests 12 01020 g017
Table 1. Comparison of DBH and tree height accuracy using AdQSM and forest inventory.
CategoryBiasrBias (%)RMSErRMSE (%)
DBH (cm)1.254.261.936.60
Height (m)−1.47−10.861.6712.34
Table 2. Comparison of the accuracy of tree trunk volume estimation between AdQSM and TreeQSM and the allometric equation.
CategoryBiasrBias (%)RMSErRMSE (%)
AdQSM _Volume (m3)0.0706618.730.1236932.78
TreeQSM _Volume (m3)−0.05071−13.440.1326735.16
Publisher’s Note: MDPI stays neutral with regard to jurisdictional claims in published maps and institutional affiliations.

