Article

Spatial and Temporal Patterns of Forest Management Activities from 1990 to 2019 to Demonstrate Additionality for Climate Change Mitigation in the Forest Sector of South Korea

Division of Forest Industry, National Institute of Forest Science, Seoul 02455, Korea
*
Authors to whom correspondence should be addressed.
Forests 2021, 12(8), 1003; https://doi.org/10.3390/f12081003
Submission received: 15 June 2021 / Revised: 21 July 2021 / Accepted: 26 July 2021 / Published: 29 July 2021
(This article belongs to the Special Issue Forest Biomass and Carbon Estimation)

Abstract

:
Forest management is key to maintaining and increasing carbon sinks in forests. In the context of climate change mitigation, the exact number of carbon sinks associated with forest management is estimated as the additionality of activities, which means net greenhouse gas (GHG) removals or carbon sequestration over and above those that would have arisen even in the absence of a given activity. This study analyzes the spatial and temporal patterns of forest management activities to present the forest management ratio, of managed area to the total forest area, as an indicator of additionality in forest management in South Korea. Forest management activities based on the IPCC guidelines were spatially constructed, and the characteristics of managed and protected forests from 1990 to 2019 were analyzed. The results indicate that between the managed forests and roads, 90% of the management activities in private forests occurred within 214 m of the road, and 70% of the activities in the national forest occurred within 234 m. Management took place in easy-to-access places with gentle slopes and low elevations. The proportion of protected forests above 40 years old is 87.2%, higher than the average of 72% in South Korea, and it is expected that most forests will age and their carbon absorption capacity will decrease by 2050. The area of tree planting and thinning is approximately 290 thousand ha per year, which could potentially increase the forest management ratio by up to 4.5% per year. However, the actual increase was at an average of 1.4%, owing to the omission of exact information on management activities, such as spatial coordinates and overlapping practices in the same management unit. The forest management ratio in South Korea as of 2019 was 53.4%; therefore, the amount of GHG removal in the forest sectors was 53.4% of total absorption per year. Thus, it is necessary to make efforts to increase the ratio to enhance the contribution of forest sectors to climate change mitigation for the country.

1. Introduction

Forests play a significant role in storing carbon and absorbing greenhouse gases (GHGs) from the atmosphere [1,2,3,4,5]. In the context of the mitigation of climate change, only the amount of carbon that is stored and absorbed by artificial activities in forests, such as afforestation, reforestation, deforestation, and forest management, is considered in the GHG reduction performance [6]. Therefore, it is necessary to establish an objective and scientifically verifiable system for carbon estimation based on transparency, accuracy, consistency, comparability, and completeness (TACCC) so that the carbon sinks resulting from artificial activities can be added to the GHG removal in each country [7,8].
Forest management is crucial for maintaining and increasing the number of carbon sinks in forests. These carbon sinks decrease as forests grow old and their annual growth diminishes [9], but forest management activities, such as tree planting and thinning, can prolong the sustainability of the dwindling carbon sinks [10,11,12,13]. Forest management activities were thus employed as a way to attain targeted GHG reduction in the United Nations Framework Convention on Climate Change (UNFCCC) member countries during the second commitment period of the Kyoto Protocol [14]. Those include stand-level forest management activities such as site preparation, planting, thinning, fertilization, and harvesting, as well as landscape-level activities such as fire suppression and protection against insects [15]. The diligent use of forest management has continued regarding nationally determined contributions (NDCs), which are submitted in accordance with the Paris Agreement. In particular, having the characteristics of forests similar to those in South Korea, Japan proposed its definite goal of reducing a total of 27.8 million tCO2 via forest management by 2030, which accounts for 2% of the total targeted amount of its NDC [16]. In December 2020, South Korea also confirmed reducing carbon by 22.1 million tCO2 utilizing forests [17].
Expanding forest management is a key task of the South Korean government to sustain the role of forests as carbon sinks [18]. The forest area in South Korea is 6.3 million ha, accounting for 63% of its total land area: 27% of the forest area is designated protected forest, and 76% of the entire forests are privately owned. The annual amount of carbon absorbed by forests in South Korea as of 2018 was 46 million tCO2 [19]. The amount is expected to fall to 24 million tCO2 by 2030 with the aging of forests [20]. It is therefore necessary to equalize the current age-class distribution, as most forests belong to age-class IV [21], through active expansion of forest management. The improvement in the age-class distribution and the resultant conservation of carbon sinks will contribute to mitigating the repercussions caused by climate change.
According to the IPCC guidelines, the carbon accounting methodology for forest management reference level (FMRL), the average annual net emissions and removals from forest management applicable to NDCs, is divided into three categories: (1) business as usual, which is subdivided into model-based and historical-record-based elaborations; (2) the average value of previous carbon emissions and sinks; and (3) FMRL equals zero. In the forestry sector, in order to estimate the amount of uptake by anthropogenic activities, the FMRL, which means the baseline of the forest carbon accounting out of forest management, is set according to the forest circumstance of each country. Each country determines the category used by considering its own situation [22].
Among the three categories, ‘FMRL equals zero’ has been utilized by Japan, in which a narrow approach to forest management was applied [22]. This means that all the carbon accumulated in the sinks by forest management since 1990 can be deemed due to the reduction performance in NDC. The Japanese government has applied a forest management ratio—managed area to total forest area—to demonstrate their additional efforts on forest management over the country. The forest management activities should, however, be clearly classified from spatial, administrative, and ecological perspectives [20,23]. Japan has established not only its system to measure the amount of carbon stored in sinks resulting from forest management activities but also its own method to verify objective estimation of the amount, thereby implementing its annual plans for carbon accounting [24]. Japan’s case, although costly, is an advantageous way to demonstrate additional efforts in forest management activities.
Multiple studies have been conducted in South Korea regarding the methods of carbon accounting in forest management so that the carbon sinks by forests can be considered as carbon removal sources in NDC. Kim et al. [25] conducted a study on the estimation of forest management ratio to apply the narrow approach, as used in Japan based on both the historical data of forest management activities and maximum practice area method. Employing national forest inventory data, Seo et al. [26] computed forest management ratios in 2015 through a systematic sampling method to identify activities present in Chungnam Province. Ham et al. [27] analyzed the history of forest management activities and converted them into spatial data by applying the maximum practice area method to estimate the forest management ratio of South Korea.
These extant studies, however, have limits resulting from the low representativeness arising from pilot studies [25], difficulties in identifying accurate management history [26], and incomplete statistics resulting from a lack of data from the 1990s [27]. In addition, previous studies have focused on ways of estimating forest management ratios, which were impediments to devising plans for the long-term NDC accomplishment. Understanding the characteristics of forest management is a prerequisite for the achievement of NDCs and the preparation of policies to augment carbon sinks in the long term. Such policies are rarely designed until the peculiarities of forest management by region are clearly understood. It is widely recognized that forest roads or the geographical location of forest stands are essential factors in implementing forest management activities. Therefore, it is important to determine such factors so that plans to expand the carbon sink can be sought.
This study aimed to analyze the spatial and temporal patterns of forest management activities at a national level to present the current forest management ratio by utilizing data on the history of such activities between 1990 and 2019. It further interprets the meaning of the ratio in terms of climate change mitigation efforts in the forest sector of South Korea.

2. Materials and Methods

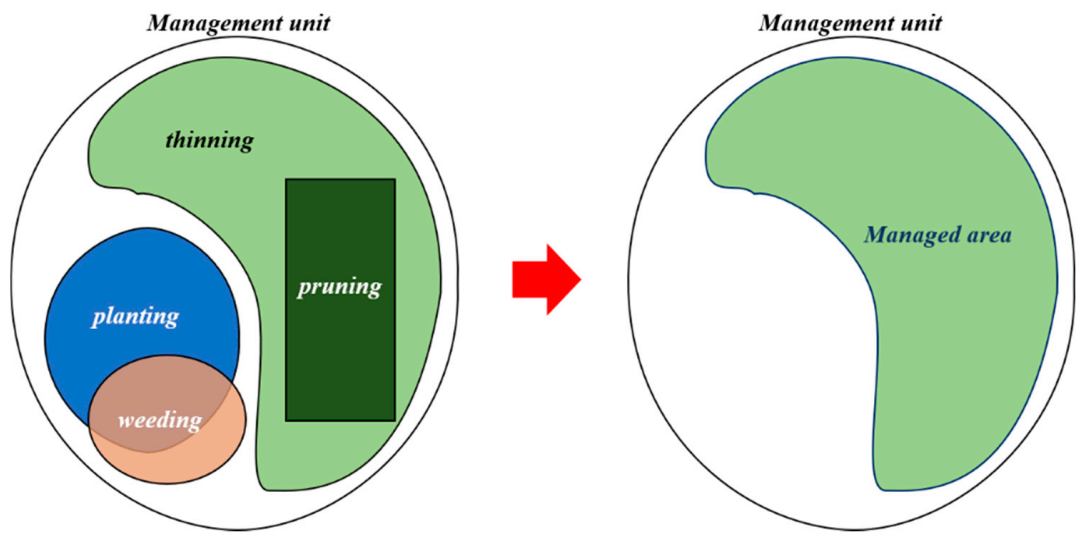
2.1. Definition of Terms and Assumption

The forest management (FM) ratio indicates the ratio of managed forest area, where forest management activities were carried out, to the total forest area (Equation (1)). Forest management activities here denote a narrow approach signifying stand-level forest management (site preparation, planting, thinning, fertilization, and harvesting) and landscape-level activities (fire suppression and protection from insects), implemented since 1990 [15].
FM   ratio   %   = Managed   forest   area   +   Protected   forest   area Forest   area 100
In this study, the FM ratio was estimated for both legally protected forests and those with forest management activities corresponding to the definition of the narrow approach. National and private forests with management activities such as tree planting or timber stand improvement practices—thinning, weeding, and pruning—were classified as managed forests. The legally protected forests represent the forest lands for public benefits designated by various legal Acts (Table A1). These forest lands include most protected areas in Korean forests in the public interest, including the prevention of natural disasters, water preservation, ecosystem conservation, and landscape maintenance. In this research, the forest lands for public benefits were deemed as forests that are thoroughly protected and managed.

2.2. Estimation of FM Ratio

2.2.1. Data

Data on the history of forest management activities in national forests were acquired from the National Forest Management Information System (NFMIS) and the Integrated Management System of Forest Resources (IMSFR). Data on the history of forest management activities in private forests were collected from the Private Forest Management Information System (2003–2019). The reason for applying different systems to each ownership (national or private) is that they are managed separately, and there is a resulting difference in the management information system (Table 1). The historical data of forest management activities for national forests have been contained in the IMSFR since 2013 and in the NFMIS in 1990–2012. Concerning protected forests, there was a collection of spatial data by year on the forest lands for public benefits from the Forest Land Information System (FLIS). However, only the data collected between 2008 and 2019 were utilized in this study because of no availability of other data with all values necessary to estimate the FM ratio.

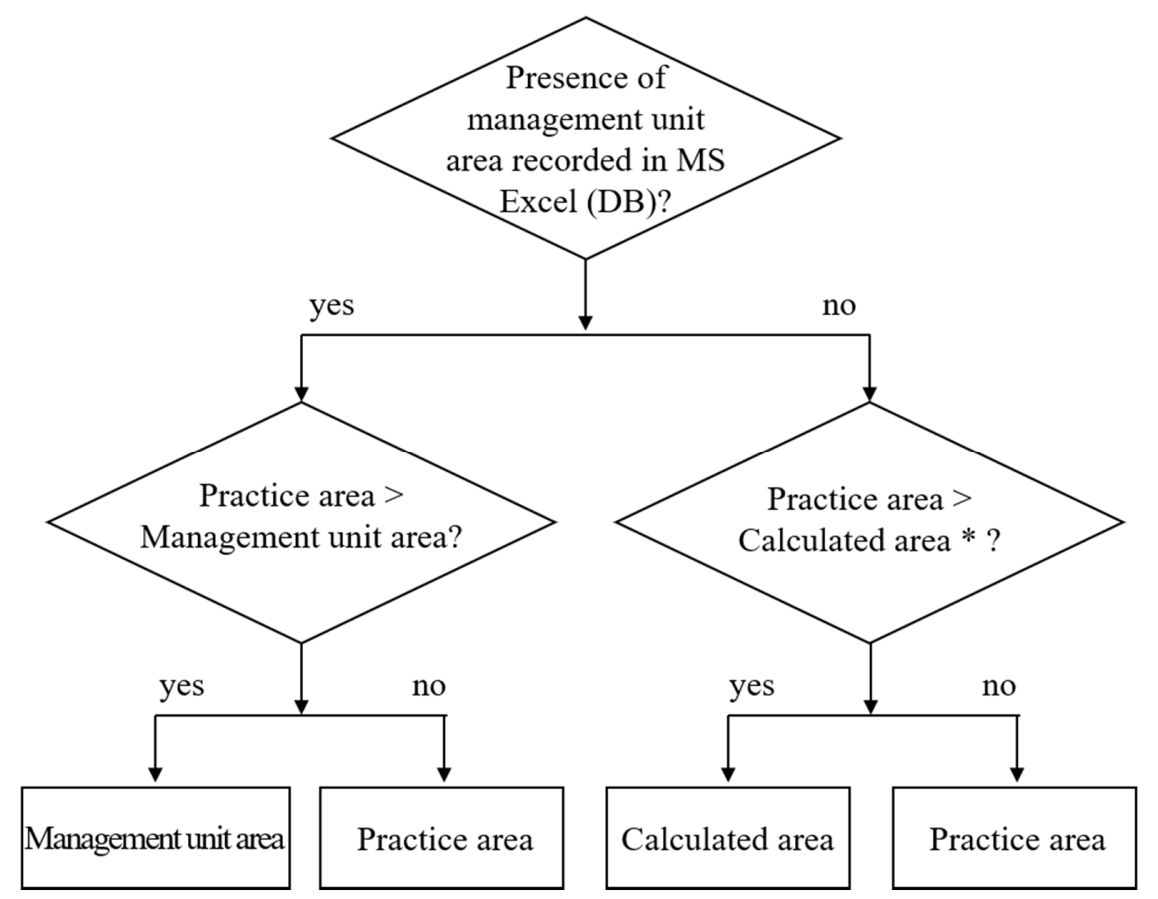
2.2.2. Analysis Procedure

The analysis procedure of the FM ratio was as follows: (1) spatialization of historical information, (2) examination of managed area by management unit, (3) classification of spatially overlapped areas, and (4) estimation of the FM ratio.
Spatialization of the historical information indicates the process of converting and mapping text-formed data on forest management activities into spatial data. To do so, a coordinate was given to a unique number of each management unit for each history of national and private forests to transform the data into point data. A forest management unit represents a well-defined and demarcated land area, managed on a long-term basis and having a set of clear objectives specified in a forest management plan [28]. Next, the point-typed spatial data were mapped through Spatial Join, a function of spatial analysis in GIS software (ArcGIS 10.4.1) [29] based on management unit data. In this study, a cadastral map as of April 2014 for private forests and an updated map of compartments and subcompartments as of 2020 for national forests were used.
The next step is the examination of areas managed by management units based on the information extracted from the three systems, including the NFMIS, IMSFR, and PFMIS. This information consists of management unit number, types of practice, practice year, practice area, and management unit area, with calculated area added to the information through Spatial Join. However, a review process was followed to rectify the imprecise history of forest management activities when there was a difference between practice and management unit areas. For example, it is necessary to replace a practice area with a management unit area if the former is larger. In the inverse case, however, the practice area remains unchanged. The same review was followed based on the calculated area through GIS when no management unit area was observed due to the lack of data (Figure 1).
Through the aforementioned processes, several temporal and spatial types of forest management activities were recorded in individual management units. However, this type of data has its marked limitations. One of them is the potential overestimation of managed areas when no spatial information on correct locations of management activities is available in parts of the management unit area. Nakajima et al. [30] proposed a maximum practice area method (MPAM) to estimate managed areas considering spatial redundancy in management activities per management unit (Figure 2). The method selects the maximum practice area of existing management activities per management unit to prevent multiannual or various types of forest management activities from redundant calculations [25,27,31]; text-based data are not sufficient to identify exact locations if different practices overlap in the same management unit. Thus, the MPAM is applied to estimate the area with the largest practices as the managed area.
Caution should also be taken in tree planting, and the MPAM was used when tree species were homogeneous or when species for forest management activities were recorded when they were replanted. In the case of heterogeneous species, however, the areas of tree planting were aggregated under the assumption that forest management activities would not have arisen in the same location.
Finally, estimating the FM ratio involves the exclusion of overlapped areas between the protected and managed areas in the national and private forests. Overlap of areas occurs either when a management record is not updated despite a switch in ownership of a private forest or when a protected area exists inside the national and private forests. These inaccuracies cause the FM ratio to be overestimated. Thus, additional analysis with a function of Select by Location: Centroid in ArcGIS [29] was performed to separate the spatially overlapped areas. When the areas of national, private, and protected forests overlapped, each area was ranked in the order of protected, national, and private forests, clearly demarcating them.

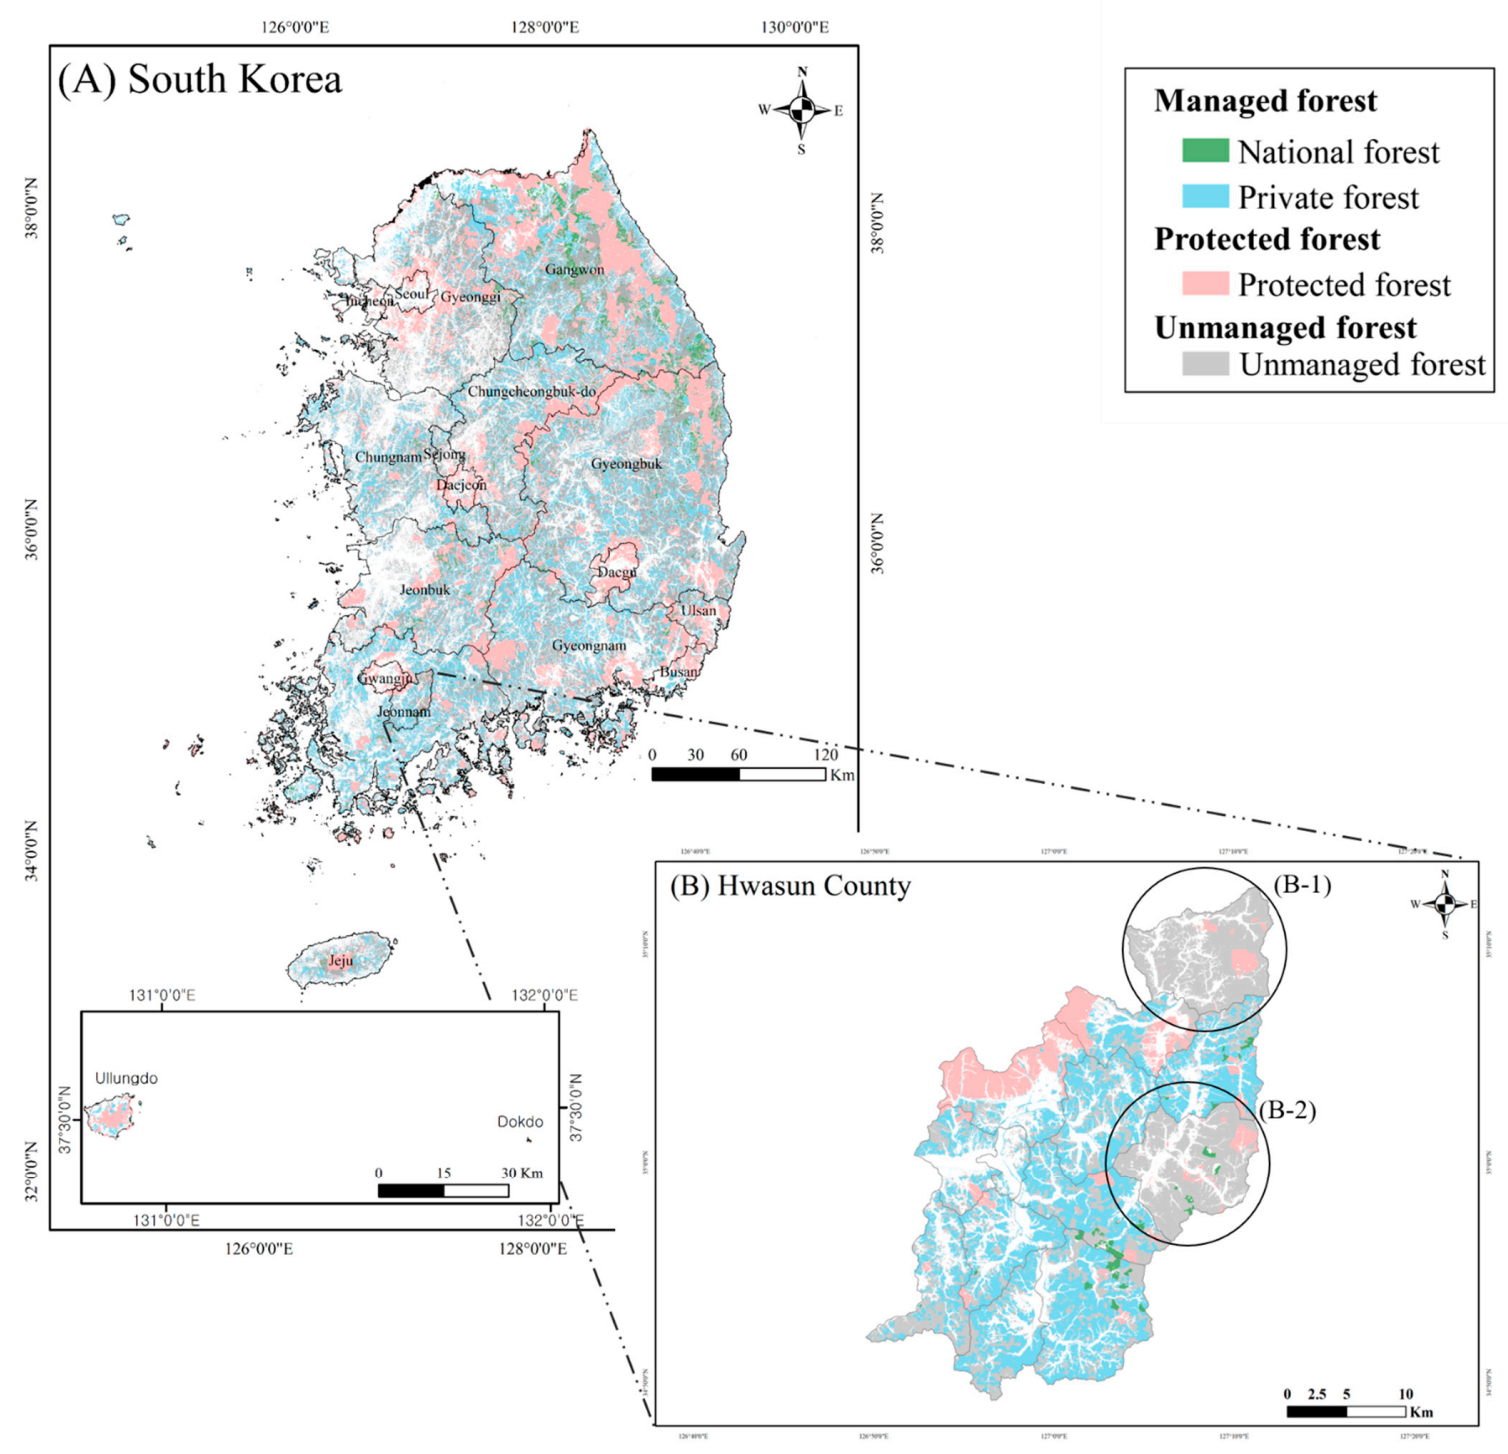
2.3. Characteristic Analysis of Managed and Protected Forests

Differences in altitude, slope, and age of stands were analyzed to ascertain the spatial attributes of the managed and protected forests. Information was collated on roads and contours of the entire country from both a digital map of the National Territory Information Platform (NTIP) and a forest road network of the Forest Geospatial Information System (FGIS). Furthermore, forest types (plantation or natural) and age-class data (each class indicates 10-year gaps) pertaining to each stand were analyzed using a forest map as of 2019 provided by the Korea Forest Service.
The differences in altitudes and slopes were analyzed using zonal statistics [29]. This method was employed to produce descriptive statistics for the values in the zone through repeated analysis of the layer set as a zone and the layer set as the value to be analyzed. To obtain a mean value for altitudes and slopes, a digital elevation model (DEM) and degree slope were created based on the contours of the country, extracted from the digital map. Next, borders of the managed and the protected forests were set as the zone layer, and the average values for attitudes and slopes were computed using zonal statistics. The forest map was then utilized to analyze the differences in species and age of stands for the areas equivalent to the managed and the protected forests. Data were gathered on stands of the managed and the protected forests by using Select by Location: Centroid [29], and areas by species and age of stands were then analyzed.
By using Near of ArcGIS to calculate the proximity [29], both central points and the minimum distance to roads in the management unit were analyzed to determine the patterns of management characteristics according to the proximity to roads. To do this, the country’s road and the forest road data were extracted from the digital map. The minimum distance from the management unit to the road was measured based on the central point per management unit.

3. Results and Discussion

3.1. Estimation of Forest Management Ratio

From the management database systems of national and private forests, 1,940,521 cases for thinning and 170,269 cases for tree planting in private forests were recorded. On the other hand, the national forest data showed 140,515 cases for thinning and 26,574 cases for tree planting. Through the process of spatializing forest management activities, 1,758,832 cases of thinning and 151,339 cases of tree planting were recorded in private forests, while 99,050 cases of thinning and 16,645 cases of tree planting were performed in national forests. A total of 200,619 cases (approximately 10%) for private forests and 51,394 cases (approximately 31%) for national forests were not included in the estimation of the FM ratio. This is due to the disappearance of data in the spatialization procedure. The data loss containing text-typed records of forest management activities is likely to result from a change in the management unit. For example, a shift in existing data tends to occur when administrative districts or ownership changes or division of management units takes place. As for national forests, a change in previous management units due to new management plans is likely to cause the loss of management records. In this study, the loss proportion for national forests was much higher than that for privately owned forests. It is recommended in the narrow approach of the IPCC guideline that spatial data be presented in the case of forest management activities [15,23]. Currently, however, the text-based data on forest management activities applied in Korea has its limitations in underestimation due to loss of data when the data are formed. It is thus necessary to convert text-typed information into spatialized ones. Recently, the Korea Forest Service changed to spatialized data to prevent the data loss with text-typed management records.
The results were drawn from the estimation of managed areas for the national and the private forests by applying the MPAM to the records of forest management activities accumulated from 1990 to 2019. The findings suggested that the managed area in national forests gradually increased between 1990 and 2009, reaching 206,000 ha in 2019. No growth rate in the managed area was observed in 2013. On the other hand, the private forests, the managed area of which was 752,000 ha from 2003 to 2008, rose steadily to 1,806,000 ha in 2019. As for protected forests, however, a gradual downward trend from 1,702,000 ha in 2008 to 1,628,000 ha in 2019 was discovered. The reason for no change in the managed area by year for the national forests in 2013 was due to the change in the system of histories of forest management activities from the NFMIS to the IMSFR, which resulted in a smooth data system transition for the same period (Table 2).
After the process of removing spatial overlap from the area in Table 2, the FM ratio is obtained by substituting it in Equation (1). Table 3 displays the final results derived from excluding overlapped areas by applying a method of separating overlapped areas to the above analysis. The results reveal that the accumulated management area, including protected forests, was 2,395,000 ha from 1990 to 2008 and grew steadily to 3,365,000 ha as of 2019. When the area was converted into the FM ratio, it was approximately 53.4%, with an annual growth rate of 1.4%.
Table 4 indicates the findings drawn from the analysis of the management area and the FM ratio by province as of 2019. The FM ratio ranged from 29% (in Sejong) to 91% (in Gwangju), and the management area for private forests was over 300,000 ha in Chunnam and Gyeongbuk. In large metropolitan areas such as Seoul, Daejeon, Daegu, and Gwangju, protected forests account for over 70% of the management area. Figure 3 shows the spatial distribution of the managed area by province, with an enlarged map of the distribution of managed and unmanaged forests in Hwasun County as an example of a typical region with frequent loss of spatial data.
The analyses further revealed that the additionally managed area was approximately 7000 ha for national forests and 84,000 ha for private forests from 2008 to 2019. The national statistics, however, show that during the last five years, the average area for tree planting is approximately 23,000 ha, and that of thinning reaches 267,000 ha in South Korea [21]. An additional 290,000 ha of managed area could exist if every management activity would not have been duplicated. However, the analysis revealed that the annual growth of managed areas was 91,000 ha, a mere third of the potential maximum area of management activities.
This trend was linked to the growth rate of the FM ratio. The value of 290,000 ha, an aggregate of the tree planting and thinning area during the last five years, suggests that the FM ratio is likely to increase by 4.5% to the maximum, under the assumption that the total area of forests is 6.3 million ha. A consistent annual rise of 4.5% in the FM ratio will theoretically lead the ratio to be 100% by 2030. However, the current annual growth in the FM ratio in South Korea was 1.4% on average. The FM ratio is expected to reach approximately 68.8% by 2030 if the trend remained unchanged.
As of 2018, the annual amount of carbon absorbed by forests in South Korea is 46 million tCO2 [19]. Of these 46 million tCO2, 24.5 million tCO2 are accepted as the reduction by forests if 53.4% of the FM ratio is applied to the annual amount of CO2 absorbed by forests according to the IPCC guideline (Equation (2)).
Reduction   tCO 2   = Annual   amount   of   CO 2   absorbed   by   forests FM   Ratio   %
No change in the current trend denotes that the FM ratio will be 68.8% by 2030, and the estimated amount of CO2 that will be absorbed in 2030 is 24 million tCO2 [20]. As a result, the reduction will be 16.5 million tCO2, leading to a failure in achieving the goal. To achieve the reduction target, which is 22.1 million tCO2, the annual amount of CO2 absorbed by forests should be 32.1 million tCO2.
It is difficult to accomplish the reduction target, as most forests in South Korea are aging and their ability to absorb carbon will inevitably decline. Therefore, it is necessary to increase the FM ratio by implementing active forest management in a variety of areas without redundancy in forest management activities.

3.2. Characteristics of Forest Management Areas

Table 5 shows the results of the analyzed elevation and slopes in managed areas in national and private forests. It was reported that forest management activities took place at an average altitude of 365 m for national forests and 229 m for private forests. Similarly, a difference was also observed in the slopes of the area with forest management activities between national and private forests. As for national forests, forest management activities were implemented at a mean slope of 20°, which is steeper than that of private forests, averaged out at 13°. The reason for this difference lies in accessibility and the resultant additional costs of forest management activities. In Korea, where most forests are located in mountainous areas, private forest owners prioritize the areas with high accessibility to make a profit, contrary to national forests, which are less associated with the financial gain from the management activities.
Table 6 indicates the characteristics of managed and protected forests by type and age-class distribution. Of the 3,280,836 ha of forests, including unstocked forests, the rate of plantation forests was higher in managed forests (398,300 ha, 12.1%) than in protected forests (179,900 ha, 5.5%). Regarding protected forests, the area equal to or younger than age-class III (30 years old) was 198,920 ha, whereas that with equal to or older than age-class IV (40 years old) was 1,357,000 ha. This notion indicates that an area equal to or older than age-class IV accounted for 87.2% of the total protected forests, which is higher than 72%, the area percentage equal to or older than age-class IV in the total area of Korean forests [21]. It is expected that protected forests are likely to mature faster than average, thus most of their areas will be equal to or older than age-class IV by 2050. This means a potential decline in the ability to absorb carbon in protected forests where active forest management cannot easily be implemented. Therefore, sustaining carbon sinks through the expansion of forest management in managed forests is required to alleviate climate change.
Meanwhile, the rate of the area equal to or older than age-class IV was 72.7% in managed forests, thereby indicating a larger share of the area that is younger than age-class IV, compared to protected forests. This means that forest management activities for timber production occur frequently in managed forests. Restrictions are placed on timber harvesting in protected forests that are managed under the Creation and Management of Forest Resources Act [32]. In these protected forests, only forest management activities for public benefits are applicable with permission from the municipality in charge.
Table 7 shows the analysis results of the relationship between forest management activities and the distance from roads, based on the incidence of the activities. As for private forests, 90% of 927,000 cases for forest management areas were carried out within 214 m distance from the roads, whereas approximately 70% of 18,000 cases for national forests took place within 234 m. A similar trend has been observed in several previous studies [33,34] noting that most forest management activities were introduced within 500 m, with between 100 and 200 m being the most frequent.
Hwang et al. [35] reported that the creation of forest roads is associated with the enhancement in accessibility and economic efficiency, thus magnifying the effectiveness of forest management activities and expanding the area that is actually managed. Hence, to increase the FM ratio, it is necessary to strengthen the foundation of forest management activities by building more forest roads. However, some negative environmental impacts that laying down infrastructure in forests may cause (i.e., carbon emission from removing vegetation for road construction) should be considered properly.

4. Conclusions

This study was conducted to propose a method of maintaining a carbon account that is objective and scientifically verifiable concerning the assessment of the additionality of forest management in South Korea. The narrow approach was applied to establish the spatial data on forest management activities and to analyze the spatial characteristics and FM ratio of the given area.
The findings suggested that the FM ratio in South Korea, as of 2019, was 53.4%. The average aggregate area of planting and thinning for the past five years is approximately 290,000 ha, which means an increase by a maximum of 4.5% annually is available if the activities are implemented with no redundancy. In this case, the remaining 46.6% can be managed entirely by 2030. However, the underestimation of managed areas results from the inability of existing text-based data on forest management activities to identify spatial locations. To address this, a change in the management system to store and provide records of management activities is necessary. No change in the current trend on forest management will cause the government’s reduction target by 2030 to not be achieved because of the imbalanced age-class distribution and the resultant decline in the ability to absorb carbon. Hence, highly extensive forest management is required to solve the issues.
In addition to the expansion of managed forest areas, finding quantifiable evidence that an increase in the carbon sink through a comparative analysis of the difference in the number of carbon sinks between stands, with and without forest management activities, is important. Timely forest management activities bring about a long-term increase in carbon absorption in forests. To enhance the quality of forest management in South Korea, it is necessary to demonstrate the function of absorbing carbon, especially in managed forests with diligent forest management activities.

Author Contributions

Conceptualization, S.L. (Sunjeoung Lee) and H.H.; methodology, S.L. (Seunghyun Lee) and J.Y. (Joungwon You); validation, S.L. (Seunghyun Lee), S.L. (Sunjeoung Lee) and H.H.; formal analysis, S.L. (Seunghyun Lee) and J.Y. (Joungwon You); investigation, S.L. (Seunghyun Lee), S.L. (Sunjeoung Lee) and H.H.; resources, J.Y. (Jongsu Yim) and J.S.B.; data curation, S.L. (Seunghyun Lee) and J.Y. (Joungwon You); writing—original draft preparation, S.L. (Seunghyun Lee); writing—review and editing, H.H. and S.L. (Sunjeoung Lee); visualization, S.L. (Seunghyun Lee) and J.Y. (Joungwon You); supervision, J.Y. (Jongsu Yim) and J.S.B.; project administration, S.L. (Sunjeoung Lee) and J.Y. (Jongsu Yim); funding acquisition, J.S.B. All authors have read and agreed to the published version of the manuscript.

Funding

This research was funded by the National Institute of Forest Science, grant number FM0200-2019-01-2021.

Data Availability Statement

Not applicable.

Acknowledgments

This study was supported by the R&D Program for Forest Science Technology (Project No. FM0200-2019-01-2021) provided by the National Institute of Forest Science.

Conflicts of Interest

The authors declare no conflict of interest.

Appendix A

Legally protected forests for public benefits designated by various legal acts. These forest lands include most protected areas in Korean forests in the public interest including the prevention of natural disasters, water preservation, ecosystem conservation, and landscape maintenance, etc.
Table A1. Classification of forest lands for public benefit in South Korea [36].
Protected Forest Properties *Relevant Act
Natural recreation forestsForestry Culture and Recreation Act
Forestland of temple forestsMountainous Districts Management Act
Restricted areas for conversion and temporary useMountainous Districts Management Act
Mountainous districts in Special protection and wildlife protection for wildlife prescribedWildlife protection and management Act
Mountainous districts in park areasNatural Parks Act
Mountainous districts in protective zones for the preservation of cultural heritage assetsCultural Heritage Protection Act
Mountainous districts in water-source protection areasThe Water Supply and Waterworks Installation Act
Mountainous districts in development restriction zonesThe Special Measures for Designation and Management of Development Restriction Zones Act
Mountainous districts in green areas prescribed by Presidential DecreeThe National Land Planning and Utilization Act
Mountainous districts in ecological and scenery conservation areasThe Natural Environment Conservation Act
Mountainous districts in wetlands protection areasThe Wetlands Conservation Act
Mountainous districts in specified islandsThe Special Act on the Preservation of the Ecosystems in Island including Dokdo
Mountainous districts in Baekdu-daegan Protection AreasThe Baekdu-daegan Protection Act
Mountainous districts in forest protection areas prescribedThe Forest Protection Act
Other mountainous districts necessary for promoting public interest functionsPresidential Decree
* The acts pertaining to each protected forest property above are stipulated in the Mountainous Districts Management Act–Article 4 (the title of this table: Classification of Mountainous Districts).

References

  1. Jiao, Y.; Hu, H.Q. Carbon storage and its dynamics of forest vegetations in Heilongjiang Province. Chin. J. Appl. Ecol. 2005, 16, 2248–2252. Available online: http://europepmc.org/abstract/med/16515166 (accessed on 8 February 2021).
  2. Lee, S.; Lee, S.; Shin, J.; Yim, J.; Kang, J. Assessing the Carbon Storage of Soil and Litter from National Forest Inventory Data in South Korea. Forests 2020, 11, 1318. [Google Scholar] [CrossRef]
  3. Pan, Y.; Birdsey, R.A.; Fang, J.; Houghton, R.; Kauppi, P.E.; Kurz, W.A.; Phillips, O.L.; Shvidenko, A.; Lewis, S.L.; Canadell, J.G.; et al. A Large and Persistent Carbon Sink in the World’s Forests. Science 2011, 333, 988–993. [Google Scholar] [CrossRef] [PubMed] [Green Version]
  4. KOFPI (Korea Forestry Promotion Institute). Korea Forest Resources by Numbers; KOFPI: Seoul, Korea, 2017; p. 13. [Google Scholar]
  5. Yim, J.S.; Kim, R.H.; Lee, S.J.; Son, Y.M. Land-use Change Assessment by Permanent Sample Plots in National Forest Inventory. J. Clim. Chang. Res. 2015, 6, 33–40, (In Korean with English Abstract). [Google Scholar] [CrossRef]
  6. UNFCCC (The United Nations Framework Convention on Climate Change). Report of the Conference of the Parties Serving as the Meeting of the Parties to the Kyoto Protocol on Its Seventh Session, Held in Durban from 28 November to 11 December 2011. Available online: https://unfccc.int/resource/docs/2011/cmp7/ (accessed on 8 February 2021).
  7. UNFCCC. Report of the Conference of the Parties Serving as the Meething of the Parties to the Paris Agreement on the Third Part of Its First Session, Held in Katowice from 2 to 15 December 2018. Available online: https://unfccc.int/sites/default/files/resource/ (accessed on 8 February 2021).
  8. IPCC (Intergovernmental Panel on Climate Change). IPCC Guidelines for National Greenhouse Gas Inventory; IPCC/IGES: Hayama, Japan, 2006. [Google Scholar]
  9. Bradford, J.B.; Kastendick, D.N. Age-related patterns of forest complexity and carbon storage in pine and aspen–birch ecosystems of Northern Minnesota, USA. Can. J. Res. 2010, 40, 401–409. [Google Scholar] [CrossRef]
  10. An, H.J.; Seok, H.D.; Lee, S.M.; Choi, J.Y. Forest management practice for enhancing carbon sequestration in national forests of Korea. For. Sci. Technol. 2019, 15, 80–91. [Google Scholar] [CrossRef] [Green Version]
  11. Perez-Garcia, J.; Lippke, B.; Comnick, J.; Manriquez, C. An assessment of carbon pools, storage, and wood products market substitution using life-cycle analysis results. Wood Fiber. Sci. 2007, 37, 140–148. [Google Scholar]
  12. Fahey, T.J.; Woodbury, P.B.; Battles, J.J.; Goodale, C.L.; Hamburg, S.P.; Ollinger, S.V.; Woodallp, C.W. Forest carbon storage: Ecology, management, and policy. Front. Ecol. Environ. 2010, 8, 245–252. [Google Scholar] [CrossRef] [Green Version]
  13. Lippke, B.; Oneil, E.; Harrison, R.; Skog, K.; Gustavsson, L.; Sathre, R. Life cycle impacts of forest management and wood utilization on carbon mitigation: Knowns and unknowns. Carbon Manag. 2011, 2, 303–333. [Google Scholar] [CrossRef]
  14. UNFCCC. Synthesis Report of the Technical Assessments of the Forest Management Reference Level Submissions. Available online: https://unfccc.int/sites/default/files/resource/docs/2011/ (accessed on 8 February 2021).
  15. IPCC. 2013 Revised Supplementary Methods and Good Practice Guidance Arising from the Kyoto Protocol; IPCC/IGES: Hayama, Japan, 2014. [Google Scholar]
  16. UNFCCC. Japan’s Fourth Biennial Report. Available online: https://www4.unfccc.int/sites/SubmissionsStaging/NationalReports/Documents/ (accessed on 8 February 2021).
  17. UNFCCC. Submission by the Republic of Korea: Intended Nationally Determined Contribution. Available online: https://www4.unfccc.int/sites/ndcstaging/PublishedDocuments/ (accessed on 8 February 2021).
  18. Korea Forest Service (KFS). 2021 Annual Plan to Implement a Comprehensive Plan for Carbon Sink Enhancement; KFS: Daejeon, Korea, 2020; p. 21. (In Korean)
  19. GIR (Greenhouse Gas Inventory and Research Center). National Greenhouse Gas Inventory Report of Korea; GIR: Chungcheongbuk-do, Korea, 2020; p. 438. [Google Scholar]
  20. Han, H.; Shin, J.H.; Kim, Y.H.; Bae, J.S. Estimation of national-level carbon absorption considering long-term changes in forests. In Proceedings of the International symposium for 60th Anniversary of Korean Society of Forest Science “Globalization of Korean Forests Science Research”, Kangwon, Korea, 30 November 2020. [Google Scholar]
  21. KFS. Statistical Yearbook of Forestry; KFS: Daejeon, Korea, 2020; p. 449.
  22. UNFCCC. Report of the Technical Assessment of the Forest Management Reference Level Submission of Japan Submitted in 2011; UNFCCC: Bonn, Germany, 2011. [Google Scholar]
  23. Kim, K.M.; Roh, Y.H.; Kim, E.S. Comparison of Three Kinds of Methods on Estimation of Forest Carbon Stocks Distribution Using National Forest Inventory DB and Forest Type Map. J. Korean Assoc. Geogr. Inf. Stud. 2014, 17, 69–85. [Google Scholar] [CrossRef] [Green Version]
  24. NIES (National Institute for Environmental Studies). National Greenhouse Gas Inventory Report of Japan; NIES: Ibaraki, Japan, 2019. [Google Scholar]
  25. Kim, H.H.; Kang, H.D.; Kim, R.H.; Kim, C.M.; Koh, K.C.; Lee, K.H. Estimation of forest management ratio under article 3.4 of the Kyoto Protocol: A case study on the Chungcheongbukdo. J. Kor. For. Soc. 2013, 102, 608–616. [Google Scholar] [CrossRef] [Green Version]
  26. Seo, Y.O.; Lumbres, R.I.C.; Jung, S.C.; Won, H.K.; Lee, Y.J. Application of national forest inventory data to estimate management ratios for private forests in Chungnam province. J. Agirc. Life Sci. 2015, 49, 31–37. [Google Scholar] [CrossRef]
  27. Ham, B.Y.; Song, C.H.; Park, E.B.; Choi, S.E.; Lee, W.K. Development of Forest Activity Data and Forest Management Rate for National Greenhouse Gas Inventory in the Forest Sector. J. Clim. Chang. Res. 2020, 11, 53–63. [Google Scholar] [CrossRef]
  28. FAO (Food and Agriculture Organization of the United Nations). Asia-Pacific Forestry Commission: Development of National-Level Criteria and Indicators for the Sustainable Management of Dry Forests of Asia: Background Papers; FAO: Rome, Italy, 2000; p. 7. [Google Scholar]
  29. ESRI (Environmental Systems Research Institute). ArcGis Desktop: Release 10; ESRI: Redlends, CA, USA, 2011. [Google Scholar]
  30. Nakajima, T.; Takuya, H.; Amano, M. Developing Methods for Estimating Forest Areas under Article 3.4 of the Kyoto Protocol: A Case Study on Private Lands in Gifu Prefecture, Japan. J. Jpn. For. Soc. 2006, 88, 181–186. [Google Scholar] [CrossRef]
  31. Hiroshima, T.; Nakajima, T. Estimation of Sequestered Carbon in Article-3.4 Private Planted Forests in the First Commitment Period in Japan. Forestry Agency, Japan. J. For. Res. 2006, 11, 427–437. [Google Scholar] [CrossRef]
  32. National Law Information Center. Creation and Management of Forest Resources Act (Article 36 Permission, Reporting, ect. of Felling Standing Timber, etc.). Available online: https://elaw.klri.re.kr/kor_service/ (accessed on 8 February 2021).
  33. Cha, D.S.; Ji, B.Y.; Kim, K.M.; Choi, I.H. Investigation and effect analysis for silvicultural activities with forest road establishment. J. Korean For. Soc. 1998, 87, 239–252. (In Korean) [Google Scholar]
  34. Norihiko, S. An analysis of forestry operation’s intensity from the viewpoint of accessibility. J. Jpan. For. Soc. 1994, 76, 218–223. (In Japanese) [Google Scholar]
  35. Hwang, J.S.; Ji, B.Y.; Jung, D.H.; Cho, M.J. Effect of Forest Road Network on Accessibility and Cost Reduction for Forest Operations (I) Silvicultural Operations. J. Korean For. Soc. 2015, 104, 615–621. [Google Scholar] [CrossRef]
  36. KFS. Mountainous Districts Management Act–Article 4–Classification of Mountainous Districts; KFS: Daejeon, Korea, 2020.
Figure 1. Decision-making process for the managed area of individual management units. * Area calculated using GIS.
Forests 12 01003 g001
Figure 2. Example of the maximum practice area method (MPAM) applied to analyzing the managed area in individual management units. Text-based data are not sufficient to identify exact locations if different practices overlap in the same management unit. Thus, the MPAM is applied to estimate the area with the largest practices as the managed area.
Forests 12 01003 g002
Figure 3. (A) Distribution of managed forest areas in South Korea; (B) enlarged map of forest management areas in Hwasun County as an example. (B-1) and (B-2) show where the data loss of management activities in privately owned forests has occurred.
Forests 12 01003 g003
Table 1. Source of data collected from different database systems.
CategoryDatabase System (Period)Data Type
Managed forestNational forestNFMIS * (1990–2012)MS Excel
IMSFR ** (2013–2019)MS Excel, GIS Shp file
Private forestPFMIS *** (2003–2019)MS Excel
Protected forestFLIS **** (2008–2020)GIS Shp file
* National Forest Management Information System (NFMIS). ** Integrated Management System of Forest Resource (IMSFR). *** Private Forest Management Information System (PFMIS). **** Forest Land Information System (FLIS).
Table 2. Results of forest management area without considering redundant areas.
YearManaged ForestProtected Forest
(1000 ha)
National ForestPrivate Forest
CN *
(n)
MA **
(1000 ha)
CN *
(n)
MA **
(1000 ha)
2008776495315,5527521702
20099057115391,8659241704
201010,050129460,13210661680
201111,047143534,40612031667
201211,950156607,83413551659
201311,950156662,29014811646
201411,963157709,49615681640
201513,266173749,29916431637
201614,195185790,15717041625
201714,888195834,01017641628
201815,582201893,25318061623
201916,006206927,77918401675
* CN: cumulative number of practices; ** MA: managed area.
Table 3. Changes in forest management area and ratio by year from 2008 to 2019.
YearForest Management Area (1000 ha)Total Forest Area **
(1000 ha)
FM Ratio ***
(%)
Managed Forest *Protected
Forest
Total
National
Forest
Private
Forest
20085563917022395637537.6
20096678417042553637040.1
20107590816802663636941.8
201182102216672771634843.7
201289115216592901634045.8
201389126016462995633947.2
201489133716403066634248.3
2015100140016373137633549.5
2016109145516253188632650.4
2017116150816283252631851.5
2018121154616233290630652.2
2019127156316753365629953.4
Average increase/decrease
(1000 ha, %)
784−288−71.4
* The management area for national forests was calculated based on the data from 1990, with that for private forests based on the data from 2003. ** The total forest area was measured according to the forestry statistical year book of the Korea Forest Service. *** The data on the FM ratio by year were collated from 2009 to 2019 when spatial data on protected forests existed.
Table 4. Forest management ratio by province in 2019.
ProvincesForest Management Area (1000 ha)FM Ratio (%)
Forest AreaNational ForestPrivate ForestProtected
Forest *
Total
Seoul150.002111(72)1280
Busan350.074720(59)2779
Daegu48-142(86)4388
Incheon390.011127(19)1948
Gwangju19-116(83)1791
Daejeon300.183322(74)2585
Ulsan680.081833(48)4160
Sejong250.15934(17)729
Gyeonggi5126.15758152(30)21642
Gangwon136867.265242457(33)76756
Chunbuk4886.646111131(27)24951
Chunnam4043.89214051(13)19548
Jeonbuk4417.389103127(29)23754
Jeonnam6875.127300132(19)43764
Gyeongbuk133425.736335273(20)63448
Gyeongnam6993.583221175(25)39957
Jeju870.5161622(25)3844
Sum6299126.815631675(27)336553
* The figures in parentheses show the ratio (%) of protected forests to the total area of forests by province.
Table 5. Topographic characteristics of managed areas in the national and private forests.
CategoryElevation (m)Slope (°)No. of Cases
MeanStd.MeanStd.
Managed forestNational365145.7208.24,018,334
Private229157.4159.227,918,371
Protected forest326204.6188.618,536,911
Table 6. Forest management areas by forest type and age class (1000 ha).
Managed Forest **Protected Forest ***
PlantationNaturalTotalPlantationNaturalTotal
Age class *I135.506.24141.74(8%)21.291.7223.00 (1%)
II54.2422.1076.35(5%)11.4910.2821.78 (1%)
III64.38163.59227.96(13%)29.25124.89154.14 (10%)
IV118.24664.80783.04(46%)89.37663.11752.48 (47%)
V24.94342.43367.37(22%)26.85471.31498.16 (31%)
VI0.9332.3733.30(2%)1.1993.1894.38(6%)
VII0.041.371.41(0%)0.228.408.62(1%)
VIII0.011.061.07(0%)0.191.892.08(0%)
IX0.020.060.09(0%)0.051.031.08 (0%)
Unstocked ****--57.67(3%)--35.13(2%)
Sum398.301234.021690.00(100%)179.901375.811590.84(100%)
* A gap, for example, between age classes I and II, indicates a 10-year gap. ** Managed forest’s area by age class is obtained by multiplying the area of managed forest (1,690,000 ha) and distribution ratios of each age class, which can be analyzed using GIS. *** The GIS analysis result of the area marked as forest type in borders of protected forests, which is equivalent to 1,590,840 ha. **** Unstocked means no presence of any age class.
Table 7. Distance of forest management areas from road.
Percentile (%)Distance from Road (m)
National ForestPrivate Forest
7023493
80328137
90478214
10023383080
Publisher’s Note: MDPI stays neutral with regard to jurisdictional claims in published maps and institutional affiliations.

