Abstract
Forest operations are well known in exposing their workers to many risk factors, and they often require ergonomic interventions for improvement. In this regard, evaluation of biomechanical exposure has gained a lot of interest due to the concerning scientific results repeatedly showing the association between poor working postures and the development of work-related musculoskeletal disorders. Due to its simplicity, easy understanding, cost affordability, and the capability to evaluate the whole body, the OWAS method has been commonly used in postural evaluation of forestry work, being able to map the experimental observations in a final action category, in the form of a postural risk index (PRI), which helps designing or taking actions for ergonomic improvement. However, postural comparability is both relevant and important when, for instance, one tries to improve a work method or to introduce a new technology. Unfortunately, the PRI metric holds a rather low capability to characterize the changes brought by such factors in terms of postural dissimilarity or similarity, making it difficult to accurately follow the changes. For this reason, we introduce in the postural analysis, test and discuss herein two commonly used similarity metrics as specific to plant sociology and other ecology-related sciences, namely the Sørensen’s quotient of similarity (hereafter QS) and the Canberra metric (hereafter CM); their selection was based on their mathematical capabilities of dealing with data at two resolutions, namely species and individuals. Three case studies were setup to show the differences between QS, CM, and PRI and their usefulness for postural analysis while, for a better understanding, the results were described and discussed by analogy to the living world. As the technology of automating data collection and processing for postural analysis is in progress, the utility of similarity metrics in postural assessment and comparison could be further expanded so as to map a given work sequence in the time domain against best-fit postural profiles. The main conclusion of this study is that the PRI is useful for action-taking while the similarity metrics are useful for pairwise postural change evaluations and comparison.
1. Introduction
Wood procurement is a complex process that includes a set of operations of which many are implemented outdoors, in workplaces that are often characterized by difficult terrain and adverse weather conditions [1]. Typically, the implementation of timber harvesting operations is done by the use of machines and tools which, in addition to the inherent safety risks, expose their operators to other harmful factors such as the noise, dust and vibration. The introduction and use of fully mechanized harvesting systems has been found to improve the operational productivity, safety, and ergonomics [2,3], representing a necessary step towards the transition to autonomous machines and robots, which are forecasted to work in the forests of the future [4,5]. However, despite the efforts put towards a complete mechanization of the forest work and machine improvement [6,7], in many geographical areas the operational reality shows that the use of partly mechanized harvesting systems, requiring manual labor, is still extensive [8,9,10].
A significant body of knowledge has been built by applying the ergonomics methods to forest operations, by studies spanning a wide variety of topics and a fairly large number of operational setups and harvesting equipment [11]. For instance, such studies have evaluated the workload and work difficulty by the means of cardiovascular response [12,13,14,15,16,17,18,19,20,21,22,23], mental workload [24,25], exposure to harmful factors caused by the use of tools and machines such as noise and vibrations [21,23,26,27,28,29,30,31,32,33,34], effects of environmental parameters on the performance of work [35], accidents, exposure to risks and safety issues [36,37,38,39,40,41,42] and last, but not least, the working postures [21,43,44,45,46].
From these topics, postural analysis has gained a lot of interest in the forest operations research, particularly when carrying on ergonomic evaluations of manual and motor-manual operations. The interest of science and practice on such evaluations has been driven mainly by the findings of studies repeatedly showing concerning problems related to the health of forest workers in terms of developing musculoskeletal disorders [3,43,47,48]. At least in forest operations, the interaction between the workers and their job tasks, work procedures, work behavior, the used tools and the features of the operational environment is often complex, being characterized by a wide variability in the postures taken during the work. For instance, the postural variability among given individuals may be high for the same work task, tool used, and operating environment solely as an effect of their anthropometric features. In addition, the goal of maintaining neutral postures during the work is often impaired by the characteristics of the work tasks and of the operational environment, which may force the workers to take uncomfortable work postures [20,43,49].
There are dozens of postural evaluation methods documented in the scientific literature [50], and automated techniques were developed and tested for some of them with the aim to ease the analytical effort [51,52,53]. In particular, OWAS (the Ovako Working Posture Analysis System) has been often used in forest operations, mainly due to its simplicity, easy understanding of its concepts, cost affordability, and the capability to evaluate the whole body, including the level of exerted force [44,49]. The method is based on work sampling which, as a strategy, can be implemented systematically or randomly [54]. Irrespective of the data collection strategy, the method builds upon a sample of work instances, for which it uses a set of codes to document the postures of the main body segments (back, arms, and legs) as well as the level of force exertion. By doing so, each instance is described by a four-digit code which can be complemented by a string to describe the work task to which it belongs [55]. The four-digit code is then used to map a given instance into one of four possible action categories which were designed to characterize the deviation from a neutral posture and the urgency of ergonomic actions to be taken [49,55,56]. Since the samples may contain a considerable number of instances, their frequencies on action categories have been used to compute a postural risk index (PRI), in the form of the sum of products between the relative frequencies on action categories and their corresponding action category numbers, multiplied by 100 [57] as cited by [58,59]. As such, the PRI may take values in between 100 and 400, and it has been used if forest operations research to evaluate the necessity of improvement or to compare between different operational alternatives and jobs in terms of urgency of actions needed to be taken.
However, the method holds rather limited capabilities to evaluate the similarity of work in terms of postures taken, therefore to compare more accurately between given work scenarios. This is because, by its design, different four-digit codes characterizing the whole-body postures are leading to the same action category. In addition, some comparison designs may need to use highly unbalanced samples, making it difficult if not impossible to compare two work scenarios based on the absolute frequencies of each of their component four-digit instances. While using the relative frequencies as a basis for comparison could be one strategy in such cases, the approach will still need to use some sort of nonparametric tests [44,45], which could be less powerful [60], and the occurrence of some instances only in a given dataset could be also problematic from an analytical point of view.
The technological progress is now understood as one of the main drivers of forest operations improvement and the changes brought by it and by the societal development need to be addressed by critical and impartial scientific studies aiming at ergonomics and safety improvement [11]. The potential benefits or drawbacks of such changes are often proven by comparing a newly designed alternative, developed technology, or method to a reference one, which is that typically accepted and used in practice at the time of evaluation. From this point of view, and given the progress in automation of the observational postural analysis methods, more accurate metrics which are able to compare and to evaluate the diversity or similarity of the working postures may be needed for the science and practice. Their application may be useful to check the effects of anthropometric features on postural variability for two individuals performing the same task, with the same tool and in the same operational environment, to check the effects of training and awareness-raising programs on postural improvement, to compare among different jobs and work scenarios and to evaluate and prove the benefits brought by new technologies, equipment, or working methods.
Based on the abovementioned, the aim of this study was to introduce and test the potential of using similarity metrics in the ergonomic postural assessment, as the means for an improved comparison and characterization of the work similarity. While the study builds upon the use of the OWAS method as a reference tool for postural analysis (datasets coded according to the method were available for this study), the concepts described could be extended to other postural assessment methods which are mapping their outcomes based on the use of instances codded according to the postures found for different body parts.
2. Materials and Methods
2.1. Theory
2.1.1. The Ovako Working Posture Analysis System (OWAS)
The Ovako Working Posture Analysis System (OWAS) is an observational postural assessment method developed on the basis of three main principles such as the simplicity in learning and use, unambiguity in the interpretation of results, and possibility of formulating improvements in terms of postures by considering factors such as the health and safety, with the main emphasis on the discomfort caused by working postures [56]; it was developed and tested initially in the steel industry of Finland with the aim of correcting poor postures and it was based on work sampling as a method to collect the data needed in evaluations [56]. Right at its initial tests, their developers acknowledged that two different workers may perform the same work task by assuming different working postures [56], then some case studies on how the postural analysis could be implemented by the method were published by [61], showing the potential of comparing the postures of individual body parts by their relative frequencies observed in the collected data. Following its development, the method has been widely used in many industries around the world [62], including forestry and forest operations.
The method implements an evaluation of three main body parts—namely the back, arms, and legs [56]—coupled with an evaluation of force exertion [50] and, for inter-task comparison purposes, it can be complemented by the use of a string code to describe the task to which a given statistical observation belongs to [55]. Procedurally, the data needed for evaluation can be collected by direct observation, photographing or video recording, with the latter providing the important advance of holding the real sequence of the observed work [63], which enables the users to run and adjust the sampling procedure and its rates in the office phase of the study [20,21,46].
Each statistical observation is collected from a continuum and may be seen as a work instance characterized by a single (fixed) posture of the back, arms, and legs and by a given level of force exertion [49]; each instance is typically documented by a four-digit numeric code which aggregates the digits attributed to the three body parts and to the level of force exertion. For coding procedures, the method uses a set of four digits characterizing the possible postures of the back (1 to 4), a set of three digits characterizing the possible postures of the arms (1 to 3), a set of seven digits characterizing the possible postures of the legs (1 to 7), and a set of three digits characterizing the level of force exertion (1 to 3) [49,55,56]. Accordingly, the maximal set of combinations of the four evaluated features leads to a possible number of 252 instances. Conceptually, a matrix-like approach [43,49], having as entries the codes attributed to the back, arms, legs and to the level of force exertion, is being used to map each instance into an action category. The action categories (ACs) were originally developed so as to indicate the deviance from neutral body postures and to indicate the urgency of ergonomic improvement actions [54,56]. Currently, there are four ACs and each instance may fall in only one of them. Of the 252 possible instances, 72 are mapped in the first action category (AC1), 53 in the second action category (AC2), 55 in the third action category (AC3) and 72 in the fourth action category (AC4). In addition to the original work of the method’s developers, some visual examples on how the codding procedure works and how the action categories are commonly interpreted, are given, for instance, in [43,49,55].
Originally, the method was supposed to be implemented by work sampling at variable or constant intervals [56], an approach that was maintained in some of the recent studies (see [64] for a list). Nevertheless, systematic sampling at finer rates may be resource intensive in the analytical part of a study, a reason for which some have opted for random sampling approaches [44,45,46], which have been facilitated by the developments in media-related technology; in addition, a recent study has suggested that the random sampling could be feasible when accounting for a minimum number of observations [54]. Irrespective of the sampling strategy and of the number of observations taken into study, each instance undergoes the same codding procedure, being distributed to a given action category. The approach results in an absolute frequency on action categories which, in turn, is difficult to interpret on whether a given action should be taken. To overcome this, a postural risk index (PRI) was introduced and used [57] as cited by [58,59] so as to weight the relative frequencies of instances mapped over the four action categories and to produce a metric typically used to make a decision on improvement. The PRI (Equation (1)) may take values in between (exactly) 100 to (exactly) 400, and those located between the minimum and maximum ones are typically used to evaluate the closeness of the dataset to a given (final) action category. For instance, values of exactly 200 indicate that the sampled data falls in the action category 2 (AC2) while values of 350 need to be carefully interpreted for their general belonging to either AC3 or AC4. Also, the relative frequencies of action categories can be used to make comparisons based on nonparametric tests [44,45].
where PRI is the postural risk index and f1, f2, f3, and f4 are the relative frequencies of scores in action categories 1, 2, 3, and 4, respectively, calculated as the shares of the total observations attributed to a given action category.
PRI = ((f1 × 1) + (f2 × 2) + (f3 × 3) + (f4 × 4)) × 100
2.1.2. Similarity Metrics and Their Potential in Comparison of Working Postures
Similarity metrics, also described as indexes or coefficients, are measures of resemblance typically outputting a value close or equal to 1 when the compared entities are identical, and 0 when they have no attributes in common; accordingly, the dissimilarity metrics are defined as the complements of similarity metrics [65,66]. Such metrics have been often used in ecology and its related sciences such as plant sociology [67], and they are coming in a rather high number, being used for various types of applications. A thorough description of such metrics and some examples on their applications and limitations are given, for instance in [65,66]. Although by their mathematical foundation similarity metrics could be rather associated to numerical classification and comparison, the rest of the paper will treat them similarly to an application in plant sociology. This approach was chosen for an easier understanding of the concepts, applications and output interpretation of such metrics in postural analysis by analogy to the living world.
Accordingly, each of the 252 possible instances that OWAS method may output could be seen, conventionally, as species named by their four-digit code, therefore, the total possible number of species will be m = 252. Typically, the similarity is evaluated having as an input two samples, namely A and B. Each of the two samples (A and B) may hold a given number of species, namely a and b, which may take a value between 1 and 252. It is common for some work sequences to output only a limited number of species (instances) as it is common for them to output a given type of absolute frequency for those species. In addition, a number of the species, namely c (common species), could be found in both A and B, respectively. Therefore, the number of common species as well as the number of individuals belonging to a given species become important in comparison applications.
It is a fact that all the studies implementing the OWAS method rely on data codded on species and account for the absolute frequency of individuals at the species level since such data is used as an input for classification on action categories. Typical differences between the studies and samples may be those resting in the number of observations used as inputs for analysis as well as in the sampling procedure adopted to collect the data. From this point of view, samples having the same number of observations would require a similarity metric able to account for the number of individuals of each species, while samples exhibiting contrasting differences between the number of observations would have to use a similarity metric able to balance the effect of such differences.
Two similarity metrics were selected for application in this study, namely the Sørensen’s quotient of similarity (hereafter QS) and the Canberra metric (hereafter CM). The Sørensen’s quotient of similarity [65,66,67] is defined according to Equation (2) while the Canberra metric is defined, e.g., [65,66] according to Equation (3).
where QS is the Sørensen’s quotient of similarity, a is the number of species identified in sample A, b is the number of species identified in sample B and c is the number of species common to (identified in both) samples A and B.
where CM is the Canberra metric, m is the number of species excluding those absent from both samples, nAi is the number of individuals of the i-th species present (identified) in the sample A and nBi is the number of individuals of i-th species present (identified) in the sample B.
The Sørensen’s quotient of similarity assumes that the two samples or populations (A and B) are different units, whereas each species from sample A has one chance to coincide with the same species in sample B and vice versa, therefore the denominator a + b stands for the sum of chances of the individual species to coincide in the two samples separately; the metric itself stands for the number of actual coincidences divided by the theoretical number of coincidence possibilities of the two samples [67].
The Canberra metric, on the other hand, takes into account the number of individuals found to belong to each species of the two samples. It holds some important properties [65] such as being the average of a series of fractions standing for inter-entity agreement of each attribute, therefore in has a built-in attribute standardization, large-score attributes contribute to only one of the summed fractions, therefore they do not dominate the metric, double-zero scores (r) are commonly ignored (excluded), it takes into calculation the total possible number of attributes (n) following the exclusion of those absent in both samples, therefore m = n − r, and zero scores may be replaced by small values in the case of single zero matches to ensure a greater contribution to dissimilarity (0.2 in this study according to [66]). The metric was developed in its dissimilarity form, therefore its complement for similarity is 1 − CM and the numerator from Equation (3) is always restricted to positive values.
2.2. Case Studies
2.2.1. Case Study 1: Simulation Based on the Possible Outputs of the OWAS Method and the Use of the Sørensen’s Quotient of Similarity
Some studies implementing the OWAS method may have been reported only the instances (species) found in the samples, lacking therefore the frequency data. In such cases, accounting for the number of individuals is impossible to make, therefore an option for similarity assessment would be the use of the Sørensen’s quotient of similarity (QS).
The way it works on such data has been tested in this study by making an ordered list of all the possible species outputted by the OWAS method. Their four-digit codes were aggregated in a single numerical code which was then used to numerically sort them in an ascending order according to the action category to which they are typically mapped by the method. The dataset built in this way was used as a reference for the first sample (A) which remained unchanged during the simulations. A copy of A was made afterwards, and a data exclusion procedure was implemented from the top to bottom (TTB) and from the bottom to top (BTT) of the list, accounting for an exclusion step of ca. 5% of the data (252 species), implemented from 0 (no differences between A and B) to 95% (common species accounting for only 5% of the data). A number of 36 new datasets were generated this way to account for potential differences in the sample B, of which 18 were built for the TTB approach and 18 for the BTT approach. Then, Equation (2) was used to compute the Sørensen’s quotient of similarity for each of the compared datasets including that having no differences.
In addition, the postural risk index (PRI) was calculated for each sample taken into comparison by the formula shown in Equation (1). In the case of the sample A, the PRI has been kept at the same value for each comparison iteration since this sample was used as a reference, and for the sample B its values were updated based on the species frequencies on action categories for each comparison iteration and step of data exclusion. For comparison purposes, the results were aggregated and plotted graphically, by conventionally downsizing the PRI values by a factor of 1000.
2.2.2. Case Study 2: Comparison of Motor-Manual and Manual Job Tasks by the Use of Sørensen’s Quotient of Similarity and of the Canberra Metric
Three fully documented datasets were available for comparison of different motor-manual and manual work tasks (Table 1). These were documented by systematic sampling done at an interval of one second, and were used in the studies of [20,21], covering motor-manual felling and processing of poplar trees (TFP), as well as motor-manual willow felling (WF) and assistance to motor-manual willow felling (AWF); for the purpose of this study the datasets were reorganized so as to exclude the work task-based codes and other irrelevant data.

Table 1.
Characteristics of the datasets used in the second case study.
The terrain was flat in all the locations used to collect the data, therefore the main differences between these three operations from a postural point of view could be those related to the specific tasks, tools and procedures used, as well as those related to the characteristics of the work objects (very large vs. very small trees), work environment (inter-tree distance) and workers’ anthropometric features. As shown in Table 1, the datasets covered different number of observations, and they were used to compute the postural risk indexes of each sample, then to compute the two metrics of similarity using the Equations (2) and (3) for each of the compared samples. Instead of Canberra metric its complement (1 − CM) was used, and the comparisons were done by data tabulation.
2.2.3. Case Study 3: Comparison among 14 Workers Performing Manual Cultivation Operations by the Use of Sørensen’s Quotient of Similarity and Canberra Metric
In this last case, the data used in the paper of [45] was refined and adapted to the comparison requirements of this study. It covered a number of 14 workers carrying on the same operation (manual cultivation operations in poplar stands), therefore a relative control was maintained over the work object (rows of poplar trees), tool used (hoe) and terrain slope (flat). Accordingly, the potential differences in terms of working postures could be those related to the anthropometric features and to the work behavior as specific to different subjects taken into study. Since the observations were done for several days and locations, for simplicity, each of the available dataset was considered to be a sample (17 samples in total).
The number of observations varied quite widely in this last set of samples, from 258 to 1409 (Table 2). However, the dominance in terms of number of observations per instances found in all the datasets was rather similar (data not shown herein). The instances were extracted from media files as images, by a randomized approach [45]. Given the data shown in Table 1 and Table 2, the last two case studies reflect also the differences that may occur between samples in terms of size.
Table 2.
Characteristics of the datasets used in the third case study.
Postural risk indexes were calculated for each sample according to Equation (1). Then, Equations (2) and (3) were used to calculate the QS and CM metrics for each of the compared sample. The CM metric was used in its complement form (1 − CM). Each sample was compared against each other, resulting in a number of 136 comparisons. To enhance the comparison between the postural risk indexes and the similarity metrics at the level of each compared pair, Equation (4) was used to compute the absolute positive differences between the postural risk indexes of each of the compared samples.
where ΔPRI is the absolute positive difference of the postural risk indexes of two compared samples (A and B), PRIA is the postural risk index computed for sample A, PRIB is the postural risk index computed for sample B, 100 is a downscaling factor used for graphical comparison purposes.
ΔPRI = (PRIA − PRIB)/100
Comparison results were numerically ordered in descending order using as an input the results of Equation (4), then they were plotted, analyzed and compared graphically. As the number of comparisons was quite large, the first and last 10 sets were selected from the data and plotted against the labels describing the compared samples. The data supporting this last case study is included in Table A1, Table A2, Table A3 and Table A4 in Appendix A, while supplementary statistics are given in Figure A1.
3. Results
3.1. Case Study 1
Figure 1 shows the aggregated results of the first case study. The stepwise procedure used to exclude the data from sample B from top to bottom (TTB) and from the bottom to the top (BTT) of the list, which ordered the species numerically according to their belonging to action categories, has resulted in postural risk indexes which increased from 250 (reference, sample A) to 400 in the first case and which decreased from 250 (reference, sample A) to 100 in the second case.
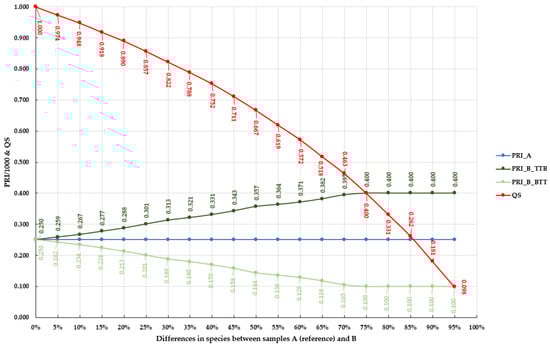
Figure 1.
Aggregated results of the first case study. Legend: PRI_A—postural risk index computed for the sample A and used as a reference (PRI_A = 250); PRI_B_TTB—postural risk index for the sample B computed following the stepwise top-to-bottom data exclusion approach; PRI_B_BTT—postural risk index for the sample B computed following the stepwise bottom-to-top data exclusion approach; QS—Sørensen’s quotient of similarity.
The QS metric has presented a decreasing trend from the comparison of the reference sample (A) against its non-changed counterpart (B), for which the similarity metric has outputted its maximum value (1.000, indicating a perfect similarity) to the rightmost part of the Figure 1, where the maximum differences in terms postural risk indexes occurred.
In the first case, the postural risk indexes values were the same, given the use of the same datasets to compute them for samples A and B. Therefore, the two samples were both, similar and have led to the same postural risk index. By excluding the data so as to keep the common species (c) in both samples at less than 30% (rightmost part of the Figure 1), the postural risk indexes have reached their maximum (400) and minimum (100) values for the TTB and BTT approaches, which were kept constant in the x-axis interval from between 75% and 95%. However, they also shown different degrees of similarities among the species included in the samples. While for a share of only 5% of common species the two samples outputted a high dissimilarity (close to 0.1—or 10% for the value of 95% on the x-axis), for the same postural risk indexes, the similarity between the two samples has reached to 0.4 (40%, for the value of 75% on the x-axis).
PRI values of 357, 364, 371, 382, and 395 (located in between 50% and 70% as differences shown on the x-axis, PRI_B_TTB), or at least the last three of them, would advise one to interpret them as being close to the action category 4. Compared to the reference sample (A) their values were found to increase. However, the comparison of the two samples have outputted contrasting values of the similarity (QS), with differences reaching as much as 0.204 (20% if the metric would be given in percentage). The same holds true if one compares the data shown for BTT approach in the same range.
3.2. Case Study 2
Table 3 is showing the comparison results for the case study 2. In terms of postural risk indexes, the TFP operation stands apart of the WF and AWF operations, with a difference of PRI accounting for ca. 77 points. PRI values calculated for the WF and AWF operations were almost the same (difference of ca. 1 point), suggesting that the operations under question would fit in action category 2 from a postural analysis point of view. In the case of TFP, the PRI value would suggest a closeness to the action category 3.
Table 3.
Results of comparison for the case study 2.
However, the two willow harvesting operations (WF and AWF) were rather dissimilar, both in the number of species and frequency of individuals. In terms of species, their comparison outputted a value of QS = 0.519 (52%) and in terms of individuals the similarity outputted a value of 1 − CM = 0.317 (32%). In addition, TFP was characterized by a rather the same similarity in terms of number of species and individuals, respectively, when compared against WF and AWF (QS of ca 43% and 39%, respectively, and 1 − CM of ca. 16% and 15%, respectively). From these comparison results, it is obvious that PRI is helpful for choosing the right action category but not in characterizing the similarity in terms of postures taken in different operations.
3.3. Case Study 3
Figure 2 is showing the comparison results in terms of QS, 1 − CM and ΔPRI for all the datasets taken into study (136 compared pairs). The difference between the postural risk indexes (ΔPRI) was highly variable and it ranged from 64.8 points, which may stand for a very high difference, to 0.7 points, which is, indeed, a very small difference. However, the QS metric varied between ca. 0.40 to ca. 0.93 and the 1 − CM metric varied between ca. 0.40 and ca. 0.95, with these lower and upper variation limits being non-coincident for the two metrics for a given set of samples under comparison. Although the values of the similarity metrics were variable, by calculation, they were mapped in a certain range (Figure 2, Figure A1), which was from ca. 0.40 to ca. 0.95, therefore, the compared samples were found to be medium to highly similar. Nevertheless, the differences in terms of postural risk indexes were non-associated with the variation of similarity metrics. As shown in Figure 2 (leftmost side), for some of the compared pairs, there were high differences in terms of postural risk indexes, and still, the compared pairs were rather similar (values of over 0.55 for QS and 1 − CM), a trend which was kept also for the rightmost part of the Figure 2, were it seems that there was an agreement between the differences in terms of postural risk indexes and the values of similarity metrics. For instance, in the case of the last two datapoints, for which the ΔPRI was very small, the values of QS and 1 − CM were close to those shown on the left part of the figure, where the values of ΔPRI were the highest.
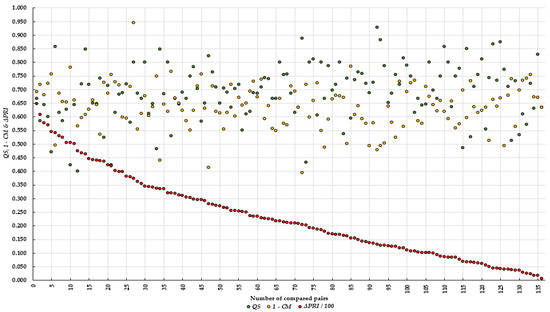
Figure 2.
A pairwise comparison between the values of QS, 1 − CM and ΔPRI for the third case study following their numerical ordering based on the values of ΔPRI. Legend: QS, 1 − CM and ΔPRI are defined in Section 2.2.3.
A better interpretation of the results can be made based on the data plotted in Figure 3, which shows the usefulness of using the similarity metrics to compare between two alternatives, and which plots only the data for the first and last 10 compared datasets, as numerically ordered by the values of ΔPRI. The right part of the figure shows the datasets for which the ΔPRI were the lowest, while the left part of the figure shows the datasets for which the ΔPRI were the highest. The lowest values of the QS metric were above 0.42 irrespective of the case while the highest ones reached at 0.86. A similar trend was found for the values of 1 − CM metric, which ranged between ca. 0.5 and ca. 0.78. There were comparison events in which the values of QS and 1 − CM were quite contrasting (for instance, W3–W16 and W14–W17, respectively, as well as other examples shown on the right part of the figure, where the differences between the postural risk indexes were minor). In these cases, however, the differences in terms of PRIs were similar if one compares the values for the two pairs taken as an example. Nevertheless, the differences in terms of QS and 1 − CM metrics show dissimilarities among the compared examples. For instance, in W3–W16, the number of common species could have been less as compared to W14–W17, but the number of common individuals per species could have been higher. In contrast, W14–W17, had a higher number of common species but a lower number of common individuals for the same species.
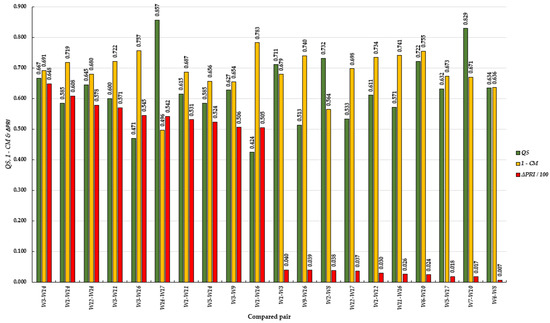
Figure 3.
Results of comparison between the first and last 10 pairs ordered by the value of ΔPRI. Legend: QS, 1 − CM and ΔPRI are defined in Section 2.2.3.
4. Discussion
Although the use of similarity metrics is common to other scientific disciplines, this study introduces them to the use in comparisons of postural data with the aim of providing a way for quantifying the similarity of work tasks. Some metrics for evaluating the job diversity were proposed by [68] but, in our knowledge, no attempts were made to use similarity metrics in the comparison of working postures. Accordingly, it was intended to evaluate their use by a comparison to the commonly used postural risk indexes so as to describe the differences that may occur as using both classes of metrics.
The postural risk index is being successfully used to map a given work sequence (task, job, operation) into a final action category, based on the dominance of the analyzed instances (species) within the four action categories of the OWAS method. Assuming the analysis of two work samples, the postural risk index metric will tell much about the actions to be taken but very few about how similar or dissimilar the two work samples are, making it difficult to understand more clearly the differences in terms of working postures. This holds true irrespective of the resolution of data analysis, as shown in Figure 1, where the QS metric was used to check the differences in similarity compared to the values returned by the postural risk indexes, and in Table 3 and Figure 2 and Figure 3, where both metrics (QS and 1 − CM) were used, showing contrasting results compared to those related to the postural risk indexes or their difference.
In this paper, the usefulness of similarity metrics was described by the three case studies. Their use may depend on the data availability and its type, and may help in better understanding the changes brought by the features characterizing the humans, technology used and operating environment in the postural diversity, providing a useful tool for such pairwise evaluations. For instance, the first case study resembles an application of similarity metrics under the constraints of having documented only the types of postures (species) without any background frequency data. In such cases, the use of Sørensen’s quotient of similarity to compare among the existing data makes lot of sense, enabling one to compare between two alternatives even in the absence of the frequency data. The second and third case studies, on the other hand, are proving how comparisons can be made when absolute frequency data is available for the individuals (number of observations) belonging to given types of postures. Accordingly, there are many potential applications in which the use of similarity metrics could add value. In relation to the human-related features, one could use them to check the postural differences brought by anthropometric diversity and working behavior when assuming the same conditions related to the used technology, equipment, and operating environment. One good example of such an application is the third case study described in this paper which has shown the differences between several workers carrying on the same job, with the same tools and in the same operating environment. Even though one would have been expected to have similar working postures, the reality was that they varied quite widely as an effect of the human-related factors. Similar practical applications could be those aiming to emphasize the effect of technology progress (e.g., new tools or new work methods) on the working postures as well as those aiming to evaluate how changing operating environments could affect the diversity of working postures. In addition, the usefulness of similarity metrics in postural analysis may span over other applications such as comparing or testing the intra- and inter-reliability of the methods used in postural assessment, assuming that they share a similar codding procedure. Such reliability-checking studies were developed so far, e.g., [69,70], although they have used other evaluation methods.
Although the focus of this study was on forest operations, the OWAS method was found to be trustworthy and used in most of the industrial sectors [62], therefore the procedures described herein are transferable to any industry. Furthermore, they would enable the comparison between the job tasks as specific to different industrial sectors so as to be able to critically and impartially evaluate the associated difficulties and risks, with an obvious outcome of either designing improvements or finding appropriate ways of compensation. A typical example is the second case study of this paper which proves how the similarity metrics could be used to compare three different jobs coming from two industries (traditional and short-rotation forestry).
Eventually, the science will come up with a ‘best-fit’ postural profile for the daily activity, therefore the deviance from it will need measurement and metrics for comparisons in the search for improvement; the use of similarity metrics for such endeavors, as described in this study, has a lot of potential, being supported by the advancement in automation and machine learning techniques applied to postural analysis [51,52,53], which by improvement will be able to collect and process high amounts of data, eventually resembling at very fine rates the continuum of a work sequence [49]. As such, they will remove the current barriers of limited data samples and will be able to systematically collect it for large time domains. By the use of temporal labels or sequenced IDs added to the codes of given instances to resemble their occurrence in a work sequence, comparisons of the work similarity in the time domain would be enabled by the use of similarity metrics since the species created in this way will have to share the time IDs in addition to the codes characterizing the body posture. Similarly, the addition of codes to describe work elements or tasks would enable large-scale intra- and inter-task comparison in the time domain.
This study has evaluated only two metrics of similarity which is one of the study’s limitations. Indeed, there are many such metrics [65,66] from which one may choose, and the authors acknowledge the potential of other metrics in comparing working postures. However, the choice of the QS and 1 − CM metrics was based on their main mathematical foundations of properly dealing with data at the species and individual level under the assumption of a fixed set of species. Nevertheless, caution should be taken in their use, and several other metrics should be evaluated based on other findings on their properties [71].
5. Conclusions
Based on the three case studies of this paper, the main conclusion is that the two classes of metrics (postural risk indexes and similarity indexes) have their own, well-framed utility in postural assessment by the use of the OWAS method. Postural risk indexes are helpful in evaluating the work and mapping the ergonomic actions to be taken while the use of similarity metrics will help in better comparing two work alternatives, therefore in reaching a deeper understanding on changes brought by the human-, technology-, and operating environment-related factors. Both classes of metrics could be successfully integrated in big data analytics under the assumption that machine learning techniques would become readily available and reliable, which is expected in the near future. However, more research is needed to check the usefulness and drawbacks of other similarity metrics, as more research is needed to check the drawbacks of the similarity metrics used in this study.
Author Contributions
Conceptualization, S.A.B.; Methodology, S.A.B., E.I. and M.V.M.; Validation, S.A.B., E.I. and M.V.M.; Formal analysis, S.A.B., E.I. and M.V.M.; Data curation, M.V.M.; Writing—original draft preparation, S.A.B., E.I. and M.V.M.; Writing—review and editing, S.A.B., E.I. and M.V.M.; Visualization, S.A.B., E.I. and M.V.M. All authors have read and agreed to the published version of the manuscript.
Funding
This work was supported by a grant of the Romanian Ministry of Education and Research, CNCS-UEFISCDI, project number PN-III-P4-ID-PCE-2020-0401, within PNCDI III. An objective of the Hypercube 4.0 project aims at developing metrics for ergonomic postural evaluation of wood measurement activities by traditional methods and sensor-based platforms.
Data Availability Statement
Data supporting this study may be provided on request to the first author of the study.
Acknowledgments
The authors would like to thank to. Marius Cheţa, Nicolae Talagai, and Tiberiu Marogel-Popa for providing the raw data needed for the last two case studies. The authors acknowledge the logistical support provided to support this study by the Department of Forest Engineering, Forest Management Planning and Terrestrial Measurements, Faculty of Silviculture and Forest Engineering, Transilvania University of Braşov.
Conflicts of Interest
The authors declare no conflict of interest.
Appendix A
Table A1.
Data supporting the case study 3.
Table A1.
Data supporting the case study 3.
| Samples Compared | a | b | c | m | QS | 1 − CM | ΔPRI |
|---|---|---|---|---|---|---|---|
| W1–W2 | 22 | 15 | 12 | 25 | 0.649 | 0.637 | 0.341 |
| W1–W3 | 22 | 23 | 16 | 29 | 0.711 | 0.679 | 0.040 |
| W1–W4 | 22 | 15 | 13 | 24 | 0.703 | 0.712 | 0.296 |
| W1–W5 | 22 | 22 | 14 | 30 | 0.636 | 0.659 | 0.085 |
| W1–W6 | 22 | 13 | 12 | 23 | 0.686 | 0.713 | 0.210 |
| W1–W7 | 22 | 18 | 16 | 24 | 0.800 | 0.677 | 0.168 |
| W1–W8 | 22 | 26 | 18 | 30 | 0.750 | 0.552 | 0.303 |
| W1–W9 | 22 | 28 | 18 | 32 | 0.720 | 0.596 | 0.466 |
| W1–W10 | 22 | 23 | 18 | 27 | 0.800 | 0.549 | 0.185 |
| W1–W11 | 22 | 17 | 12 | 27 | 0.615 | 0.687 | 0.531 |
| W1–W12 | 22 | 14 | 11 | 25 | 0.611 | 0.734 | 0.030 |
| W1–W13 | 22 | 17 | 14 | 25 | 0.718 | 0.672 | 0.253 |
| W1–W14 | 22 | 19 | 12 | 29 | 0.585 | 0.719 | 0.608 |
| W1–W15 | 22 | 17 | 12 | 27 | 0.615 | 0.729 | 0.403 |
| W1–W16 | 22 | 11 | 7 | 26 | 0.424 | 0.783 | 0.505 |
| W1–W17 | 22 | 16 | 10 | 28 | 0.526 | 0.732 | 0.067 |
| W2–W3 | 15 | 23 | 11 | 27 | 0.579 | 0.711 | 0.380 |
| W2–W4 | 15 | 15 | 13 | 17 | 0.867 | 0.663 | 0.045 |
| W2–W5 | 15 | 22 | 13 | 24 | 0.703 | 0.603 | 0.256 |
| W2–W6 | 15 | 13 | 13 | 15 | 0.929 | 0.478 | 0.131 |
| W2–W7 | 15 | 18 | 13 | 20 | 0.788 | 0.591 | 0.173 |
| W2–W8 | 15 | 26 | 15 | 26 | 0.732 | 0.564 | 0.038 |
Table A2.
Data supporting the case study 3—continued.
Table A2.
Data supporting the case study 3—continued.
| Samples Compared | a | b | c | m | QS | 1 − CM | ΔPRI |
|---|---|---|---|---|---|---|---|
| W2–W9 | 15 | 28 | 14 | 29 | 0.651 | 0.639 | 0.126 |
| W2–W10 | 15 | 23 | 14 | 24 | 0.737 | 0.608 | 0.155 |
| W2–W11 | 15 | 17 | 13 | 19 | 0.813 | 0.659 | 0.190 |
| W2–W12 | 15 | 14 | 10 | 19 | 0.690 | 0.623 | 0.311 |
| W2–W13 | 15 | 17 | 12 | 20 | 0.750 | 0.659 | 0.088 |
| W2–W14 | 15 | 19 | 12 | 22 | 0.706 | 0.556 | 0.267 |
| W2–W15 | 15 | 17 | 13 | 19 | 0.813 | 0.624 | 0.062 |
| W2–W16 | 15 | 11 | 7 | 19 | 0.538 | 0.672 | 0.164 |
| W2–W17 | 15 | 16 | 11 | 20 | 0.710 | 0.619 | 0.274 |
| W3–W4 | 23 | 15 | 13 | 25 | 0.684 | 0.646 | 0.336 |
| W3–W5 | 23 | 22 | 17 | 28 | 0.756 | 0.525 | 0.124 |
| W3–W6 | 23 | 13 | 11 | 25 | 0.611 | 0.650 | 0.249 |
| W3–W7 | 23 | 18 | 13 | 28 | 0.634 | 0.635 | 0.208 |
| W3–W8 | 23 | 26 | 15 | 34 | 0.612 | 0.604 | 0.343 |
| W3–W9 | 23 | 28 | 16 | 35 | 0.627 | 0.654 | 0.506 |
| W3–W10 | 23 | 23 | 17 | 29 | 0.739 | 0.641 | 0.225 |
| W3–W11 | 23 | 17 | 12 | 28 | 0.600 | 0.722 | 0.571 |
| W3–W12 | 23 | 14 | 9 | 28 | 0.486 | 0.699 | 0.069 |
| W3–W13 | 23 | 17 | 13 | 27 | 0.650 | 0.632 | 0.293 |
| W3–W14 | 23 | 19 | 14 | 28 | 0.667 | 0.691 | 0.648 |
| W3–W15 | 23 | 17 | 13 | 27 | 0.650 | 0.661 | 0.443 |
| W3–W16 | 23 | 11 | 8 | 26 | 0.471 | 0.757 | 0.545 |
| W3–W17 | 23 | 16 | 12 | 27 | 0.615 | 0.733 | 0.106 |
| W4–W5 | 15 | 22 | 14 | 23 | 0.757 | 0.571 | 0.211 |
| W4–W6 | 15 | 13 | 12 | 16 | 0.857 | 0.619 | 0.086 |
| W4–W7 | 15 | 18 | 13 | 20 | 0.788 | 0.504 | 0.128 |
| W4–W8 | 15 | 26 | 13 | 28 | 0.634 | 0.636 | 0.007 |
| W4–W9 | 15 | 28 | 15 | 28 | 0.698 | 0.665 | 0.170 |
| W4–W10 | 15 | 23 | 15 | 23 | 0.789 | 0.692 | 0.111 |
| W4–W11 | 15 | 17 | 11 | 21 | 0.688 | 0.729 | 0.235 |
| W4–W12 | 15 | 14 | 10 | 19 | 0.690 | 0.615 | 0.266 |
| W4–W13 | 15 | 17 | 14 | 18 | 0.875 | 0.669 | 0.043 |
| W4–W14 | 15 | 19 | 11 | 23 | 0.647 | 0.651 | 0.312 |
| W4–W15 | 15 | 17 | 12 | 20 | 0.750 | 0.724 | 0.107 |
| W4–W16 | 15 | 11 | 8 | 18 | 0.615 | 0.694 | 0.209 |
| W4–W17 | 15 | 16 | 11 | 20 | 0.710 | 0.738 | 0.229 |
| W5–W6 | 22 | 13 | 12 | 23 | 0.686 | 0.580 | 0.125 |
| W5–W7 | 22 | 18 | 15 | 25 | 0.750 | 0.558 | 0.083 |
| W5–W8 | 22 | 26 | 16 | 32 | 0.667 | 0.549 | 0.218 |
| W5–W9 | 22 | 28 | 18 | 32 | 0.720 | 0.596 | 0.382 |
| W5–W10 | 22 | 23 | 18 | 27 | 0.800 | 0.675 | 0.101 |
| W5–W11 | 22 | 17 | 14 | 25 | 0.718 | 0.627 | 0.446 |
| W5–W12 | 22 | 14 | 10 | 26 | 0.556 | 0.636 | 0.055 |
| W5–W13 | 22 | 17 | 14 | 25 | 0.718 | 0.679 | 0.168 |
| W5–W14 | 22 | 19 | 12 | 29 | 0.585 | 0.656 | 0.524 |
| W5–W15 | 22 | 17 | 13 | 26 | 0.667 | 0.670 | 0.318 |
Table A3.
Data supporting the case study 3—continued.
Table A3.
Data supporting the case study 3—continued.
| Samples Compared | a | b | c | m | QS | 1 − CM | ΔPRI |
|---|---|---|---|---|---|---|---|
| W5–W16 | 22 | 11 | 7 | 26 | 0.424 | 0.755 | 0.420 |
| W5–W17 | 22 | 16 | 12 | 26 | 0.632 | 0.673 | 0.018 |
| W6–W7 | 13 | 18 | 12 | 19 | 0.774 | 0.494 | 0.041 |
| W6–W8 | 13 | 26 | 13 | 26 | 0.667 | 0.621 | 0.094 |
| W6–W9 | 13 | 28 | 13 | 28 | 0.634 | 0.719 | 0.257 |
| W6–W10 | 13 | 23 | 13 | 23 | 0.722 | 0.755 | 0.024 |
| W6–W11 | 13 | 17 | 12 | 18 | 0.800 | 0.619 | 0.321 |
| W6–W12 | 13 | 14 | 9 | 18 | 0.667 | 0.488 | 0.180 |
| W6–W13 | 13 | 17 | 11 | 19 | 0.733 | 0.639 | 0.043 |
| W6–W14 | 13 | 19 | 11 | 21 | 0.688 | 0.599 | 0.399 |
| W6–W15 | 13 | 17 | 12 | 18 | 0.800 | 0.598 | 0.193 |
| W6–W16 | 13 | 11 | 7 | 17 | 0.583 | 0.757 | 0.296 |
| W6–W17 | 13 | 16 | 11 | 18 | 0.759 | 0.593 | 0.143 |
| W7–W8 | 18 | 26 | 16 | 28 | 0.727 | 0.578 | 0.135 |
| W7–W9 | 18 | 28 | 18 | 28 | 0.783 | 0.624 | 0.298 |
| W7–W10 | 18 | 23 | 17 | 24 | 0.829 | 0.671 | 0.017 |
| W7–W11 | 18 | 17 | 12 | 23 | 0.686 | 0.555 | 0.363 |
| W7–W12 | 18 | 14 | 11 | 21 | 0.688 | 0.494 | 0.138 |
| W7–W13 | 18 | 17 | 14 | 21 | 0.800 | 0.594 | 0.085 |
| W7–W14 | 18 | 19 | 12 | 25 | 0.649 | 0.644 | 0.440 |
| W7–W15 | 18 | 17 | 12 | 23 | 0.686 | 0.673 | 0.235 |
| W7–W16 | 18 | 11 | 7 | 22 | 0.483 | 0.749 | 0.337 |
| W7–W17 | 18 | 16 | 11 | 23 | 0.647 | 0.711 | 0.101 |
| W8–W9 | 26 | 28 | 20 | 34 | 0.741 | 0.502 | 0.163 |
| W8–W10 | 26 | 23 | 20 | 29 | 0.816 | 0.565 | 0.118 |
| W8–W11 | 26 | 17 | 16 | 27 | 0.744 | 0.592 | 0.228 |
| W8–W12 | 26 | 14 | 13 | 27 | 0.650 | 0.615 | 0.273 |
| W8–W13 | 26 | 17 | 16 | 27 | 0.744 | 0.514 | 0.050 |
| W8–W14 | 26 | 19 | 15 | 30 | 0.667 | 0.585 | 0.305 |
| W8–W15 | 26 | 17 | 15 | 28 | 0.698 | 0.645 | 0.100 |
| W8–W16 | 26 | 11 | 8 | 29 | 0.432 | 0.719 | 0.202 |
| W8–W17 | 26 | 16 | 13 | 29 | 0.619 | 0.694 | 0.236 |
| W9–W10 | 28 | 23 | 21 | 30 | 0.824 | 0.415 | 0.281 |
| W9–W11 | 28 | 17 | 16 | 29 | 0.711 | 0.637 | 0.065 |
| W9–W12 | 28 | 14 | 11 | 31 | 0.524 | 0.727 | 0.437 |
| W9–W13 | 28 | 17 | 17 | 28 | 0.756 | 0.575 | 0.213 |
| W9–W14 | 28 | 19 | 17 | 30 | 0.723 | 0.576 | 0.142 |
| W9–W15 | 28 | 17 | 17 | 28 | 0.756 | 0.616 | 0.063 |
| W9–W16 | 28 | 11 | 10 | 29 | 0.513 | 0.740 | 0.039 |
| W9–W17 | 28 | 16 | 15 | 29 | 0.682 | 0.717 | 0.400 |
| W10–W11 | 23 | 17 | 16 | 24 | 0.800 | 0.676 | 0.346 |
| W10–W12 | 23 | 14 | 11 | 26 | 0.595 | 0.786 | 0.156 |
| W10–W13 | 23 | 17 | 17 | 23 | 0.850 | 0.598 | 0.068 |
| W10–W14 | 23 | 19 | 15 | 27 | 0.714 | 0.687 | 0.423 |
| W10–W15 | 23 | 17 | 16 | 24 | 0.800 | 0.667 | 0.218 |
| W10–W16 | 23 | 11 | 9 | 25 | 0.529 | 0.766 | 0.320 |
| W10–W17 | 23 | 16 | 14 | 25 | 0.718 | 0.731 | 0.119 |
Table A4.
Data supporting the case study 3—continued.
Table A4.
Data supporting the case study 3—continued.
| Samples Compared | a | b | c | m | QS | 1 − CM | ΔPRI |
|---|---|---|---|---|---|---|---|
| W11–W12 | 17 | 14 | 10 | 21 | 0.645 | 0.662 | 0.501 |
| W11–W13 | 17 | 17 | 13 | 21 | 0.765 | 0.714 | 0.278 |
| W11–W14 | 17 | 19 | 14 | 22 | 0.778 | 0.575 | 0.077 |
| W11–W15 | 17 | 17 | 15 | 19 | 0.882 | 0.494 | 0.128 |
| W11–W16 | 17 | 11 | 8 | 20 | 0.571 | 0.741 | 0.026 |
| W11–W17 | 17 | 16 | 14 | 19 | 0.848 | 0.608 | 0.464 |
| W12–W13 | 14 | 19 | 11 | 22 | 0.667 | 0.557 | 0.223 |
| W12–W14 | 14 | 17 | 10 | 21 | 0.645 | 0.680 | 0.578 |
| W12–W15 | 14 | 11 | 10 | 15 | 0.800 | 0.945 | 0.373 |
| W12–W16 | 14 | 16 | 6 | 24 | 0.400 | 0.566 | 0.475 |
| W12–W17 | 14 | 16 | 8 | 22 | 0.533 | 0.698 | 0.037 |
| W13–W14 | 17 | 19 | 12 | 24 | 0.667 | 0.613 | 0.355 |
| W13–W15 | 17 | 17 | 13 | 21 | 0.765 | 0.641 | 0.150 |
| W13–W16 | 17 | 12 | 8 | 21 | 0.552 | 0.642 | 0.252 |
| W13–W17 | 17 | 16 | 10 | 23 | 0.606 | 0.724 | 0.186 |
| W14–W15 | 19 | 17 | 16 | 20 | 0.889 | 0.396 | 0.205 |
| W14–W16 | 19 | 11 | 10 | 20 | 0.667 | 0.586 | 0.103 |
| W14–W17 | 19 | 16 | 15 | 20 | 0.857 | 0.496 | 0.542 |
| W15–W16 | 17 | 11 | 9 | 19 | 0.643 | 0.575 | 0.102 |
| W15–W17 | 17 | 16 | 14 | 19 | 0.848 | 0.440 | 0.336 |
| W16–W17 | 11 | 16 | 10 | 17 | 0.741 | 0.537 | 0.438 |
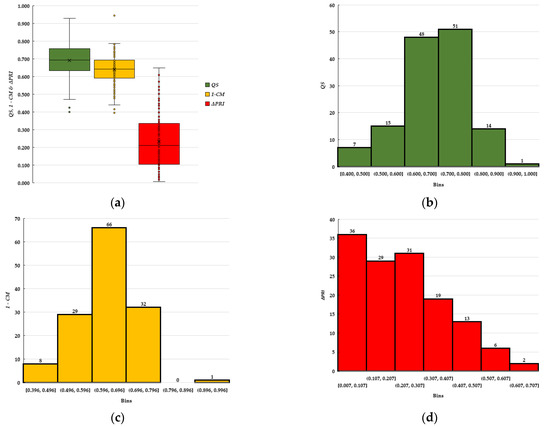
Figure A1.
Descriptive statistics supporting case study 3. Legend: (a)—descriptive statistics of QS, 1 − CM and ΔPRI; (b)—histogram of QS; (c)—histogram of 1 − CM; (d)—histogram of ΔPRI.
References
- Oprea, I. Tehnologia Exploatării Lemnului; Transilvania University Press: Brasov, Romania, 2008; p. 273. [Google Scholar]
- Bell, J. Changes in logging injury rates associated with use of feller-bunchers in West Virginia. J. Saf. Res. 2002, 33, 463–471. [Google Scholar] [CrossRef]
- Axelsson, S.A. The mechanization of logging operations in Sweden and its effect on occupational safety and health. J. For. Eng. 1998, 9, 25–31. [Google Scholar]
- Lindroos, O.; La Hera, P.; Häggström, C. Drivers of advances in mechanized timber harvesting—A selective review of technological innovation. Croat. J. For. Eng. 2017, 38, 243–258. [Google Scholar]
- Visser, R.; Obi, O.F. Automation and robotics in forest harvesting operations: Identifying near-term opportunities. Croat. J. For. Eng. 2021, 42, 13–24. [Google Scholar] [CrossRef]
- Borz, S.A.; Rommel, D.; Ziesak, M.; Vasiliauskas, G. Operational requirements and preferences towards forwarder technology. Bull. Transilv. Univ. Bras. Ser. II For. Wood Ind. Agric. Food Eng. 2019, 121, 1–12. [Google Scholar] [CrossRef]
- Borz, S.A.; Marcu, M.V.; Cataldo, M.F. Evaluation of an HSM 208F 14tone HVT-R2 forwarder prototype under conditions of steep-terrain low-access forests. Croat. J. For. Eng. 2021, 42, 185–200. [Google Scholar] [CrossRef]
- Moskalik, T.; Borz, S.A.; Dvorák, J.; Ferencik, M.; Glushkov, S.; Muiste, P.; Lazdinš, A.; Styranivsky, O. Timber harvesting methods in Eastern European countries: A review. Croat. J. For. Eng. 2017, 38, 231–241. [Google Scholar]
- Lundbäck, M.; Häggström, C.; Nordfjell, T. Worldwide trends in methods for harvesting and extracting industrial roundwood. Int. J. For. Eng. 2021. [Google Scholar] [CrossRef]
- Spinelli, R.; Magagnotti, N.; Visser, R.; O’Neal, B. A survey of skidder fleet of Central, Eastern and Southern Europe. Eur. J. For. Res. 2021. [Google Scholar] [CrossRef]
- Potočnik, I.; Poje, A. Forestry ergonomics and occupational safety in high ranking scientific journals from 2005–2016. Croat. J. For. Eng. 2017, 38, 291–310. [Google Scholar]
- Kirk, P.M.; Sullman, M.J.M. Heart rate strain in cable hauler choker setters in New Zealand logging operations. Appl. Ergon. 2001, 32, 389–398. [Google Scholar] [CrossRef]
- Toupin, D.; LeBel, L.; Dubeau, D.; Imbeau, D.; Bouthillier, L. Measuring the productivity and physical workload of brushcutters within the context of a production-based pay system. For. Policy Econ. 2007, 9, 1046–1055. [Google Scholar] [CrossRef]
- Bovenzi, M. A follow up study of vascular disorders in vibration-exposed forestry workers. Int. Arch. Occup. Environ. Health 2008, 81, 401–408. [Google Scholar] [CrossRef] [PubMed]
- Stampfer, K.; Leitner, T.; Visser, R. Efficiency and ergonomic benefits of using radio controlled chokers in cable yarding. Croat. J. For. Eng. 2010, 31, 1–9. [Google Scholar]
- Silayo, D.S.A.; Kiparu, S.S.; Mauya, E.W.; Shemwetta, D.T.K. Working conditions and productivity under private and public logging companies in Tanzania. Croat. J. For. Eng. 2010, 31, 65–74. [Google Scholar]
- Ottaviani, G.; Talbot, B.; Nitteberg, M.; Stampfer, K. Workload benefits of using synthetic rope strawline in cable yarder rigging in Norway. Croat. J. For. Eng. 2010, 32, 561–569. [Google Scholar]
- Magagnotti, N.; Spinelli, R. Replacing steel cable with synthetic rope to reduce operator workload during log winching operations. Small Scale For. 2012, 11, 223–236. [Google Scholar] [CrossRef]
- Spinelli, R.; Ottaviani Aalmo, G.; Magagnotti, N. The effect of a slack-pulling device in reducing operator physiological workload during log winching operations. Ergonomics 2014, 58, 781–790. [Google Scholar] [CrossRef]
- Cheţa, M.; Marcu, M.V.; Borz, S.A. Workload, exposure to noise and risk of musculoskeletal disorders: A case study of motor-manual tree felling and processing in poplar clear cuts. Forests 2018, 9, 300. [Google Scholar] [CrossRef] [Green Version]
- Borz, S.A.; Talagai, N.; Cheţa, M.; Chiriloiu, D.; Gavilanes Montoya, A.V.; Castillo Vizuete, D.D.; Marcu, M.V. Physical strain, exposure to noise and postural assessment in motor-manual felling of willow short rotation coppice: Results of a preliminary study. Croat. J. For. Eng. 2019, 40, 377–388. [Google Scholar] [CrossRef]
- Arman, Z.; Nikooy, M.; Tsioras, P.A.; Heidari, M.; Majnounian, B. Physiological workload evaluation by means of heart rate monitoring during motor-manual clearcutting operations. Int. J. For. Eng. 1998, 9, 25–31. [Google Scholar] [CrossRef]
- Zurita Vintimilla, M.C.; Castro Pérez, S.N.; Borz, S.A. Processing small-sized trees at landing by a double-grip machine: A case study on productivity, cardiovascular workload and exposure to noise. Forests 2021, 12, 213. [Google Scholar] [CrossRef]
- Spinelli, R.; Magagnotti, N.; Labelle, E.R. The effect of new silvicultural trends on the mental workload of harvester operators. Croat. J. For. Eng. 2020, 41, 177–190. [Google Scholar] [CrossRef] [Green Version]
- Szewczyk, G.; Spinelli, R.; Magagnotti, N.; Mitka, B.; Tylek, P.; Kulak, D.; Adamski, K. Perception of the harvester operator’s working environment in windthrow stands. Forests 2021, 12, 168. [Google Scholar] [CrossRef]
- Neitzel, R.; Yost, M. Task-based assessment of occupational vibration and noise exposure in forestry workers. AIHA J. 2002, 63, 617–627. [Google Scholar] [CrossRef]
- Tunay, M.; Melemez, K. Noise induced hearing loss of forest workers in Turkey. Pak. J. Biol. Sci. 2008, 1, 2144–2148. [Google Scholar] [CrossRef] [PubMed]
- Rottensteiner, C.; Tsioras, P.; Stampfer, K. Wood density impact on hand-arm vibration. Croat. J. For. Eng. 2012, 33, 303–312. [Google Scholar]
- Fonseca, A.; Aghazadeh, F.; de Hoop, C.; Ikuma, L.; Al-Qaisi, S. Effect of noise emitted by forestry equipment on workers’ hearing capacity. Int. J. Ind. Ergon. 2015, 46, 105–112. [Google Scholar] [CrossRef]
- Poje, A.; Spinelli, R.; Magagnotti, N.; Mihelic, M. Exposure to noise in wood chipping operations under the conditions of agro-forestry. Int. J. Ind. Ergon. 2015, 50, 151–157. [Google Scholar] [CrossRef]
- Poje, A.; Potočnik, I.; Danilovic, M.; Antonić, S. A case study of the impact of skidding distance on tractor operator exposure to noise. Balt For. 2016, 22, 357–364. [Google Scholar]
- Poje, A.; Spinelli, R.; Magagnotti, N.; Mihelic, M. The effect of feedstock, knife wear and work station on the exposure to noise and vibrations in wood chipping operations. Silva Fenn. 2018, 52, 7003. [Google Scholar] [CrossRef] [Green Version]
- Neri, F.; Laschi, A.; Foderi, C.; Fabiano, F.; Bertuzzi, L.; Marchi, E. Determining noise and vibration exposure in conifer cross-cutting operations by using Li-Ion batteries and electric chainsaws. Forests 2018, 9, 501. [Google Scholar] [CrossRef] [Green Version]
- Camargo, D.A.; Munis, R.A.; Simões, D. Investigation of exposure to occupational noise among forestry machine operators: A case study in Brazil. Forests 2021, 12, 299. [Google Scholar] [CrossRef]
- Yongang, W.; Baojun, J. Effects of low temperature on operation efficiency of tree-felling by chainsaws in north China. J. For. Res. 1998, 9, 57–58. [Google Scholar] [CrossRef]
- Lindroos, O.; Burström, L. Accident rates and types among self-employed private forest owners. Accid. Anal. Prev. 2010, 42, 1729–1735. [Google Scholar] [CrossRef] [PubMed] [Green Version]
- Brachetti Montorselli, N.B.; Lombardini, C.; Magagnotti, N.; Marchi, E.; Neri, F.; Picchi, G.; Spinelli, R. Relating safety, productivity and company type for motor-manual logging operations in the Italian Alps. Accid. Anal. Prev. 2010, 42, 2013–2017. [Google Scholar] [CrossRef]
- Tsioras, P.A.; Rottensteiner, C.; Stampfer, K. Wood harvesting accidents in the Austrian State Forest Enterprise 2000–2009. Saf. Sci. 2014, 62, 400–408. [Google Scholar] [CrossRef]
- Borz, S.A.; Ignea, G.; Vasilescu, M.M. Small gains in wood recovery rate when disobeying the recommended motor-manual tree felling procedures: Another reason to use the proper technical prescriptions. Bioresources 2014, 9, 6938–6949. [Google Scholar] [CrossRef] [Green Version]
- Melemez, K. Risk factor analysis of fatal forest harvesting accidents: A case study in Turkey. Saf. Sci. 2015, 79, 369–378. [Google Scholar] [CrossRef]
- Laschi, A.; Marchi, E.; Foderi, C.; Neri, F. Identifying causes, dynamics and consequences of work accidents in forest operations in an alpine context. Saf. Sci. 2016, 89, 28–35. [Google Scholar] [CrossRef]
- Banciu, T.; Borz, S.A.; Marcu, M.V.; Iordache, E.; Liampas, S.A.G.; Drosos, V.C. An evaluation of risk-taking behavior in motor-manual tree felling and processing operations. Bull. Transilv. Univ. Bras. Ser. II For. Wood Ind. Agric. Food Eng. 2018, 112, 1–20. [Google Scholar]
- Calvo, A. Musculoskeletal disorders (MSD) risks in forestry: A case study to propose an analysis method. Agric. Eng. Int. 2009, 11, 1–9. [Google Scholar]
- Spinelli, R.; Aminti, G.; de Francesco, F. Postural risk assessment of firewood processing. Ergonomics 2016, 60, 1–9. [Google Scholar] [CrossRef] [PubMed]
- Spinelli, R.; Aminti, G.; Magagnotti, N.; De Francesco, F. Postural risk assessment of small-scale debarkers for wooden post production. Forests 2018, 9, 111. [Google Scholar] [CrossRef] [Green Version]
- Marogel-Popa, T.; Cheţa, M.; Marcu, M.V.; Duţă, C.I.; Ioraș, F.; Borz, S.A. Manual cultivation operations in poplar stands: A characterization of job difficulty and risks of health impairment. Int. J. Environ. Res. Public Health 2019, 16, 1911. [Google Scholar] [CrossRef] [Green Version]
- Gallis, C. Work-related prevalence of musculoskeletal symptoms among Greek forest workers. Int. J. Ind. Ergon. 2006, 36, 731–736. [Google Scholar] [CrossRef]
- Grzywinski, W.; Wandycz, A.; Tomczak, A.; Jelonek, T. The prevalence of self-reported musculoskeletal symptoms among loggers in Poland. Int. J. Ind. Ergon. 2016, 52, 12–17. [Google Scholar] [CrossRef]
- Corella Justavino, F.; Jimenez Ramirez, R.; Meza Perez, N.; Borz, S.A. The use of OWAS in forest operations postural assessment: Advantages and limitations. Bull. Transilv. Univ. Bras. Ser. II For. Wood Ind. Agric. Food Eng. 2015, 8, 7–16. [Google Scholar]
- David, G.C. Ergonomic methods for assessing exposure to risk of factors for work-related musculoskeletal disorders. Occup. Med. 2005, 55, 190–199. [Google Scholar] [CrossRef] [Green Version]
- Manghisi, V.M.; Uva, A.E.; Fiorentino, M.; Bevilacqua, V.; Trotta, G.F.; Monno, G. Real time RULA assessment using Kinect v2 sensor. Appl. Ergon. 2017, 65, 481–491. [Google Scholar] [CrossRef]
- Plantard, P.; Shum, H.R.H.; Le Pierres, A.-S.; Multon, F. Validation of an ergonomic assessment method using Kinect data in real workplace conditions. Appl. Ergon. 2017, 65, 562–569. [Google Scholar] [CrossRef] [PubMed]
- Seo, J.O.; Lee, S.H. Automatic postural ergonomic risk assessment using vision-based posture classification. Autom. Constr. 2021, 128, 103725. [Google Scholar] [CrossRef]
- Borz, S.A.; Castro Perez, S.N. Effect of the sampling strategy on the accuracy of postural classification: An example from motor-manual tree felling and processing. Rev. Pădurilor 2020, 135, 19–41. [Google Scholar]
- Helander, M. A Guide to Human Factors and Ergonomics, 2nd ed.; CRC Press: Boca Raton, FL, USA, 2006; pp. 224–255. ISBN 0-203-68775-2. [Google Scholar]
- Karhu, O.; Kansi, P.; Kuorinka, I. Correcting working postures in industry: A practical method for analysis. Appl. Ergon. 1977, 8, 199–201. [Google Scholar] [CrossRef]
- Louhevaara, V.; Suurnäkki, T. OWAS: A Method for the Evaluation of Postural Load during Work; Institute of Occupational Health Centre for Occupational Safety: Helsinki, Finland, 1992; p. 23. [Google Scholar]
- Gallo, R.; Mazzetto, R. Ergonomic analysis for the assessment of the risk of work-related musculoskeletal disorder in forestry operations. J. Agric. Eng. 2013, 44. [Google Scholar] [CrossRef]
- Zanuttini, R.; Cielo, P.; Poncino, D. The OWAS method. Preliminary results for the evaluation of the risk of work-related musculo-skeletal disorders (WMSD) in the forestry sector in Italy. For. Riv. Selvic. Ecol. For. 2005, 2, 242–255. [Google Scholar]
- Zar, J.H. Biostatistical Analysis, 5th ed.; Pearson Prentice Hall: Upper Saddle River, NJ, USA, 2010; p. 960. [Google Scholar]
- Karhu, O.; Härkönen, R.; Sorvali, P.; Vepsäläinen, P. Observing working postures in industry: Examples of OWAS application. Appl. Ergon. 1981, 12, 13–17. [Google Scholar] [CrossRef]
- Gómez-Galán, M.; Pérez-Alonso, J.; Callejón-Ferre, Á.-J.; López-Martínez, J. Muskuloskeletal disorders: OWAS review. Ind. Health 2017, 55, 314–337. [Google Scholar] [CrossRef] [Green Version]
- Musat, E.C.; Apafaian, A.I.; Ignea, G.; Ciobanu, V.D.; Iordache, E.; Derczeni, R.A.; Sparchez, G.; Vasilescu, M.M.; Borz, S.A. Time expenditure in computer aided time studies implemented for highly mechanized forest equipment. Ann. For. Res. 2016, 59, 129–143. [Google Scholar]
- Brandl, C.; Mertens, A.; Schlick, C.M. Effect of sampling interval on the reliability of ergonomic analysis using the Ovako working posture analysis system. Int. J. Ind. Ergon. 2017, 57, 68–73. [Google Scholar] [CrossRef]
- Boesch, D.F. Application of Numerical Classification in Ecological Investigations of Water Pollution; EPA-600/3-77-033; Ecological Research Series; Environmental Protection Agency: Corvallis, OR, USA, 1977; p. 126.
- Huhta, V. Evaluation of different similarity indices as measures of succession in arthropod communities of the forest floor after clear-cutting. Oecologia 1979, 41, 11–23. [Google Scholar] [CrossRef] [PubMed]
- Sørensen, T. A Method for Establishing Groups of Equal Amplitude in Plat Sociology Based on Similarity of Species Content and Its Application to Analyses of the Vegetation on Danish Commons; Biologiske Skrifter, V (4); Det Kongelige Danske Videnskabernes Selskab: Copenhagen, Denmark, 1948; p. 46. [Google Scholar]
- Mathiassen, S.E. Diversity and variation in biomechanical exposure: What is it, and what would we like to know? Appl. Ergon. 2006, 37, 419–427. [Google Scholar] [CrossRef] [PubMed]
- Enez, K.; Nalbantoğlu, S.S. Comparison of ergonomic risk assessment outputs from OWAS and REBA in forestry timber harvesting. Int. J. Ind. Ergon. 2019, 70, 51–57. [Google Scholar] [CrossRef]
- Rhén, I.M.; Forsman, M. Inter- and intra-rater reliability of the OCRA checklist method in video-recorded manual work tasks. Appl. Ergon. 2020, 84, 103025. [Google Scholar] [CrossRef] [PubMed]
- Wolda, H. Similarity indices, sample size and diversity. Oecologia 1981, 50, 296–302. [Google Scholar] [CrossRef]
Publisher’s Note: MDPI stays neutral with regard to jurisdictional claims in published maps and institutional affiliations. |
© 2021 by the authors. Licensee MDPI, Basel, Switzerland. This article is an open access article distributed under the terms and conditions of the Creative Commons Attribution (CC BY) license (https://creativecommons.org/licenses/by/4.0/).