
Additionality and Leakage Resulting from PES Implementation? Evidence from the Ecuadorian Amazonia

 , , ,
, , ,  and
and 
Abstract
:1. Introduction
2. Materials and Methods
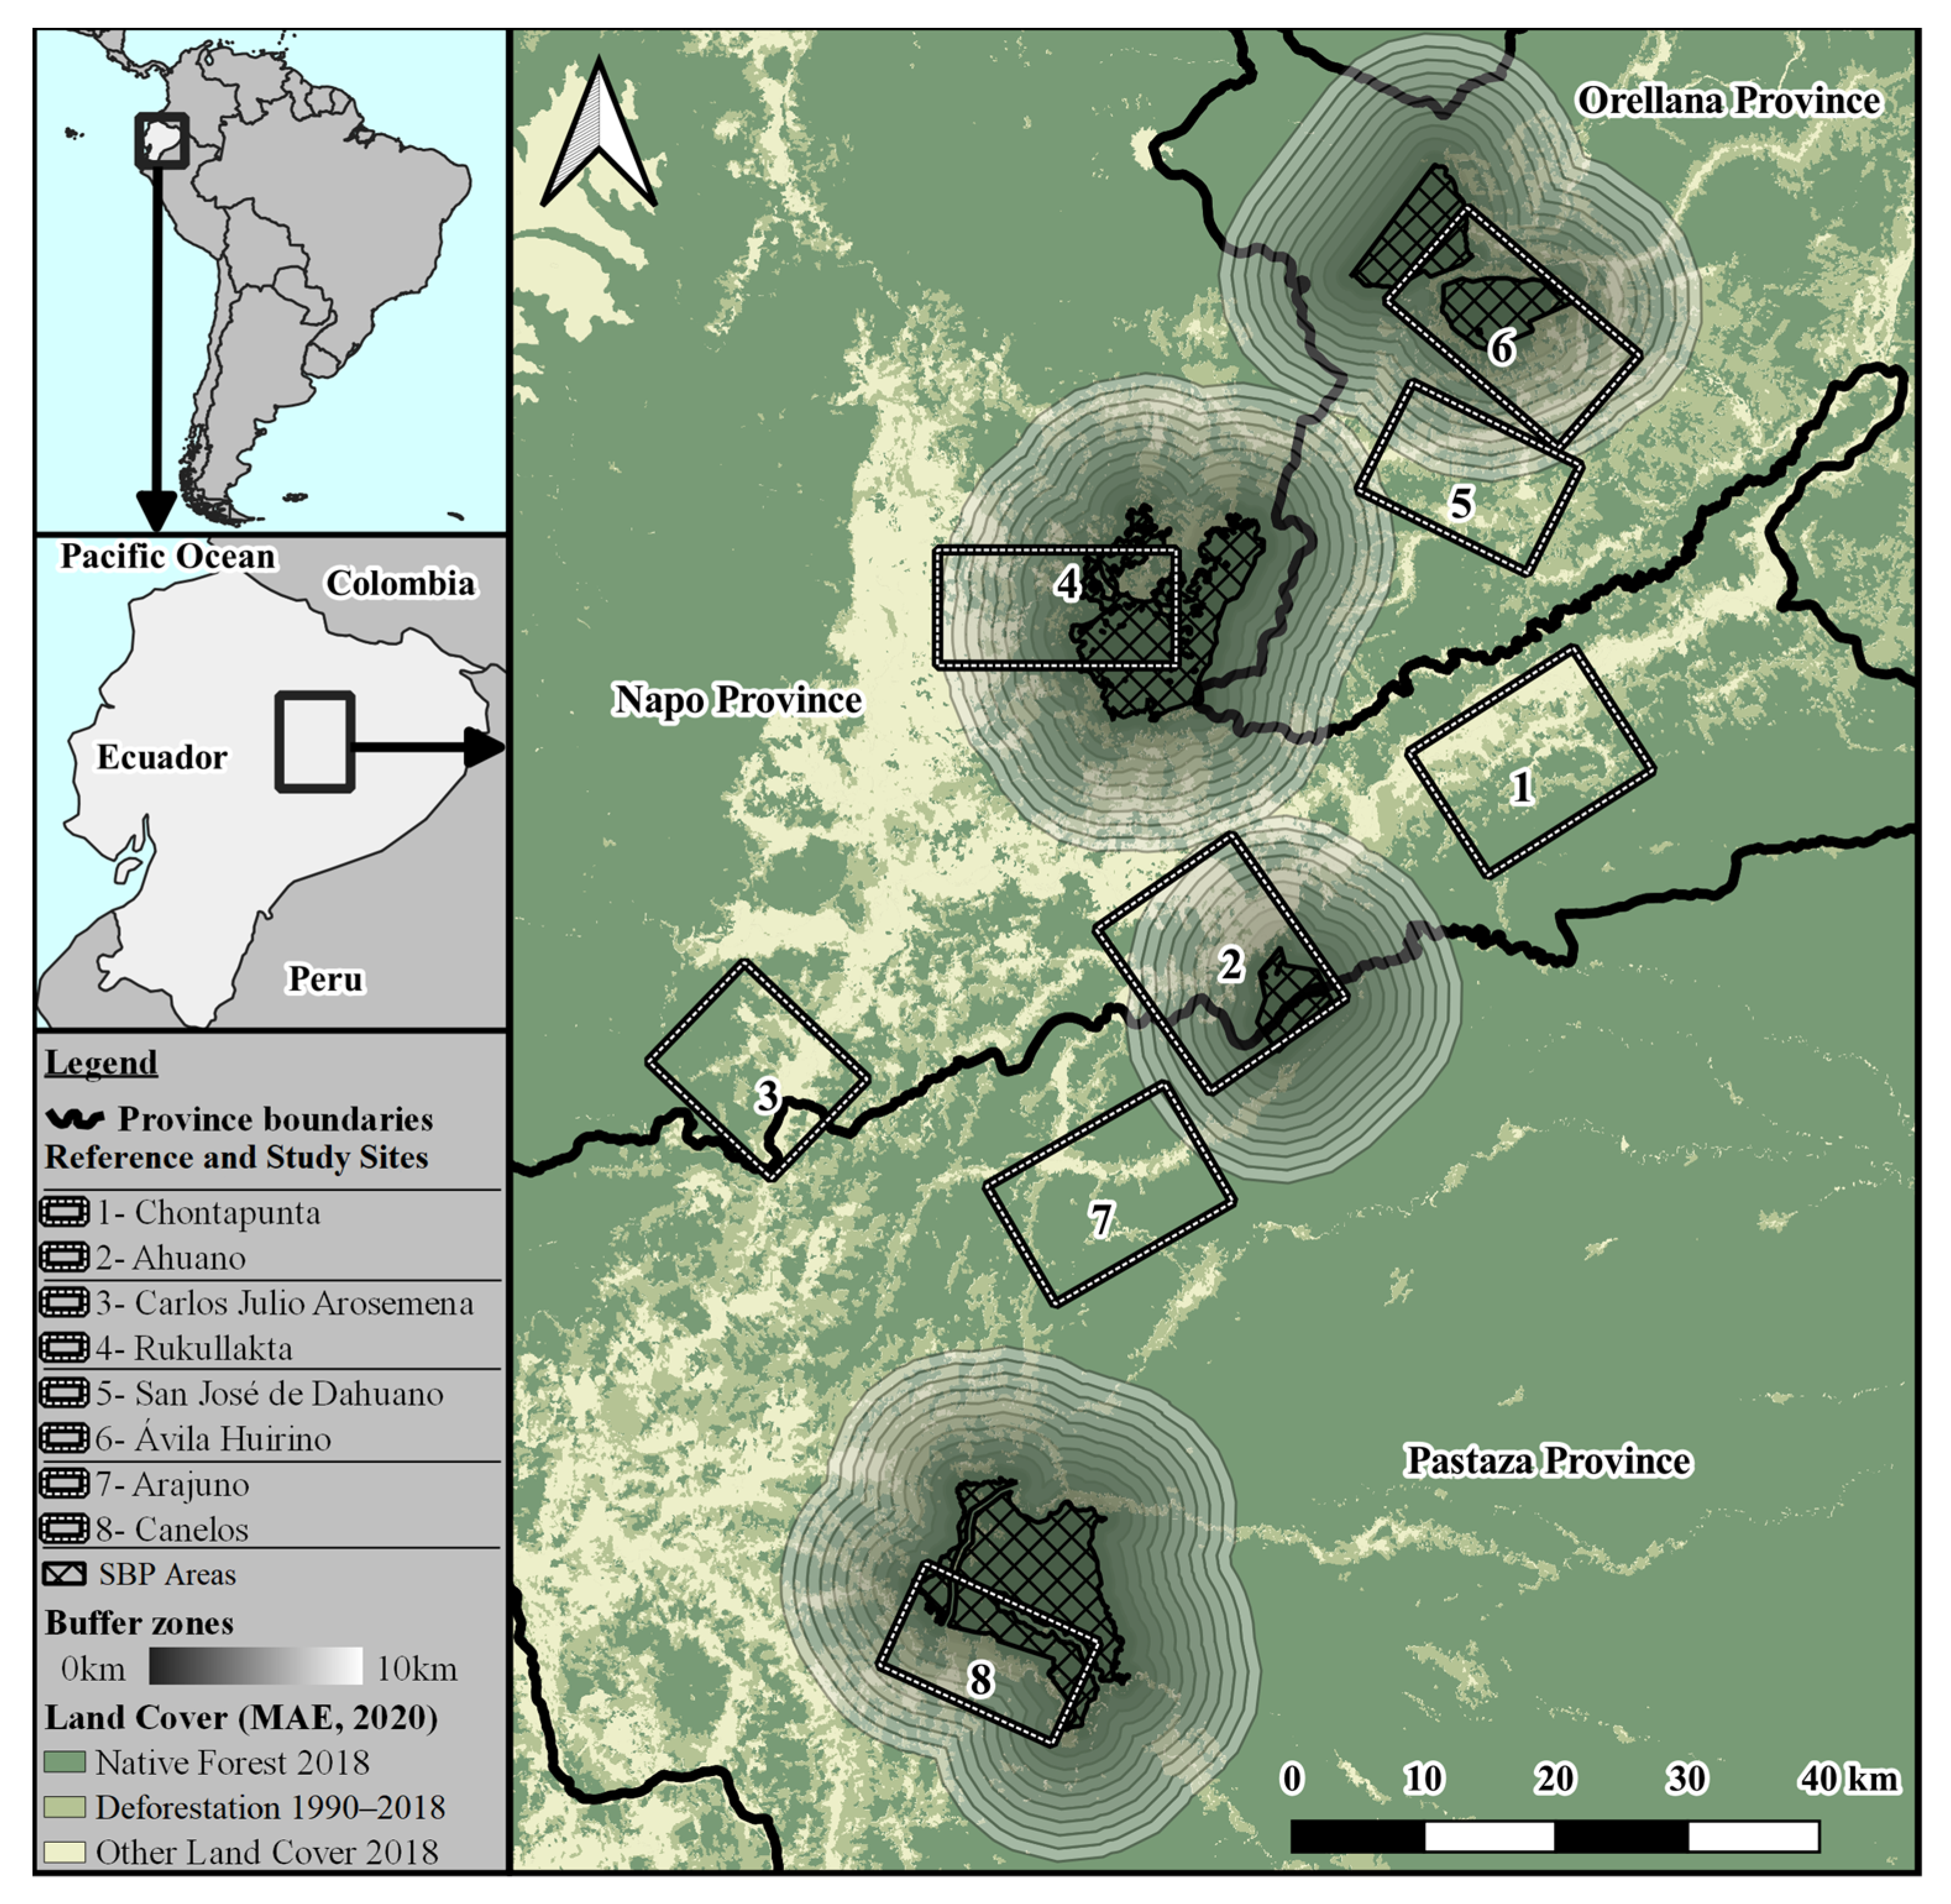
2.1. Study Sites
2.2. Empirical Approach
2.3. Analysis of Additionality: Suitable References
2.4. Average Annual Net Change in Forest Area
3. Results
3.1. Negligible Change in Deforestation Rate before and after SBP
3.2. Lower Deforestation Rates in Reference Tiles Without SBP
3.3. Low Deforestation Rates in SBP Areas Even before SBP Implementation Indicate Self-Selection
3.4. Reduced Deforestation in Buffer Zones Surrounding SBP-Enrolled Areas after SBP Implementation
4. Discussion
4.1. Methodological Issues
4.2. Additionality and Self-Selection
4.3. Leakage
4.4. Implications for PES Design
4.5. Limitations of Our Study
5. Conclusions
Author Contributions
Funding
Institutional Review Board Statement
Informed Consent Statement
Data Availability Statement
Acknowledgments
Conflicts of Interest
Appendix A

| Study Site (Province) | Buffer | 1990–2000 | 2000–2008 | 2008–2014 | 2014–2016 | 2016–2018 | Before SBP | After SBP |
|---|---|---|---|---|---|---|---|---|
| Ahuano | SBP area | 0.00% | 0.00% | −0.03% | 0.00% | 0.00% | 0.00% | −0.02% |
| (Napo) | Buffer 1 km | −0.01% | −0.07% | −0.19% | 0.04% | −0.01% | −0.04% | −0.10% |
| Buffer 2 km | 0.32% | −0.50% | −0.43% | −0.07% | −0.35% | −0.05% | −0.34% | |
| Buffer 3 km | 0.30% | −0.44% | −0.53% | −0.27% | −0.16% | −0.03% | −0.40% | |
| Buffer 4 km | 0.27% | −0.58% | −0.40% | −0.11% | −0.41% | −0.10% | −0.34% | |
| Buffer 5 km | 0.53% | −0.82% | −0.38% | 0.09% | −0.58% | −0.07% | −0.33% | |
| Buffer 6 km | 0.37% | −0.68% | −0.53% | 0.09% | −0.34% | −0.10% | −0.37% | |
| Buffer 7 km | 0.17% | −0.85% | −0.27% | −0.11% | −0.28% | −0.28% | −0.24% | |
| Buffer 8 km | 0.05% | −0.51% | −0.45% | −0.19% | −0.59% | −0.20% | −0.42% | |
| Buffer 9 km | 0.28% | −0.66% | −0.35% | −0.09% | −0.56% | −0.14% | −0.34% | |
| Buffer 10 km | 0.32% | −0.65% | −0.53% | −0.08% | −0.95% | −0.11% | −0.52% | |
| Rukullacta | SBP area | 0.02% | −0.01% | 0.02% | 0.06% | −0.04% | 0.01% | 0.01% |
| (Napo) | Buffer 1 km | −1.06% | −0.62% | 0.92% | −0.83% | −0.80% | −0.87% | 0.23% |
| Buffer 2 km | −1.01% | −0.47% | 0.86% | −0.60% | −0.38% | −0.77% | 0.32% | |
| Buffer 3 km | −0.39% | −1.25% | 0.07% | 0.24% | −0.41% | −0.77% | 0.00% | |
| Buffer 4 km | −0.68% | −1.34% | 0.20% | 0.02% | −0.54% | −0.98% | 0.02% | |
| Buffer 5 km | −0.14% | −1.67% | 1.15% | −0.11% | −1.36% | −0.82% | 0.40% | |
| Buffer 6 km | −0.26% | −2.10% | 1.32% | −0.13% | −0.78% | −1.08% | 0.61% | |
| Buffer 7 km | −0.35% | −2.05% | 0.35% | 0.54% | −1.43% | −1.10% | 0.03% | |
| Buffer 8 km | −0.56% | −3.03% | −0.35% | 0.16% | −0.69% | −1.66% | −0.32% | |
| Buffer 9 km | −0.98% | −2.09% | 0.03% | −1.46% | −0.84% | −1.47% | −0.44% | |
| Buffer 10 km | −0.65% | −1.52% | 0.29% | −0.53% | −1.20% | −1.04% | −0.17% | |
| Ávila | SBP area | −0.02% | −0.09% | 0.08% | 0.02% | −0.01% | −0.05% | 0.05% |
| (Orellana) | Buffer 1 km | −0.96% | −1.35% | −0.57% | −1.12% | −1.23% | −1.13% | −0.81% |
| Buffer 2 km | −0.90% | −0.87% | −0.56% | −0.75% | −0.96% | −0.89% | −0.68% | |
| Buffer 3 km | −0.87% | −1.45% | −0.51% | −1.11% | −1.13% | −1.13% | −0.76% | |
| Buffer 4 km | −0.84% | −0.59% | −0.32% | −0.32% | −0.57% | −0.73% | −0.37% | |
| Buffer 5 km | −0.85% | −0.63% | −0.60% | −0.60% | −0.75% | −0.75% | −0.63% | |
| Buffer 6 km | −1.04% | −0.93% | −0.60% | −0.81% | −1.81% | −0.99% | −0.88% | |
| Buffer 7 km | −1.00% | −0.59% | −0.13% | −0.75% | −0.91% | −0.82% | −0.41% | |
| Buffer 8 km | −0.85% | −0.91% | −0.43% | −0.58% | −0.51% | −0.88% | −0.48% | |
| Buffer 9 km | −1.27% | −0.95% | −0.74% | −0.49% | −1.20% | −1.13% | −0.78% | |
| Buffer 10 km | −1.23% | −1.15% | −0.61% | −0.43% | −0.60% | −1.19% | −0.57% | |
| Canelos | SBP area | −0.12% | −0.04% | −0.18% | −0.03% | −0.18% | −0.11% | −0.10% |
| (Pastaza) | Buffer 1 km | −0.30% | −0.92% | −0.46% | −0.39% | −0.66% | −0.55% | −0.52% |
| Buffer 2 km | −0.68% | −0.82% | −0.44% | −0.18% | −0.36% | −0.67% | −0.27% | |
| Buffer 3 km | −0.79% | −0.49% | −0.79% | −0.39% | −0.08% | −0.69% | −0.24% | |
| Buffer 4 km | −1.20% | −1.17% | −1.17% | −0.49% | −0.35% | −1.18% | −0.42% | |
| Buffer 5 km | −1.20% | −1.17% | −1.13% | −0.66% | −0.79% | −1.17% | −0.72% | |
| Buffer 6 km | −1.32% | −1.43% | −0.99% | −0.30% | −0.03% | −1.28% | −0.16% | |
| Buffer 7 km | −0.84% | −1.37% | −1.06% | −0.58% | −0.40% | −1.07% | −0.49% | |
| Buffer 8 km | −0.79% | −1.11% | −1.13% | −0.68% | −0.27% | −0.98% | −0.48% | |
| Buffer 9 km | −0.52% | −1.03% | −0.83% | −0.96% | −0.40% | −0.77% | −0.68% | |
| Buffer 10 km | −0.65% | −1.44% | −1.03% | −0.86% | −0.50% | −1.01% | −0.68% |
| Study Site | p-Value | R2 | Before SBP Mean | After SBP Mean |
|---|---|---|---|---|
| SBP area | 0.4476 | 0.81 | −0.0376 A | −0.0153 A |
| Buffer 1 km | 0.2822 | 0.66 | −0.6474 A | −0.3030 A |
| Buffer 2 km | 0.2976 | 0.20 | −0.5925 A | −0.2408 A |
| Buffer 3 km | 0.2956 | 0.55 | −0.6549 A | −0.3475 A |
| Buffer 4 km | 0.1622 | 0.36 | −0.7478 A | −0.2786 A |
| Buffer 5 km | 0.3068 | 0.24 | −0.7042 A | −0.3197 A |
| Buffer 6 km | 0.2032 | 0.30 | −0.8595 A | −0.2004 A |
| Buffer 7 km | 0.0925 | 0.49 | −0.8198 A | −0.2768 B |
| Buffer 8 km | 0.1916 | 0.31 | −0.9294 A | −0.4241 A |
| Buffer 9 km | 0.3149 | 0.55 | −0.8758 A | −0.5597 A |
| Buffer 10 km | 0.2852 | 0.21 | −0.8365 A | −0.4876 A |
References
- Wunder, S. Revisiting the concept of payments for environmental services. Ecol. Econ. 2015, 117, 234–243. [Google Scholar] [CrossRef]
- Ezzine-de-Blas, D.; Wunder, S.; Ruiz-Perez, M.; Moreno-Sanchez Rdel, P. Global Patterns in the Implementation of Payments for Environmental Services. PLoS ONE 2016, 11, e0149847. [Google Scholar] [CrossRef] [Green Version]
- Ferraro, P.J.; Kiss, A. Direct Payments to Conserve Biodiversity. Science 2002, 298, 1718–1719. [Google Scholar] [CrossRef] [PubMed] [Green Version]
- Corbera, E.; Estrada, M.; Brown, K. Reducing greenhouse gas emissions from deforestation and forest degradation in developing countries: Revisiting the assumptions. Clim. Chang. 2010, 100, 355–388. [Google Scholar] [CrossRef]
- Grima, N.; Singh, S.J.; Smetschka, B.; Ringhofer, L. Payment for Ecosystem Services (PES) in Latin America: Analysing the performance of 40 case studies. Ecosyst. Serv. 2016, 17, 24–32. [Google Scholar] [CrossRef]
- Muradian, R.; Arsel, M.; Pellegrini, L.; Adaman, F.; Aguilar, B.; Agarwal, B.; Corbera, E.; Ezzine de Blas, D.; Farley, J.; Froger, G.; et al. Payments for ecosystem services and the fatal attraction of win-win solutions. Conserv. Lett. 2013, 6, 274–279. [Google Scholar] [CrossRef] [Green Version]
- Ferraro, P.; Simpson, R.D. The Cost-Effectiveness of Conservation Payments. Land Econ. 2002, 78, 339–353. [Google Scholar] [CrossRef] [Green Version]
- Pagiola, S. Using PES to Implement REDD. Payments for Environmental Services (PES) Learning Paper; no. 2011-1; World Bank: Washington, DC, USA, 2011. [Google Scholar]
- Börner, J.; Baylis, K.; Corbera, E.; Ezzine-de-Blas, D.; Ferraro, P.J.; Honey-Rosés, J.; Lapeyre, R.; Persson, U.M.; Wunder, S. Emerging Evidence on the Effectiveness of Tropical Forest Conservation. PLoS ONE 2016, 11, e0159152. [Google Scholar] [CrossRef] [Green Version]
- Baylis, K.; Honey-Rosés, J.; Börner, J.; Corbera, E.; Ezzine-de-Blas, D.; Ferraro, P.J.; Lapeyre, R.; Persson, U.M.; Pfaff, A.; Wunder, S. Mainstreaming Impact Evaluation in Nature Conservation. Conserv. Lett. 2016, 9, 58–64. [Google Scholar] [CrossRef] [Green Version]
- Ferraro, P.J.; Hanauer, M.M. Advances in Measuring the Environmental and Social Impacts of Environmental Programs. Annu. Rev. Environ. Resour. 2014, 39, 495–517. [Google Scholar] [CrossRef] [Green Version]
- Persson, M.; Alpízar, F. Conditional Cash Transfers and Payments for Environmental Services—A Conceptual Framework for Explaining and Judging Differences in Outcomes. World Dev. 2013, 43, 124–137. [Google Scholar] [CrossRef]
- Galle, B. The Tragedy of the Carrots: Economics and Politics in the Choice of Price Instruments. Stanf. Law Rev. 2012, 64, 797–850. [Google Scholar]
- Jayachandran, S.; de Laat, J.; Lambin, E.F.; Stanton, C.Y.; Audy, R.; Thomas, N.E. Cash for carbon: A randomized trial of payments for ecosystem services to reduce deforestation. Science 2017, 357, 267–273. [Google Scholar] [CrossRef] [PubMed] [Green Version]
- Alix-Garcia, J.; De Janvry, A.; Sadoulet, E. The role of deforestation risk and calibrated compensation in designing payments for environmental services. Environ. Dev. Econ. 2008, 13, 375–394. [Google Scholar] [CrossRef] [Green Version]
- Swingland, I.R.; Bettelheim, E.C.; Grace, J.; Prance, G.T.; Saunders, L.S.; Schwarze, R.; Niles, J.O.; Olander, J. Understanding and managing leakage in forest-based greenhouse-gas-mitigation projects. Philos. Trans. R. Soc. London. Ser. A Math. Phys. Eng. Sci. 2002, 360, 1685–1703. [Google Scholar] [CrossRef]
- Aukland, L.; Costa, P.M.; Brown, S. A conceptual framework and its application for addressing leakage: The case of avoided deforestation. Clim. Policy 2003, 3, 123–136. [Google Scholar] [CrossRef]
- Delacote, P.; Robinson, E.J.Z.; Roussel, S. Deforestation, leakage and avoided deforestation policies: A spatial analysis. Resour. Energy Econ. 2016, 45, 192–210. [Google Scholar] [CrossRef] [Green Version]
- Lichtenberg, E.; Smith-Ramírez, R. Slippage in Conservation Cost Sharing. Am. J. Agric. Econ. 2011, 93, 113–129. [Google Scholar] [CrossRef]
- Mohebalian, P.M.; Aguilar, F.X. Additionality and design of forest conservation programs: Insights from Ecuador’s Socio Bosque Program. For. Policy Econ. 2016, 71, 103–114. [Google Scholar] [CrossRef] [Green Version]
- Jones, K.W.; Holland, M.B.; Naughton-Treves, L.; Morales, M.; Suarez, L.; Keenan, K. Forest conservation incentives and deforestation in the Ecuadorian Amazon. Environ. Conserv. 2016, 44, 56–65. [Google Scholar] [CrossRef] [Green Version]
- Mohebalian, P.M.; Aguilar, F.X. Design of tropical forest conservation contracts considering risk of deforestation. Land Use Policy 2018, 70, 451–462. [Google Scholar] [CrossRef]
- Cuenca, P.; Robalino, J.; Arriagada, R.; Echeverría, C. Are government incentives effective for avoided deforestation in the tropical Andean forest? PLoS ONE 2018, 13, e0203545. [Google Scholar] [CrossRef] [PubMed] [Green Version]
- Giudice, R.; Börner, J.; Wunder, S.; Cisneros, E. Selection biases and spillovers from collective conservation incentives in the Peruvian Amazon. Environ. Res. Lett. 2019, 14, 045004. [Google Scholar] [CrossRef]
- Le Velly, G.; Sauquet, A.; Cortina-Villar, S. PES Impact and Leakages over Several Cohorts: The Case of the PSA-H in Yucatan, Mexico. Land Econ. 2017, 93, 230–257. [Google Scholar] [CrossRef]
- Alix-Garcia, J.M.; Shapiro, E.N.; Sims, K.R.E. Forest Conservation and Slippage: Evidence from Mexico’s National Payments for Ecosystem Services Program. Land Econ. 2012, 88, 613–638. [Google Scholar] [CrossRef]
- Muradian, R.; Corbera, E.; Pascual, U.; Kosoy, N.; May, P.H. Reconciling theory and practice: An alternative conceptual framework for understanding payments for environmental services. Ecol. Econ. 2010, 69, 1202–1208. [Google Scholar] [CrossRef]
- Miteva, D.A.; Pattanayak, S.K.; Ferraro, P.J. Evaluation of biodiversity policy instruments: What works and what doesn’t? Oxf. Rev. Econ. Policy 2012, 28, 69–92. [Google Scholar] [CrossRef]
- Pattanayak, S.K.; Wunder, S.; Ferraro, P.J. Show Me the Money: Do Payments Supply Environmental Services in Developing Countries? Rev. Environ. Econ. Policy 2010, 4, 254–274. [Google Scholar] [CrossRef]
- Coase, R.H. The Problem of Social Cost. J. Law Econ. 1960, 3, 1–44. [Google Scholar] [CrossRef]
- Wünscher, T.; Engel, S.; Wunder, S. Spatial targeting of payments for environmental services: A tool for boosting conservation benefits. Ecol. Econ. 2008, 65, 822–833. [Google Scholar] [CrossRef]
- Ferraro, P.J.; Lawlor, K.; Mullan, K.L.; Pattanayak, S.K. Forest Figures: Ecosystem Services Valuation and Policy Evaluation in Developing Countries. Rev. Environ. Econ. Policy 2011, 6, 20–44. [Google Scholar] [CrossRef] [Green Version]
- Ferraro, P.J.; Pattanayak, S.K. Money for nothing? A call for empirical evaluation of biodiversity conservation investments. PLoS Biol. 2006, 4, e105. [Google Scholar] [CrossRef] [PubMed] [Green Version]
- Sills, E.; Arriagada, R.; Ferraro, P.; Pattanayak, S.; Carrasco, L.; Ortiz, E.; Cordero, S.; Caldwell, K.; Andam, K. Impact of Costa Rica’s Program of Payments for Environmental Services on Land Use. Payments for Environmental Services (PES) Learning Paper; no. 2008-3; World Bank: Washington, DC, USA, 2008. [Google Scholar]
- Arriagada, R.; Cotacachi, D. Comunidades Sostenibles: Evaluación de Impacto del Programa Socio Bosque en Poblaciones Indígenas y Afrodescendientes; Inter-American Development Bank: Washington, DC, USA, 2018. [Google Scholar]
- MAE. Análisis de la Deforestación en el Ecuador Continental 1990–2014; Ministerio del Ambiente: Quito, Ecuador, 2016; p. 43.
- MAE. Deforestación del Ecuador continental Periodo 2014–2016; Ministerio del Ambiente: Quito, Ecuador, 2017; p. 38.
- MAE. Deforestación del Ecuador Continental Periodo 2016–2018; Ministerio del Ambiente: Quito, Ecuador, 2019.
- Sierra, R. Patrones y factores de deforestación en el Ecuador continental, 1990–2010. Y un acercamiento a los próximos 10 años. Conserv. Int. Ecuad. Y For. Trends Quito Ecuad. 2013, 57. [Google Scholar]
- Mosandl, R.; Günter, S.; Stimm, B.; Weber, M. Ecuador Suffers the Highest Deforestation Rate in South America. In Gradients in a Tropical Mountain Ecosystem of Ecuador; Beck, E., Bendix, J., Kottke, I., Makeschin, F., Mosandl, R., Eds.; Springer: Berlin/Heidelberg, Germany, 2008; pp. 37–40. [Google Scholar]
- de Koning, F.; Aguiñaga, M.; Bravo, M.; Chiu, M.; Lascano, M.; Lozada, T.; Suarez, L. Bridging the gap between forest conservation and poverty alleviation: The Ecuadorian Socio Bosque program. Environ. Sci. Policy 2011, 14, 531–542. [Google Scholar] [CrossRef]
- MAE. Creación del programa Socio Bosque. Acuerdo Ministerial N° 169. Ministerio del Ambiente, 2008. Available online: http://sociobosque.ambiente.gob.ec/node/197 (accessed on 8 July 2021).
- Eguiguren, P.; Fischer, R.; Günter, S. Degradation of Ecosystem Services and Deforestation in Landscapes with and Without Incentive-Based Forest Conservation in the ECUADORIAN Amazon. Forests 2019, 10, 442. [Google Scholar] [CrossRef] [Green Version]
- Mohebalian, P.M.; Aguilar, F.X. Beneath the Canopy: Tropical Forests Enrolled in Conservation Payments Reveal Evidence of Less Degradation. Ecol. Econ. 2018, 143, 64–73. [Google Scholar] [CrossRef]
- Wunder, S.; Börner, J.; Ezzine-de-Blas, D.; Feder, S.; Pagiola, S. Payments for Environmental Services: Past Performance and Pending Potentials. Annu. Rev. Resour. Econ. 2020, 12, 26. [Google Scholar] [CrossRef]
- Fuller, C.; Ondei, S.; Brook, B.W.; Buettel, J.C. First, do no harm: A systematic review of deforestation spillovers from protected areas. Glob. Ecol. Conserv. 2019, 18, e00591. [Google Scholar] [CrossRef]
- Eguiguren, P.; Ojeda Luna, T.; Torres, B.; Lippe, M.; Günter, S. Ecosystem Service Multifunctionality: Decline and Recovery Pathways in the Amazon and Chocó Lowland Rainforests. Sustainability 2020, 12, 7786. [Google Scholar] [CrossRef]
- Ojeda Luna, T.; Zhunusova, E.; Günter, S.; Dieter, M. Measuring forest and agricultural income in the Ecuadorian lowland rainforest frontiers: Do deforestation and conservation strategies matter? For. Policy Econ. 2020, 111, 102034. [Google Scholar] [CrossRef]
- Ojeda Luna, T.; Eguiguren, P.; Günter, S.; Torres, B.; Dieter, M. What Drives Household Deforestation Decisions? Insights from the Ecuadorian Lowland Rainforests. Forests 2020, 11, 1131. [Google Scholar] [CrossRef]
- Ferrer Velasco, R.; Köthke, M.; Lippe, M.; Günter, S. Scale and context dependency of deforestation drivers: Insights from spatial econometrics in the tropics. PLoS ONE 2020, 15, e0226830. [Google Scholar] [CrossRef] [PubMed]
- MAE. Estadísticas de Patrimonio Natural; Ministerio del Ambiente: Quito, Ecuador, 2015; p. 40.
- MAE. Resumen General Proyecto Socio Bosque. Ministerio del Ambiente, 2018. Available online: http://sociobosque.ambiente.gob.ec/node/44 (accessed on 18 May 2021).
- Rodríguez-Robayo, K.J.; Merino-Perez, L. Contextualizing context in the analysis of payment for ecosystem services. Ecosyst. Serv. 2017, 23, 259–267. [Google Scholar] [CrossRef]
- Frost, P.G.H.; Bond, I. The CAMPFIRE programme in Zimbabwe: Payments for wildlife services. Ecol. Econ. 2008, 65, 776–787. [Google Scholar] [CrossRef]
- Bennett, D.E.; Gosnell, H. Integrating multiple perspectives on payments for ecosystem services through a social–ecological systems framework. Ecol. Econ. 2015, 116, 172–181. [Google Scholar] [CrossRef]
- Joppa, L.; Pfaff, A. Reassessing the forest impacts of protection: The challenge of nonrandom location and a corrective method. Ann. N. Y. Acad. Sci. 2010, 1185, 135–149. [Google Scholar] [CrossRef]
- de Winter, J.C.F. Using the Student’s t-test with extremely small sample sizes. Pract. Assess. Res. Eval. 2013, 18, 10. [Google Scholar]
- Fritz, C.O.; Morris, P.E.; Richler, J.J. Effect size estimates: Current use, calculations, and interpretation. J. Exp. Psychol. Gen. 2012, 141, 2. [Google Scholar] [CrossRef] [Green Version]
- Lakens, D. Calculating and reporting effect sizes to facilitate cumulative science: A practical primer for t-tests and ANOVAs. Front. Psychol. 2013, 4. [Google Scholar] [CrossRef] [PubMed] [Green Version]
- Börner, J.; Schulz, D.; Wunder, S.; Pfaff, A. The Effectiveness of Forest Conservation Policies and Programs. Annu. Rev. Resour. Econ. 2020, 12, 20. [Google Scholar] [CrossRef]
- Vincent, J.R. Impact Evaluation of Forest Conservation Programs: Benefit-Cost Analysis, Without the Economics. Environ. Resour. Econ. 2016, 63, 395–408. [Google Scholar] [CrossRef]
- Kalacska, M.; Sanchez-Azofeifa, G.A.; Rivard, B.; Calvo-Alvarado, J.C.; Quesada, M. Baseline assessment for environmental services payments from satellite imagery: A case study from Costa Rica and Mexico. J. Environ. Manag. 2008, 88, 348–359. [Google Scholar] [CrossRef]
- Yang, W.; Liu, W.; Viña, A.; Luo, J.; He, G.; Ouyang, Z.; Zhang, H.; Liu, J. Performance and prospects of payments for ecosystem services programs: Evidence from China. J. Environ. Manag. 2013, 127, 86–95. [Google Scholar] [CrossRef] [PubMed]
- Puyravaud, J.-P. Standardizing the calculation of the annual rate of deforestation. For. Ecol. Manag. 2003, 177, 593–596. [Google Scholar] [CrossRef]
- Quantum GIS Development Team. Quantum GIS Geographic Information System. 2020. Available online: https://qgis.org/en/site/ (accessed on 8 July 2021).
- Samii, C.; Lisiecki, M.; Kulkarni, P.; Paler, L.; Chavis, L. Effects of payment for environmental services (PES) on deforestation and poverty in low and middle income countries: A systematic review. Campbell Syst. Rev. 2014, 10, 1–95. [Google Scholar] [CrossRef] [Green Version]
- Cohen, J. Statistical power analysis. Curr. Dir. Psychol. Sci. 1992, 1, 98–101. [Google Scholar] [CrossRef]
- Sawilowsky, S.S. New effect size rules of thumb. J. Mod. Appl. Stat. Methods 2009, 8, 26. [Google Scholar] [CrossRef]
- Slavin, R.; Smith, D. The Relationship between Sample Sizes and Effect Sizes in Systematic Reviews in Education. Educ. Eval. Policy Anal. 2009, 31, 500–506. [Google Scholar] [CrossRef]
- Kao, L.S.; Green, C.E. Analysis of variance: Is there a difference in means and what does it mean? J. Surg. Res. 2008, 144, 158–170. [Google Scholar] [CrossRef] [Green Version]
- Jones, K.W.; Lewis, D.J. Estimating the Counterfactual Impact of Conservation Programs on Land Cover Outcomes: The Role of Matching and Panel Regression Techniques. PLoS ONE 2015, 10, e0141380. [Google Scholar] [CrossRef] [PubMed]
- Chomitz, K.; Gray, D. Roads, Lands, Markets, and Deforestation: A Spatial Model of Land Use in Belize. World Bank Econ. Rev. 1995, 10, 53. [Google Scholar]
- Etchart, N.; Freire, J.L.; Holland, M.B.; Jones, K.W.; Naughton-Treves, L. What happens when the money runs out? Forest outcomes and equity concerns following Ecuador’s suspension of conservation payments. World Dev. 2020, 136, 105124. [Google Scholar] [CrossRef] [PubMed]
- Ford, S.A.; Jepsen, M.R.; Kingston, N.; Lewis, E.; Brooks, T.M.; MacSharry, B.; Mertz, O. Deforestation leakage undermines conservation value of tropical and subtropical forest protected areas. Glob. Ecol. Biogeogr. 2020. [Google Scholar] [CrossRef]
- Arturo Sánchez-Azofeifa, G.; Daily, G.C.; Pfaff, A.S.P.; Busch, C. Integrity and isolation of Costa Rica’s national parks and biological reserves: Examining the dynamics of land-cover change. Biol. Conserv. 2003, 109, 123–135. [Google Scholar] [CrossRef] [Green Version]
- Nolte, C.; Meyer, S.R.; Sims, K.R.E.; Thompson, J.R. Voluntary, permanent land protection reduces forest loss and development in a rural-urban landscape. Conserv. Lett. 2019, 12, e12649. [Google Scholar] [CrossRef]
- Thorell, M.; Götmark, F. Reinforcement capacity of potential buffer zones: Forest structure and conservation values around forest reserves in southern Sweden. For. Ecol. Manag. 2005, 212, 333–345. [Google Scholar] [CrossRef]
- Lorena, R.B.; Lambin, E.F. The spatial dynamics of deforestation and agent use in the Amazon. Appl. Geogr. 2009, 29, 171–181. [Google Scholar] [CrossRef]
- Alix-Garcia, J. A spatial analysis of common property deforestation. J. Environ. Econ. Manag. 2007, 53, 141–157. [Google Scholar] [CrossRef]
- Ewers, R.M.; Rodrigues, A.S.L. Estimates of reserve effectiveness are confounded by leakage. Trends Ecol. Evol. 2008, 23, 113–116. [Google Scholar] [CrossRef]
- Andam, K.S.; Ferraro, P.J.; Pfaff, A.S.; Sanchez-Azofeifa, G.A. Protected Areas and Avoided Deforestation: A Statistical Evaluation; Final Report; Global Environment Facility Evaluation Office: Washington, DC, USA, 2007. [Google Scholar]
- Börner, J.; Baylis, K.; Corbera, E.; Ezzine-de-Blas, D.; Honey-Rosés, J.; Persson, U.M.; Wunder, S. The Effectiveness of Payments for Environmental Services. World Dev. 2017, 96, 359–374. [Google Scholar] [CrossRef]
- Robalino, J.; Pfaff, A. Ecopayments and Deforestation in Costa Rica: A Nationwide Analysis of PSA’s Initial Years. Land Econ. 2013, 89, 432–448. [Google Scholar] [CrossRef]
- Le Velly, G.; Dutilly, C. Evaluating Payments for Environmental Services: Methodological Challenges. PLoS ONE 2016, 11, e0149374. [Google Scholar] [CrossRef] [Green Version]
- Bruner, A.G.; Gullison, R.E.; Rice, R.E.; da Fonseca, G.A.B. Effectiveness of Parks in Protecting Tropical Biodiversity. Science 2001, 291, 125–128. [Google Scholar] [CrossRef] [Green Version]
- Woolcock, M. Using case studies to explore the external validity of ‘complex’ development interventions. Evaluation 2013, 19, 229–248. [Google Scholar] [CrossRef] [Green Version]


| Average Annual Net Change | ||||||
|---|---|---|---|---|---|---|
| Province | Study Site | Date of SBP Start | SBP Area Size (Hectares | Before SBP | After SBP | Difference (in Percentage Points) |
| Napo | Ahuano (2) | August/2009 | 2383.38 | 0.000% | −0.020% | −0.020 |
| Napo | Rukullacta (4) | August/2009 | 10,987.83 | 0.007% | 0.014% | 0.007 |
| Orellana | Ávila (6) | December/2009 | 7992.09 | −0.049% | 0.048% | 0.097 |
| Pastaza | Canelos (8) | October/2014 | 13,144.23 | −0.108% | −0.103% | 0.005 |
| Average Annual Net Change | |||||||||
|---|---|---|---|---|---|---|---|---|---|
| Province | Study Site | 1990–2000 | 2000–2008 | 2008–2014 | 2014–2016 | 2016–2018 | Before SBP | After SBP | Difference (in Percentage Points) |
| Napo *** | Chontapunta (1) | −1.21% | −0.95% | −1.32% | −1.38% | −1.66% | −1.094% | −1.401% | −0.306 |
| Ahuano (2) | 0.00% | 0.00% | −0.03% | 0.00% | 0.00% | 0.000% | −0.020% | −0.020 | |
| Napo *** | Carlos Julio Arosemena Tola (3) | −0.54% | −0.77% | −1.17% | −0.61% | −1.03% | −0.644% | −1.032% | −0.388 |
| Rukullacta (4) | 0.02% | −0.01% | 0.02% | 0.06% | −0.04% | 0.007% | 0.014% | 0.007 | |
| Orellana *** | San Jose de Dahuano (5) | −1.80% | −2.77% | −2.21% | −0.81% | −2.78% | −2.230% | −2.043% | 0.187 |
| Ávila (6) | −0.02% | −0.09% | 0.08% | 0.02% | −0.01% | −0.049% | 0.048% | 0.097 | |
| Pastaza | Arajuno (7) | 0.03% | −0.43% | −0.95% | −0.10% | −0.24% | −0.173% | −0.636% | −0.464 |
| Canelos (8) | −0.12% | −0.04% | −0.18% | −0.03% | −0.18% | −0.108% | −0.103% | 0.005 | |
| Province | Study Site | SBP | Non-SBP | Absolute Difference (in Percentage Points) |
|---|---|---|---|---|
| Napo | Ahuano (2) | 0.00% | −0.19% | 0.19 |
| Napo | Rukullacta (4) | 0.00% | −1.25% | 1.25 |
| Orellana | Ávila (6) | −0.09% | −2.37% | 2.28 |
| Pastaza | Canelos (8) | −0.08% | −1.54% | 1.46 |
| Before SBP | After SBP | |||||||||
|---|---|---|---|---|---|---|---|---|---|---|
| Coef. | t | p > |t| | 95% Conf. Interval | Coef. | t | p > |t| | 95% Conf. Interval | |||
| Distance | −0.0578 | −3.78 | 0.004 | −0.0924 | −0.0232 | −0.0338 | −3.58 | 0.006 | −0.0552 | −0.0124 |
| (0.0153) | (0.0094) | |||||||||
| Constant | −0.4114 | −4.55 | 0.001 | −0.6161 | −0.2067 | −0.1445 | ||||
| (0.0905) | (0.0559) | −2.59 | 0.029 | −0.2713 | −0.0185 | |||||
| DF | 9 | 9 | ||||||||
| Adj R-squared | 0.5706 | 0.5415 | ||||||||
Publisher’s Note: MDPI stays neutral with regard to jurisdictional claims in published maps and institutional affiliations. |
© 2021 by the authors. Licensee MDPI, Basel, Switzerland. This article is an open access article distributed under the terms and conditions of the Creative Commons Attribution (CC BY) license (https://creativecommons.org/licenses/by/4.0/).
Share and Cite
Gordillo, F.; Eguiguren, P.; Köthke, M.; Ferrer Velasco, R.; Elsasser, P. Additionality and Leakage Resulting from PES Implementation? Evidence from the Ecuadorian Amazonia. Forests 2021, 12, 906. https://doi.org/10.3390/f12070906
Gordillo F, Eguiguren P, Köthke M, Ferrer Velasco R, Elsasser P. Additionality and Leakage Resulting from PES Implementation? Evidence from the Ecuadorian Amazonia. Forests. 2021; 12(7):906. https://doi.org/10.3390/f12070906
Chicago/Turabian StyleGordillo, Fernando, Paul Eguiguren, Margret Köthke, Rubén Ferrer Velasco, and Peter Elsasser. 2021. "Additionality and Leakage Resulting from PES Implementation? Evidence from the Ecuadorian Amazonia" Forests 12, no. 7: 906. https://doi.org/10.3390/f12070906
APA StyleGordillo, F., Eguiguren, P., Köthke, M., Ferrer Velasco, R., & Elsasser, P. (2021). Additionality and Leakage Resulting from PES Implementation? Evidence from the Ecuadorian Amazonia. Forests, 12(7), 906. https://doi.org/10.3390/f12070906