Article

Pollination Potential of Riparian Hardwood Forests—A Multifaceted Field-Based Assessment in the Vistula Valley, Poland

1
Institute of Geography and Spatial Organization, Polish Academy of Sciences, Twarda 51/55, 00-818 Warsaw, Poland
2
Department of Biology, Faculty of Building Services, Hydro and Environmental Engineering, Warsaw University of Technology, Nowowiejska 20, 00-653 Warsaw, Poland
*
Author to whom correspondence should be addressed.
Forests 2021, 12(7), 907; https://doi.org/10.3390/f12070907
Submission received: 12 May 2021 / Revised: 7 July 2021 / Accepted: 7 July 2021 / Published: 12 July 2021
(This article belongs to the Special Issue Ecosystem Services Provided by Riparian Forests)

Abstract

:
Riparian forests with oaks, ashes and elms, now highly fragmented and rare in Europe, are considered hotspots for ecosystem services. However, their capacity to provide pollination seems to be quite low, although reports from in-situ research supporting this view are scarce. Our goal was therefore to thoroughly assess their pollination potential based on multifaceted field measurements. For this, we selected six test sites with well-developed riparian hardwood forests, located in the agricultural landscape along the middle Vistula River in Poland. We used seven indicators relating to habitat suitability (nesting sites and floral resources) and pollinator abundance (bumblebees and other Apoidea) and propose a threshold value (AdjMax) based on value distribution and Hampel’s test to indicate the level of pollination potential for this type of riparian forest. The obtained AdjMax for bumblebee density was 500 ind. ha−1, for Apoidea abundance—0.42 ind. day−1, while for nectar resources—200 kg ha−1. We demonstrate that the investigated small patches of the riparian hardwood forest have a higher pollination potential than reported earlier for riparian and other broadleaved temperate forests, but the indicators were inconsistent. As forest islands in the agricultural landscape, riparian hardwood forests play an important role in maintaining the diversity and abundance of wild pollinators, especially in early spring when there is still no food base available elsewhere.

1. Introduction

The concept of ecosystem services (ES) describes the relations linking ecological systems with social systems by adopting the anthropocentric approach. It focuses on the benefits provided by nature to humans. The concept originated in economic sciences; however, it is transdisciplinary, taking over the terminology and research methods from both the natural, as well as social and economic sciences. The ecological perspective focuses on the condition of ecosystems understood as specific dynamic structural and functional spatial systems composed of a biocoenosis and a biotope. Social perspective deals with the benefits derived from ES and their impact on human well-being [1]. The ES concept distinguishes between ecosystem functions, basic ecological processes, and biophysical structures. In this understanding, functions are created by various combinations of processes and structures and constitute the potential of ecosystems to provide services, regardless of whether they are currently used by people or not [2]. In line with this approach, the value of any ecosystem can be determined in relation to the potential or actual amount of goods and services delivered [3]. Within the management-oriented perspective, priority status should be given to assessments of ES potentials [3,4,5], since the knowledge obtained can be used to make the exploitation of natural resources and land use more sustainable [6,7]. Currently, the major challenge is to propose reliable tools to assess ES potential. Studies describing and quantifying ES potential using biophysical ecosystem-condition-related indicators are still scarce, especially in riparian forests.
Riparian forests with oaks, ashes and elms (Ficario-Ulmetum minoris—code 91F0) are valuable ecosystems protected by the EU Habitats Directive. They grow along large lowland rivers on the floodplains within the range of episodic inundations and are important elements of riverine ecological corridors. Nowadays, they are highly fragmented and quite rare in Europe, mainly due to river engineering and deforestation for agriculture [8]. Moreover, recent studies of monitored sites indicate an unfavorable conservation status, with negative trend reported by most EU Member States [9]. Most riparian hardwood forests are characterized by an altered water regime due to drainage and embankments, which limits floods and alluvial processes, contributing to changes in soil conditions and vegetation. Since hardwood is a valuable raw material, those forests are usually heavily exploited for timber, which results in the simplification of tree stand composition and structure and a low amount of deadwood [10]. Despite the high level of overall disturbance, the remaining small forest patches form important refuge habitats in agricultural landscapes and are home to many wild plants and animals [11].
Late successional riparian forests are among the very few terrestrial temperate ecosystems that may be regarded as true multiservice hotspots. They have the capacity to efficiently provide various services from all three main ES sections: provisioning, regulating and cultural [1,12]. A recent comprehensive study on the regulating potential of ash and elm riparian forests highlighted their high ability to maintain soil biological activity, mitigate global climate change, regulate local climate and water flow, as well as to contribute to natural water retention [13]. However, for some other services (including pollination) their potential appears to be rather low [12]. In this paper we elaborated further on the complex issue of pollination ecosystem potential, and on the example of riparian hardwood forests discussed the ways in which it can be reliably assessed.
Pollination by living organisms represents a vital regulating ecosystem service and is included in most of ES classifications [2,14]. Pollinators are inseparably linked to human well-being as they have an impact on maintaining ecosystem health and function, sustaining populations of wild plants, crop production and food security [15]. Animal-mediated pollination is fundamental for both wild plant communities [16] and agricultural ecosystems [17,18]. An estimated 87.5% of flowering plant species are pollinated by animals [16], and bees achieve the numerical dominance as flower visitors worldwide, and are more effective pollinators than non-bees [19]. Of the more than 16,000 bee species described worldwide [20], honey bees (Apis mellifera), bumblebees (Bombus spp.), leaf-cutting bees (Megachile spp.) and mason bees (Osmia spp.) have been recognized as the most efficient crop pollinators [21].
Despite the progress in the defining of services in recent years and increasing scientific rigor in the use of indicators, there is still a wide margin of discretion in this field and there are no approaches generally accepted as a standard [1]. Egoh et al. [22] pointed out that the quantification of regulating services, contrary to provisioning ES, is less straightforward, and thus, has to be based on proxy data and indirect indicators. Current knowledge on ES provided by bees has been obtained from a variety of methodological approaches ranging from field observations to manipulative controlled experiments [23]. Pollination is a very site-specific ecological process and therefore requires much higher resolution of source data than many other generic regulating ES [22]. Given objective difficulties with the direct calculation of pollination potential, proxy indicators are usually applied [24]. For instance, Burkhard et al. [25] proposed the amount of plant products, distribution of plants and availability of pollinators as measures of ecosystem potential to provide pollination. Affek [26] developed a complex ecosystem-condition-related indicator of pollination potential based on the newly introduced definition of ES potential suited for estimating bee services. He assessed potentials of various temperate ecosystems and calibrated it with available entomological data; however, his estimates were not verified by field measurements.
Whenever a complex and hardly quantifiable phenomenon is to be quantified, one of the key issues is the construction of an adequate and reliable measure. Simple measures refer only to some selected aspect of the phenomenon, while more comprehensive information is provided by complex indicators (sometimes called indices) being a mathematical combination of partial measures [1]. The question arises whether the simple, partial indicators relating to different aspects of the service show the same picture (how consistent they are). Partial measures can relate either to complementary, independent aspects of the service, or simply duplicate the information by referring to the same aspect. One of the ways to verify the validity of an indicator (how well it measures what it is supposed to measure) is to cross-check how it correlates with another indicator taken as representative of the construct.
The main goal of this work was to assess the potential of riparian hardwood forests to provide pollination based on multifaceted measurements of ecosystem condition. Our specific objectives were to:
  • Develop a comprehensive set of indicators to measure pollination potential;
  • Calculate indicator values and propose the level of an indicator (based on the distribution of values) reflecting the potential of an ecosystem type;
  • Determine mutual relations among indicators.
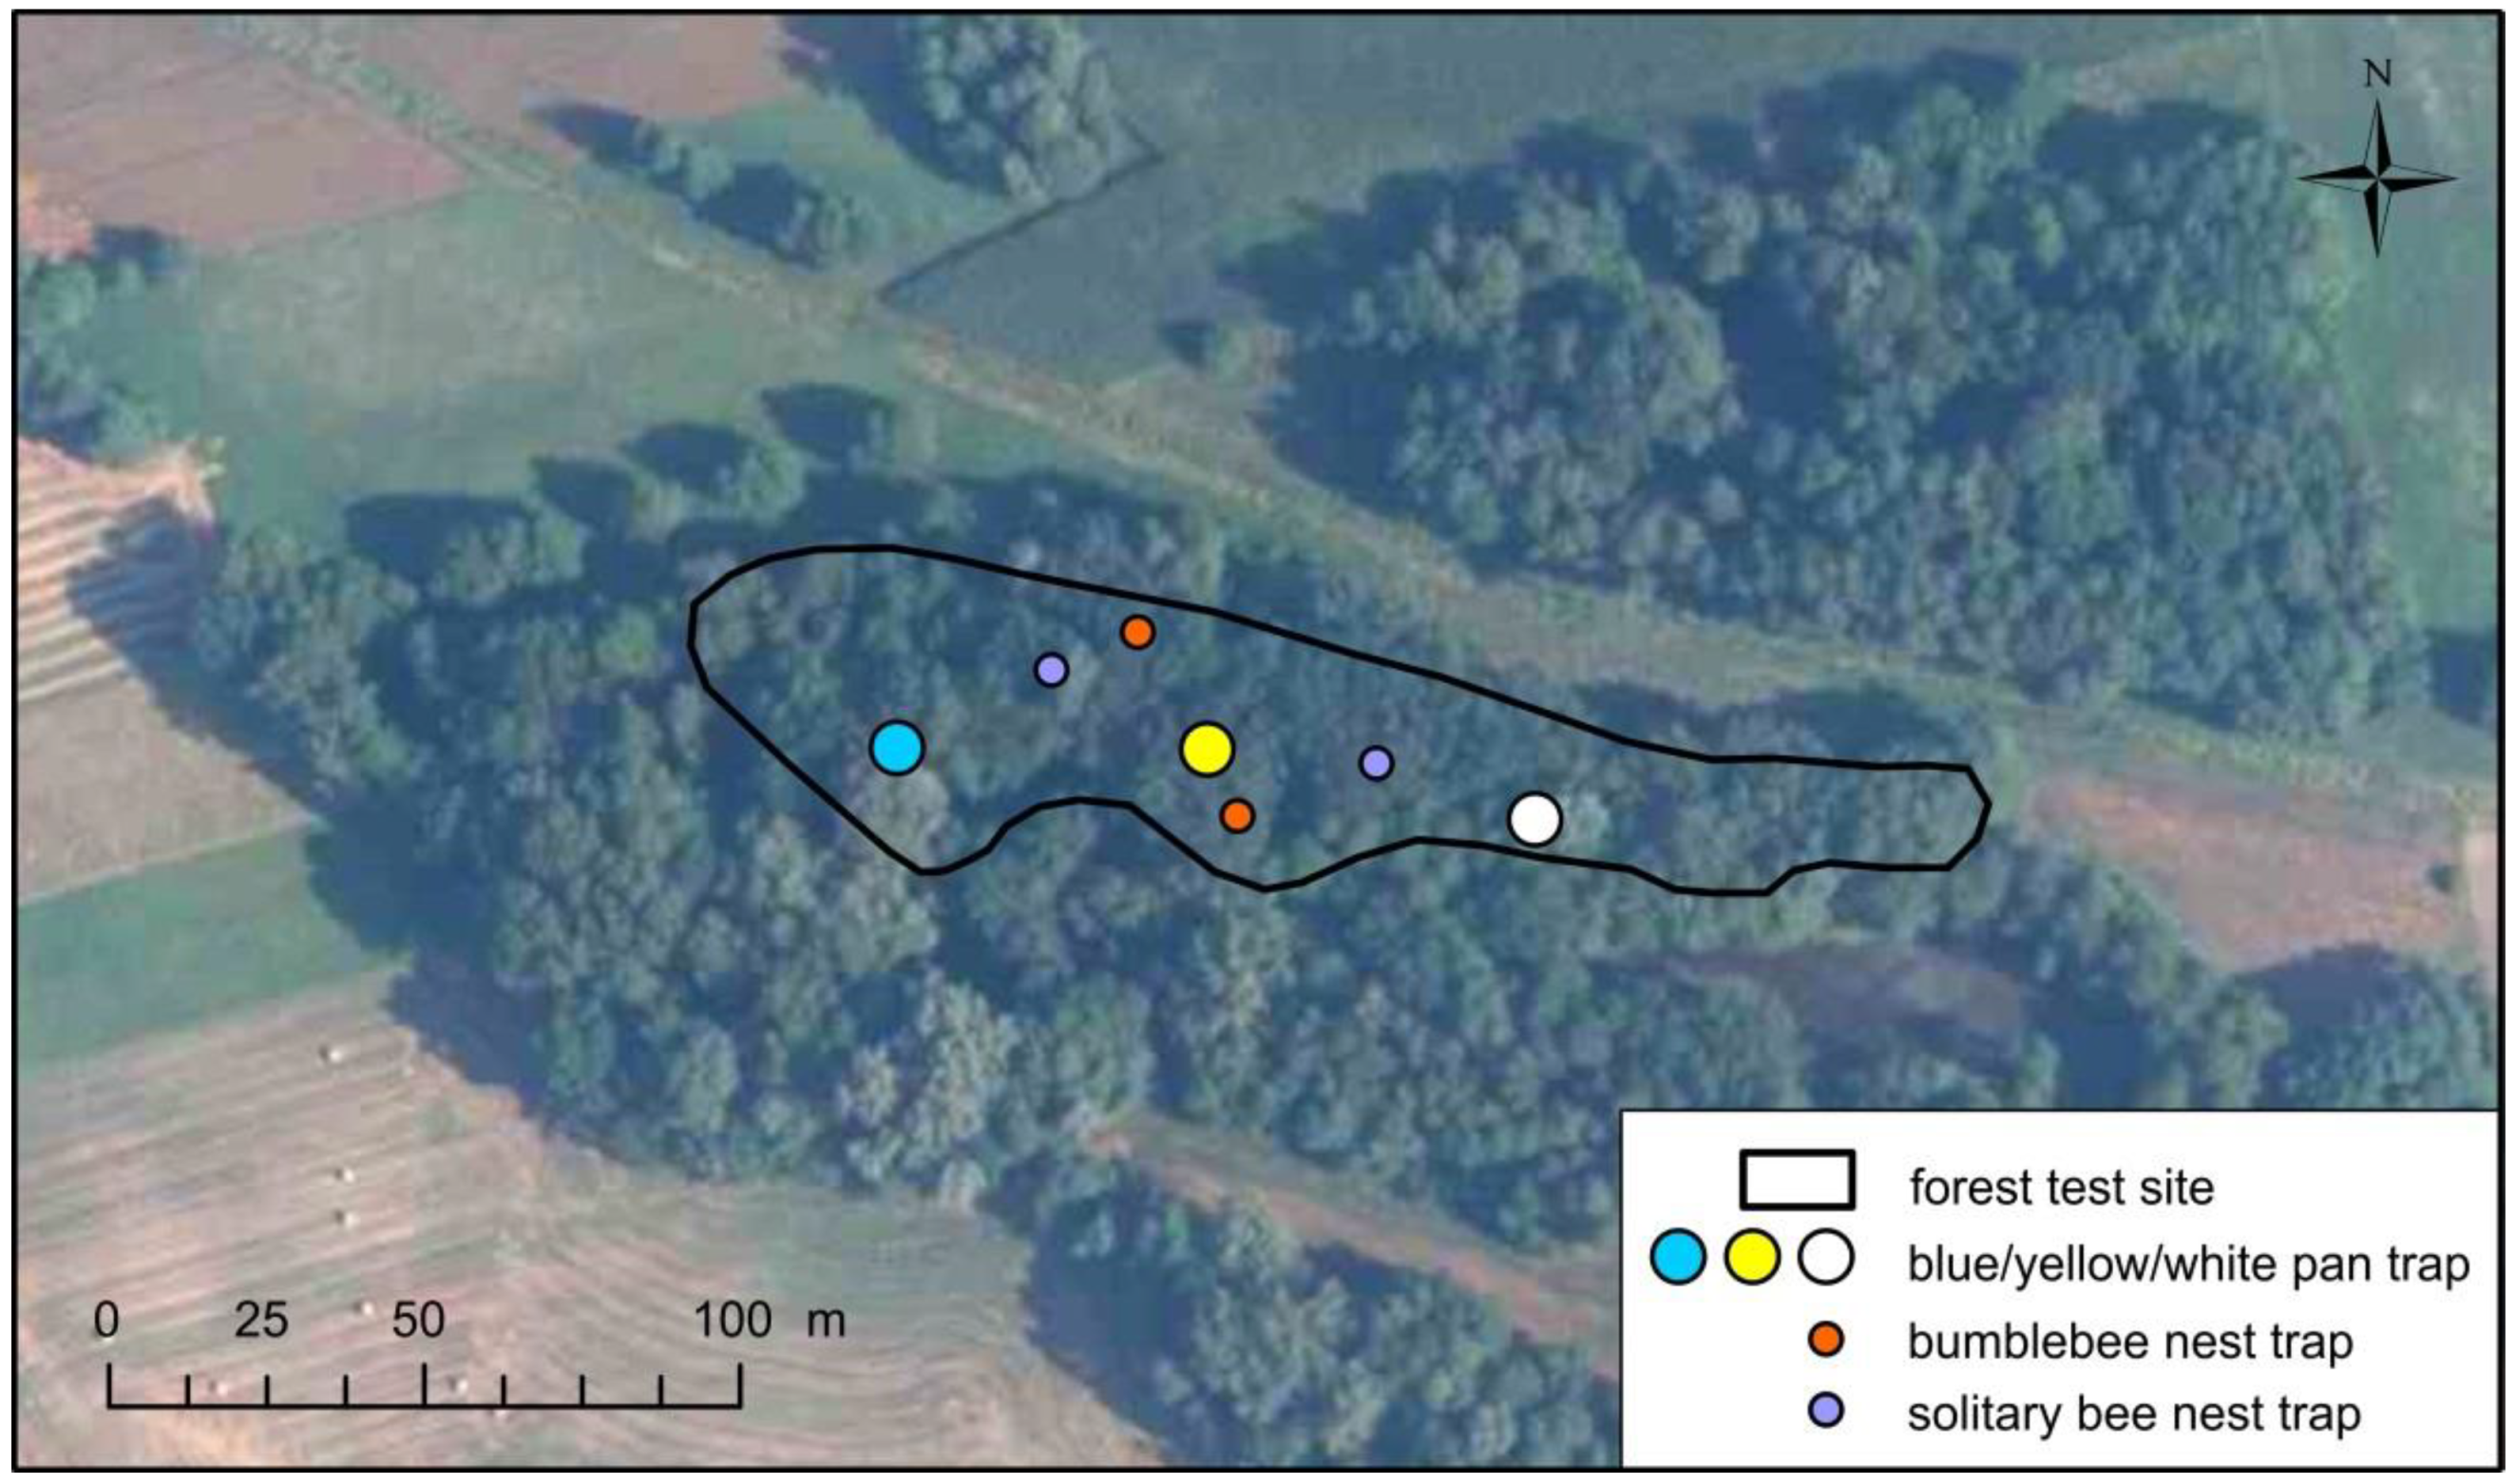
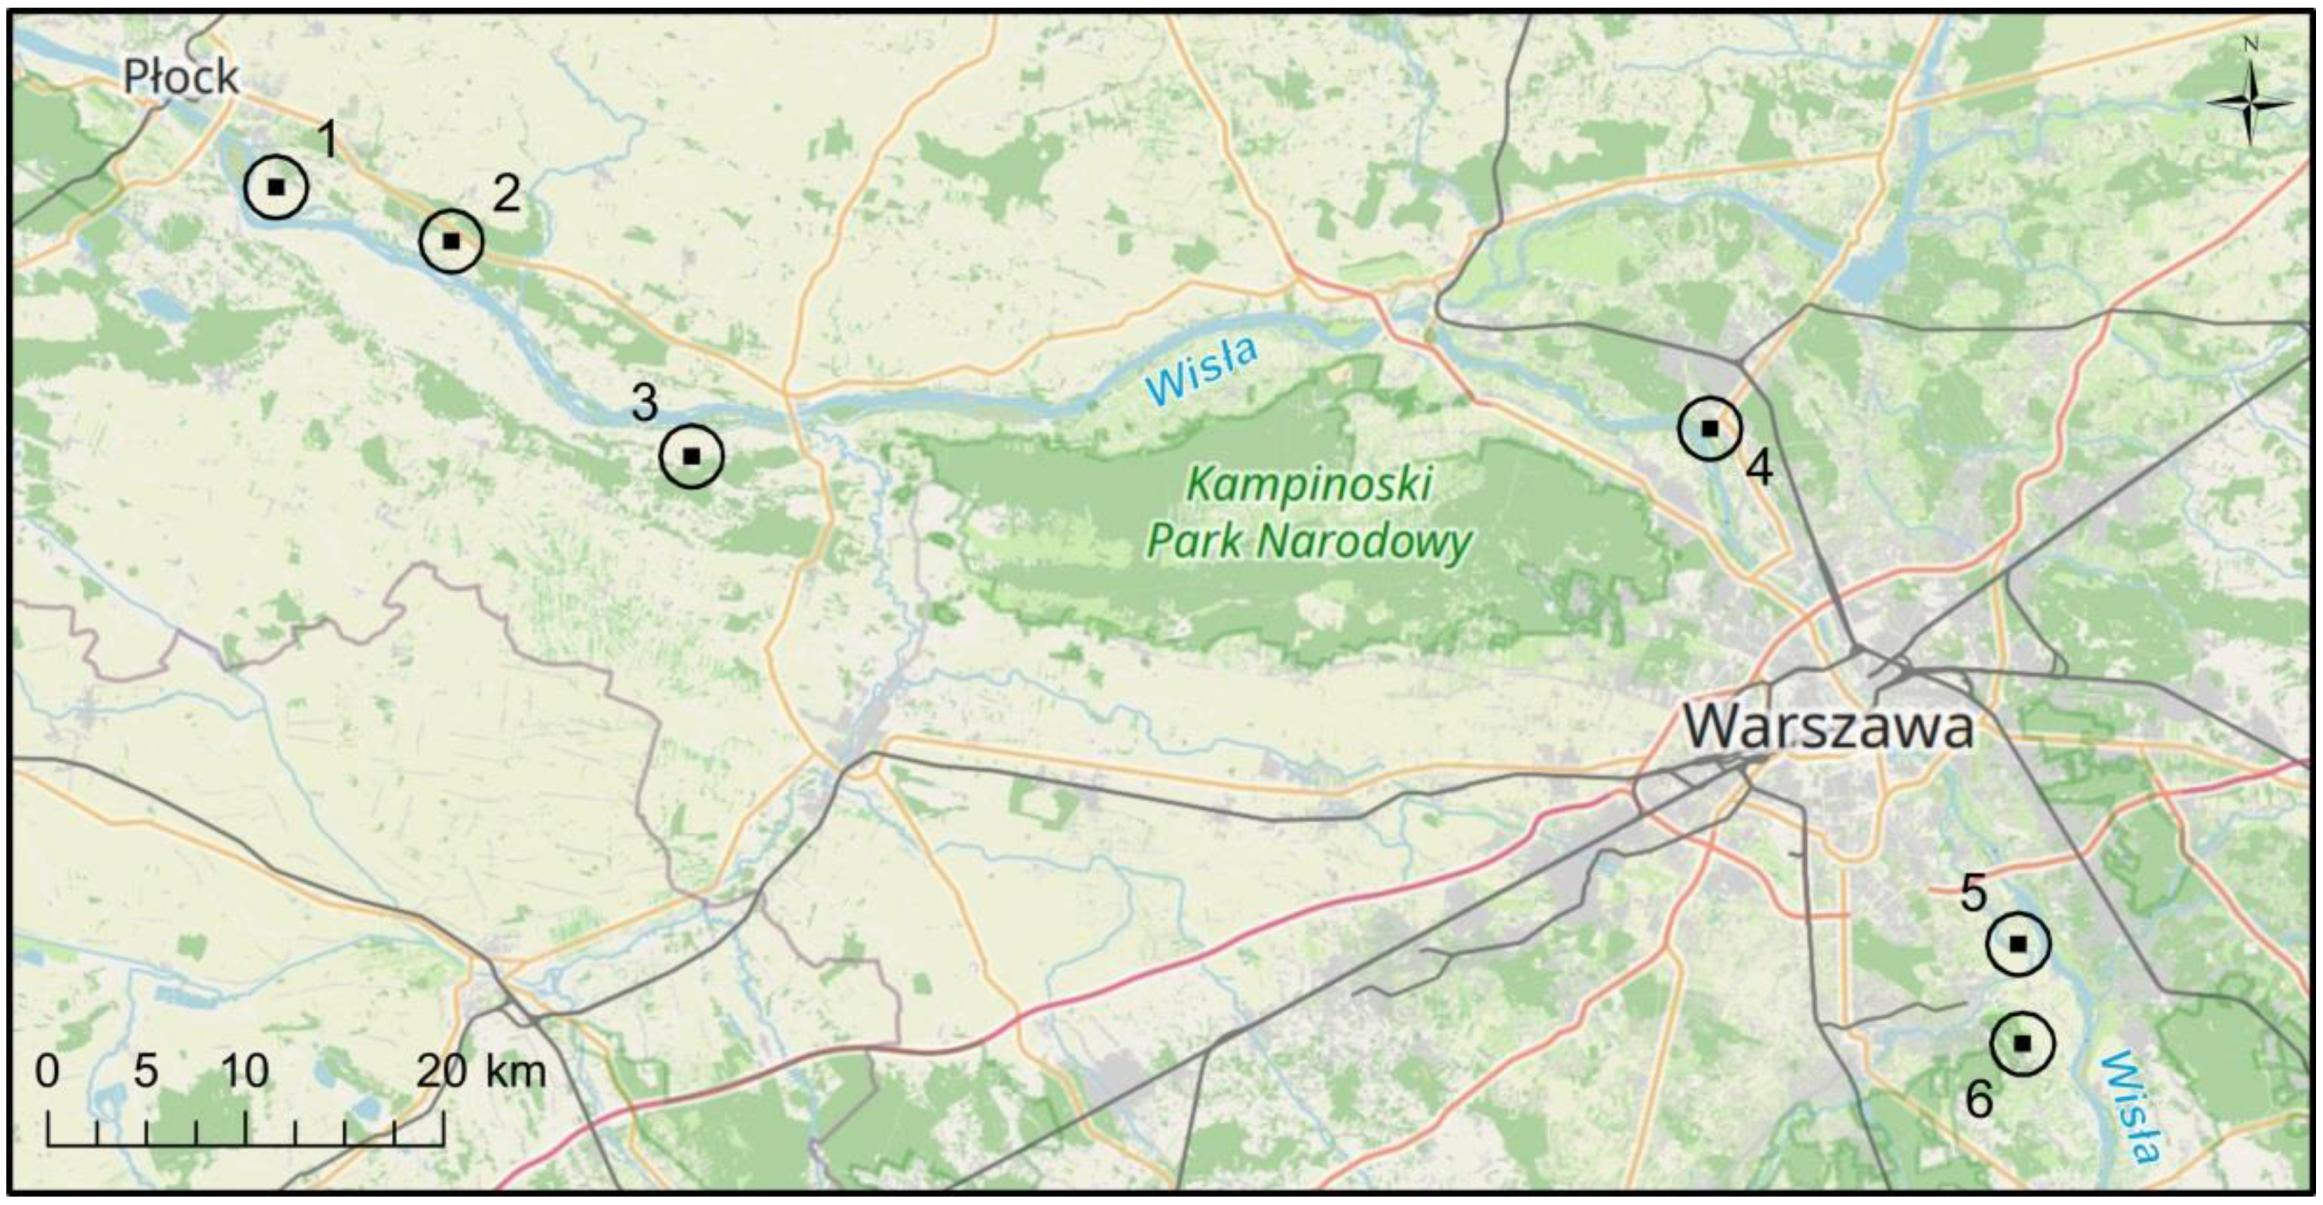
Our approach is innovative as we assessed the pollination potential in the field using a set of complementary indicators that address simultaneously different aspects of ecosystem condition: pollinator nesting suitability, flower resources and pollinator abundance.

2. Study Area

Our study area was the middle Vistula valley in Poland (Figure 1). Six test sites representing well-preserved ash-elm riparian forest ecosystems were selected from over 50 visited during field surveys. The surveys were preceded by an analysis of aerial photographs, forest and vegetation maps of the Vistula valley [27], on the basis of which the location of all patches of ash-elm riparian forests above 0.4 ha was determined. We followed several criteria when selecting test sites (to show the potential of an ecosystem type):
-
Plant community should be unambiguously recognized in the field as Ficario-Ulmetum minoris association;
-
Sites should not be subject to strong human pressure, without any recent visible human impact (timber extraction etc.);
-
Tree stand should be older than 60 years.
When delimiting the test sites, we took account of tree stand composition and precise LiDAR-derived digital elevation models. All of the selected sites were relatively small forest patches (0.4–4.0 ha) embedded in the agricultural landscape, with high native plant biodiversity and some introduced species (see Supplementary materials, Table S1; see also [28] for the broader description of the sites).

3. Materials and Methods

We used the most recent version of the Common International Classification of Ecosystem Services (CICES 5.1) [14] as the framework of our research. Pollination service belongs to the Regulation & Maintenance section and Regulation of physical, chemical, biological conditions division in the CICES ver. 5.1. It can be further described as: the fertilization of plants by wild pollinators that maintains or increases the abundance and/or diversity of species that people use or enjoy.
Out of numerous available definitions of the potential of ecosystems, we followed the one proposed by Burkhard et al. [25]. It states that the potential of ecosystems is the ability to provide services conditioned by natural factors (climate, terrain, habitat, potential vegetation) and human activity (land use, pollution, etc.). However, for the purpose of a pollination service assessment, we used a more detailed, operational definition of potential [26]. It states that the potential of an ecosystem type is a theoretical service supply calculated for the environmental setting best suited for providing pollination (for example as regards flower and nesting resources, but still fulfilling the characteristics of a given ecosystem type).
To determine the potential of riparian hardwood forests to provide pollination, it was necessary to propose adequate and informative measures. To this end, a set of 7 indicators has been developed by reference to different characteristics of ecosystem condition, comprising environmental quality (physical and chemical) and structural and functional ecosystem attributes (biological quality) (Table 1) [29]. They are all based on proven regularities linking ecosystem condition with potential provision of pollination [26]. Data collected by the authors in the field in the spring and summer of 2017 and 2018 served as the basis for the assessment. As our aim was to assess the potential of one ecosystem type and not the potential of an entire landscape, we did not include landscape scale indicators.

3.1. Indicators of Pollination Potential

Because the concept of ecosystem services primarily considers the contribution of the living world (biotic) to human well-being, the pollination ES relates only to activities undertaken by living organisms—pollinators, bypassing the role of e.g., wind. According to literature reports [17,30,31] the most important animals pollinating the flowers are bees (Apoidea); therefore, we focused in our research on this insect superfamily. We paid special attention to bumblebees (genus Bombus belonging to Apoidea), because they are key pollinators in temperate forest ecosystems [32,33].
We considered the pollination potential of riparian forest ecosystems at 2 levels:
(I)
The potential of the habitat for the occurrence and reproduction of pollinating insects;
(II)
The potential of pollinating insects that are present in riparian hardwood forests for pollination of nearby crops.

3.1.1. Habitat Potential

As part of the estimation of the potential of the habitat for the occurrence and reproduction of pollinating insects, we analyzed 2 basic habitat parameters: (1) suitability for nesting and (2) availability of food resources [34]. We investigated nesting suitability in 2 ways: (1a) as the availability of potential nesting sites and (1b) readiness/potential to inhabit artificial nesting sites (so-called nest traps) placed in the riparian hardwood forests.
Nest sites vary between bumblebee species. Most of the more common species prefer dry, dark cavities. Forest bumblebees often nest in the ground (in dry abandoned burrows of rodents, small pits and holes), but in riparian forests, high water levels and high soil moisture constitute a major barrier to ground nesting. Therefore, our first measure of the availability of potential nesting sites was the topsoil dryness (100-gravimetric water content). Other cues for site selection were not considered (e.g., aeration, compaction, exposition). For this purpose, 22 undisturbed 100 cm3 soil samples were collected in May, 2–4 on each forest test site. Other bumblebee species build nests in tree cavities, so another proposed measure was the diameter (DBH) of the largest tree. We assumed that the larger the trees the more cavities and holes they have suitable for nesting, and that they also have complex root structures which, in turn, are good nesting sites for ground nesting species. We measured all trees in 18 plots (3 × 100 m2 plots per test site located along the 200 m transect) and took the largest measured DBH per plot as an indicator value.
The readiness for pollinators to settle on artificial nests was investigated by mounting nest traps. We laid out 2 traps specially designed for bumblebees (Figure 2) and 2 dedicated for solitary bees that nest in stems (Figure 3) on each forest test site in early spring. In total, we installed 24 nest traps.
We mounted the nest traps for bumblebees on tree trunks up to 50 cm above the ground (not on the ground to avoid flooding), while traps for solitary bees were also set on tree trunks, but at a height of approx. 2 m from the southern side. The nest traps were built of wood with roofs protected with eco-friendly paint. Those for bumblebees had an inlet opening and an additional ventilation opening secured with a fine mesh. We padded the interior with hay taken from rodent cages from pet stores. In turn, nest traps for solitary bees were filled with reed stems, with the possibility of their removal and replacement, and the inlet was protected from birds and mammals by a metal mesh with a distance of min. 3 cm. The traps were produced by Ussuri (www.ussuri.pl, accessed on 23 December 2020), a company specializing in the design and construction of breeding boxes for animals, including insects.
We checked the occupancy degree of nest traps regularly along the growing season and monitored the number of capped stems in solitary bee nest traps. In October, we photographed the fronts of the traps to count the percentage of capped stems. Then we removed the stems, packed them into cloth pouches and transported them to the laboratory to identify the insects after the adult form (imago) emerged from the cocoons.
To estimate the availability of food resources for wild pollinators we used: (1) Data on the cover of melliferous plant species in the undergrowth and in the layer of shrubs and trees; and (2) Information on the honey potential of individual plant species. The measure of the size of the food resources was the total annual amount of honey that can be produced from the nectar of flowers per unit area. We estimated the cover of each plant species in each layer using the phytosociological method [35]. A total of 51 phytosociological relevés were taken across the 6 forest test sites (see Supplementary materials, Table S1 for details). For quantitative analyses, we reclassified the Braun-Blanquet cover-abundance scale used in the field to the mean plant cover percentage scale (+ 0.1%; 1 5%; 2 17.5%; 3 37.5%; 4 62.5%; 5 87.5%) [35].
We identified honey plant species based on literature reports [36,37,38,39,40]. We took the honey potential of individual species (in kg ha−1), primarily from the Great Atlas of Honey Plants [40], supplemented by other works [37,38,41]. The abovementioned Atlas contains information on nectar and pollen production for over 250 plant species, obtained in multi-season studies using the methodology described by Jabłoński [42]. The data include only a single flowering of a given plant in the season. Due to the fact that some melliferous plants in the test sites have been observed to bloom more than once (e.g., from the Lamiaceae family), we assumed that this phenomenon reduces the overestimation of nectar production resulting from less favorable than optimal habitat and light conditions recorded in riparian forests (compare e.g., [38,43]). For some melliferous species for which no precise quantitative data were found in the literature, honey potential was estimated on the basis of indirect data (e.g., calculated honey potentials for similar species). When estimating the cover of melliferous species in the undergrowth and the total honey potential of that layer, the melliferous tree species (e.g., Prunus padus L., Acer spp.) were excluded since they do not bloom in the juvenile phase.

3.1.2. Pollinators Potential

As part of the estimation of the potential of pollinating insects occurring in riparian forests to pollinate nearby crops, 2 research methods were used: (1) Route method; and (2) Color pan traps. The first method aimed at determining the abundance of bumblebees, while the latter of all bees (Apoidea).
The route method is a widely used recording scheme to monitor the abundance of bumblebees across the world (see e.g., [44]), and is perceived as the most reliable in complex plant communities [45]. It usually involves identifying and counting insects foraging on flowers during a 20 min walk across the studied area on the distance of 200 m. In this method, the density of insects per hectare is obtained by extrapolating the abundance recorded on a strip of 200 m2 (200 m long and 1 m wide) [45]. In total, 51 observations were made, on average, once every 2 weeks during the period of bumblebee peak activity (April–July), on the same sunny day at all the sites.
Due to the small areas of the studied test sites and the generally low expected numbers of pollinating insects in the riparian forests, the use of a non-invasive route method would be insufficient to achieve the planned objective. For this reason, we decided to use the complementary method in the form of color pan traps, also known as Moericke traps. We followed the study design proposed by the U.S. National Protocol Framework for the Inventory and Monitoring of Bees [46]. The traps were color plastic pans with a diameter of 22 cm and a depth of 10 cm filled with a 5% aqueous solution of propylene glycol with the addition of a substance reducing the surface tension. We placed 3 pans (one white, yellow and blue) on the transect along the long axis of each test site, at a distance of 50 m from each other and from the forest edge (Figure 4). They were mounted on tree trunks at a height of approximately 1.8 m (Figure 5). Altogether, 18 traps were set up. Emptying and replacing the fluid occurred on average every 2 weeks from April to July. A total of 126 samples were collected, 24 in each of the 3 sites closer to Warsaw and 18 in each of the 3 sites closer to Płock. The number of bees found in the samples was divided by days of exposure. The number of bees caught daily in a given trap throughout the season was used as a final indicator of potential. The permission of the Regional Directorates of Environmental Protection in Warsaw and Płock was obtained for deliberate capture and killing of protected wild animal species.

3.2. Threshold Potential Values

Our next objective was to find the characteristics of the distribution of indicator values recorded in particular forest test sites and plots that would properly reflect the potential of an investigated ecosystem type. The maximum values are not robust to outliers resulting either from misconduct or recording true but extremely rare values (due to specific local conditions, coincidence of very unlikely and often temporary levels of various factors). Thus, they cannot represent the potential of an ecosystem type that can be achieved on a larger scale and over larger time horizon in a sustainable way. In turn, mean and median, being the measures of central tendency, show the average levels of actual capacity of sampled ecosystems, but not the potential of an ecosystem type. All the analyzed forest patches, although carefully selected and the closest possible to the model riparian hardwood forest, are not free from minor disturbances, and by being of relatively small size, they are also strongly influenced by the surrounding agricultural landscape. Based on the above, we propose to use the maximum values preceded by cutting off the outliers (AdjMax) to indicate the level of ecosystem potential. We have chosen the Hampel’s test [47] for detecting the outlying values. This test has become very popular in data mining and knowledge discovery due to its robustness [48]. It is based on calculating median (Me) and median absolute deviation (MAD), and also has no restrictions as to the size of the data set. According to Hampel’s test, an observation xi is identified as an outlier if:
xi – Me(x) > 4.5MAD(x)
where MAD(x) = Me|xi – Me(x)|

3.3. Joint Analysis

To compare the distribution of values among different partial pollination indicators, we needed to upscale the analysis to the site level (6 sites), as this was the lowest possible common level of analysis. Indicators with no variation (based on nest traps) were excluded from further work. We calculated potential values (AdjMax) within each test site and performed pairwise correlation analysis using Spearman’s rho coefficient, a nonparametric measure suitable for analyzing the strength of relationship when variables are not normally distributed.

4. Results

The potential of riparian hardwood forest ecosystems to provide pollination service was estimated using seven indicators assigned to two basic dimensions: habitat potential and pollinators’ potential (Table 2).

4.1. Habitat Potential

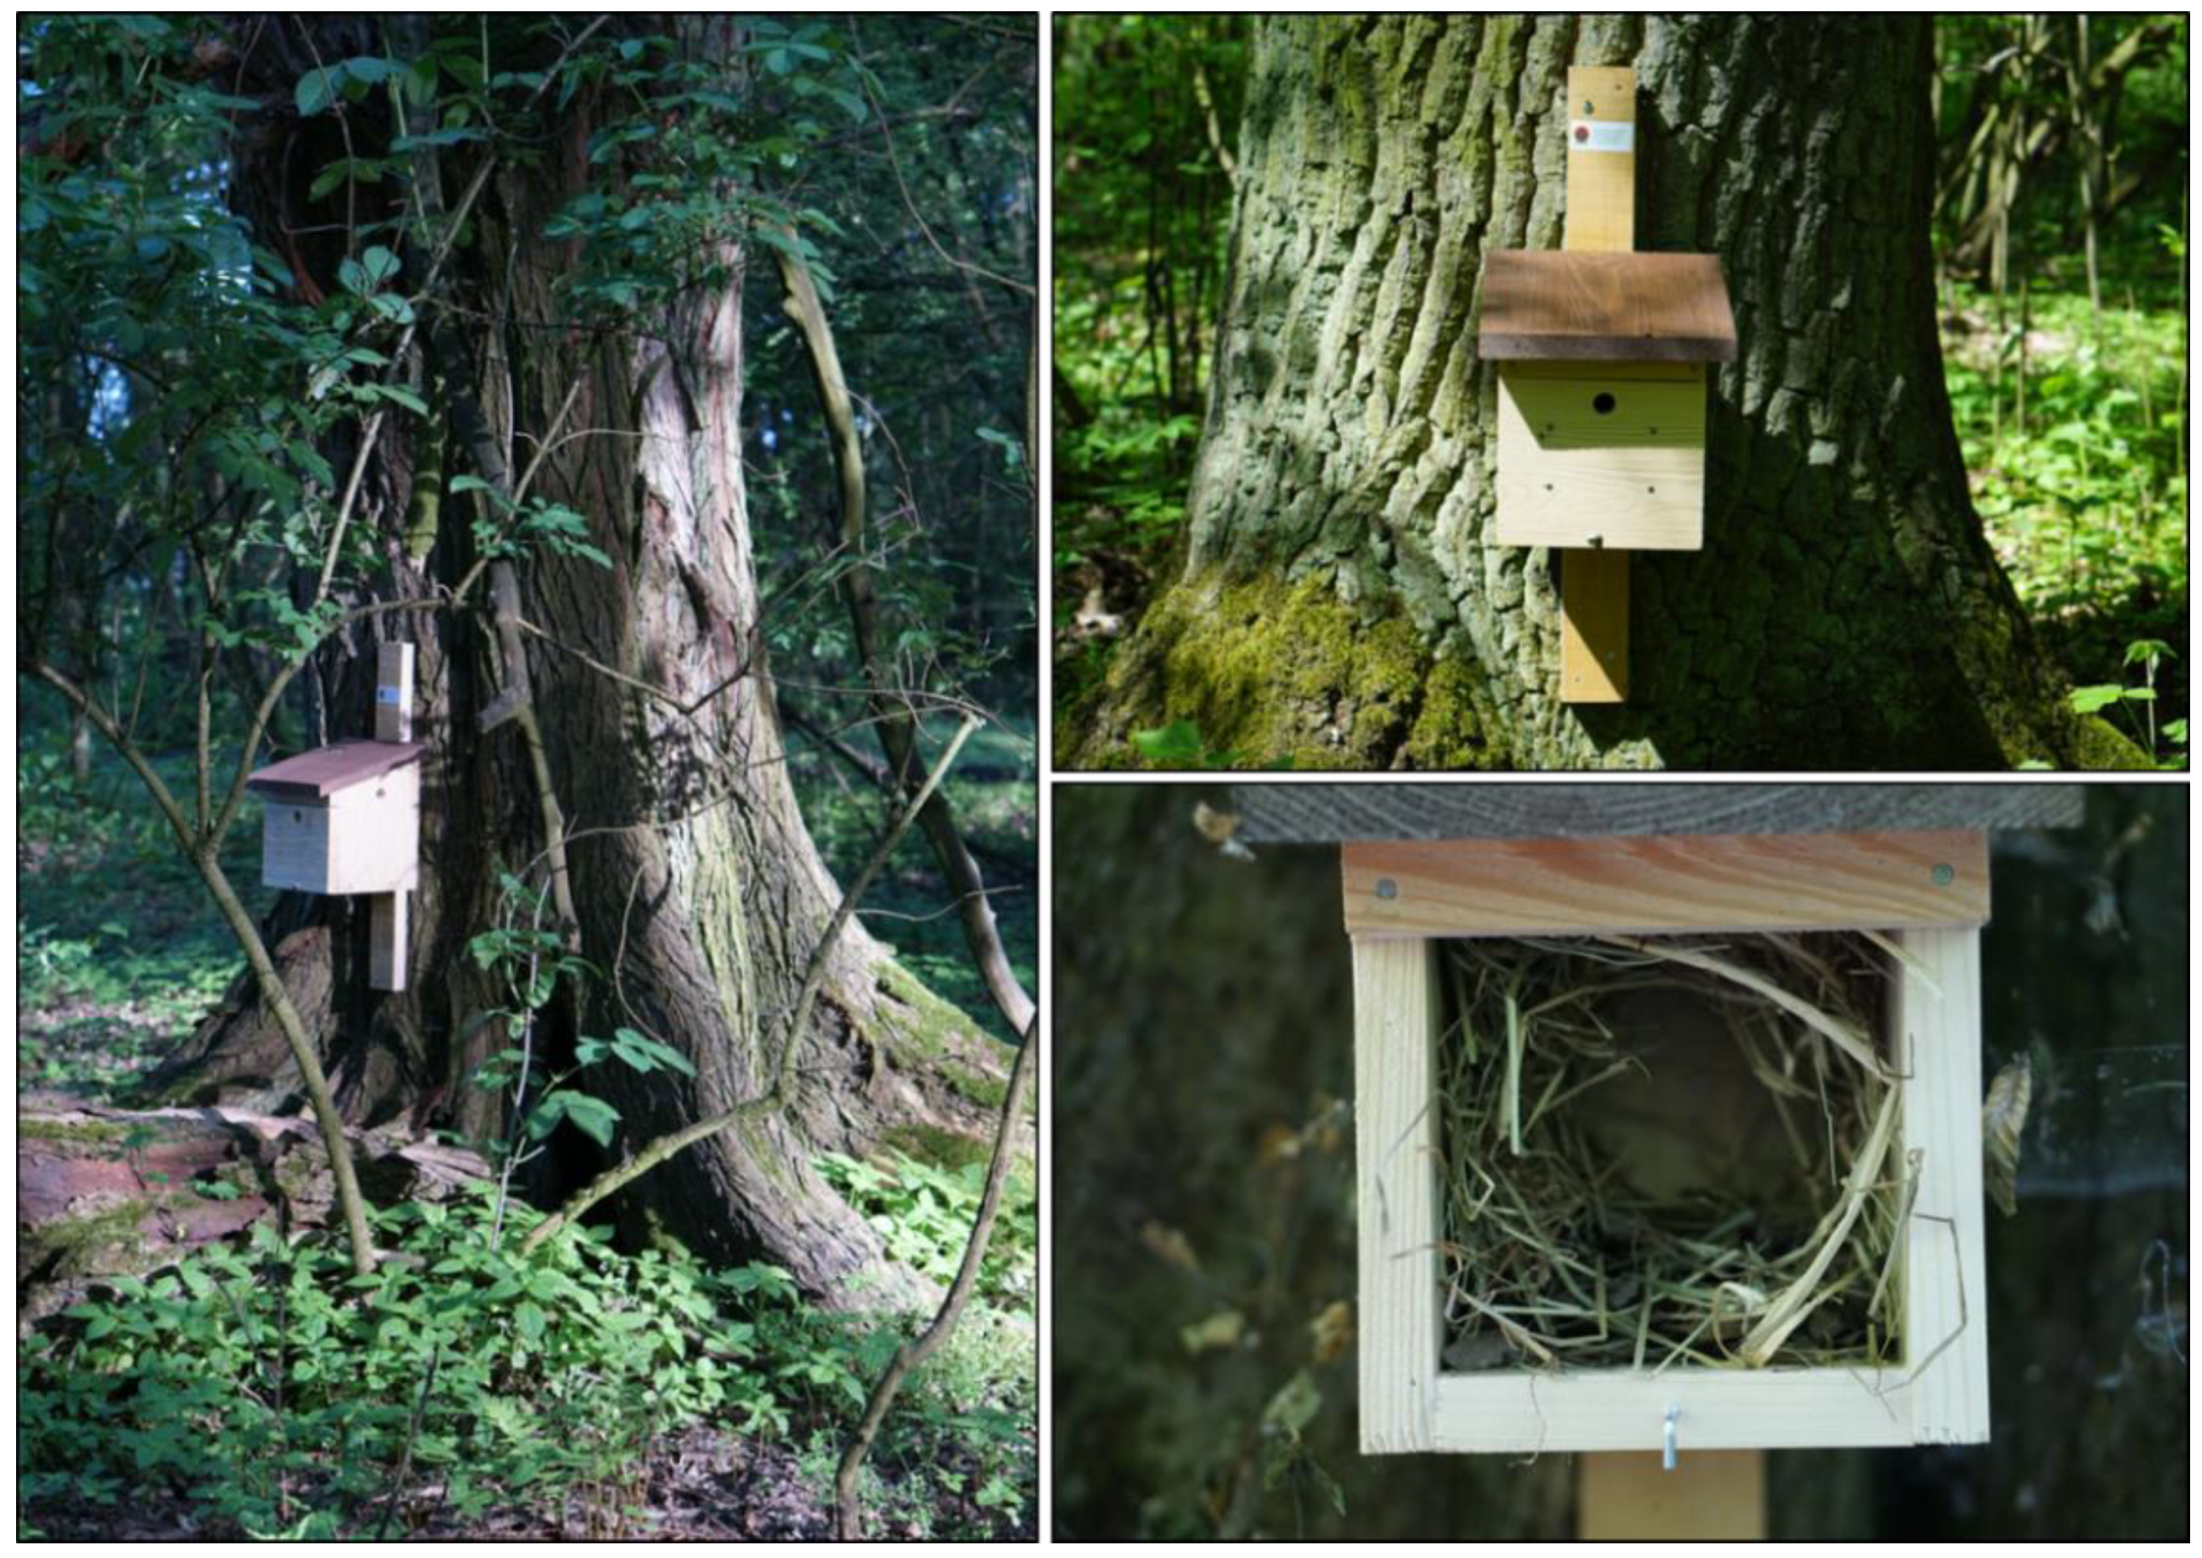
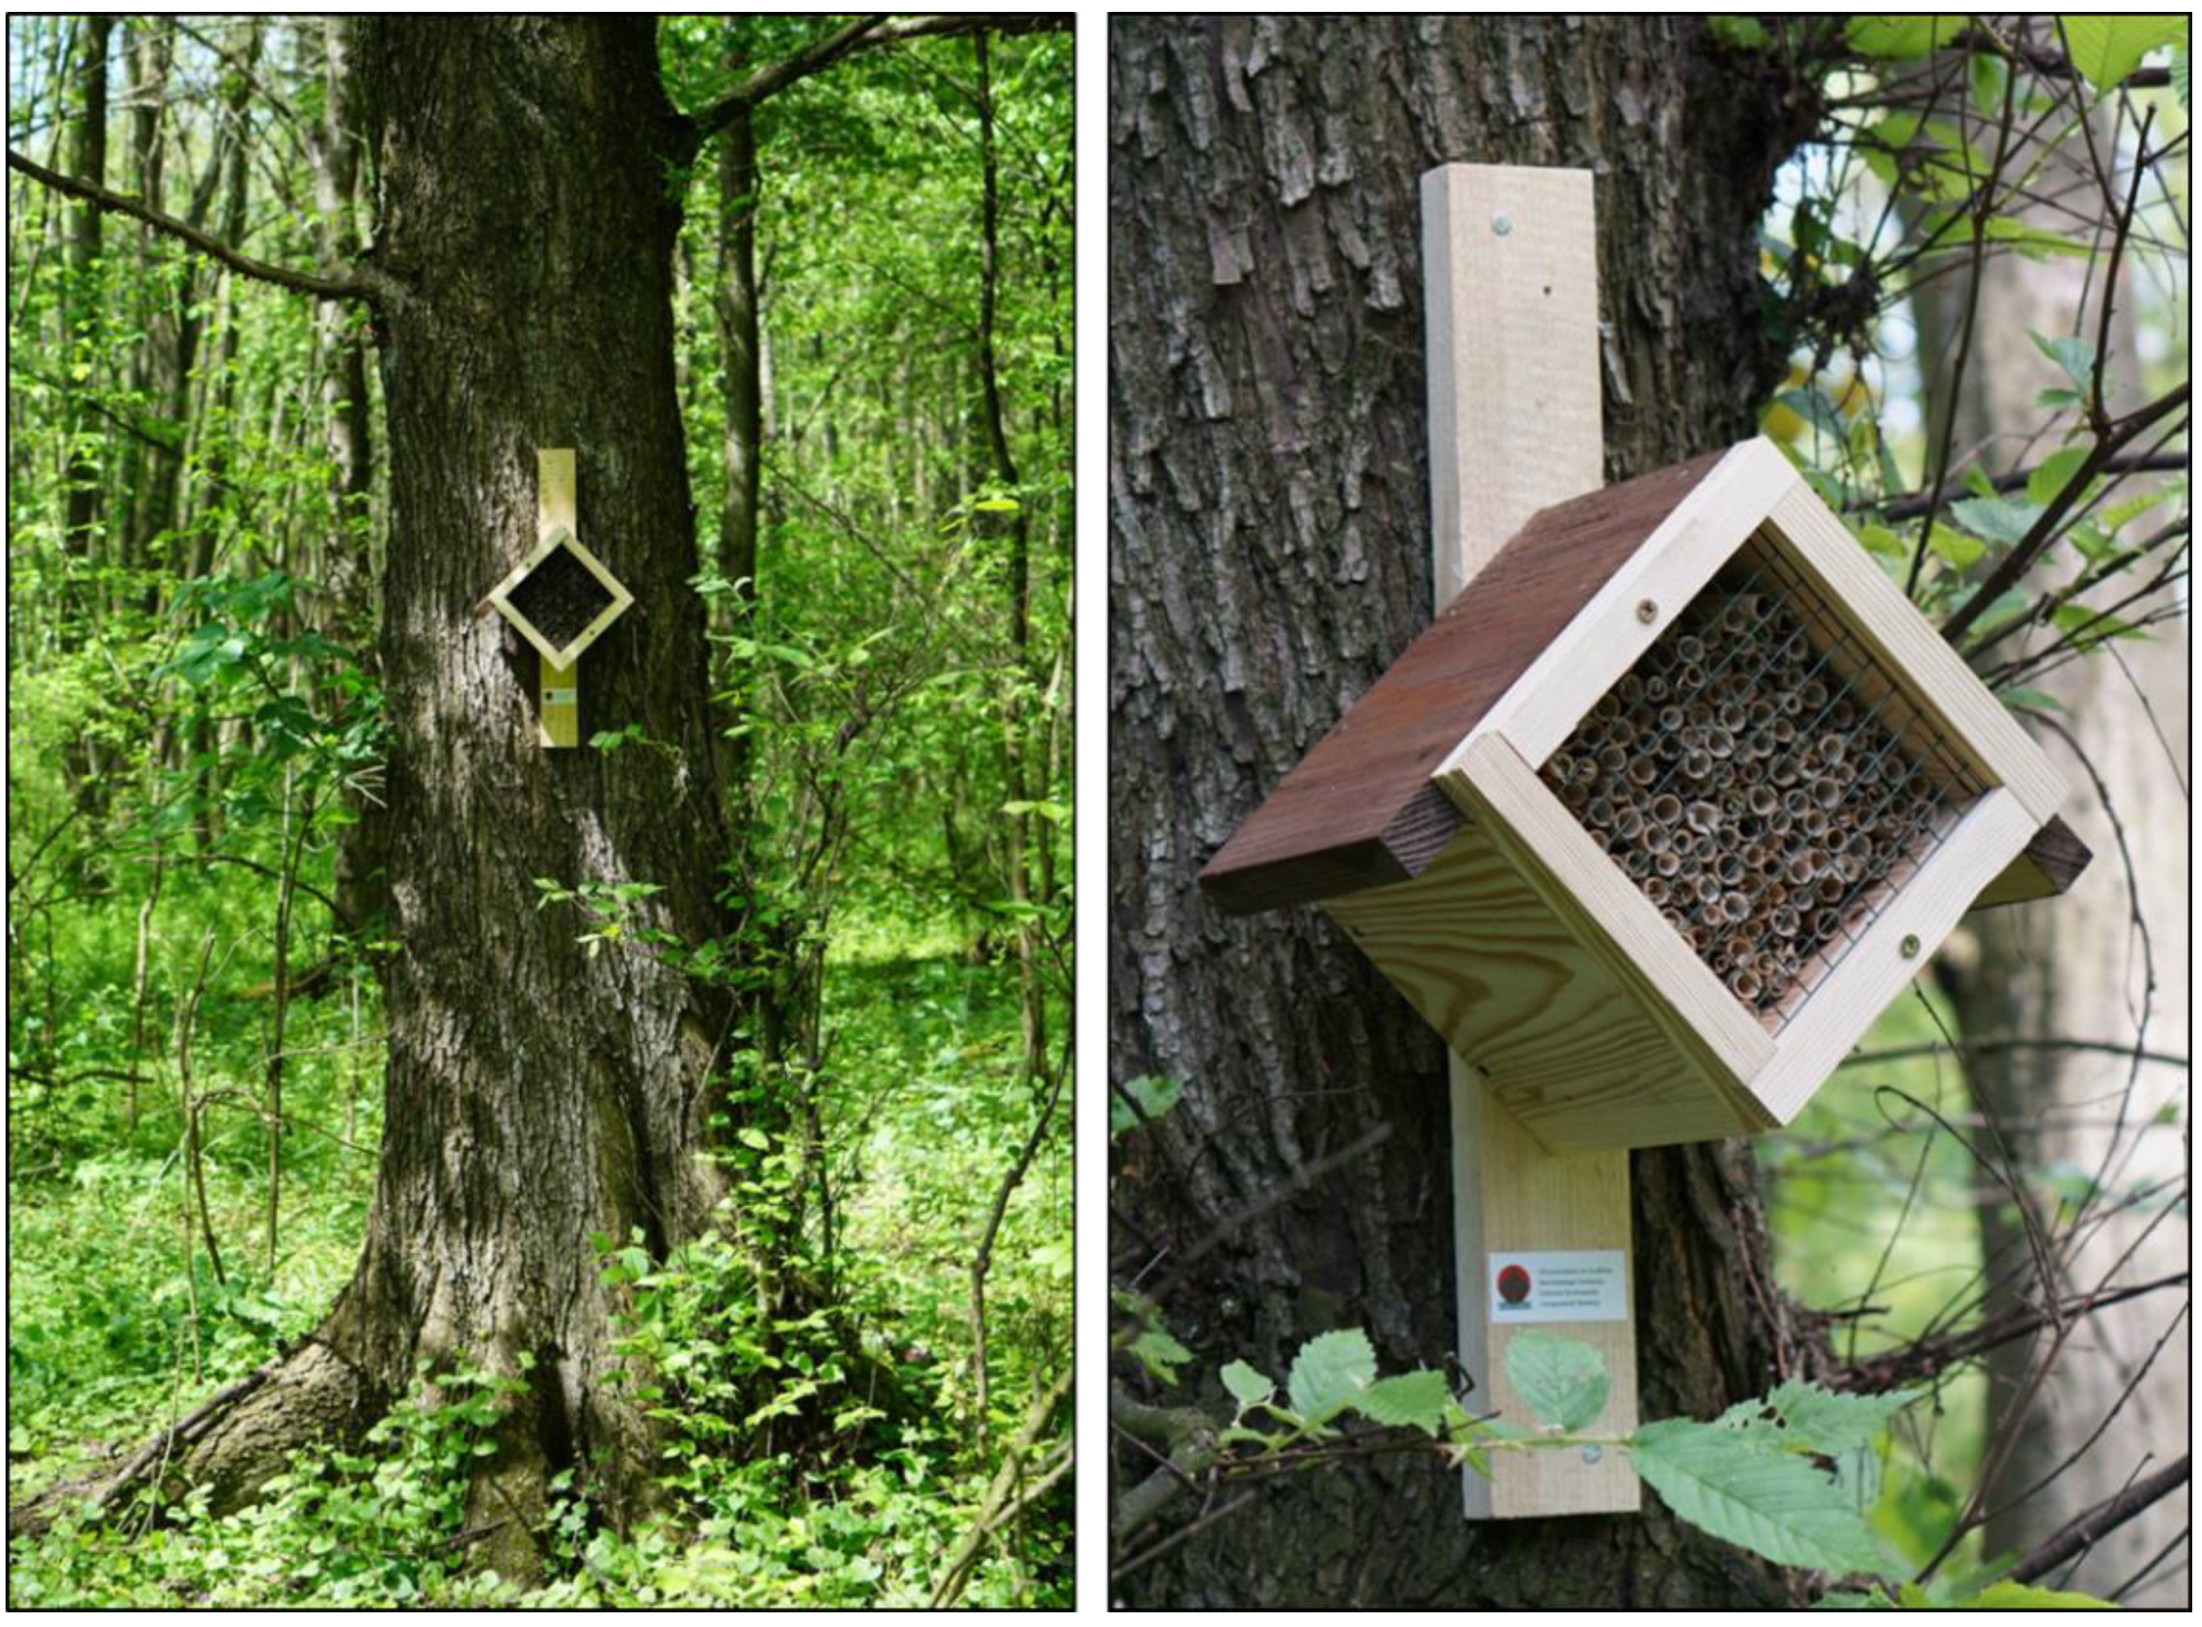
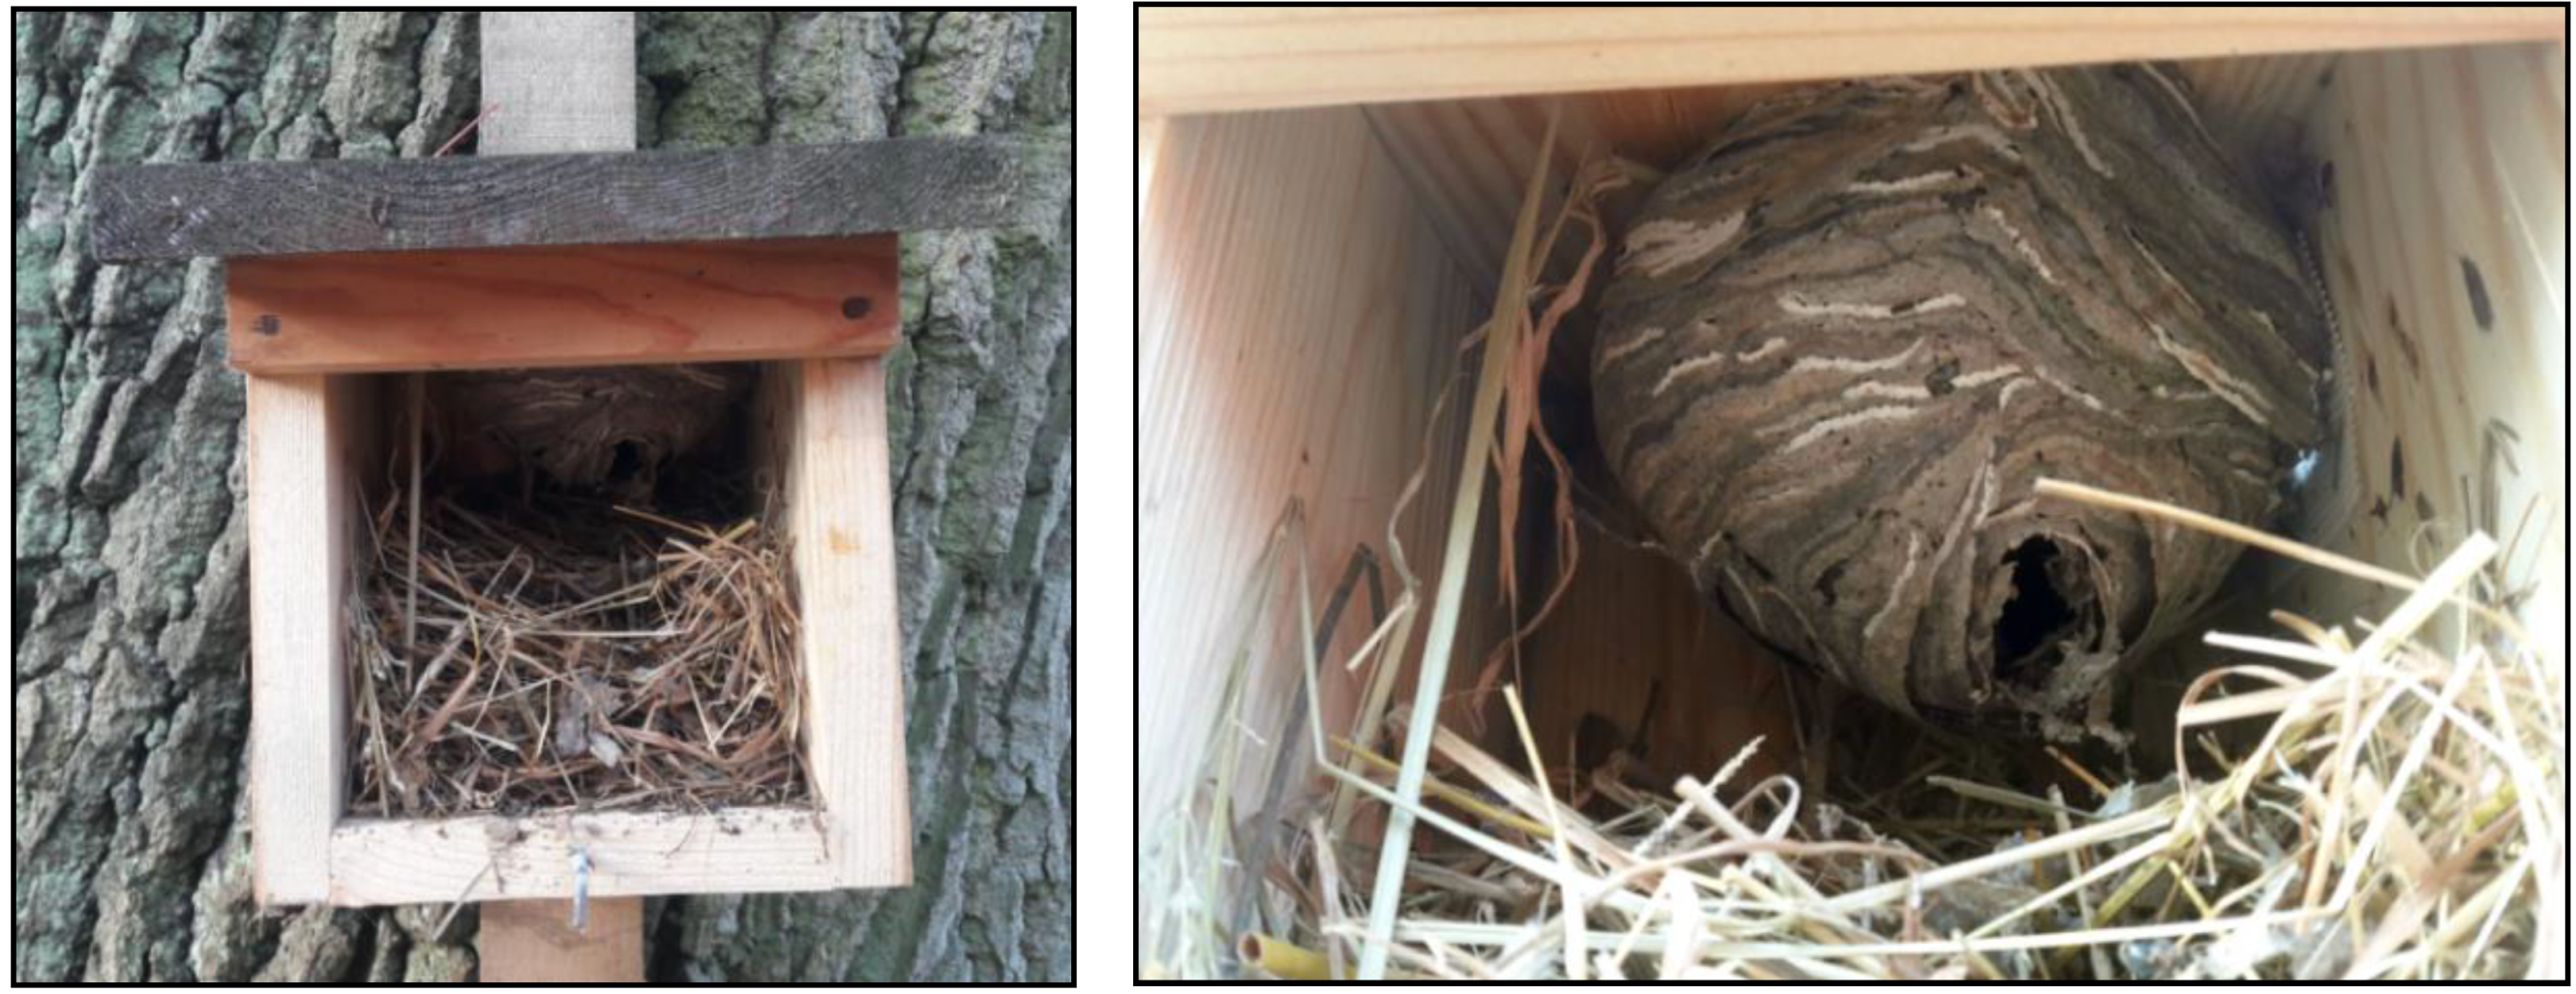
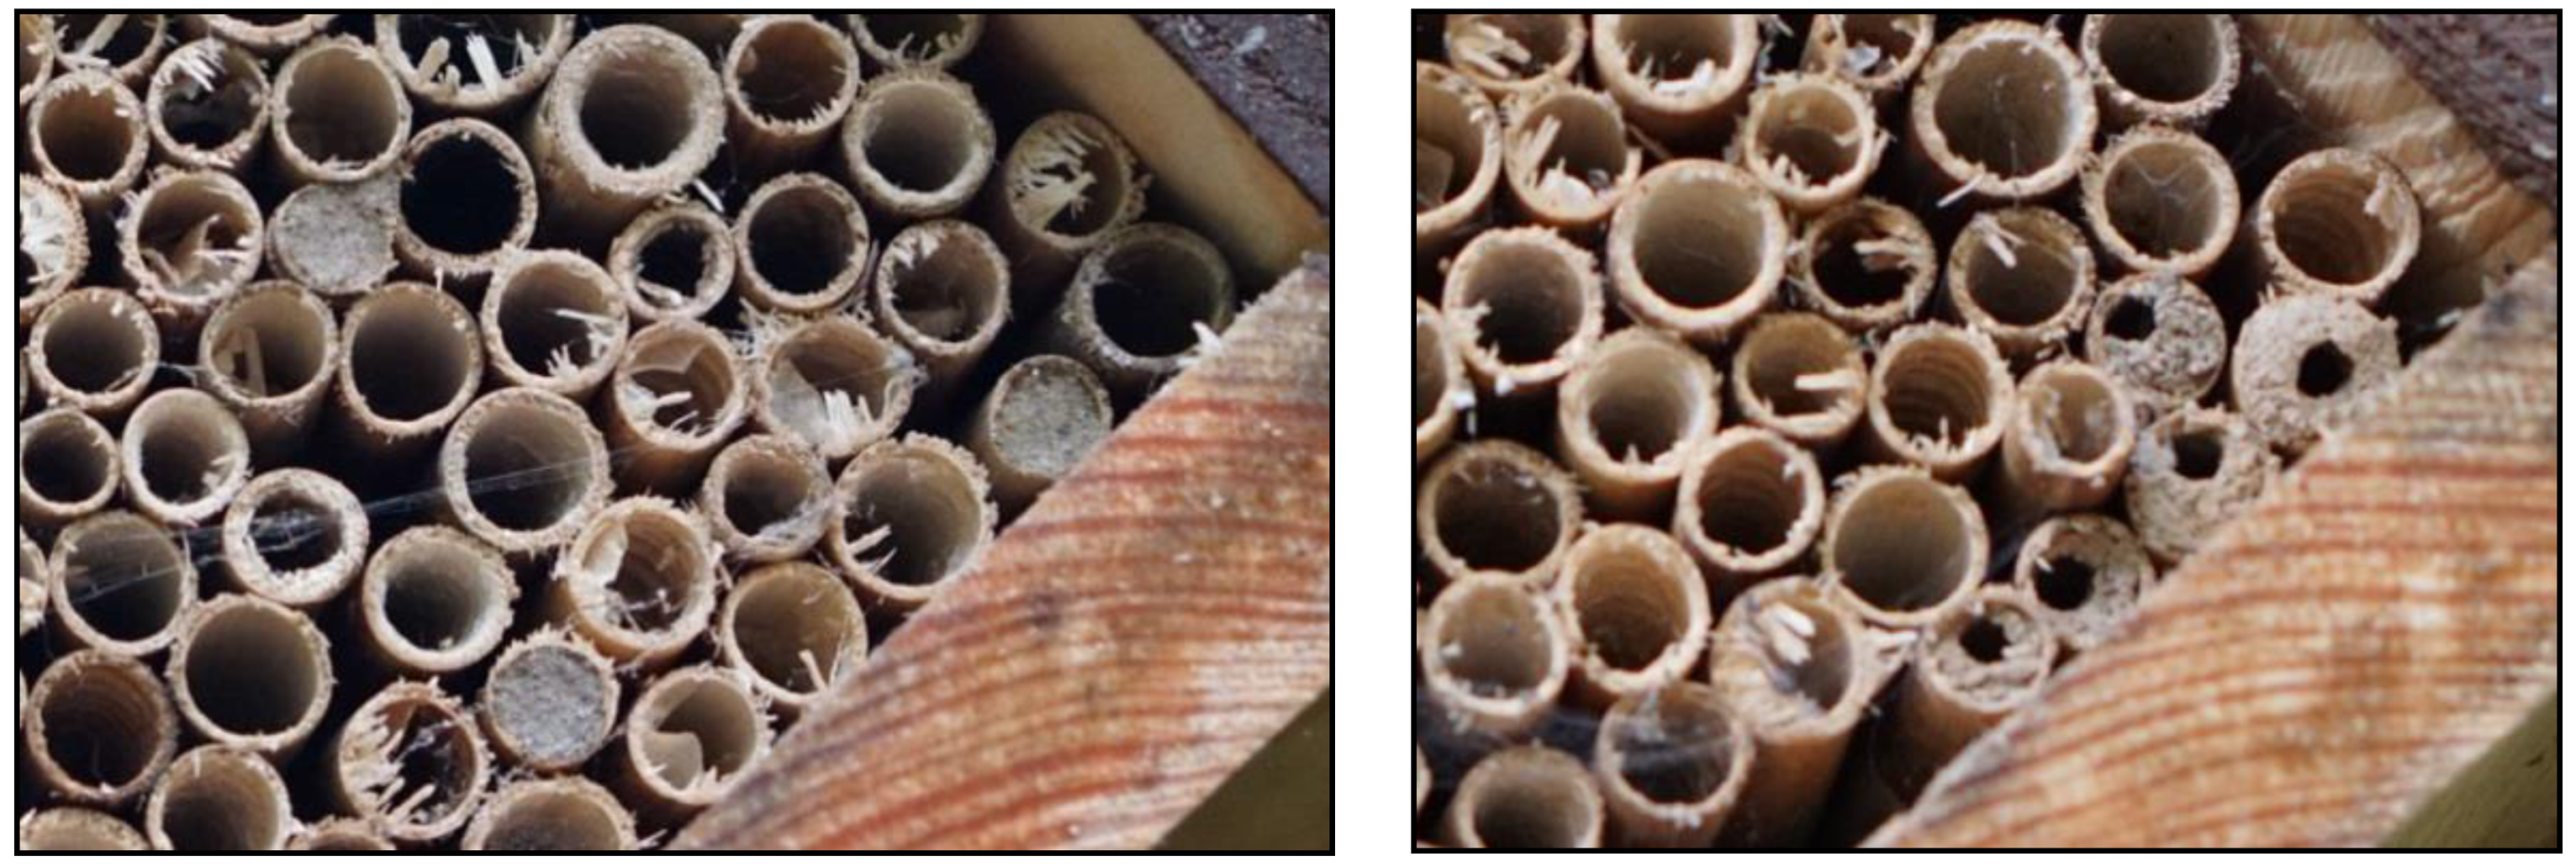
4.1.1. Suitability for Nesting

The indirect measure of the availability of natural nesting sites for bumblebees was soil dryness and the presence of large trees. The results show that the mean water content in the topsoil was 24%, which translates to a soil dryness equal to 76%. Soil dryness possible to achieve in riparian hardwood forests and most suitable for ground nesting is 90%. In turn, the presence of trees with a DBH of 110 cm reflects the potential of riparian forests to provide aboveground nesting sites for pollinators.
The analysis of occupancy degree of artificial nests showed that out of 12 bumblebee nest traps, bumblebees did not nest in any of those along the two growing seasons. During multiple inspections, only one female Bombus was found inside the nest trap, but this presence did not end in establishing a nest. In the first season, the nest traps were inhabited mainly by spiders. In the second season, representatives of social wasps (Vespidae) established their nests in several boxes (Figure 6).
Also, the nest traps for solitary bees were not inhabited by them. In each of the 12 placed traps there were approximately 150 hollow reed stalks, which gave a total of 1800 places available for nesting. After the end of the growing season, capped stems were counted in each nesting box (Figure 7). Their number ranged from zero to 16, which translated into a maximum occupancy degree of 10%. Among them, only some had an undamaged cap and contained live larvae. A maximum of four fully-sealed stems per nest box (in Kępa Oborska) was recorded. Several individuals of solitary wasps belonging to the Eumeninae subfamily, most likely of the genus Symmorphus, emerged the following spring from the stems transported to the laboratory. Representatives of this kind were also observed during field inspections and not a single representative of solitary bees has been recorded.
Summarizing this aspect of ecosystem potential, it can be stated that there was a total lack of readiness of bumblebees and solitary bees to colonize artificial nests in riparian hardwood forests.

4.1.2. Availability of Food Resources

From among 85 plant species recorded in 51 phytosociological relevés, 32 melliferous/honey species were reported, constituting the food base for pollinating insects (Table 3, see Supplementary materials, Table S1 for the site level data). In the tested forests, the plants with the highest assumed honey potential were Scrophularia nodosa L. (up to 700 kg ha−1 of monoculture) and Solidago gigantea Aiton (also 700 kg ha−1), which is an invasive alien species in the analyzed forests. The group of plants with a high honey potential (over 100 kg ha−1) comprised also Angelica sylvestris L., Tilia cordata Mill., Stachys sylvatica L., Lamium maculatum L., Ajuga reptans L., Rubus idaeus L., Acer platanoides L. Some of them were species with wider sociological and ecological amplitudes, which are also found in other fertile and moist habitats e.g., A. sylvestris and L. maculatum.
The indicated honey species had different cover in forest layers. In the herb layer, Glechoma hederacea L. had the largest cover (on average 33%), followed by Rubus caesius L. (12%) and L. maculatum (9%). In the shrub layer, the most common honey plant was Prunus padus L. (14% cover). A significant share was also covered by R. idaeus and Ribes spicatum E. Robson (approx. 6% each). P. padus was also the dominant honey plant in the tree layer (approximately 21% cover). Out of nine other recorded honey plants reaching the tree layer, only A. platanoides achieved cover above 2% (7%).
When taking into account the cover of individual honey species in the forest layers, the highest honey potential per hectare was also achieved by S. gigantea (56 kg ha−1) (Table 3). Despite its relatively small cover (8%), it maintained its leading position due to one of the highest honey potentials per-species in temperate ecosystems. Nevertheless, due to the late flowering period (August-September), it is not a plant that supplies food resources at the time of the greatest demand of pollinating insects. Key species that form the pollinator’s food base in spring and early summer include L. maculatum, R. idaeus, A. platanoides, S. nodosa, P. padus and G. hederacea, obtaining cover-weighted honey potential in the riparian hardwood forest in the range of 3–12 kg ha−1.
Honey species form the largest share of plant cover in the undergrowth (joint cover on average 84/210 = 40%) and in the shrub layer (31/80 = 39%), with a substantially smaller share in the tree layer (32/112 = 29%). Despite clear differences in mean values in favor of the undergrowth, for as many as 15 out of 51 relevés, the cover of honey species in the tree layer is higher than in the undergrowth. It is related to the high variation in the species’ composition and cover between relevés.
The undergrowth is also by far the most nectar-rich layer (mean honey potential 88 kg ha−1, 32 kg ha−1 without the alien S. gigantea). Although the average potential of the tree layer, similarly to the shrub layer, amounts to 12 kg ha−1, in 18% of the considered relevés the tree layer was richer in nectar than the undergrowth, and in 22% the shrub layer was richer. The total honey potential of the riparian hardwood forests is quite diverse and ranges from 7 kg ha−1 to over 575 kg ha−1 (113 kg ha−1 on average, 56 kg ha−1 without S. gigantea) (Table 2). In line with the adopted definition and measure, the riparian hardwood forest as an ecosystem type can give up to 200 kg ha−1 year−1 of honey (143 kg ha−1 without the alien S. gigantea).

4.2. Pollinators Potential

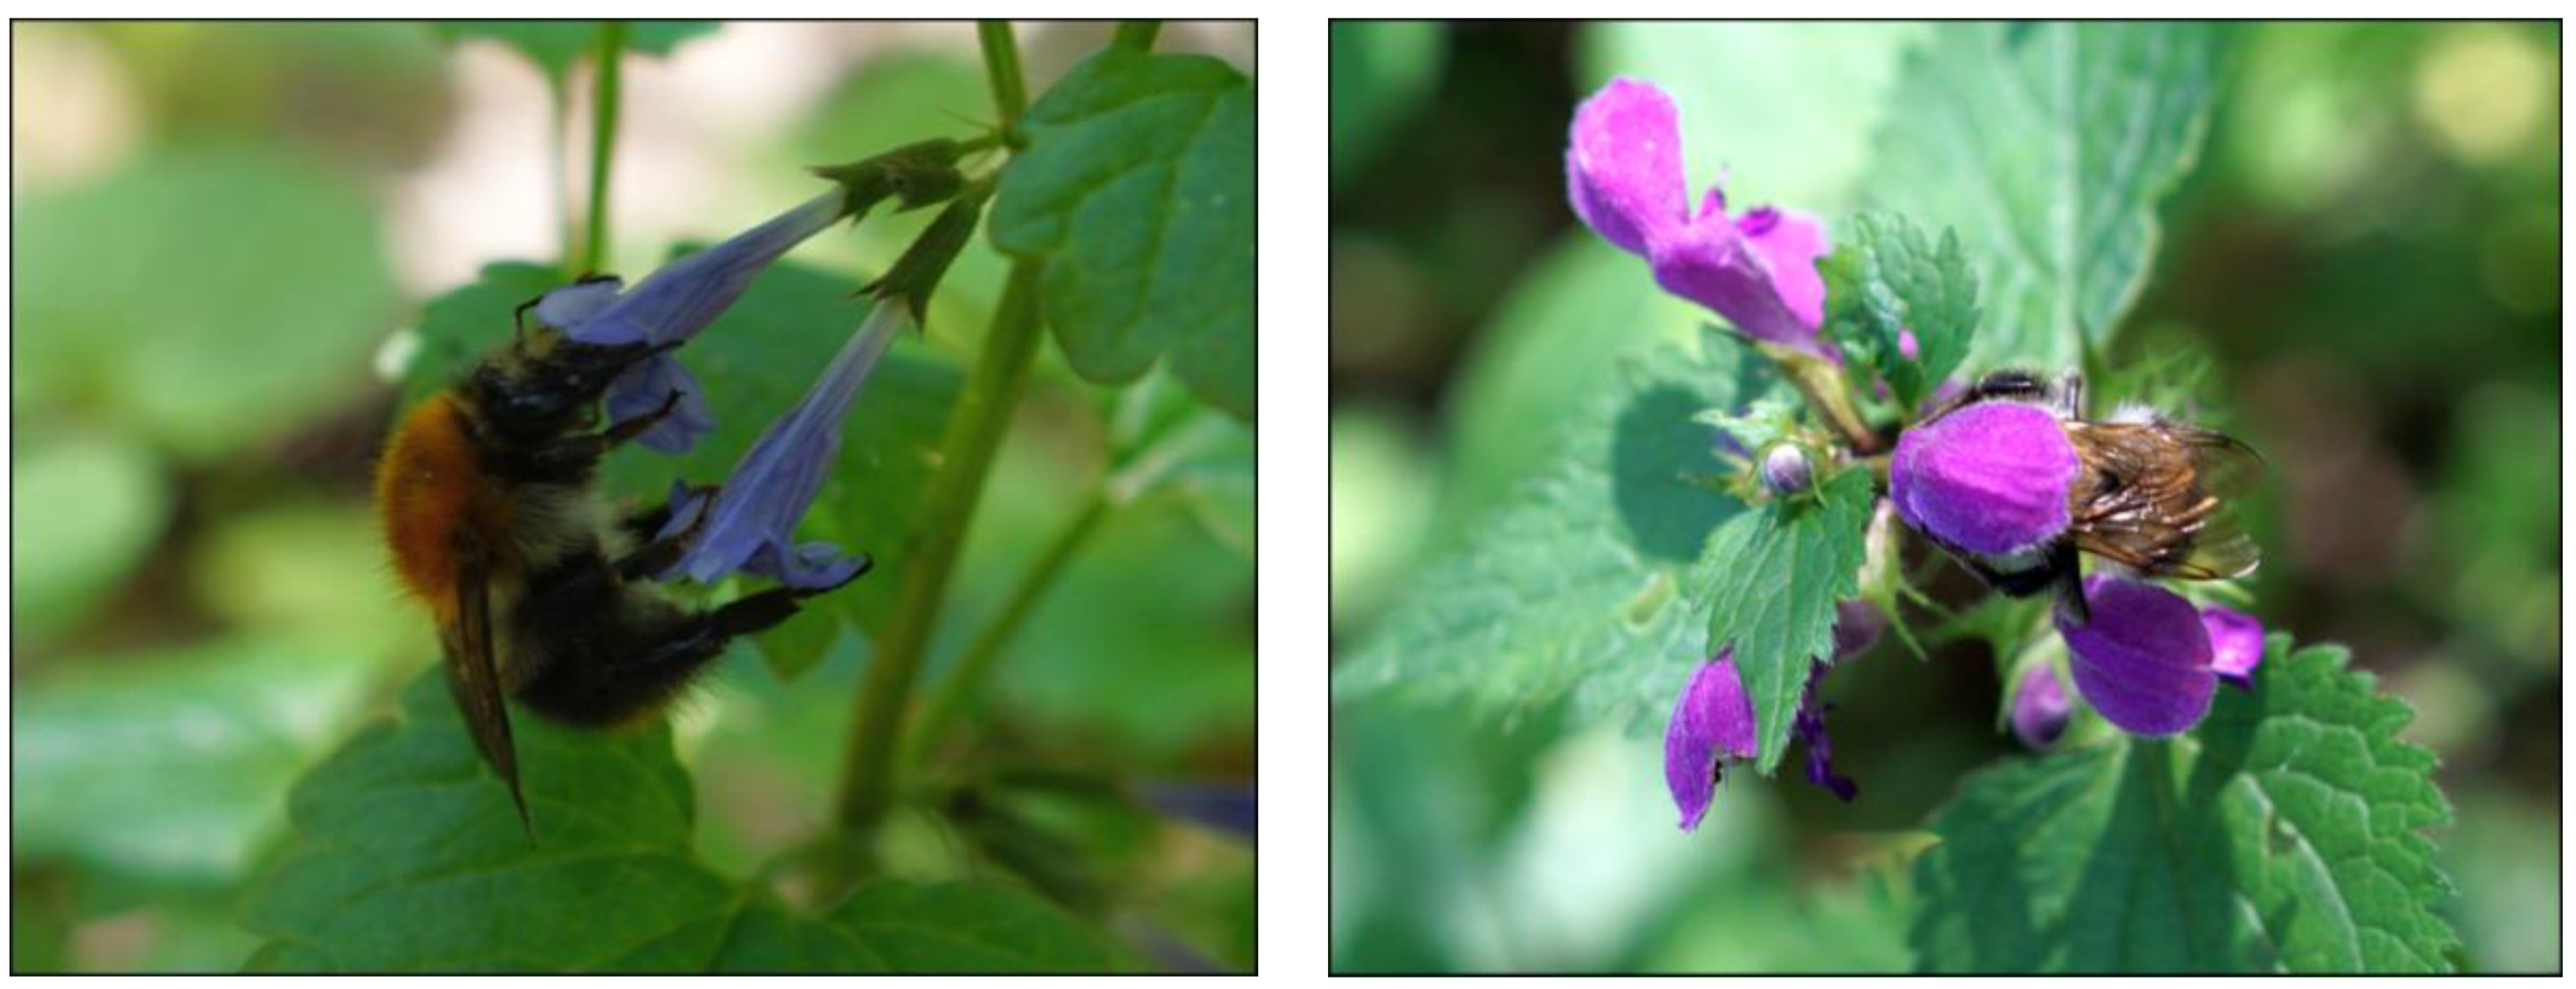
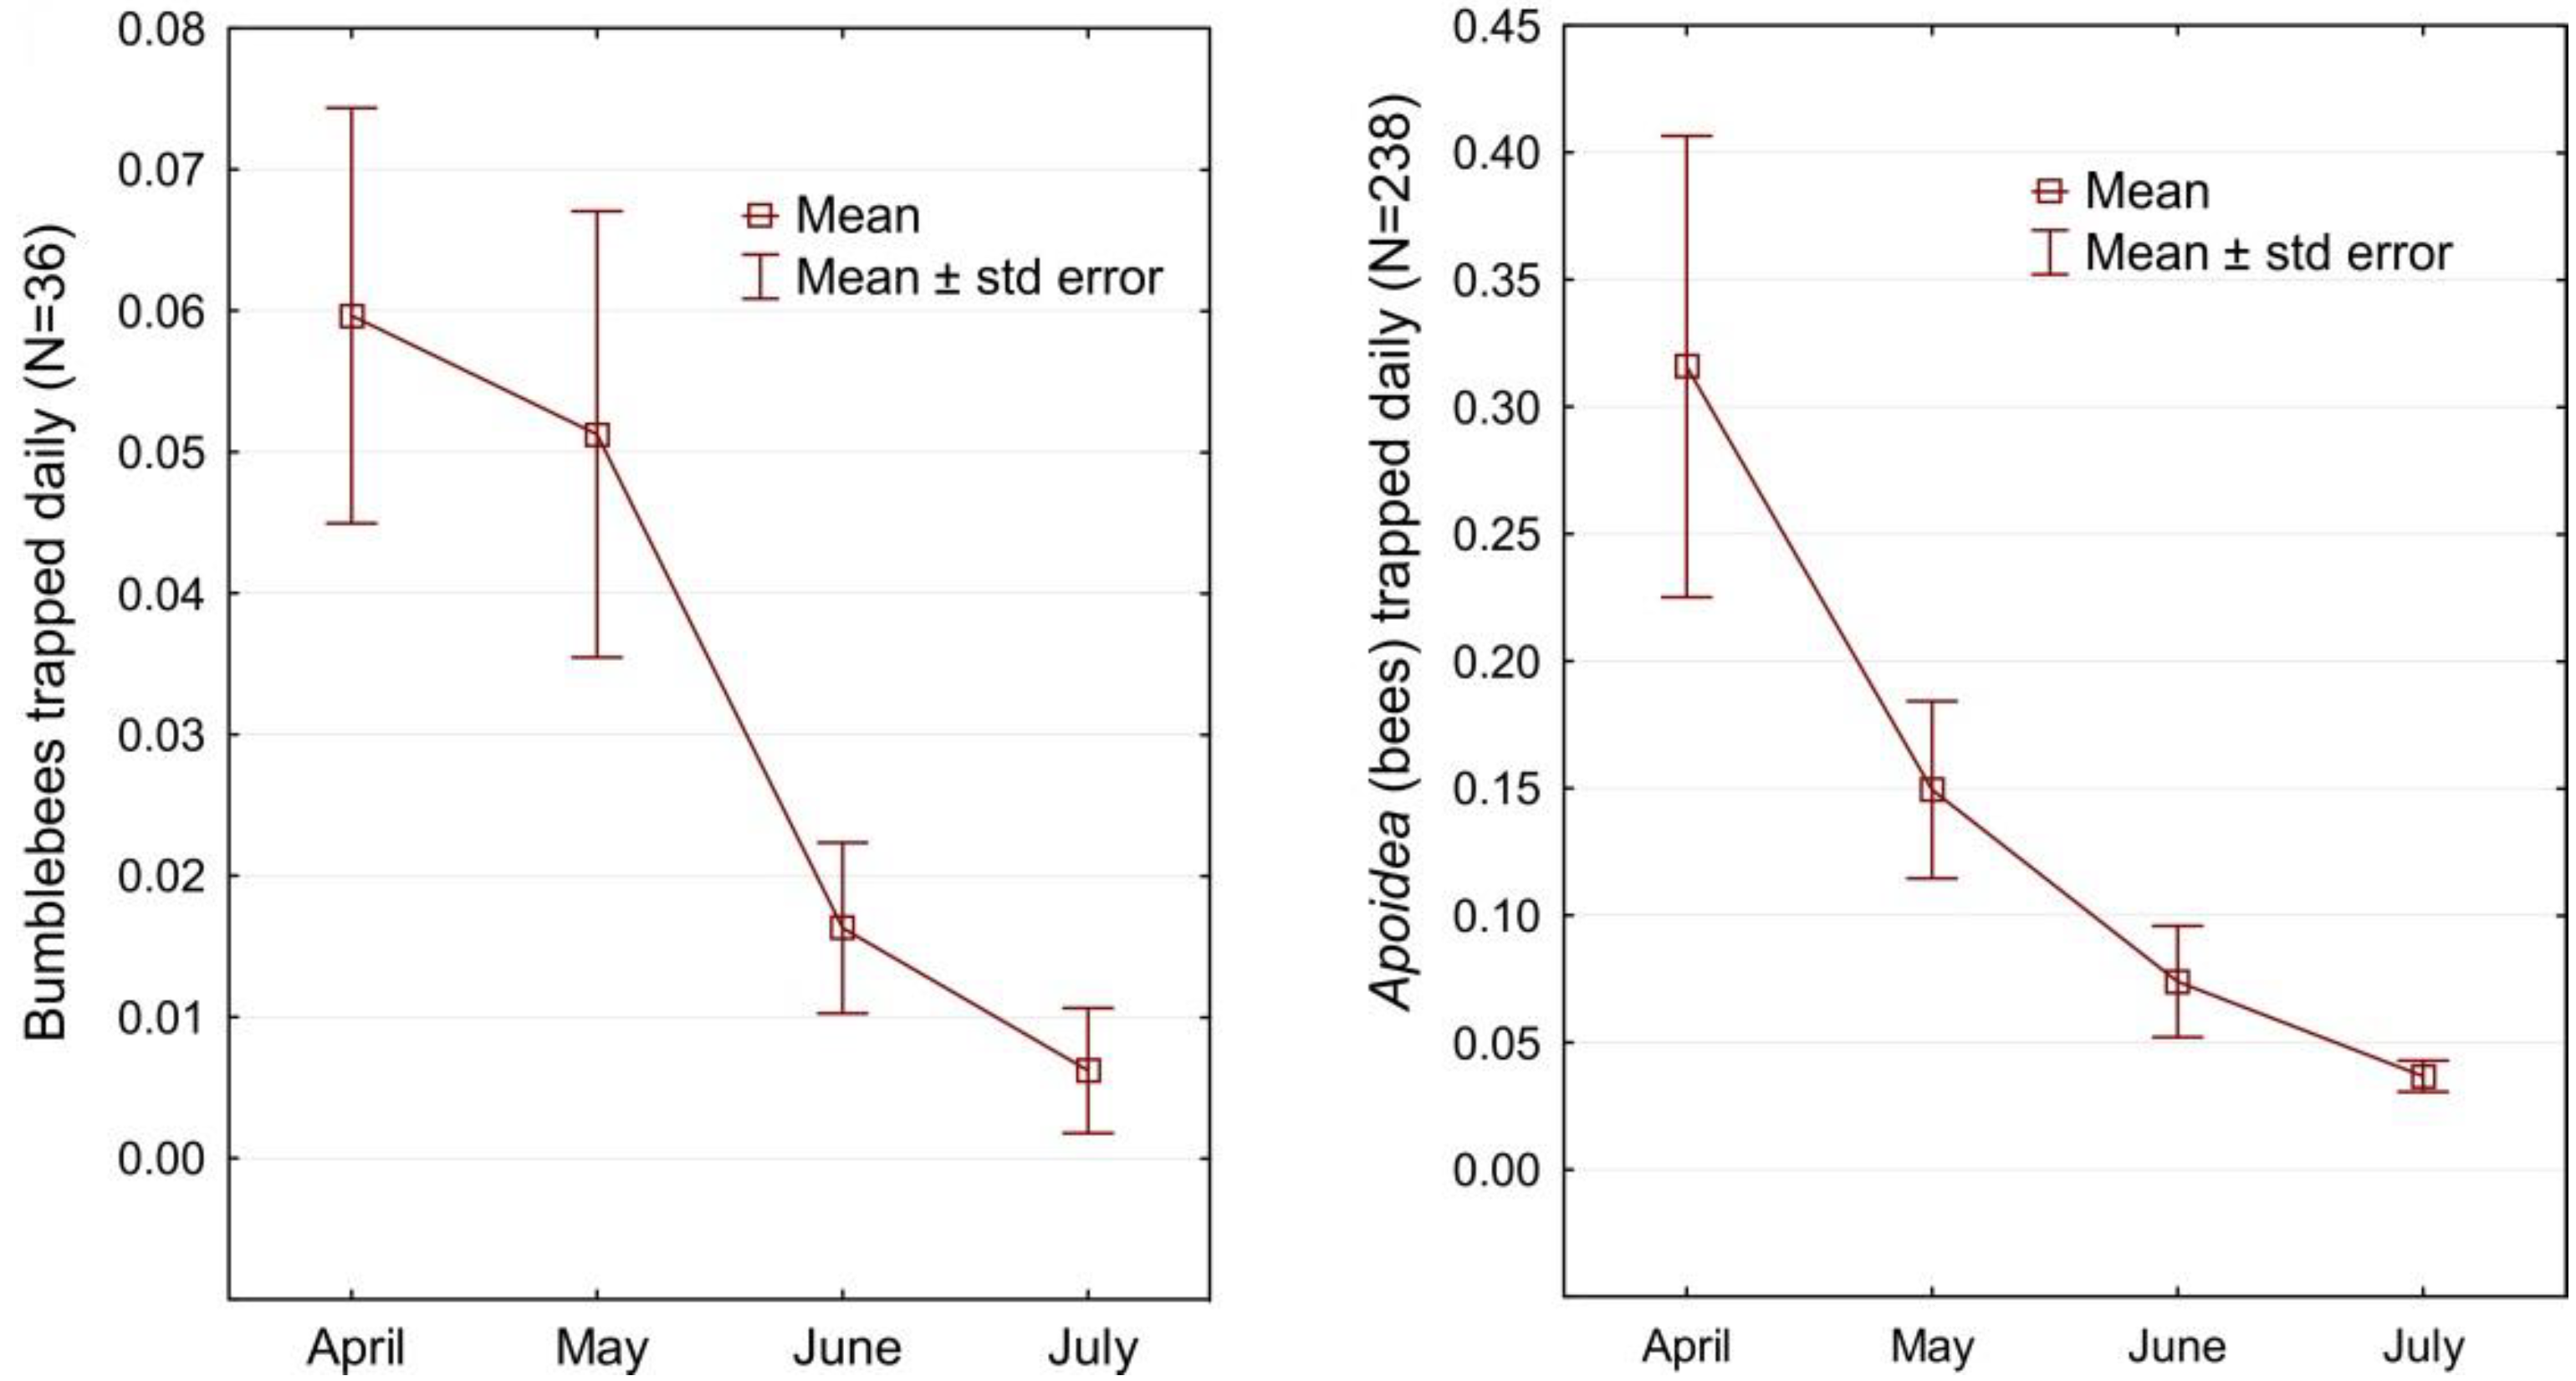
4.2.1. The Density of Bumblebees

Over the period of bumblebees’ peak activity, the maximum number of individuals recorded during one survey was 17 (in June at Łyczyńskie Olszyny), which translates up to 850 individuals ha−1 (Table 2). Similar values were obtained only in April on the same site (14 individuals, 700 ha−1) and in April and May at Kępa Oborska (respectively 16 and 14 individuals, 800 and 700 ha−1). Overall, the bumblebee potential of hardwood forest ecosystems was estimated at 500 individuals ha−1 (see Supplementary materials, Table S1 for the list of species recorded, for the ecological description of the recorded species see [28]).
We observed bumblebees most often while foraging on flowers, especially of herbaceous plants (mainly L. maculatum, Pulmonaria obscura Dumort and G. hederacea) (Figure 8). We also recorded single bumblebees feeding on the honeydew produced by aphids on the leaves and branches of P. padus. The exception were B. terrestris L. queens, which appeared in early spring (April, May) in search of a suitable place for nesting.

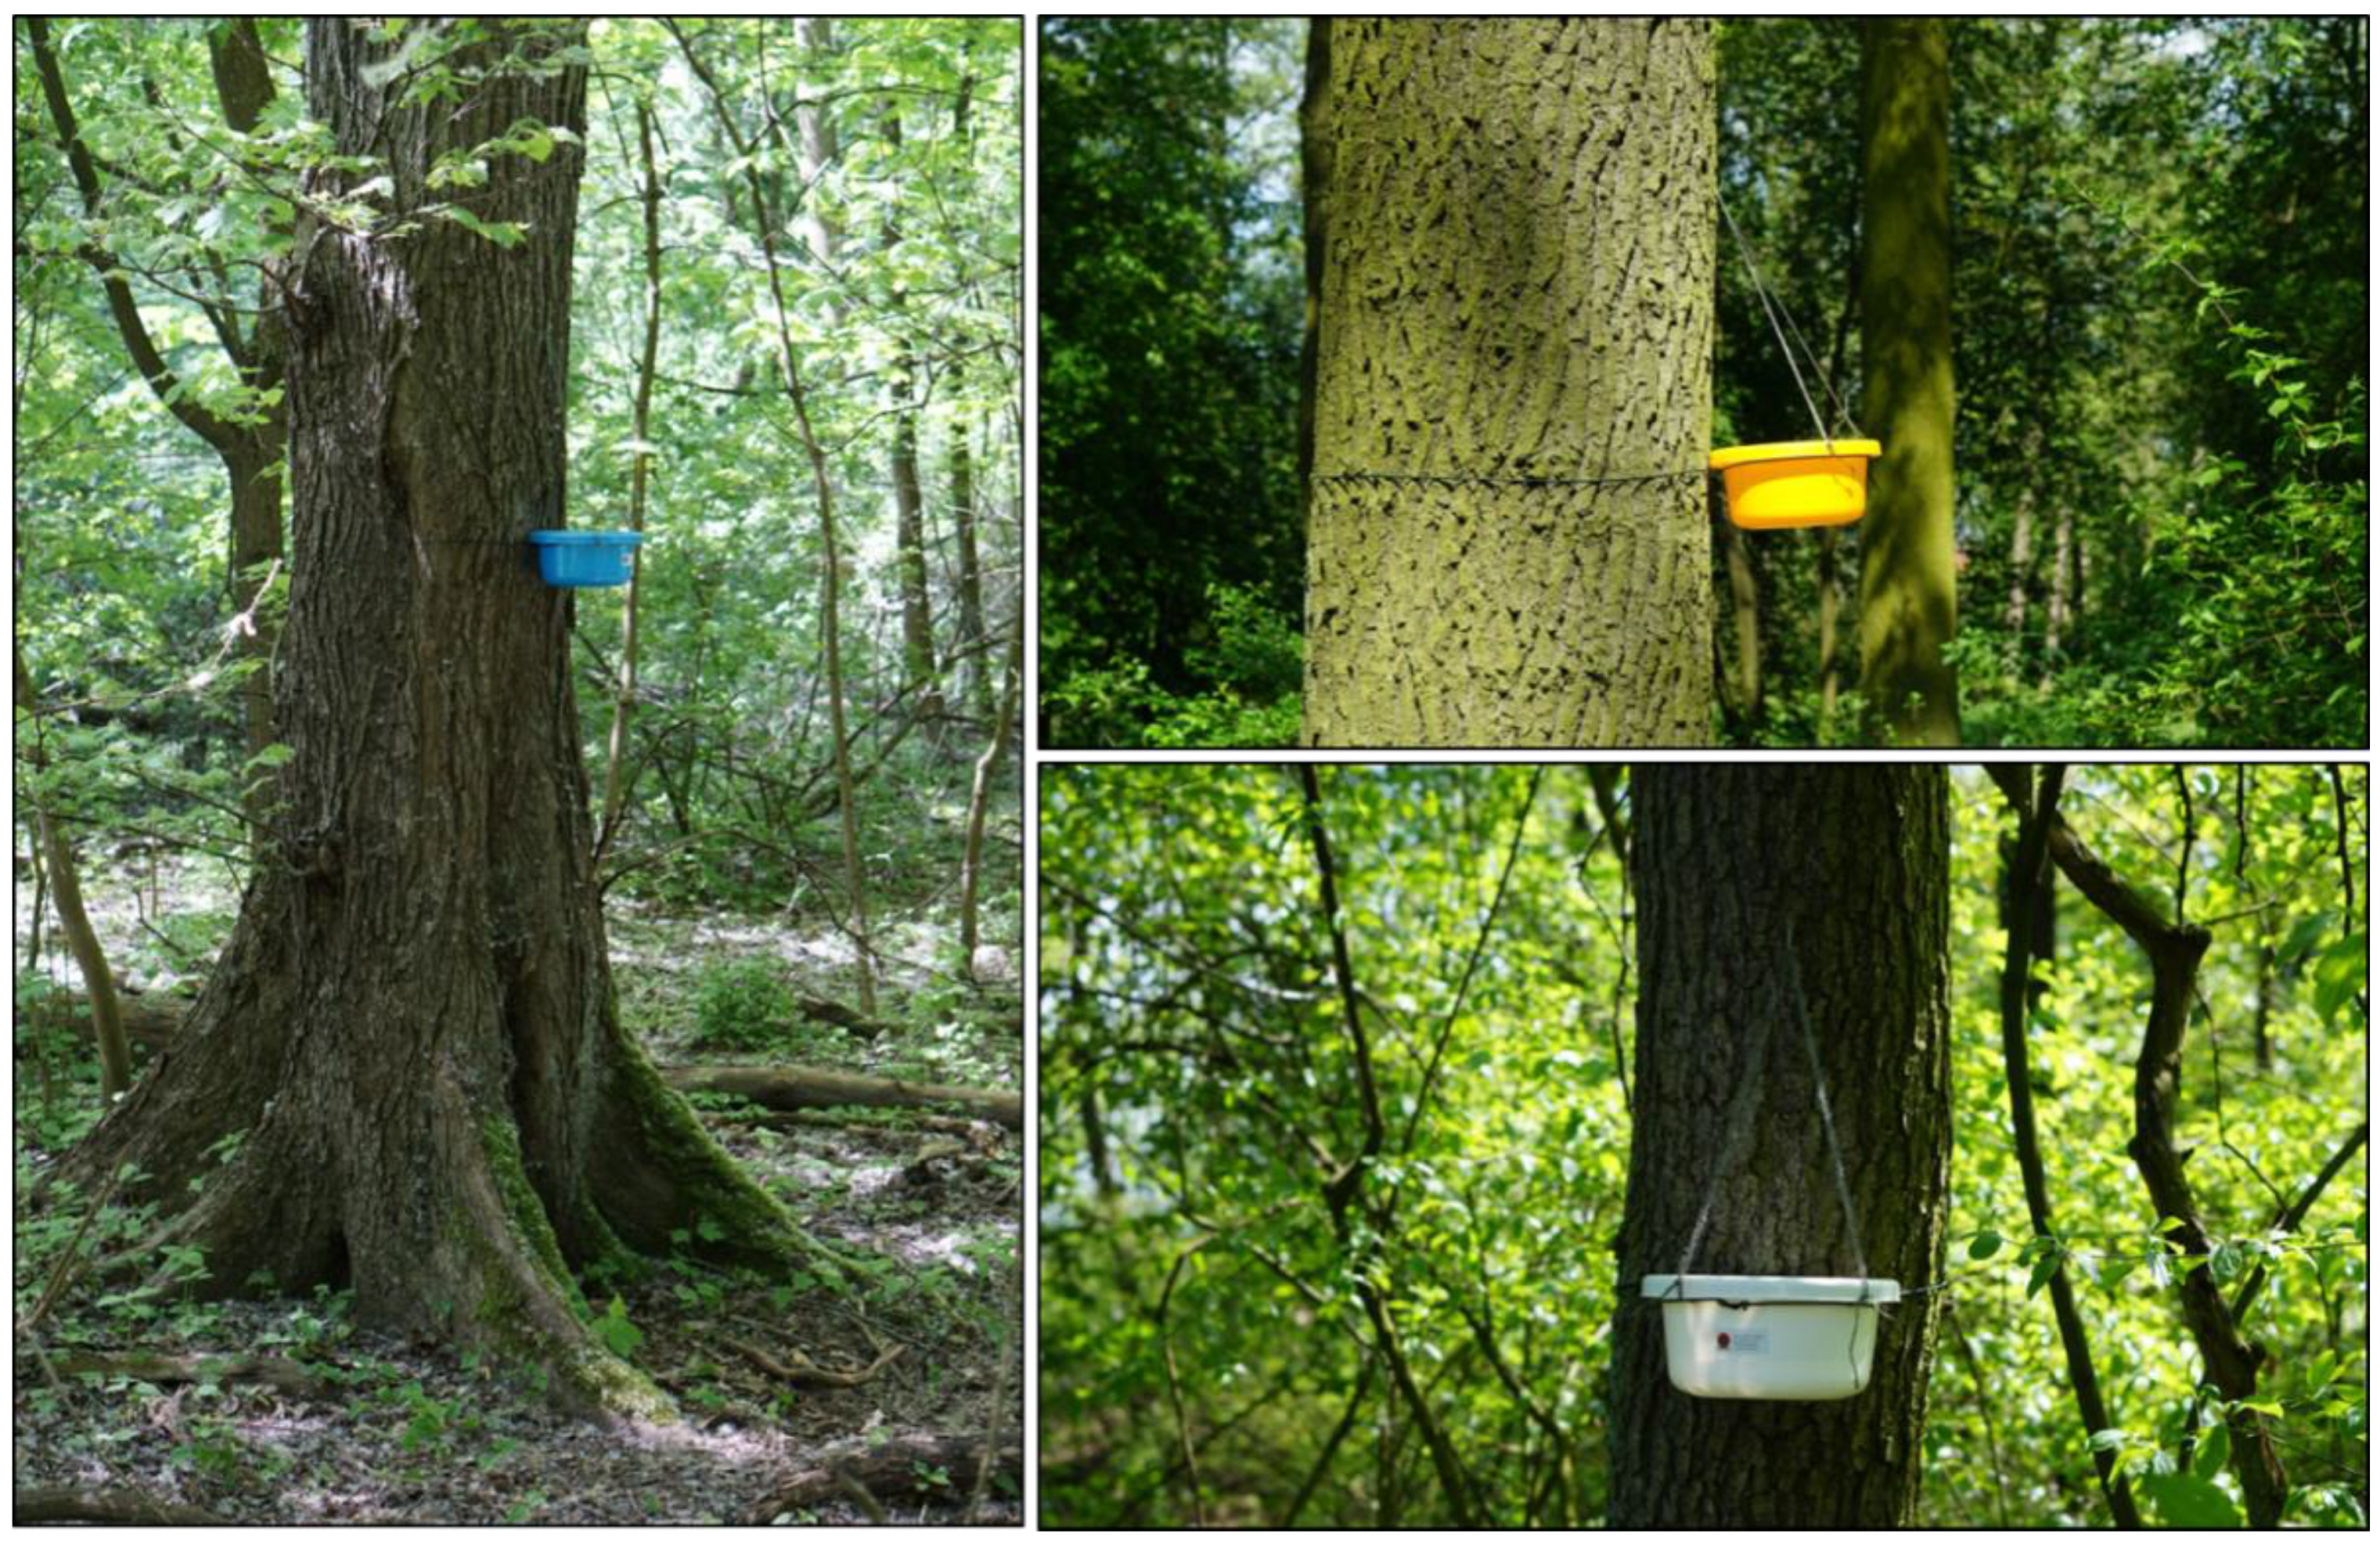
4.2.2. Number of Bees Trapped Daily

During the peak activity of the examined insects (April–July), 238 bees were caught in the pan traps, including 35 bumblebees. Most bees per day were caught in one of the traps on the Arciechówek site in April (1.45 individuals day−1), while the largest number of bumblebees were also caught in this area (max. 0.62 individuals day−1, achieved in May). The monthly distribution curve for both the number of bees and bumblebees is decreasing (Figure 9). In April, significantly more bees were caught than in the other months. It is related to the fact that during this period, spring geophytes bloom in the forests in the absence of other flowers in open areas. Also, the queens of many bumblebee species are looking for a place to set up a nest and often, for this purpose, also penetrate forests. The monthly abundance curve for bumblebees is of the shape of a sigmoid, which is related to the imago seasonal activity and development cycle of the families of these insects. The pollinators’ potential of hardwood forest ecosystems corresponds to 0.26 bees caught daily in the pan trap in the peak season (Table 2).

4.3. Relationships among Indicators

To compare the distribution of values among indicators and to check if they carry more or less the same information, we needed to upscale the analysis to the forest test site level (six sites, see Supplementary materials, Table S1). Out of seven indicators considered, two were constant and with a minimum possible value (0) across all six sites. Thus, their relationship with the rest of the indicators cannot be determined. The next five indicators showed diverse interrelations, but none of the correlations checked were significant (Table 4).

5. Discussion

5.1. Pollination Potential of Riparian Hardwood Forests

Riparian scrublands and forests are known to harbor unique flora and fauna and are important in providing various ecosystem functions and services, including pollination [49]. However, multi-ecosystem studies show that mature riparian forests are home to the smallest number of wild bees [50,51], and thus, have low pollination potential compared to other temperate ecosystems [13,26]. We performed our study in the fragmented ash-elm riparian hardwood forests, a specific type of riparian vegetation; nonetheless, the obtained capture rate per pan trap confirms the low pollination potential of riparian forests. The obtained capture rates per pan trap (median 0.08 ind. day−1, AdjMax 0.42 ind. day−1) are considerably lower than e.g., those reported by Droege et al. [52] on abandoned fields (mean 0.55 ind. day−1), but similar to those noted in the oak-hornbeam forest in central Poland (mean 0.05 ind. day−1) [53]. Although we designed our study specifically to monitor bee abundance, some other pollinators were also caught in the pan traps, e.g., hoverflies. Still, their overall low abundance (median per trap = 0) did not allow to consider them as an indicator of the pollination potential in riparian forests.
In turn, the pollination potential quantified based on the route method (500 bumblebees ha−1) exceeds considerably the previous estimates for riparian forests based on entomological and ecological studies (up to 200 ind. ha−1, including all wild bees) [26]. Such levels of potential pollinator abundance place the studied riparian hardwood forests in the group of ecosystems with at least average potential to provide the pollination service (value 6 on a scale 0–10, compared to 1–3 assigned to riparian forests previously) [26]. Nonetheless, bee densities above 400 ind. ha−1 are commonly recorded in small forest islands in agricultural landscape, in contrast to large forest complexes, where densities are usually much lower [54,55]. The mean density value obtained in our study (163 ind. ha−1, see Table 2) is twice as high as the average wild bee densities recorded in deciduous forests across Poland (69–88 ind. ha−1) [56]. Forest islands offer a food base in the undergrowth to a broad array of pollinating species, in particular in early spring (from April until mid-May), as the blooming season of flowering plants in the adjacent open habitats starts later [57]. Indeed, in the tested patches of riparian hardwood forests, the following honey species abundantly bloomed in early spring and were frequently visited by pollinators: Glechoma hederacea, Ajuga reptans, Pulmonaria obscura, Viola reichenbachiana Boreau, willows, maples, Prunus padus and Frangula alnus Mill. April and May were also the months when we captured the highest numbers of Apoidea in the color pan traps and spotted the highest number of bumblebees. This observation is in line with the findings from other similar studies [58,59,60]. We may therefore conclude that the tested riparian hardwood forests, due to their relatively small size and agricultural context, function more as sink habitats than the full-scale riparian forest ecosystems in terms of pollination provision.

5.2. Methodological Advances and Their Implications

To increase the accuracy of pollination potential estimates, in this research we implemented several methodological modifications in relation to our previous works (see [1,13,26]). First of all, in previous studies, we used the values of 80–90 percentile from the distribution of the sample’s values as the level of the potential of a given type of ecosystem to provide a given service. In this way, for example, we estimated the potential of riparian hardwood forests to provide 11 regulating services [13]. In the current research, we used another method to specify threshold potential values—the Hampel’s test [47]. The advantage of this method over the alternative method is that it rejects only those values that clearly stand out (e.g., because of mismeasurement or very extraordinary circumstances), and does not mechanically cut off the highest values above a certain arbitrary chosen percentile. On the other hand, the Hampel‘s test rejects all values above zero as outliers when the median of observations is zero. This may happen in the case of indicators based on counting the occurrences of rare events (e.g., the occurrences of bumblebees).
The second major change relates to the quantification of the food base for pollinators (honey potential). Previously, we reduced the sum of the cover of individual plant species to the cover of the entire layer defined in the field (100% or less). In this paper, we resigned from this transformation. We realized that a given forest layer does not form one plane, but has its vertical dimension, and plants from one layer can overlap. Moreover, it is often the case that plants bloom at different dates, sequentially one after another, and there is no need to reduce the aggregated cover to 100% or less for the analysis of the cumulative pollination potential over the growing season. By departing from the reduction of aggregated plant cover, we obtained significantly higher average and potential values for each layer and for the entire ecosystem in total. The currently obtained honey potential (200 kg ha−1; 143 kg ha−1 without the alien S. gigantea) is much higher than our previous calculations for riparian hardwood forests (44 kg ha−1) when we used a different method [13], but also higher than the general estimates for riparian forests (20 kg ha−1) and oak-hornbeam forests (40 kg ha−1) [26], which in terms of floristic composition are similar to riparian hardwood forests.
Such high values may raise understandable doubts, especially if we compare them with the results of multi-season studies carried out back in the 1960s and 1970s on nectar secretion in similar lowland deciduous forests (honey potential 4–24 kg ha−1) [38]. However, Szklanowska [38] took into account only the forest floor, and her calculations were not intended to show the potential of the entire plant community. It is worth noting in this context that the amount of nectar in riparian forest is in fact determined by the presence and cover of only a few key species. If they are present, and the light and water conditions are favorable (open canopy, high soil moisture), then riparian forests can successfully provide a nectar food base similar to that of moist pine forests with high cover of Vaccinium myrtillus L., Frangula alnus and Ledum palustre L. (approx. 200 kg ha−1) [26,36].
A very important species determining the size of the food base in the studied riparian forests is the invasive S. gigantea, as it has an extremely high honey potential of 700 kg ha−1. Even low S. gigantea cover significantly increases the estimated food base, but it is unclear whether it actually provides that much nectar in the riparian forests under tree canopy. Its honey potential taken from the literature [40] was estimated in the optimal light conditions, i.e., in the open area. Our observations indicate that the flowering of S. gigantea in the forest, in particular under closed-canopy conditions, was much weaker than in the neighboring open landscape. In summary, we argue that the potential of riparian hardwood forests is significantly higher than reported in the literature, but values of 200 kg ha−1 are very rarely actually achieved, and only in stands with open canopy.

5.3. Linkages among Indicators

To date, pollination potential has been most often estimated using indicators characterizing pollinating agents, such as: pollinator abundance, richness and community composition or diversity indices (e.g., [61,62,63]), as well as proxies estimating their presence, such as environmental variables influencing pollinators’ feeding and nesting functions at different scales. At a continental scale, climate and topographic conditions were found to most shape pollinator species distribution [64]. At the landscape scale, proximity and proportion of favorable, (semi-)natural habitats within the flight range of the species are thought to be main drivers of pollinators’ diversity [65,66]. At the local scale, defined as the plot or habitat scale, floral and nesting resource composition have been usually linked to pollination capacity [67,68,69]. In most studies, floral resources have been evaluated taking into account plant morphological traits and reward (pollen and nectar) quantity and quality [68,70], while nesting resources have been quantified by the abundance or diversity of nesting substrates, such as bare ground, dead wood, soil burrows and cavities or specific soil characteristics, e.g., moisture, texture or hardness etc. [62,63,67].
Reviewing 121 published studies of pollination service, Liss et al. [71] found that it was most often measured using more than one metric. The potential metrics are first limited to those that best represent the components that contribute to service provision. Ultimately, however, their selection depends on existing datasets. At the continental or regional scale habitat, linked variables dominate in modelling pollination potential of different land cover/use types [72,73,74], but see [75,76]. At the landscape or local scale habitat, suitability metrics are frequently combined with variables linked to the presence of pollinators estimated with different methods in the field [24].
Methods to combine pollination metrics range from simple linear relationships and composite indices to the full production functions approach [71]. For instance, Ricou et al. [68] proposed a vegetation-based indicator to assess the pollination value of field margin flora dependent of floral traits (flower size, color and UV reflection, the symmetry and shape of the corolla, pollen and nectar quantity and quality), as well as the flowering period and pollinator activity. In turn, Everaars et al. [77], in their research on solitary bees, suggested that the nest to foraging habitat ratio could be a promising and practical measure for comparing landscape suitability for pollinators. In both cases, the evaluation of the predictive quality yielded significant correlations between pollinator abundance and the indicator value. Other studies, however, showed that the pollinator abundance or richness could not always be directly related to in-site flower or nesting resources. Their predictive role may be limited to specific habitat types or pollinator groups [65,67,78]. Indeed, Torné-Noguera et al. [62] found that in Mediterranean scrubland (Spain), flower resources explained the distribution pattern of small species (with presumed smaller foraging range) but not that of large species (with wider foraging range). In turn, nesting substrate availability was a limiting factor only for species with more specialized nesting habits. In temperate forests, Taki et al. [32] pointed out the difference in habitat requirements of wild solitary and social bees. They reported preferences of the former for more open and early successional forests rich in floral and habitat resources and the latter for mature successional stands with high nesting suitability. The foraging ranges of social bees are likely wider than those of the majority of the solitary bees, so locally poorer floral resources do not influence their foraging.
In our study we developed and tested in the field a set of indicators to measure the pollination potential of riparian hardwood forests: five indicators of habitat potential (soil dryness, presence of large trees, habitat suitability for bumblebees, habitat suitability for solitary bees and nectar food base), and two indicators of pollinators’ potential (abundance of bumblebees and abundance of all Apoidea).
We had expected the abundance of pollinators to be linked to floral resources and nesting opportunities, however, we did not find such interrelations. This is in line with the study of Bartholomée et al. [69]. They observed only limited effects of in-field orchards’ understory flower and nesting resources on the abundance and richness of managed and wild pollinators. Other studies [63,67,70] reported a positive relationship between the abundance of pollinating insects and the nesting potential, but the latter was indicated differently, i.e., by the abundance of nesting substrates, such as bare ground, dead wood, and soil burrows and cavities.
One possible explanation seems to be the complexity of the pollination service. After all, it is a community-level service provided by a diverse set of pollinator species [79,80] and is a result of dynamic and complex relationships on different levels of ecological systems. The observed substantial differences among the test sites and among indicators suggest that the wild bee abundance is more related to the overall landscape pattern (e.g., occurrence of forest edges, mid-field trees, field margins) than to the characteristics of individual forest patches (see [81,82]). Pollinator species may occupy different habitat types for different resources or life-history stages e.g., one specific habitat for nesting and another habitat, at some distance from the nest, for forage [83,84]. Some of the observed bees are probably only visitors in riparian forests (they nest elsewhere), since it is often the case that necessary floral resources are offered in one ecosystem, while favorable nesting conditions are present in another, neighboring one [34,72,79]. Moreover, the availability of forage base, nesting sites and material for nests changes over time, and pollinators, in particular generalists, are not “tied” to one place and use resources throughout the landscape. This leads us to conclude that the pollination potential of riparian hardwood forests may fluctuate substantially throughout the season.
To find out if the indicators would give a more coherent picture if only the period of peak pollinator activity in riparian hardwood forests were taken into account, we assessed the potential of honey considering only the honey species that bloomed in April and May and compared it with bee abundance in that period (measured by both the route method and pan traps) and soil dryness (also measured in May). The correlations obtained were also insignificant (see Supplementary materials), with only a slightly stronger relationship between soil dryness and bumblebee density.
In turn, the low correlation between bumblebee abundance and other Apoidea (negative across the season and slightly positive in April/May) may stem from different measurement methods used. Pan trapping has been shown to underestimate bee richness and to provide an incomplete measure of flower visitation compared to netting of flower visiting insects [62]. On the other hand, it may result from the different biology and behavior of those insects (bumblebees comprised only 15% of Apoidea individuals caught in the pan traps). Small bees are typically restricted to open habitats [20] and are much less abundant within the mature forest [32,85,86]. Conversely, larger-bodied and therefore more mobile bumblebees might be better able to find resources throughout the landscape, especially because they are able to use a wide variety of floral resources along the season [87] and forage in less favorable weather conditions [88]. Therefore, the sporadically reported high pollinator densities in the tested forests, in particular of highly mobile bumblebees, do not reflect the real density of those organisms per hectare (neither at the landscape nor at the ecosystem level). That is why, in the adopted method, the extreme values were not the basis for calculating the pollination potential.
Beside the complexity of the pollination service, also the design of our research may have impacted the indicator interrelationships. Riparian hardwood forests in the Vistula valley are today highly fragmented and disturbed due to human activity, therefore a very limited number of patches were considered suitable for in-situ research. Although the number of samples per indicator (N = 12–126, Table 1) allowed to capture some variability, the number of the investigated forest sites (the lowest common level of analysis) was quite low (N = 6) to obtain significant relationships. Moreover, as the used proxy indicators of nesting suitability relate to different ecosystem characteristics than other indicators, it is not surprising that they were not correlated. We acknowledge that the relatively high and permanent soil dryness is only a necessary pre-condition to build and maintain the nest and further research related to the availability of rodent holes and cavities is needed to better understand the ground nesting potential of riparian hardwood forests. Similarly, the presence of large trees is only the proxy indicator of nesting potential and apparently other factors, as shown by the zero occupancy degree of artificial nests, contribute to limited nesting suitability of the investigated forest patches. Last but not least, as discussed above, riparian hardwood forests form today isolated forest patches and neighboring habitats influence both bee abundance and plant composition. Nonetheless, we believe that the careful selection of best preserved sites and the applied measures to mitigate the island effect (e.g., multifaceted approach, excluding invasive species, cutting off the outliers) give reasonable estimates of the pollination potential of riparian hardwood forests currently embedded in the agricultural landscape. The current extent of these forests is highly limited by agriculture and river engineering [8], but in fact, this forest type has never formed large uniform complexes. It developed naturally in the relatively narrow strips along lowland rivers, between the willow-poplar riparian forests and the forest communities developing beyond the floodplain. Therefore, the estimation of the pollination potential of this kind of forest without any biophysical effects from neighboring habitats has never been fully possible. Nonetheless, we acknowledge that the pollination service potential obtained for small forest patches cannot be easily translated to larger pristine forests of this type.

6. Conclusions

We conclude based on the obtained results that the small patches of riparian hardwood ash-elm forests in the middle Vistula valley have an overall higher potential to provide pollination service than reported earlier for riparian and other broadleaved temperate forests. Still, they are not ecosystems with outstanding pollination potential, but in a complex agricultural landscape, small patches of riparian forests play an important role in maintaining the diversity and abundance of wild pollinators, especially in early spring, when there is still no available food base in open areas.
The obtained high inconsistency among the seven indicators of pollination potential shows how highly multifaceted this service is and how difficult it is to comprehensively assess it. Either the indicators analyzed represent different aspects of pollination potential, or the sample size was too low to capture significant relationships.
In general, more direct indicators are preferred (in our case that would be bee abundance). However, using as indicators mobile organisms that follow food resources changing over time does not seem to be the best way to assess pollination potential, especially of fragmented ecosystems. Therefore, the indicators related to habitat potential (in particular the food base), although indirect, seem to show more accurately the potential of small patches of riparian hardwood forests to provide pollination service.

Supplementary Materials

The following are available online at https://www.mdpi.com/article/10.3390/f12070907/s1 (Supplementary information on the six test sites, input data upscaled for correlation analysis (April–July and April–May only) and correlation analysis for April–May), https://www.mdpi.com/article/10.3390/f12070907/s2 (Data from April–July) and https://www.mdpi.com/article/10.3390/f12070907/s3 (Data from April–May only).

Author Contributions

Conceptualization, A.N.A.; methodology, A.N.A. and E.K.; validation, A.N.A. and E.K.; formal analysis, A.N.A. and E.K.; investigation A.N.A., E.K., A.K. and E.R.; resources, A.N.A. and A.K.; data curation, A.N.A.; writing—original draft preparation, A.N.A., E.K., A.K. and E.R.; writing—review and editing, A.N.A., E.K., A.K., E.R. and K.A.; visualization, A.N.A.; supervision, A.N.A.; project administration, A.N.A., A.K.; funding acquisition, A.K., K.A. All authors have read and agreed to the published version of the manuscript.

Funding

This research was funded by the National Fund for Environmental Protection and Water Management in Poland (grant number 99/2017/Wn-07/Mn-PO/D), and the APC was funded by the Warsaw University of Technology.

Data Availability Statement

Data is contained within the supplementary material. The data presented in this study are available in Excel files: “Data_affek et_al”, and “Data_Affek et al. April–May only”.

Acknowledgments

We thank the four anonymous reviewers for their valuable suggestions and comments that helped greatly to improve our manuscript.

Conflicts of Interest

The authors declare no conflict of interest. The funders had no role in the design of the study; in the collection, analyses, or interpretation of data; in the writing of the manuscript, or in the decision to publish the results.

References

  1. Affek, A.N.; Degórski, M.; Wolski, J.; Solon, J.; Kowalska, A.; Roo-Zielińska, E.; Grabińska, B.; Kruczkowska, B. Ecosystem Service Potentials and Their Indicators in Postglacial Landscapes: Assessment and Mapping; Elsevier: Amsterdam, The Netherlands; Oxford, UK; Cambridge, UK, 2020; ISBN 9780128161340. [Google Scholar]
  2. TEEB. The Economics of Ecosystems and Biodiversity: Ecological and Economic Foundation; Kumar, P., Ed.; Earthscan: Cambridge, UK, 2010. [Google Scholar]
  3. Burkhard, B.; Kandziora, M.; Hou, Y.; Müller, F. Ecosystem service potentials, flows and demand—Concepts for spatial localisation, indication and quantification. Landsc. Online 2014, 34, 1–32. [Google Scholar] [CrossRef]
  4. Bastian, O.; Syrbe, R.U.; Rosenberg, M.; Rahe, D.; Grunewald, K. The five pillar EPPS framework for quantifying, mapping and managing ecosystem services. Ecosyst. Serv. 2013, 4, 15–24. [Google Scholar] [CrossRef]
  5. Spangenberg, J.H.; von Haaren, C.; Settele, J. The ecosystem service cascade: Further developing the metaphor. Integrating societal processes to accommodate social processes and planning, and the case of bioenergy. Ecol. Econ. 2014, 104, 22–32. [Google Scholar] [CrossRef]
  6. Bastian, O.; Haase, D.; Grunewald, K. Ecosystem properties, potentials and services—The EPPS conceptual framework and an urban application example. Ecol. Indic. 2012, 21, 7–16. [Google Scholar] [CrossRef]
  7. Affek, A.N.; Kowalska, A. Ecosystem potentials to provide services in the view of direct users. Ecosyst. Serv. 2017, 26, 183–196. [Google Scholar] [CrossRef]
  8. Tockner, K.; Stanford, J.A. Riverine flood plains: Present state and future trends. Environ. Conserv. 2002, 29, 308–330. [Google Scholar] [CrossRef] [Green Version]
  9. European Environment Agency Conservation Status and Trends of Habitats and Species. Available online: https://www.eea.europa.eu/themes/biodiversity/state-of-nature-in-the-eu/article-17-national-summary-dashboards/conservation-status-and-trends (accessed on 14 June 2021).
  10. Danielewicz, W.; Pawlaczyk, P. Łęgowe lasy dębowo-wiązowo-jesionowe (Ficario-Ulmetum). In Lasy i Bory. Poradniki Ochrony Siedlisk i Gatunków Natura 2000—Podręcznik Metodyczny. Tom 5; Herbich, J., Ed.; Ministerstwo Środowiska: Warszawa, Poland, 2004; pp. 242–258. [Google Scholar]
  11. Ochrona Przyrody i Środowiska w Dolinach Nizinnych rzek Polski [Nature and Environment Conservation in the Lowland River Valleys of Poland]; Tomiałojć, L. (Ed.) Instytut Ochrony Przyrody PAN: Kraków, Poland, 1993. [Google Scholar]
  12. Riis, T.; Kelly-Quinn, M.; Aguiar, F.C.; Manolaki, P.; Bruno, D.; Bejarano, M.D.; Clerici, N.; Fernandes, M.R.; Franco, J.C.; Pettit, N.; et al. Global overview of ecosystem services provided by riparian vegetation. BioScience 2020. [Google Scholar] [CrossRef]
  13. Kowalska, A.; Affek, A.; Wolski, J.; Regulska, E.; Kruczkowska, B.; Zawiska, I.; Kołaczkowska, E.; Baranowski, J. Assessment of regulating ES potential of lowland riparian hardwood forests in Poland. Ecol. Indic. 2021, 120, 106834. [Google Scholar] [CrossRef]
  14. Haines-Young, R.H.; Potschin, M.B. Common International Classification of Ecosystem Services (CICES) V5.1. and Guidance on the Application of the Revised Structure; Fabis Consulting Ltd: Nottingham, UK, 2018. [Google Scholar]
  15. Potts, S.G.; Imperatriz-Fonseca, V.; Ngo, H.T.; Aizen, M.A.; Biesmeijer, J.C.; Breeze, T.D.; Dicks, L.V.; Garibaldi, L.A.; Hill, R.; Settele, J.; et al. Safeguarding pollinators and their values to human well-being. Nature 2016, 540, 220–229. [Google Scholar] [CrossRef]
  16. Ollerton, J.; Winfree, R.; Tarrant, S. How many flowering plants are pollinated by animals? Oikos 2011, 120, 321–326. [Google Scholar] [CrossRef]
  17. Klein, A.-M.; Vaissiere, B.E.; Steffan-Dewenter, I.; Cunningham, S.A.; Kremen, C.; Tscharntke, T. Importance of pollinators in changing landscapes for world crops. Proc. R. Soc. B 2007, 274, 303–313. [Google Scholar] [CrossRef] [Green Version]
  18. Lautenbach, S.; Seppelt, R.; Liebscher, J.; Dormann, C.F. Spatial and temporal trends of global pollination benefit. PLoS ONE 2012, 7. [Google Scholar] [CrossRef] [Green Version]
  19. Willmer, P.G.; Cunnold, H.; Ballantyne, G. Insights from measuring pollen deposition: Quantifying the pre-eminence of bees as flower visitors and effective pollinators. Arthropod-Plant Interact. 2017, 11, 411–425. [Google Scholar] [CrossRef] [Green Version]
  20. Michener, C.D. The Bees of the World, 2nd ed.; The Johns Hopkins University Press: Baltimore, MD, USA, 2007; Volume 85, ISBN 978-0-8018-8573-0. [Google Scholar]
  21. Nogué, S.; Long, P.R.; Eycott, A.E.; De Nascimento, L.; Fernández-Palacios, J.M.; Petrokofsky, G.; Vandvik, V.; Willis, K.J. Pollination service delivery for European crops: Challenges and opportunities. Ecol. Econ. 2016, 128, 1–7. [Google Scholar] [CrossRef] [Green Version]
  22. Egoh, B.; Drakou, E.G.; Dunbar, M.B.; Maes, J.; Willemen, L. Indicators for Mapping Ecosystem Services: A Review; Publications Office of the European Union: Luxembourg, 2012. [Google Scholar]
  23. Kleijn, D.; Winfree, R.; Bartomeus, I.; Carvalheiro, L.G.; Henry, M.; Isaacs, R.; Klein, A.M.; Kremen, C.; M’Gonigle, L.K.; Rader, R.; et al. Delivery of crop pollination services is an insufficient argument for wild pollinator conservation. Nat. Commun. 2015, 6. [Google Scholar] [CrossRef] [Green Version]
  24. Bartholomée, O.; Lavorel, S. Disentangling the diversity of definitions for the pollination ecosystem service and associated estimation methods. Ecol. Indic. 2019, 7, 105576. [Google Scholar] [CrossRef]
  25. Burkhard, B.; Kroll, F.; Nedkov, S.; Müller, F. Mapping ecosystem service supply, demand and budgets. Ecol. Indic. 2012, 21, 17–29. [Google Scholar] [CrossRef]
  26. Affek, A.N. Indicators of ecosystem potential for pollination and honey production. Ecol. Indic. 2018, 94, 33–45. [Google Scholar] [CrossRef]
  27. Matuszkiewicz, J.M. Kompleksowe Mapy Roślinności Doliny Wisły Środkowej i Dolnej IGiPZ PAN. Available online: https://www.igipz.pan.pl/roslinnosc-dolina-wisly.html (accessed on 23 December 2020).
  28. Kowalska, A.; Affek, A.; Regulska, E.; Wolski, J.; Kruczkowska, B.; Kołaczkowska, E.; Zawiska, I.; Baranowski, J. Łęgi jesionowo-wiązowe w dolinie środkowej Wisły—stan ekosystemów pozbawionych zalewów i wytyczne do działań ochronnych [Riparian hardwood forests in the valley of the middle Vistula—ecosystem condition in the absence of flooding, and guidelines for protection]. Prz. Geogr. 2019, 91, 295–323. [Google Scholar] [CrossRef]
  29. Maes, J.; Teller, A.; Erhard, M.; Grizzetti, B.; Barredo, J.; Paracchini, M.; Condé, S.; Somma, F.; Orgiazzi, A.; Jones, A.; et al. Mapping and Assessment of Ecosystems and Their Services: An Analytical Framework for Ecosystem Condition; Publications Office of the European Union: Luxembourg, 2018. [Google Scholar]
  30. Winfree, R. The conservation and restoration of wild bees. Ann. N. Y. Acad. Sci. 2010, 1195, 169–197. [Google Scholar] [CrossRef]
  31. Greenleaf, S.S.; Williams, N.M.; Winfree, R.; Kremen, C. Bee foraging ranges and their relationship to body size. Oecologia 2007, 153, 589–596. [Google Scholar] [CrossRef]
  32. Taki, H.; Okochi, I.; Okabe, K.; Inoue, T.; Goto, H.; Matsumura, T.; Makino, S. Succession Influences Wild Bees in a Temperate Forest Landscape: The Value of Early Successional Stages in Naturally Regenerated and Planted Forests. PLoS ONE 2013, 8. [Google Scholar] [CrossRef] [Green Version]
  33. Kells, A.R.; Goulson, D. Preferred nesting sites of bumblebee queens (Hymenoptera: Apidae) in agroecosystems in the UK. Biol. Conserv. 2003. [Google Scholar] [CrossRef]
  34. Westrich, P. Habitat requirements of central European bees and the problems of partial habitats. In The Conservation of Bees; Matheson, A., Buchmann, S.L., O’Toole, C., Westrich, P., Williams, I.H., Eds.; Academic Press for the Linnean Society of London and IBRA: London, UK, 1996; pp. 1–16. [Google Scholar]
  35. Braun-Blanquet, J. Pflanzensoziologie. Grundzüge der Vegetationskunde; Springer: Wien, Austria, 1964. [Google Scholar]
  36. Szklanowska, K. Bory jako baza pożytkowa pszczół [Pine forests as a bee pasture]. Pszczel. Zesz. Nauk. 1973, 17, 51–85. [Google Scholar]
  37. Demianowicz, Z.; Hłyń, M.; Jabłoński, B.; Maksymiuk, I.; Podgórska, J.; Ruszkowska, B.; Szklanowska, K.; Zimna, J. Wydajność miodowa ważniejszych roślin miododajnych w warunkach Polski. Część I [Honey potential of the major honey-producing plants in Poland. Part I]. Pszczel. Zesz. Nauk. 1960, 4, 87–104. [Google Scholar]
  38. Szklanowska, K. Nektarowanie i wydajność miodowa ważniejszych roślin runa lasu liściastego [Nectar secretion and honey potential of some more important undergrowth plants in deciduous forest]. Pszczel. Zesz. Nauk. 1979, 23, 123–130. [Google Scholar]
  39. Maksymiuk, I. Nektarowanie lipy drobnolistnej Tilia Cordata Mill. w Rezerwcie Obrożyska koło Muszyny [The nectar secretion of linden Tilia Cordata Mill. at the Reserve Obrożyska near Muszyna (Carpathians)]. Pszczel. Zesz. Nauk. 1960, 4, 105–125. [Google Scholar]
  40. Kołtowski, Z. Wielki Atlas Roślin Miododajnych [The Great Atlas of Melliferous Plants]; Przedsiębiorstwo Wydawnicze Rzeczpospolita SA: Warszawa, Poland, 2006. [Google Scholar]
  41. Ruszkowski, A.; Zadura, M.; Biliński, M.; Gosek, J.; Kaczmarska, K. Wiosenny wzorzec składu gatunkowego trzmieli (Bombus Latr.) na różnych roślinach. Pszczel. Zesz. Nauk. 1997, 41, 43–51. [Google Scholar]
  42. Jabłoński, B. Notes on the method to investigate nectar secretion rate in flowers. J. Apic. Sci. 2002, 46, 117–125. [Google Scholar]
  43. Szklanowska, K. Nektarowanie i wydajność miodowa niektórych drzew i krzewów w warunkach Polski. Pszczel. Zesz. Nauk. 1978, 22, 117–128. [Google Scholar]
  44. Bumblebee Conservation Trust Help Us to Count the UK’s Bumblebees. Available online: https://www.bumblebeeconservation.org/surveys/ (accessed on 23 December 2020).
  45. Banaszak, J. Studies on methods of censusing the numbers of bees (Hymenoptera, Apoidea). Pol. Ecol. Stud. 1980, 6, 355–366. [Google Scholar]
  46. Droege, S.; Engler, J.D.; Sellers, E.A.; O’Brien, L.U.S. National Protocol Framework for the Inventory and Monitoring of Bees; Inventory and Monitoring, National Wildlife Refuge System, U.S. Fish and Wildlife Service: Fort Collins, CO, USA, 2016.
  47. Hampel, F.R.; Ronchetti, E.M.; Rousseeuw, P.J.; Stahel, W.A. Robust Statistics: The Approach Based on Influence Functions; Wiley: New York, NY, USA, 1986; ISBN 978-0471829218. [Google Scholar]
  48. Farazi, M.M.; Imon, A. Detection of Outliers in Gene Expression Data Using Expressed Robust-t Test. Malays. J. Math. Sci. 2016, 10, 117–135. [Google Scholar]
  49. Krishnan, S.; Wiederkehr Guerra, G.; Bertrand, D.; Wertz-Kanounnikoff, S.; Kettle, C.J. The Pollination Services of Forests: A Review of Forest and Landscape Interventions to Enhance Their Cross-Sectoral Benefits; FAO and Biodiversity International: Rome, Italy, 2020; ISBN 978-92-5-132813-2. [Google Scholar]
  50. Banaszak, J.; Jaroszewicz, B. Bees of the Białowieża National Park and adjacent areas, NE Poland (Hymenoptera: Apoidea, Apiformes). Pol. J. Entomol. 2009, 78, 281–313. [Google Scholar]
  51. Banaszak, J.; Szefer, P. Pszczoły (Hymenoptera: Apoidea) Równiny Sępopolskiej. Cz. I. Różnorodność gatunkowa. Wiad. Entomol. 2013, 32, 185–201. [Google Scholar]
  52. Droege, S.; Tepedino, V.J.; Lebuhn, G.; Link, W.; Minckley, R.L.; Chen, Q.; Conrad, C. Spatial patterns of bee captures in North American bowl trapping surveys. Insect Conserv. Divers. 2010. [Google Scholar] [CrossRef]
  53. Banaszak, J. Pszczoły (Apoidea) grądów i dąbrów świetlistych Niziny Mazowieckiej. Zesz. Nauk. Akad. Bydgoskiej Im. Kazimierza Wielkiego W Bydgoszczy. Studia Przyr. 1990, 8, 23–36. [Google Scholar]
  54. Sobieraj-Betlińska, A.; Banaszak, J. Zadrzewienia śródpolne jako ostoje pszczół [Mid-field woodlots as refuges for bees]. Wiad. Entomol. 2017, 36, 111–123. [Google Scholar]
  55. Banaszak, J.; Cierzniak, T. Ocena stopnia zagrożeń i możliwości ochrony owadów w agroekosystemach. Wiad. Entomol. 2000, 18, 73–94. [Google Scholar]
  56. Banaszak, J.; Krzysztofiak, A. Communities of bees in the forests of Poland. In Natural Resources of Wild Bees in Poland; Banaszak, J., Ed.; Pedagogical University: Bydgoszcz, Poland, 1992; pp. 33–40. [Google Scholar]
  57. Banaszak, J. Strategy for conservation of wild bees in an agricultural landscape. Agric. Ecosyst. Environ. 1992, 40, 179–192. [Google Scholar] [CrossRef]
  58. Cunningham-Minnick, M.J.; Crist, T.O. Floral resources of an invasive shrub alter native bee communities at different vertical strata in forest-edge habitat. Biol. Invasions 2020, 22, 2283–2298. [Google Scholar] [CrossRef]
  59. Smith, C.; Weinman, L.; Gibbs, J.; Winfree, R. Specialist foragers in forest bee communities are small, social or emerge early. J. Anim. Ecol. 2019, 88, 1158–1167. [Google Scholar] [CrossRef]
  60. Roulston, T.H.; Goodell, K. The role of resources and risks in regulating wild bee populations. Annu. Rev. Entomol. 2011, 56, 293–312. [Google Scholar] [CrossRef] [PubMed] [Green Version]
  61. Winfree, R.; Kremen, C. Are ecosystem services stabilized by differences among species? A test using crop pollination. Proc. R. Soc. B Biol. Sci. 2009, 276, 229–237. [Google Scholar] [CrossRef] [Green Version]
  62. Torné-Noguera, A.; Rodrigo, A.; Arnan, X.; Osorio, S.; Barril-Graells, H.; Da Rocha-Filho, L.C.; Bosch, J. Determinants of spatial distribution in a bee community: Nesting resources, flower resources, and body size. PLoS ONE 2014, 9, e97255. [Google Scholar] [CrossRef] [Green Version]
  63. Rodríguez, A.; Kouki, J. Emulating natural disturbance in forest management enhances pollination services for dominant Vaccinium shrubs in boreal pine-dominated forests. For. Ecol. Manag. 2015, 350, 1–12. [Google Scholar] [CrossRef]
  64. Bystriakova, N.; Griswold, T.; Ascher, J.S.; Kuhlmann, M. Key environmental determinants of global and regional richness and endemism patterns for a wild bee subfamily. Biodivers. Conserv. 2018, 27, 287–309. [Google Scholar] [CrossRef]
  65. Carré, G.; Roche, P.; Chifflet, R.; Morison, N.; Bommarco, R.; Harrison-Cripps, J.; Krewenka, K.; Potts, S.G.; Roberts, S.P.M.; Rodet, G.; et al. Landscape context and habitat type as drivers of bee diversity in European annual crops. Agric. Ecosyst. Environ. 2009, 133, 40–47. [Google Scholar] [CrossRef]
  66. Garibaldi, L.A.; Steffan-Dewenter, I.; Kremen, C.; Morales, J.M.; Bommarco, R.; Cunningham, S.A.; Carvalheiro, L.G.; Chacoff, N.P.; Dudenhöffer, J.H.; Greenleaf, S.S.; et al. Stability of pollination services decreases with isolation from natural areas despite honey bee visits. Ecol. Lett. 2011, 14, 1062–1072. [Google Scholar] [CrossRef]
  67. Potts, S.G.; Vulliamy, B.; Roberts, S.; O’Toole, C.; Dafni, A.; Ne’eman, G.; Willmer, P. Role of nesting resources in organising diverse bee communities in a Mediterranean landscape. Ecol. Entomol. 2005, 30, 78–85. [Google Scholar] [CrossRef]
  68. Ricou, C.; Schneller, C.; Amiaud, B.; Plantureux, S.; Bockstaller, C. A vegetation-based indicator to assess the pollination value of field margin flora. Ecol. Indic. 2014, 45, 320–331. [Google Scholar] [CrossRef]
  69. Bartholomée, O.; Aullo, A.; Becquet, J.; Vannier, C.; Lavorel, S. Pollinator presence in orchards depends on landscape-scale habitats more than in-field flower resources. Agric. Ecosyst. Environ. 2020, 293, 106806. [Google Scholar] [CrossRef]
  70. Potts, S.G.; Vulliamy, B.; Dafni, A.; Ne’eman, G.; Willmer, P. Linking bees and flowers: How do floral communities structure pollinator communities? Ecology 2003, 84, 2628–2642. [Google Scholar] [CrossRef] [Green Version]
  71. Liss, K.N.; Mitchell, M.G.E.; Macdonald, G.K.; Mahajan, S.L.; Méthot, J.; Jacob, A.L.; Maguire, D.Y.; Metson, G.S.; Ziter, C.; Dancose, K.; et al. Variability in ecosystem service measurement: A pollination service case study. Front. Ecol. Environ. 2013, 11, 414–422. [Google Scholar] [CrossRef] [Green Version]
  72. Lonsdorf, E.; Kremen, C.; Ricketts, T.; Winfree, R.; Williams, N.; Greenleaf, S. Modelling pollination services across agricultural landscapes. Ann. Bot. 2009, 103, 1589–1600. [Google Scholar] [CrossRef] [Green Version]
  73. Zulian, G.; Maes, J.; Paracchini, M. Linking Land Cover Data and Crop Yields for Mapping and Assessment of Pollination Services in Europe. Land 2013, 2, 472–492. [Google Scholar] [CrossRef] [Green Version]
  74. Schulp, C.J.E.; Lautenbach, S.; Verburg, P.H. Quantifying and mapping ecosystem services: Demand and supply of pollination in the European Union. Ecol. Indic. 2014, 36, 131–141. [Google Scholar] [CrossRef]
  75. Polce, C.; Termansen, M.; Aguirre-Gutiérrez, J.; Boatman, N.D.; Budge, G.E.; Crowe, A.; Garratt, M.P.; Pietravalle, S.; Potts, S.G.; Ramirez, J.A.; et al. Species Distribution Models for Crop Pollination: A Modelling Framework Applied to Great Britain. PLoS ONE 2013, 8, e76308. [Google Scholar] [CrossRef]
  76. Perennes, M.; Diekötter, T.; Groß, J.; Burkhard, B. A hierarchical framework for mapping pollination ecosystem service potential at the local scale. Ecol. Model. 2021, 444, 109484. [Google Scholar] [CrossRef]
  77. Everaars, J.; Settele, J.; Dormann, C.F. Fragmentation of nest and foraging habitat affects time budgets of solitary bees, their fitness and pollination services, depending on traits: Results from an individual-based model. PLoS ONE 2018, 13, e0188269. [Google Scholar] [CrossRef] [PubMed] [Green Version]
  78. Häussler, J.; Sahlin, U.; Baey, C.; Smith, H.G.; Clough, Y. Pollinator population size and pollination ecosystem service responses to enhancing floral and nesting resources. Ecol. Evol. 2017, 7, 1898–1908. [Google Scholar] [CrossRef]
  79. Kremen, C.; Williams, N.M.; Aizen, M.A.; Gemmill-Herren, B.; LeBuhn, G.; Minckley, R.; Packer, L.; Potts, S.G.; Roulston, T.; Steffan-Dewenter, I.; et al. Pollination and other ecosystem services produced by mobile organisms: A conceptual framework for the effects of land-use change. Ecol. Lett. 2007, 10, 299–314. [Google Scholar] [CrossRef]
  80. Ricketts, T.H.; Williams, N.M.; Mayfield, M.M. Connectivity and ecosystem services: Crop pollination in agricultural landscapes. In Connectivity Conservation; Crooks, K., Sanjayan, M., Eds.; Cambridge University Press: Cambridge, UK, 2006; pp. 255–290. [Google Scholar]
  81. Steffan-Dewenter, I.; Münzenberg, U.; Bürger, C.; Thies, C.; Tscharntke, T. Scale-dependent effects of landscape context on three pollinator guilds. Ecology 2002, 83, 1421–1432. [Google Scholar] [CrossRef]
  82. Westphal, C.; Steffan-Dewenter, I.; Tscharntke, T. Bumblebees experience landscapes at different spatial scales: Possible implications for coexistence. Oecologia 2006, 149, 289–300. [Google Scholar] [CrossRef]
  83. Gathmann, A.; Tscharntke, T. Foraging ranges of solitary bees. J. Anim. Ecol. 2002, 71, 757–764. [Google Scholar] [CrossRef]
  84. Williams, N.M.; Tepedino, V.J. Consistent mixing of near and distant resources in foraging bouts by the solitary mason bee Osmia lignaria. Behav. Ecol. 2003. [Google Scholar] [CrossRef] [Green Version]
  85. Winfree, R.; Griswold, T.; Kremen, C. Effect of human disturbance on bee communities in a forested ecosystem. Conserv. Biol. 2007, 21, 213–223. [Google Scholar] [CrossRef]
  86. Roberts, H.P.; King, D.I.; Milam, J. Factors affecting bee communities in forest openings and adjacent mature forest. For. Ecol. Manag. 2017, 394, 111–122. [Google Scholar] [CrossRef] [Green Version]
  87. Carvell, C.; Meek, W.R.; Pywell, R.F.; Goulson, D.; Nowakowski, M. Comparing the efficacy of agri-environment schemes to enhance bumble bee abundance and diversity on arable field margins. J. Appl. Ecol. 2007, 44, 29–40. [Google Scholar] [CrossRef]
  88. Broussard, M.; Rao, S.; Stephen, W.P.; White, L. Native bees, Honeybees, and pollination in Oregon cranberries. HortScience 2011, 46, 885–888. [Google Scholar] [CrossRef] [Green Version]
Figure 1. Study area—six riparian hardwood forest test sites in the middle Vistula valley in Poland (1. Bielino, 2. Białobrzegi, 3. Arciechówek, 4. Jabłonna, 5. Kępa Oborska, 6. Łyczyńskie Olszyny). Basemap source: OpenStreetMap.
Forests 12 00907 g001
Figure 2. Nest traps for bumblebees (photo: A. Affek).
Forests 12 00907 g002
Figure 3. Nest traps for solitary bees (photo: A. Affek).
Forests 12 00907 g003
Figure 4. Distribution of traps on one of the forest test sites (Bielino).
Forests 12 00907 g004
Figure 5. Moericke color pan traps (photo: A. Affek).
Forests 12 00907 g005
Figure 6. A nest trap for bumblebees inhabited by wasps (photo: A. Affek).
Forests 12 00907 g006
Figure 7. Hollow reed stems in nesting boxes at the end of the growing season: on the left, three stems fully sealed with live larvae, on the right, five stems with a damaged cap (photo: A. Affek).
Forests 12 00907 g007
Figure 8. Bumblebees foraging on the flowers of Glechoma hederacea (left) and Lamium maculatum (right) (photo A. Affek).
Forests 12 00907 g008
Figure 9. Monthly distribution curves for the number of bumblebees and all the bees (Apoidea) trapped daily per pan trap.
Forests 12 00907 g009
Table 1. Indicators of forest potential to provide pollination service (N—sample size).
NoIndicatorMeasureUnitReferenceN
1Soil dryness100-gravimetric water content in topsoil%soil sample22
2Presence of large treesDBH of the largest treecmrelevé18
3Habitat suitability for bumblebeesOccupancy degree of bumblebee nest traps%trap12
4Habitat suitability for solitary beesOccupancy degree of solitary bee nest traps%trap12
5Food baseHoney potential of the ecosystemkg ha−1 year−1relevé51
6Abundance of bumblebeesBumblebee density from the route methodindividuals ha−1observation51
7Abundance of bees (Apoidea)Number of captured Apoidea per day into the pan trapindividuals day−1sample126
Table 2. Indicator values. Maximum value preceded by cutting off the outliers (AdjMax) of sampled cases serves as a threshold level showing the potential of riparian hardwood forest (as an ecosystem type) to deliver pollination.
Dimension Pollination IndicatorMinMeanMedianAdjMaxMax
Habitat potential1Soil dryness [%]47.175.678.390.490.4
2Presence of large trees [max DBH in cm]36.566.269.0110.0110.0
3Habitat suitability for bumblebees00000
4Habitat suitability for solitary bees00000
5Nectar food base [kg ha−1]7.5112.857.4200.2575.1
Pollinators potential6Abundance of bumblebees [individuals ha−1]0163100500850
7Abundance of bees (Apoidea) [individuals day−1 trap−1]00.140.080.421.60
Table 3. Honey potential, cover in each forest layer and cover-weighted honey potential of melliferous plants growing in riparian hardwood forests along the middle Vistula River (N of relevés = 51). Species honey potential after Demianowicz et al. [37], Kołtowski [40], Ruszkowski et al. [41], and Szklanowska [38].
No.Melliferous PlantHoney Potential [kg ha−1]Cover in Tree Layer [%]Cover in Shrub Layer [%]Cover in Herb Layer [%]Honey Potential Weighted by Overall Cover [kg ha−1]
1Solidago gigantea Aiton 17000.000.008.0556.33
2Scrophularia nodosa L.7000.000.000.886.18
3Angelica sylvestris L.2000.000.000.010.01
4Tilia cordataMill.2001.030.290.202.65
5Stachys sylvatica L.*1400.000.001.472.06
6Lamium maculatum L.1400.000.008.9212.49
7Ajuga reptans L.1200.000.000.200.24
8Rubus idaeus L.1200.006.721.9110.35
9Acer platanoides L.1006.860.492.807.36
10Frangula alnusMill.800.000.390.000.31
11Ribes nigrum L.600.000.740.000.44
12Acer pseudoplatanus L.500.290.100.200.20
13Acer campestre L.500.100.000.100.05
14Pulmonaria obscuraDumort.350.000.003.191.12
15Acer negundo L. *,2300.440.300.000.22
16Prunus cerasiferaEhrh.300.000.100.000.03
17Salix alba L.300.200.100.000.09
18Galeobdolon luteumHuds.200.000.000.440.09
19Sorbus aucupariaL. Em.Hedl.200.540.590.390.23
20Rubus caesius L.200.000.3412.012.47
21Taraxacum officinaleF. H. Wigg. 2200.000.000.010.00
22Malus sylvestris L.150.100.000.000.01
23Crataegus monogynaJacq.151.620.930.390.38
24Prunus padus L.1221.2714.264.614.26
25Glechoma hederacea L. *100.000.0032.703.27
26Viola reichenbachianaBoreau100.000.000.740.07
27Chelidonium majus L. *100.000.004.360.44
28Polygonatum multiflorum(L.) All. *100.000.000.390.04
29Ribes spicatumE.Robson *100.005.790.100.59
30Galeopsis pubescensBesser *,2100.000.001.080.11
31Galeopsis speciosaMill. *100.000.001.130.11
32Oxalis acetosella L. *100.000.005.930.59
* Species honey potential estimated based on indirect data. 1 Invasive alien species; 2 Open habitat species.
Table 4. Spearman’s rho correlation coefficient (with grey filling) with p values (no filling).
Abundance of Bees (Apoidea)Food BaseAbundance of BumblebeesSoil DrynessPresence of Large Trees
Abundance of bees (Apoidea) 0.26−0.640.26−0.20
Food base0.62 −0.550.310.55
Abundance of bumblebees0.170.26 0.23−0.02
Soil dryness0.620.540.66 0.23
Presence of large trees0.700.260.980.66
Publisher’s Note: MDPI stays neutral with regard to jurisdictional claims in published maps and institutional affiliations.

