Article

Characteristic Value of the Modulus of Elasticity (MOE) for Natural and Planted Larch in Northeast China

1
Research Institute of Wood Industry, Chinese Academy of Forestry, Beijing 100091, China
2
Division of Structural Mechanics, Lund University, SE 221 00 Lund, Sweden
*
Author to whom correspondence should be addressed.
Forests 2021, 12(7), 883; https://doi.org/10.3390/f12070883
Submission received: 11 June 2021 / Revised: 30 June 2021 / Accepted: 2 July 2021 / Published: 6 July 2021
(This article belongs to the Special Issue Forest Sustainability: Wood Yield and Biomass Utilization)

Abstract

:
The density and modulus of elasticity (MOE) distribution can provide information on the effectiveness of parametric and non-parametric methods in calculating the characteristic value of MOE. In this study, we aim to determine the optimal distribution model of the actual measured data of the lumber. We also estimate the lumber’s MOE characteristic value and compare the difference in density and MOE between natural and planted larch. Approximately 1200 pieces of dimension lumber of 4 m × 140 mm × 40 mm in size, made from larch and planted larch, were obtained, tested, and the corresponding standard MOE value was calculated. Results revealed the 3-parameter Weibull distribution to be optimal in fitting the natural and planted larch distributions. The parametric method proved effective in calculating the characteristic value of both larch groups, with characteristic MOE values of 9.73 kN/mm2 and 8.84 kN/mm2, and characteristic density values of 530 kg/m3 and 460 kg/m3 for natural and planted larch, respectively. Moreover, the MOE and density values followed grades C40 and C35. Thus, the conclusion is that the parametric method should be used to determine these characteristic values for natural and planted larch.

1. Introduction

Wood is an environmentally friendly building material that is widely used in civil buildings and public constructions across Europe, North American, Japan, and other regions, due to its carbon storage capabilities, low density, high strength, good seismic performance, aesthetically pleasant appearance, and positive effects on indoor environments, such as air humidity control, bactericidal action, and good smell [1]. The rapid development of wood buildings in China relies largely on both natural forest and imported wood. However, there is a lack of full-sized mechanical test data of fast-growing plantation wood, which limits the use of plantation wood in the field of wood structure materials and wood buildings. Planted larch can overcome the problem of slow-growing natural larch by improving the utilization of planted forests, particularly in China, decreasing the dependence on natural wood and thus protecting natural forests.
As a structural timber resource, larch is well-suited for wood construction in China and Russia due to its high strength [2] and wide distribution in the Far East of Russia and Northeast and Northern China. Furthermore, natural and plantation larch forests are one of the most important wood species in China, supplying the largest amount of structural lumber in the country. Extensive research has been performed on the classification and full-scale mechanical property determination of larch, collecting valuable experimental data and providing theoretical support for the safe use of larch in wood structures and buildings [3,4,5]. Full-size experimental tests on natural larch lumber have been reported by Zhong [6,7], Jiang [3], Lou [8], and Wang [9] et al., promoting the utilization of natural larch in China. However, studies on the full-size mechanical properties of planted larch lumber are limited, leading to a lack of test data for timber design applications. Thus, in order to use planted larch to build frame structures and grade the lumber by stress, experimental tests (particularly those based on full-size lumber) with extensive samples are urgently required to provide basic data support for the necessary calculations in timber design.
Dimension lumber is the lumber processed to a specified size according to a standard or code [10]. The modulus of elasticity (MOE) of the dimension lumber is key for the grading of lumber, the design of wood structures [11], and, in particular, to determine the level of deflection that meets the serviceability limit states under bending [12]. The MOE of dimension lumber is commonly investigated using static test methods (denoted as MOEstatic). However, such test procedures are time-consuming, labor-intensive, and can damage the lumber. Therefore, non-destructive tests (NDTs) have been developed to replace static test methods and to determine the MOEDynamic of lumber [9]. NDTs are convenient, save time, and most importantly they do not damage the lumber. Commonly used NDT techniques include the transverse vibration method, the longitudinal fundamental frequency vibration (FFV) test method, and the stress wave method [13,14,15]. The FFV method is commercially employed for stress grading and developments and can be combined with laser scanning. Previous work has reported the accurate and robust MOEDynamic measurements via the FFV method [16,17,18]. Experimental tests reveal the correlation coefficients (R2) between the dynamic elastic modulus (MOEDynamic) and static elastic modulus (MOEstatic) determined by the FFV and static test method to exceed 0.8 [14,19,20]. Therefore, the MOEstatic can potentially be replaced by MOEDynamic to grade the lumber and estimate the deflection.
In the current study, we focused on obtaining more data and knowledge on natural and planted larch for designing and grading the wood and lumber. In particular, the MOEDynamic and density differences between natural and planted larch lumbers were analyzed and compared, and we also extensively measured the MOEstatic numbers of natural and planted larch lumber via the FFV test method. Moreover, the density and MOEDynamic distributions were evaluated by fitting them with normal, lognormal, and Weibull distribution functions. The density and MOEDynamic differences were compared between natural and planted larch, and the characteristic values of the density and MOEDynamic of natural and planted larch dimension lumber were evaluated based on the density and MOEDynamic distributions. In the end, parameter and non-parameter methods were used to calculate the characteristic values, to compare which method was more suitable, and to determine the characteristic values for natural and planted larch.

2. Materials and Methods

2.1. Materials and Equipment

Natural and planted larch from Northeast China were used to process the dimension lumber. Natural larch (Larix gemlinii) logs with diameters of 25 cm to 35 cm, a length of 4 m, and a ring number between 20 and 30 were taken from Mohe Forest Farm in Heilongjiang, China. Planted larch (Larix keampferi Carr) logs of similar size were collected from Qingyuan Forest Farm in Liaoning, China. All the logs underwent sawing, kiln drying, and planing to obtain dimension lumber of 4 m × 140 mm × 40 mm in size (longitudinal × tangential × radial). A total of 600 lumber samples were prepared for both the natural and planted larch. The moisture content of the samples ranged within 12.21 ± 2.57%.
A frequency collector sensor and Fast Fourier Vibration analyzer (FAKOPP Enterprise BT) were used for the FFV tests. Furthermore, we used a band tape (SATA Tools Company, Shanghai, China) and digital slide calipers (MITUTOYO) with accuracies of 1 mm and 0.01 mm to measure the lumber length and thickness/width, respectively. An electronic weight scale (METTLER TOLEDO) was used to determine the lumber weight to an accuracy of 0.05 kg, while a portable moisture meter (Sanliang) with an accuracy of 0.1% was employed to test the moisture content of the lumber. A universal mechanical test machine (Jinanshijin Company, Jinan, China) with a 30 t load was used to test the static MOE and the collection load and deflection was performed via a TDS-530 data collector (Tokyo Measuring Instrument Company in Tokyo, Japan).

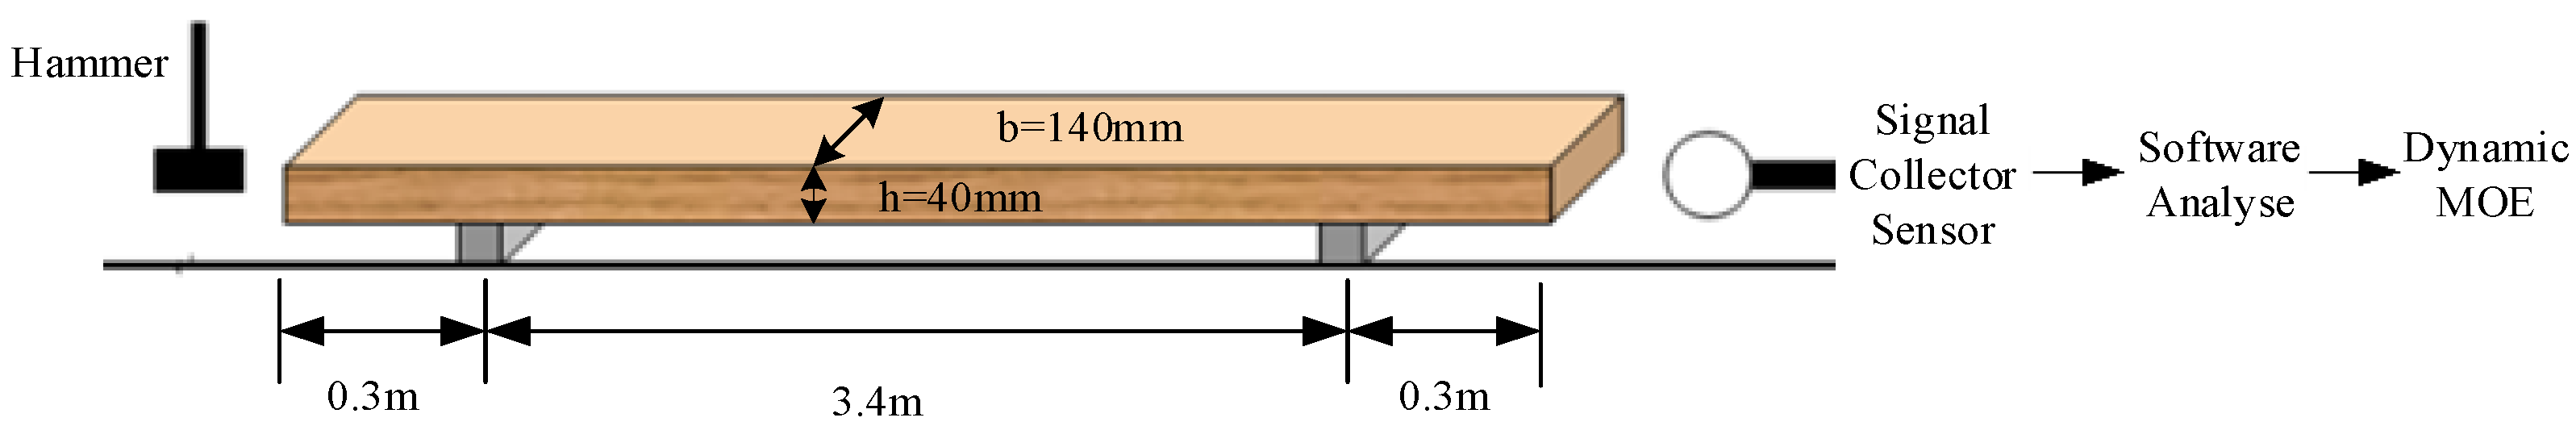
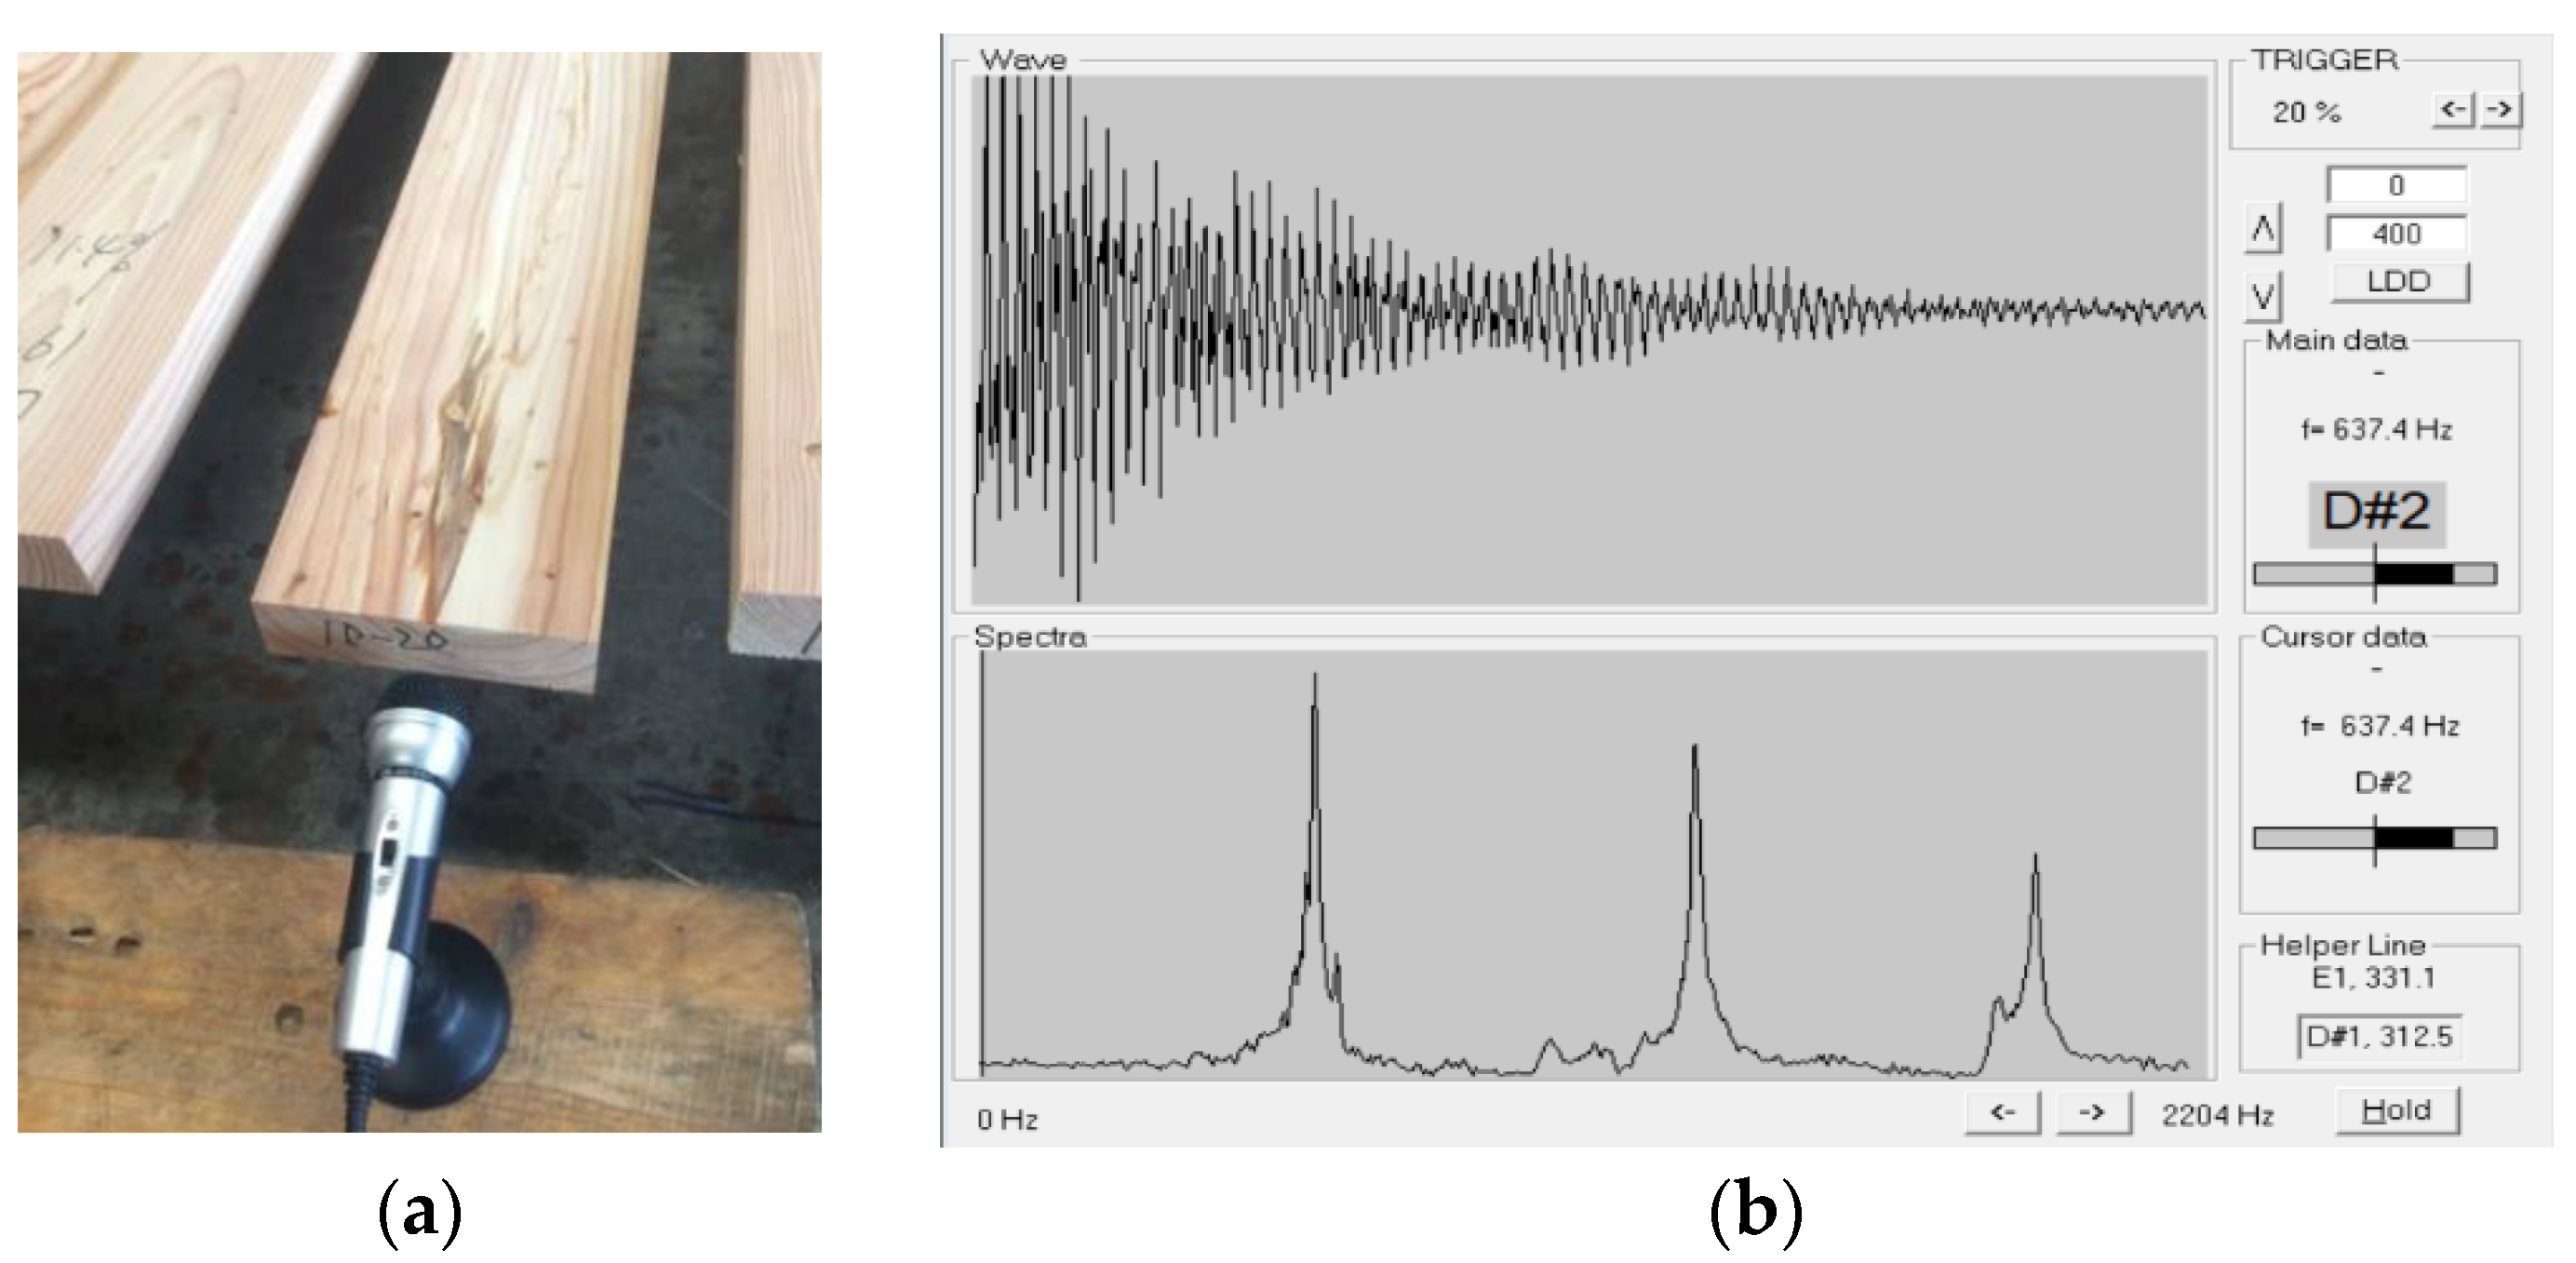
2.2. Lumber Density and Dynamic MOE Testing

Following processing, the dimension lumber samples were marked with a number and stored in an air-drying shed for more than 3 months to maintain an equilibrium moisture content of approximately 12%. The weight (m), length (L), width (b), thickness (h), and moisture content (MC) of each piece of lumber were measured and the global density ( ρ ) was calculated as ρ = m / ( L b h ) . The FFV test method was then employed to calculate the lumber’s dynamic MOE (MOEDynamic) by assuming a linear relationship between the natural frequency of the lumber and its density. More specifically, the dynamic response to the external excitation of the lumber was collected and the natural frequency was obtained through the Fast Fourier Vibration analyzer of FAKKOP, thus determining the lumber’s MOEDynamic [21]. During the FFV tests, a hammer was used to strike one end of the lumber (Figure 1), as per the manual of FAKKOP, while the resonance frequency (fm) was obtained from a voice frequency collector microphone, of the M9 type, from the Salar company (Figure 2). In order to avoid random error, frequency tests were repeated at least 3 times for each piece of lumber until a constant frequency was reached. The lumber frequency (fm) was recorded as the mean of the three repetitions. The lumber density and frequency (fm) were combined to calculate MOEDynamic:
MOEDynamic = ρ (2Lfm)2
where MOEDynamic is the lumber dynamic MOE determined from the FFT method (Pa); L is the sample length (m); fm is the initial longitudinal resonance frequency (Hz) of the sample; and ρ is the average density of the sample (kg/m3).
The mean and standard deviation (SD) of the density and MOEDynamic values for natural and planted larch lumber were determined in R language (Version 3.6.3, R Core Team). Based on the Three Sigma Rule [22], if the absolute difference between the test value and mean value of all data was greater than 3 times the standard deviation ( | x i x ¯ | > 3 σ ), the test value was rejected to minimize errors.

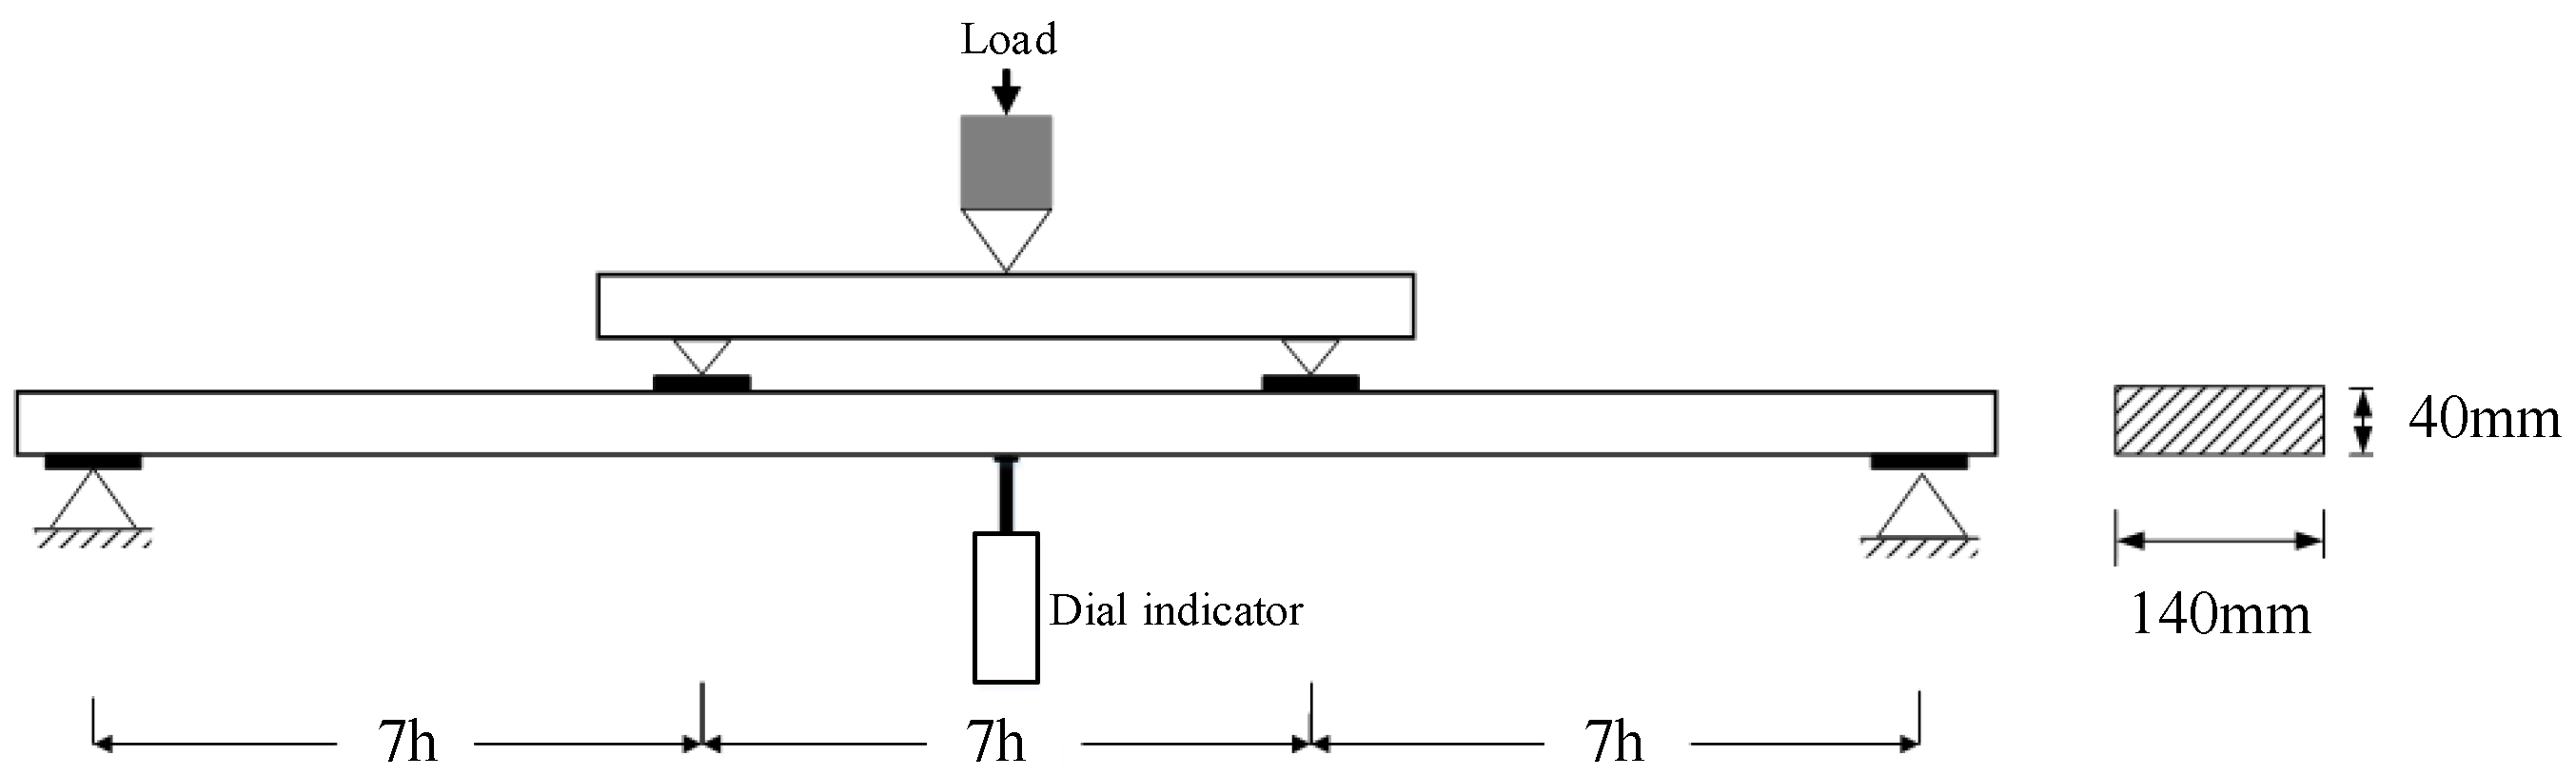
2.3. Testing the Lumber Static Bending MOE

In order to verify the accuracy of the MOEDynamic determined via the FFV test method, 80 pieces of dimension lumber were randomly selected from the natural larch dimension lumber and their static bending elastic modulus (MOEstatic) was tested using the universal test machine. Linear regression analysis with the dynamic MOE data (MOEDynamic) was then performed using the MOEstatic values.
The static bending MOE (MOEstatic) of the dimension lumber was tested based on the ASTM D198-15 Standard Test Method of Static Tests of Lumber in Structure Sizes [23] and the Chinese standard GB/T 28993-2012 Standard test methods for mechanical properties of structural lumber [24]. More specifically, we employed the third point flatwise bending test method (Figure 3) with a span-to-thickness ratio of 21 and loading distance at the center of 280 mm for the MOEstatic tests. The load and deflection were determined by a load cell and electronic indicator, respectively, and measurement values were collected with a data logger at a 1 Hz sampling rate. In order to ensure accuracy, each lumber was tested three times on load data ranging between 1.8 kN and 3.3 kN, as these values were below 40% of the estimated failure load. The average MOE value of the last two measurements was used as the static MOE for the lumber sample due to the slight difference in values between the first and last two tests.

2.4. Estimate the Distribution Parameter of Density and MOE

Normal, lognormal, and Weibull distributions are typically adopted to fit the physical and mechanical properties of lumber [25]. The selected distribution model can influence the predicted and evaluated values of the larch, and also has an influence on the characteristic values. In particular, the characteristic value determined via the parameter method is observed to be more accurate if the corresponding density and MOE are known in advance. In the current study the density and MOE of the two larch types were fitted using the three distributions, and the goodness of the fits were compared using the K-S test method [26].

2.4.1. Parameter Estimations of the Normal, Lognormal, and Weibull Distributions

The maximum likelihood method was employed to estimate the normal distribution parameters, namely, the sample mean, μ, and variance, σ2. The lognormal distribution parameters were similarly determined by calculating the logarithm of the individual measured data.
The 2- and 3-parameter Weibull distributions were also determined, and the goodness of fit was evaluated. Table 1 reports the basic expressions for the 3-parameter Weibull distribution.
We calculated the 2-parameter Weibull distribution parameters (e.g., shape parameter k and scale parameter λ). The data were sorted in ascending order and plotted as a cumulative density function (CDF). The CDF of the 2-parameter Weibull distribution was calculated via Equations (2) and (3).
i ( n + 1 ) = 1 e ( ρ i λ ) k
where i is the data point number in ascending order; and n is the number of samples.
The logarithm of both the sides of Equation (3) was then taken:
l g ( l g n + 1 n + 1 i ) = k l g ρ i + l g ( l g e λ k )
Equation (4) can be interpreted as a linear equation with slope k and intercept l g ( l g e / λ ^ k ) . Taking the larch density data as an example, parameter k and scale parameter λ were calculated as 9.03615 and 0.69555, respectively.
In order to estimate the 3-parameter Weibull distribution parameters, location parameter x u was subtracted from each data point. The other parameters were determined as with the 2-parameter Weibull distribution.

2.4.2. K-S Test

The K-S test was adopted to compare the goodness of fit between the different distribution models. The Kolmogorov–Smirnov (K-S) test is one of the most common methods used to investigate the distribution of random variables and employs all the sample information. In brief, this method initially evaluates the parameters of the possible distribution model and subsequently calculates the maximum difference value (Dn) between the assumed distribution function and the order statistics. According to the significance level (α) and sample number (n), the corresponding critical value is taken from a K-S critical value table to determine whether the assumed distribution is reasonable [27]. If Dn < D n , α , the sample data are fitted with the assumed distribution function.

3. Results and Discussion

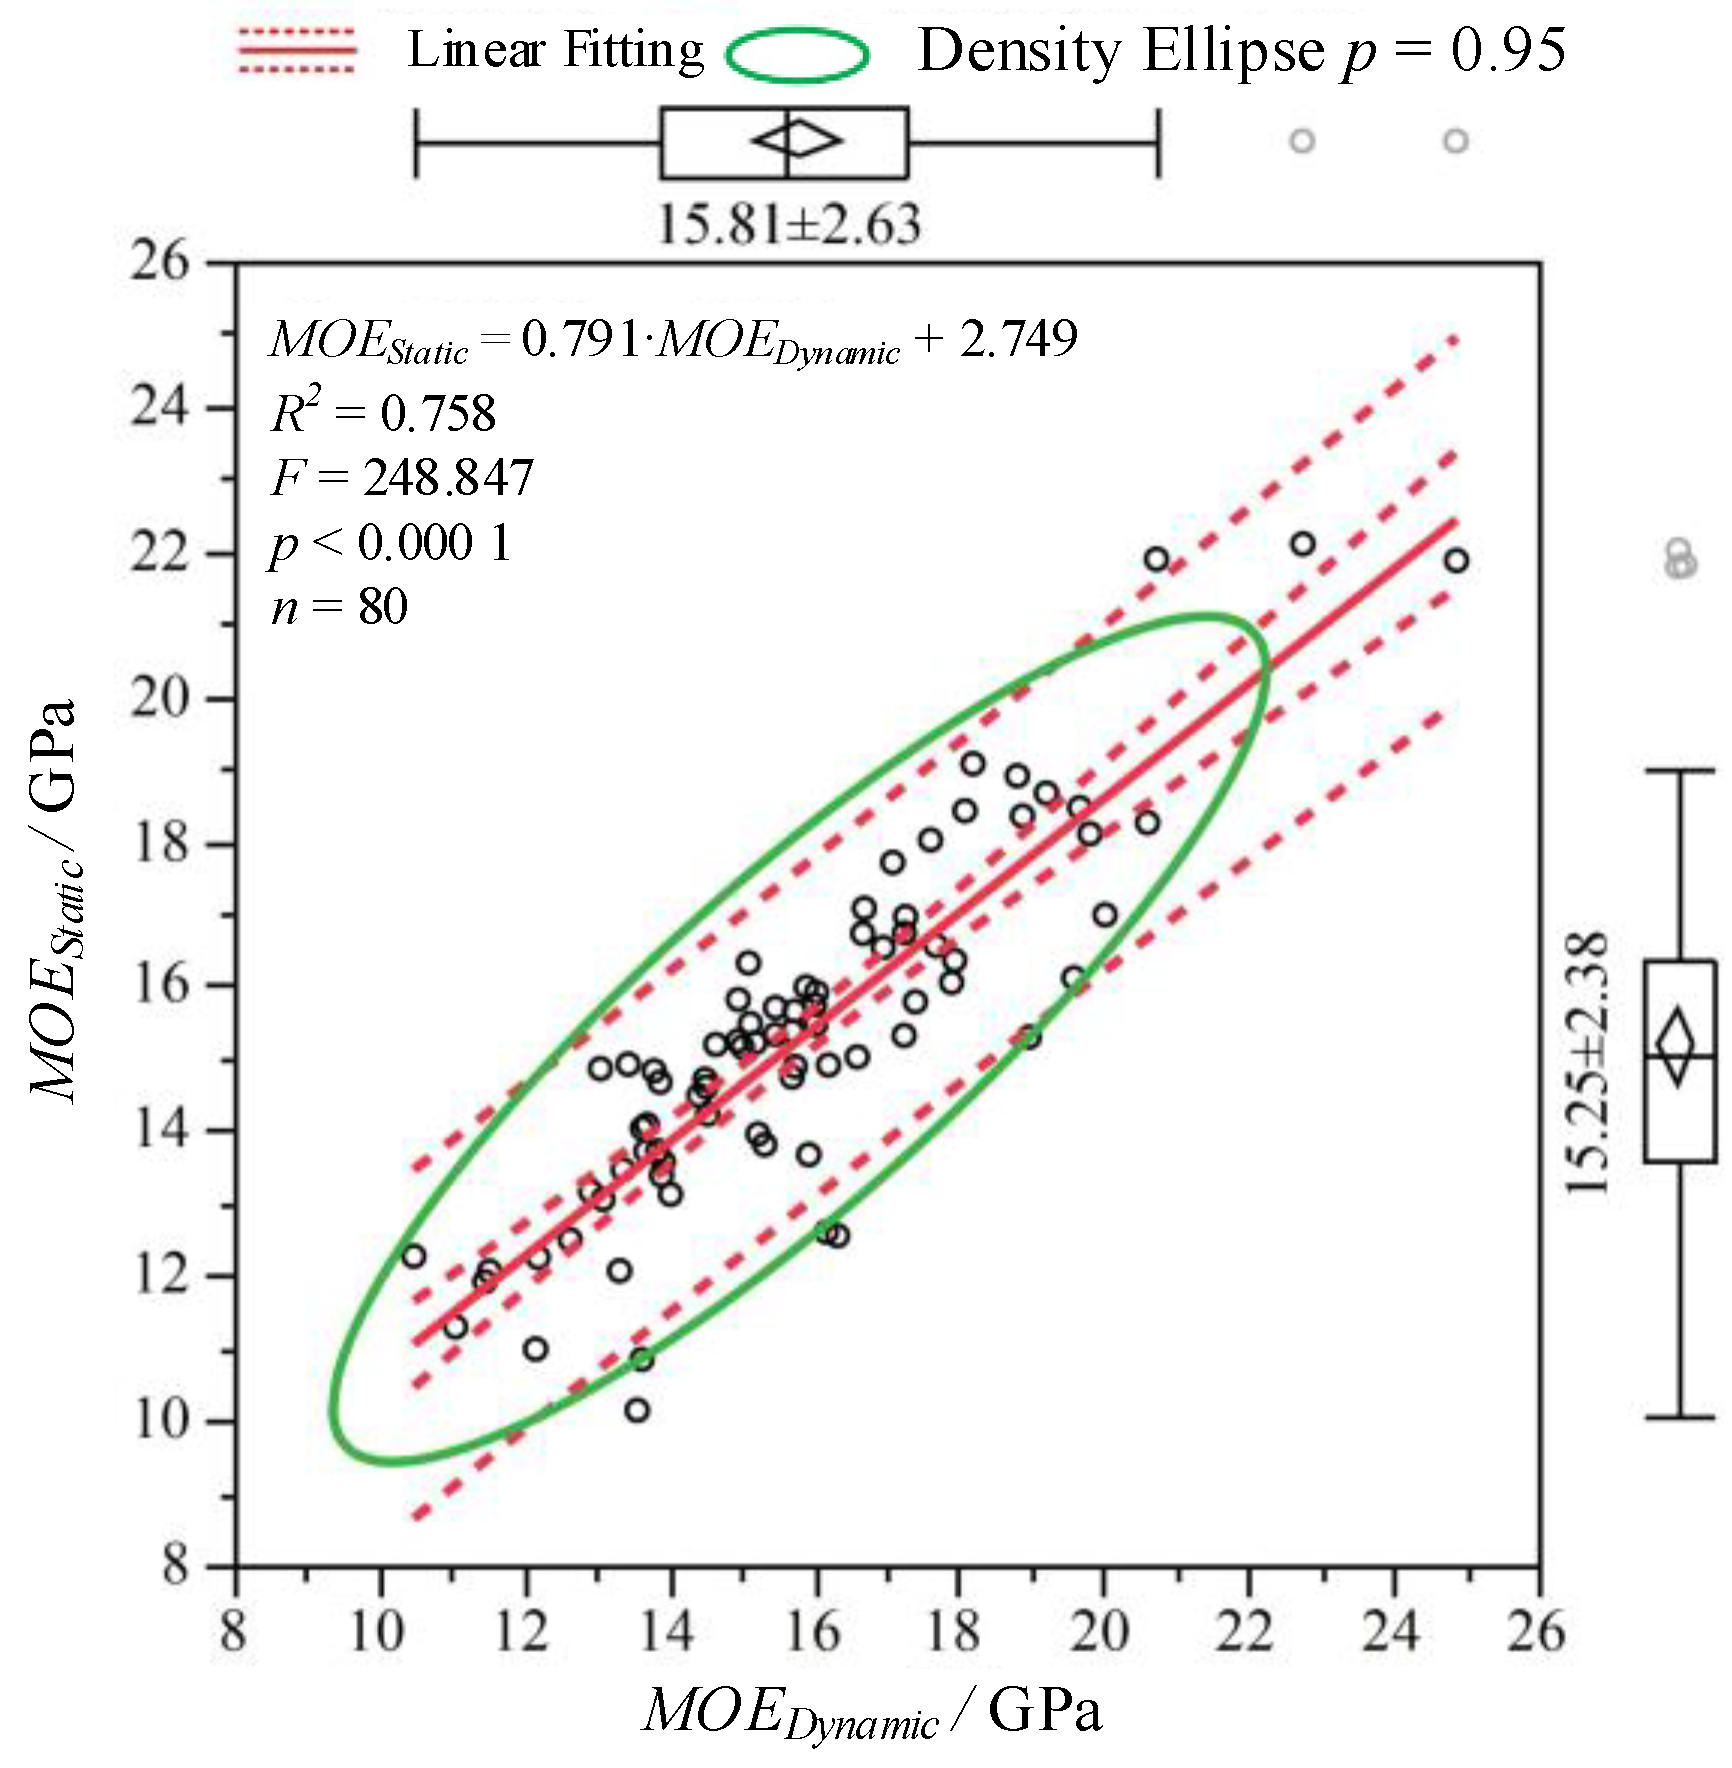
3.1. Relationship between Dynamic and Static MOE

The relationship between the dynamic and static MOE is shown in Figure 4 and Equation (4); it depicts the derived linear relationships and fitting results, and Equation (4) describes how the MOEStatic can be predicted based on the MOEDynamic.
MOEStatic = 0.791 × MOEDynamic + 2.749 (R2 = 0.758)
From Figure 4, it was also found that the mean MOEDynamic was very close to that of MOEStatic, with values of 15.81 GPa and 15.25 GPa, respectively, and a 3.7% difference between them. There was a strong linear correlation between the MOEDynamic and MOEStatic values (R2 = 0.758), indicating the ability of the FFV-determined MOEDynamic values to evaluate the lumber mechanical properties, potentially replacing the static method. As the FFV test was easy and fast, while the full-size static MOE test method was time consuming and based on a complex mechanical test machine, the FFV method would reduce operation complexity and costs compared with the static MOE test processing, and is thus more suitable for large-scale factory production.

3.2. Differences in the Density and MOEDynamic between Natural and Planted Larch

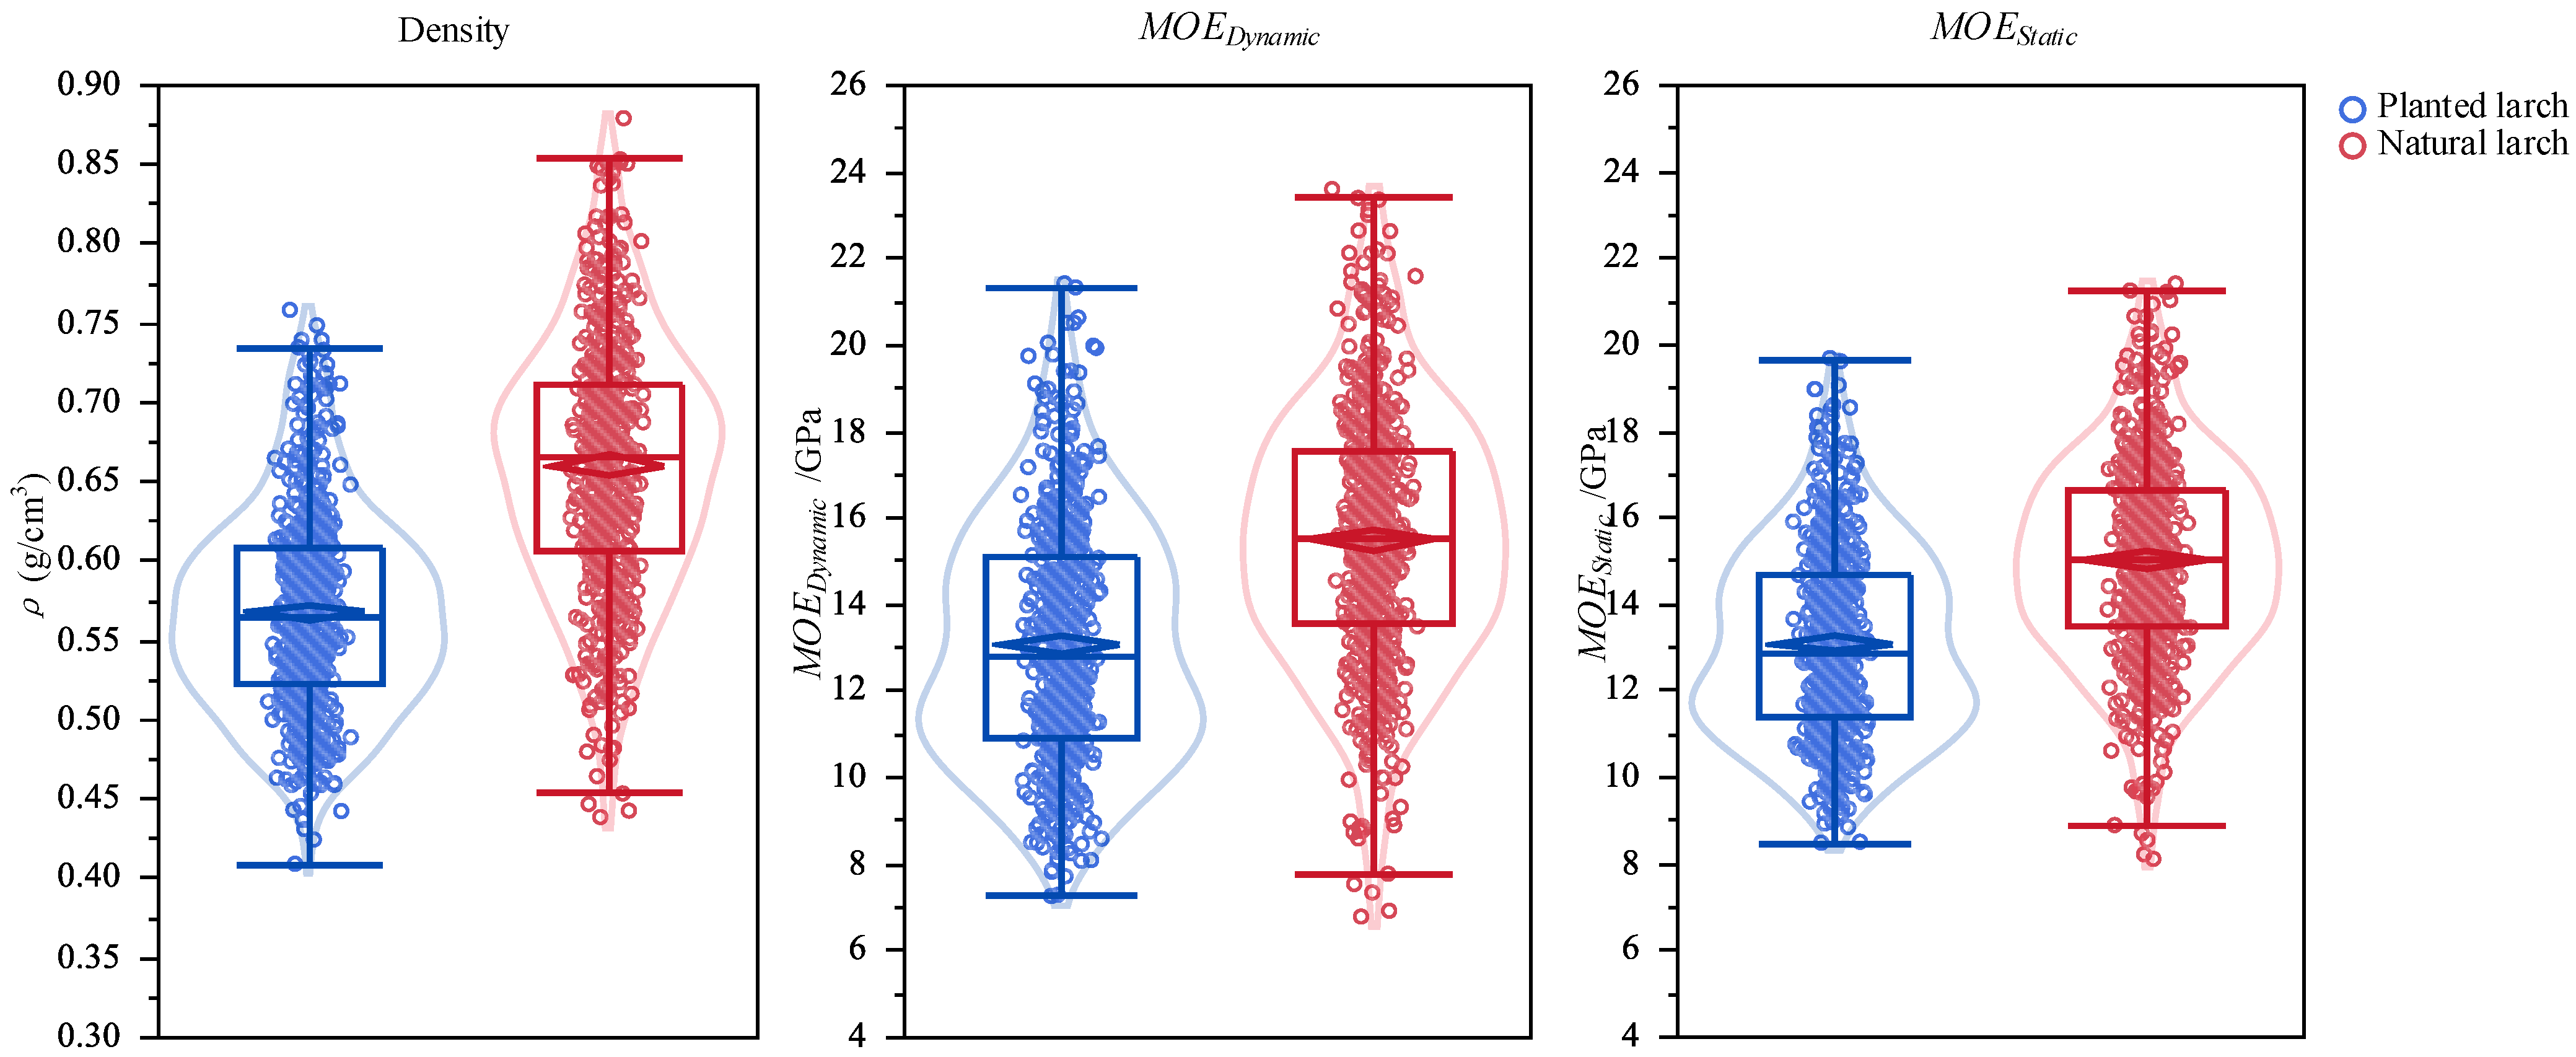
3.2.1. Statistical Results of the Density and MOEDynamic Tests

By using the Three Sigma Rule, one natural larch sample and four planted larch specimens were rejected; the results are shown in Table 2 and Figure 5. The violin plots in Figure 5 contain the distribution information on the density and MOEDynamic. The box plots inside the violin plot present the 5th, 25th, 50th, 75th, and 95th percentile of the data from the bottom to top. The density and MOEDynamic means are also represented as the mean confidence diamond plot inside the box plot.
The natural larch dimension lumber density and MOEDynamic values exceeded those of the planted larch by approximately 15.8% and 14.8%, respectively. The average planted larch lumber density is in strict agreement with that measured from small clear wood samples by Zhou [28], who determined an average density of small clear wood samples from 30-year-old larch logs of 0.566 ± 0.071 g/cm3. However, the average MOE reported by Zhou was 16.775 ± 3.699 GPa, exceeding the MOEDynamic and MOEstatic of the full-size planted larch lumber. This indicates that the larch density determined from small clear wood specimens can reflect the global density of full-size dimension lumber, yet this was not true for negative MOE values. This may be attributed to the fiber grain deviation, knots, inside cracking, and other defects that reduce the lumber MOE yet have no significant impact on density. The planted larch test data reported in Zhou and the current study can act as a mutual verification. The lumber MOE was then tested using the full-size test method to evaluate the lumber mechanical properties. Results demonstrate the strong potential of the FFV method in determining the MOEDynamic of full-size lumber to predict MOEstatic. The mean density and MOEDynamic of 0.57 g/cm3 and 13.10 GPa, respectively (MOEstatic calculated as 0.791 × 13.10 + 2.749 = 13.11 GPa, according to Equation (4)), can represent the mechanical properties of full-size planted larch lumber from Northeast China.

3.2.2. Significance Tests between Natural and Planted Larch

In order to determine any significant difference in density and MOEDynamic between planted larch and natural lumber, we performed parametric (t-test) and non-parametric (Wilcoxon test) tests to compare the mean value differences of the two variables. The t-test was generally used on sample data that passed the normality (Shapiro–Wilk) and homogeneity (F-test) tests, implying significant differences in the density and/or MOE between the planted and natural larch dimension lumber. Non-parametric testing was applied to data that did not pass these tests. Table 3 reports the test results.
The results reveal that the data failed the Shapiro–Wilk and F-tests, and thus the t-test prerequisites for density and MOEDynamic were not met. Therefore, the subsequent analysis was based just on the Wilcoxon test. Significant differences were observed in the density and MOEDynamic between planted and natural larch dimension lumber. In particular, the natural larch’s MOEDynamic values exceeded those of planted larch after combining with the mean value of Figure 5. The faster the growth of the planted larch under favorable silviculture measures, the lower the density, the greater the ratio value of the spring wood, and the wider the width of the growth ring, resulting in lower MOEDynamic values for planted larch. Although the MOEDynamic of the planted larch lumber was smaller than that of natural larch, once converted to MOEstatic, it was still obviously greater than the MOE of SPF (Spruce–Pine–Fir from Canada), which is commonly used in light-frame buildings. For example, the average MOE of SPF with a No. 1 grade was approximately 10 ± 1.82 GPa [25]; thus, the average MOEstatic of the planted larch lumber was 30% greater than that of SPF. Therefore, planted larch can effectively replace natural larch and is more resistant under bending compared to SPF.

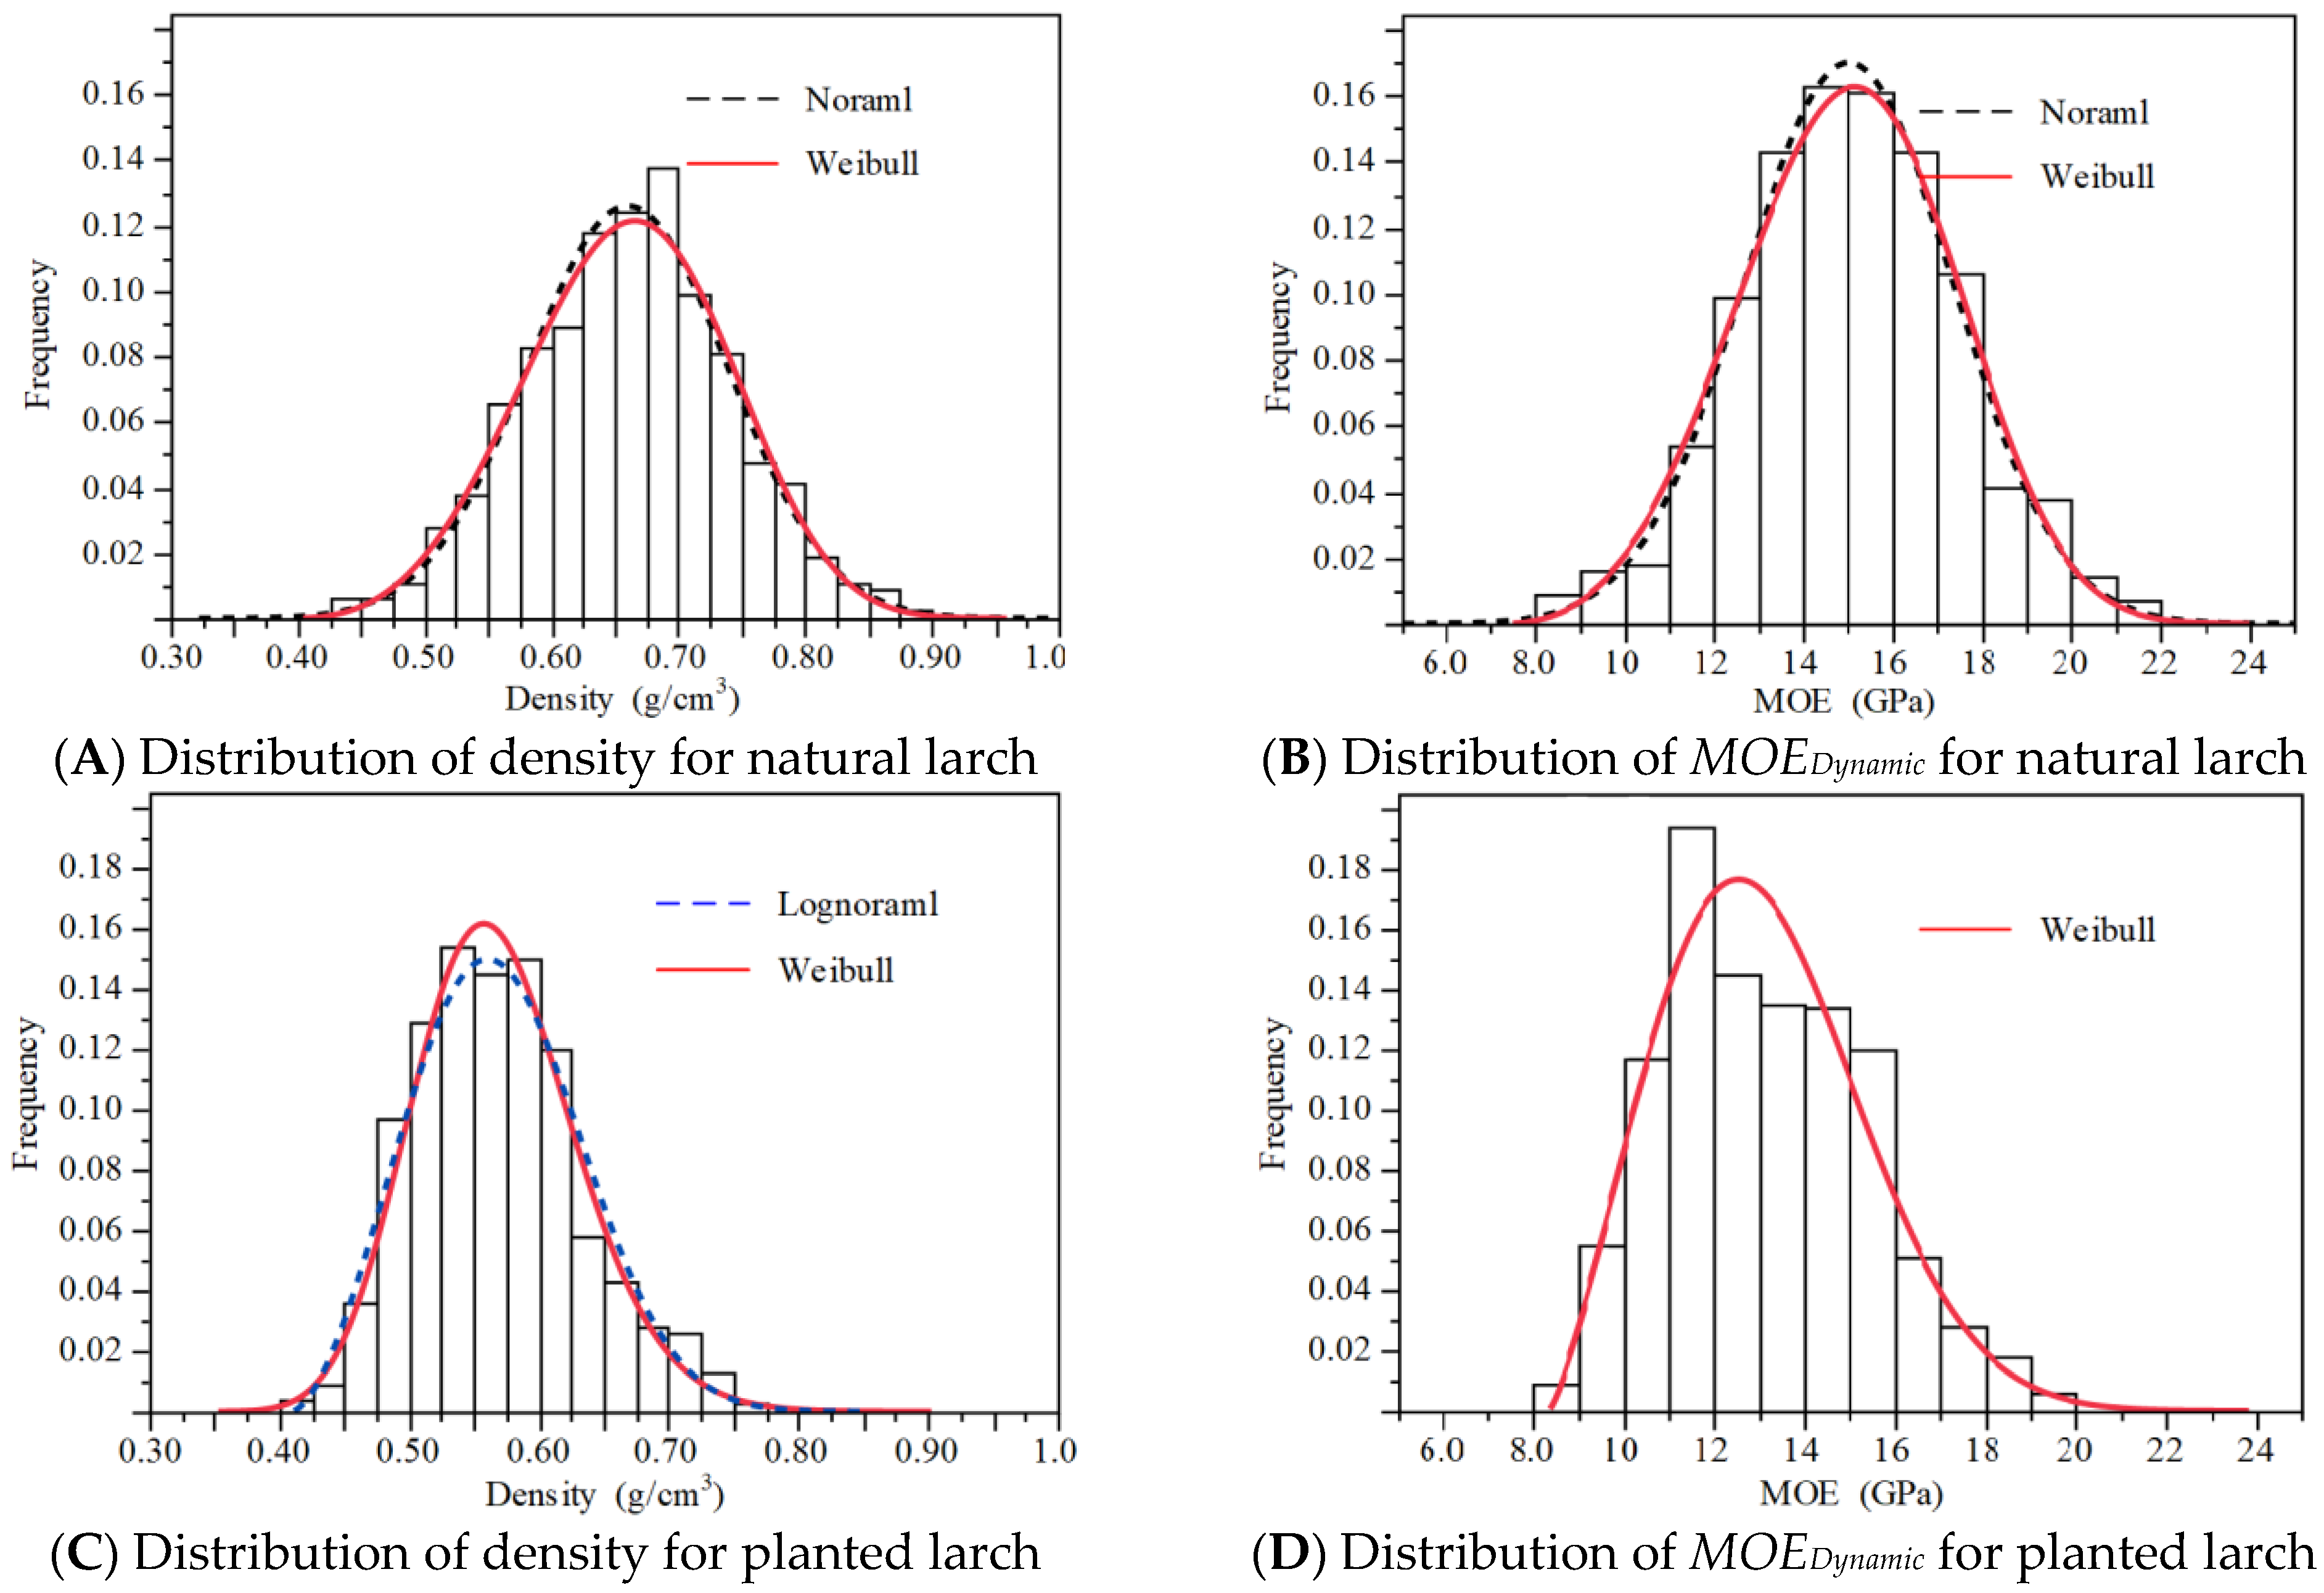
3.3. Distribution Parameter of Density and MOE, and Their K-S Test

The K-S test was adopted to compare the goodness of fit between the different distribution models (Figure 6 and Table 4 and Table 5). Here, for the normal and lognormal distributions, the critical values were calculated as D 599 , 0.05 = 0.886 / 599 = 0.03620 and D 596 , 0.05 = 0.886 / 596 = 0.03629 , while the corresponding Weibull distribution values were determined as D 599 , 0.05 = 0.888 / 599 = 0.03628 and D 596 , 0.05   = 0.886 / 596 = 0.03637 . Only the Dn is smaller than D n , 0.05 , so the Weibull distribution with three parameters is accepted after the K-S test. Figure 6 and Table 4 and Table 5 depict the K-S test results and distribution parameters.
The figures and table results revealed that the natural larch lumber density exhibited a good fit with the normal and 3-parameter Weibull distributions, with the highest goodness of fit observed for the three-parameter Weibull distribution with location parameter x u = 0.39. The MOEDynamic of natural larch lumber fitted well with the normal and 3-parameter Weibull distributions, with the former exhibiting the best goodness of fit (Figure 6A). The planted larch lumber density exhibited a good fit with the lognormal and 3-parameter Weibull distributions, with the former presenting the highest goodness of fit. The MOE of planted larch lumber was observed to fit well with the 3-parameter Weibull distribution at a location parameter equal to 97.6–98.9% of the minimum MOEDynamic, with the goodness of fit optimized at the location parameter 8.34 GPa ( x u = 8.34) (Figure 7D). In order to simplify the distribution model, the 3-parameter Weibull distribution was suggested to fit the density and MOEDynamic of natural and planted larch as it passed the K-S test for the four test data types. Besides, Figure 6 also revealed that the distribution of the measured data of planted larch was left-biased, meaning that there were more samples with a low and medium density and elastic modulus. Thus, the Weibull distribution with three parameters was a better fit of the density and MOE distribution of planted larch full-size lumber.

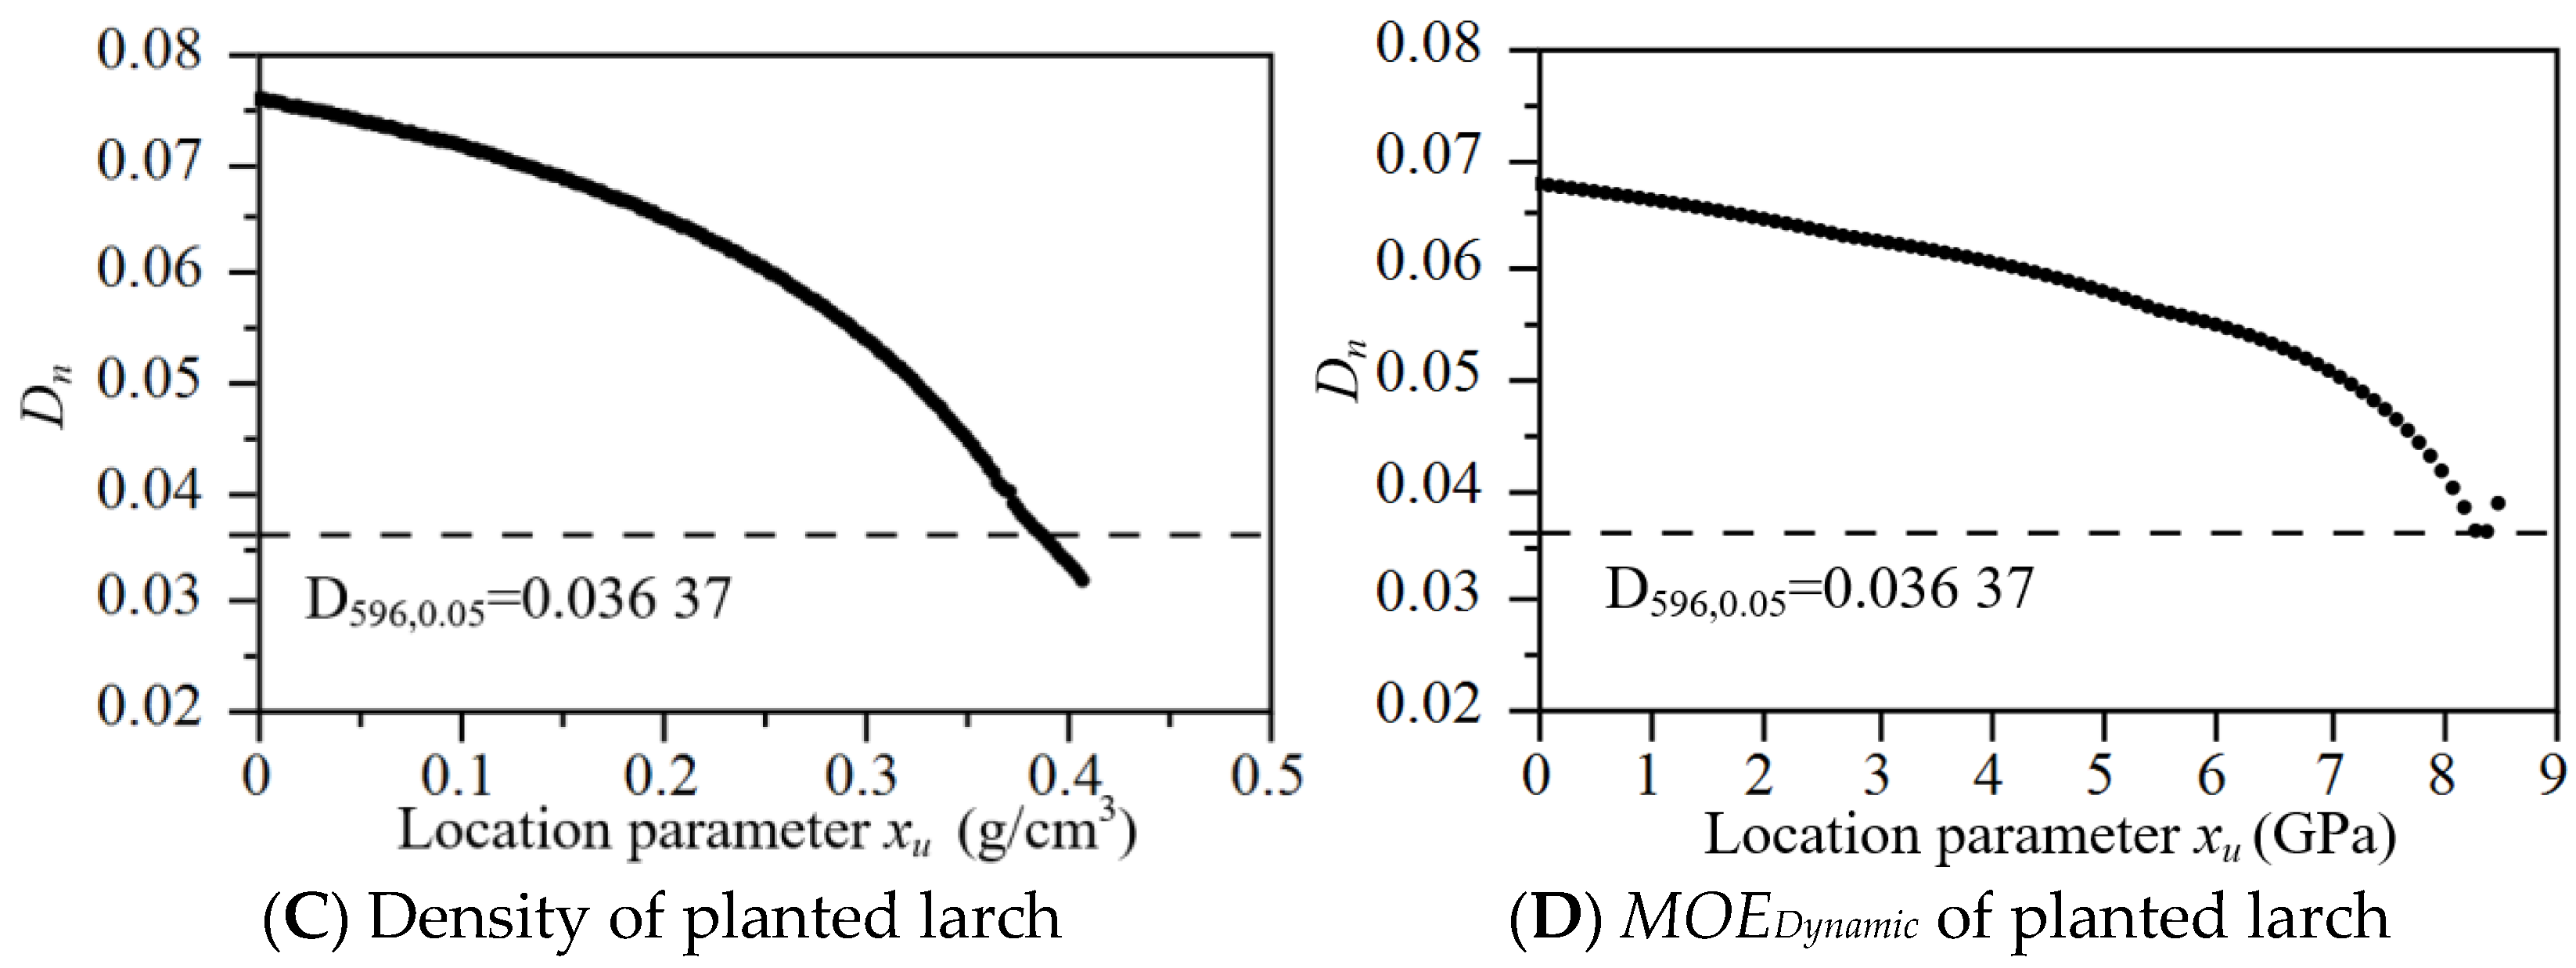
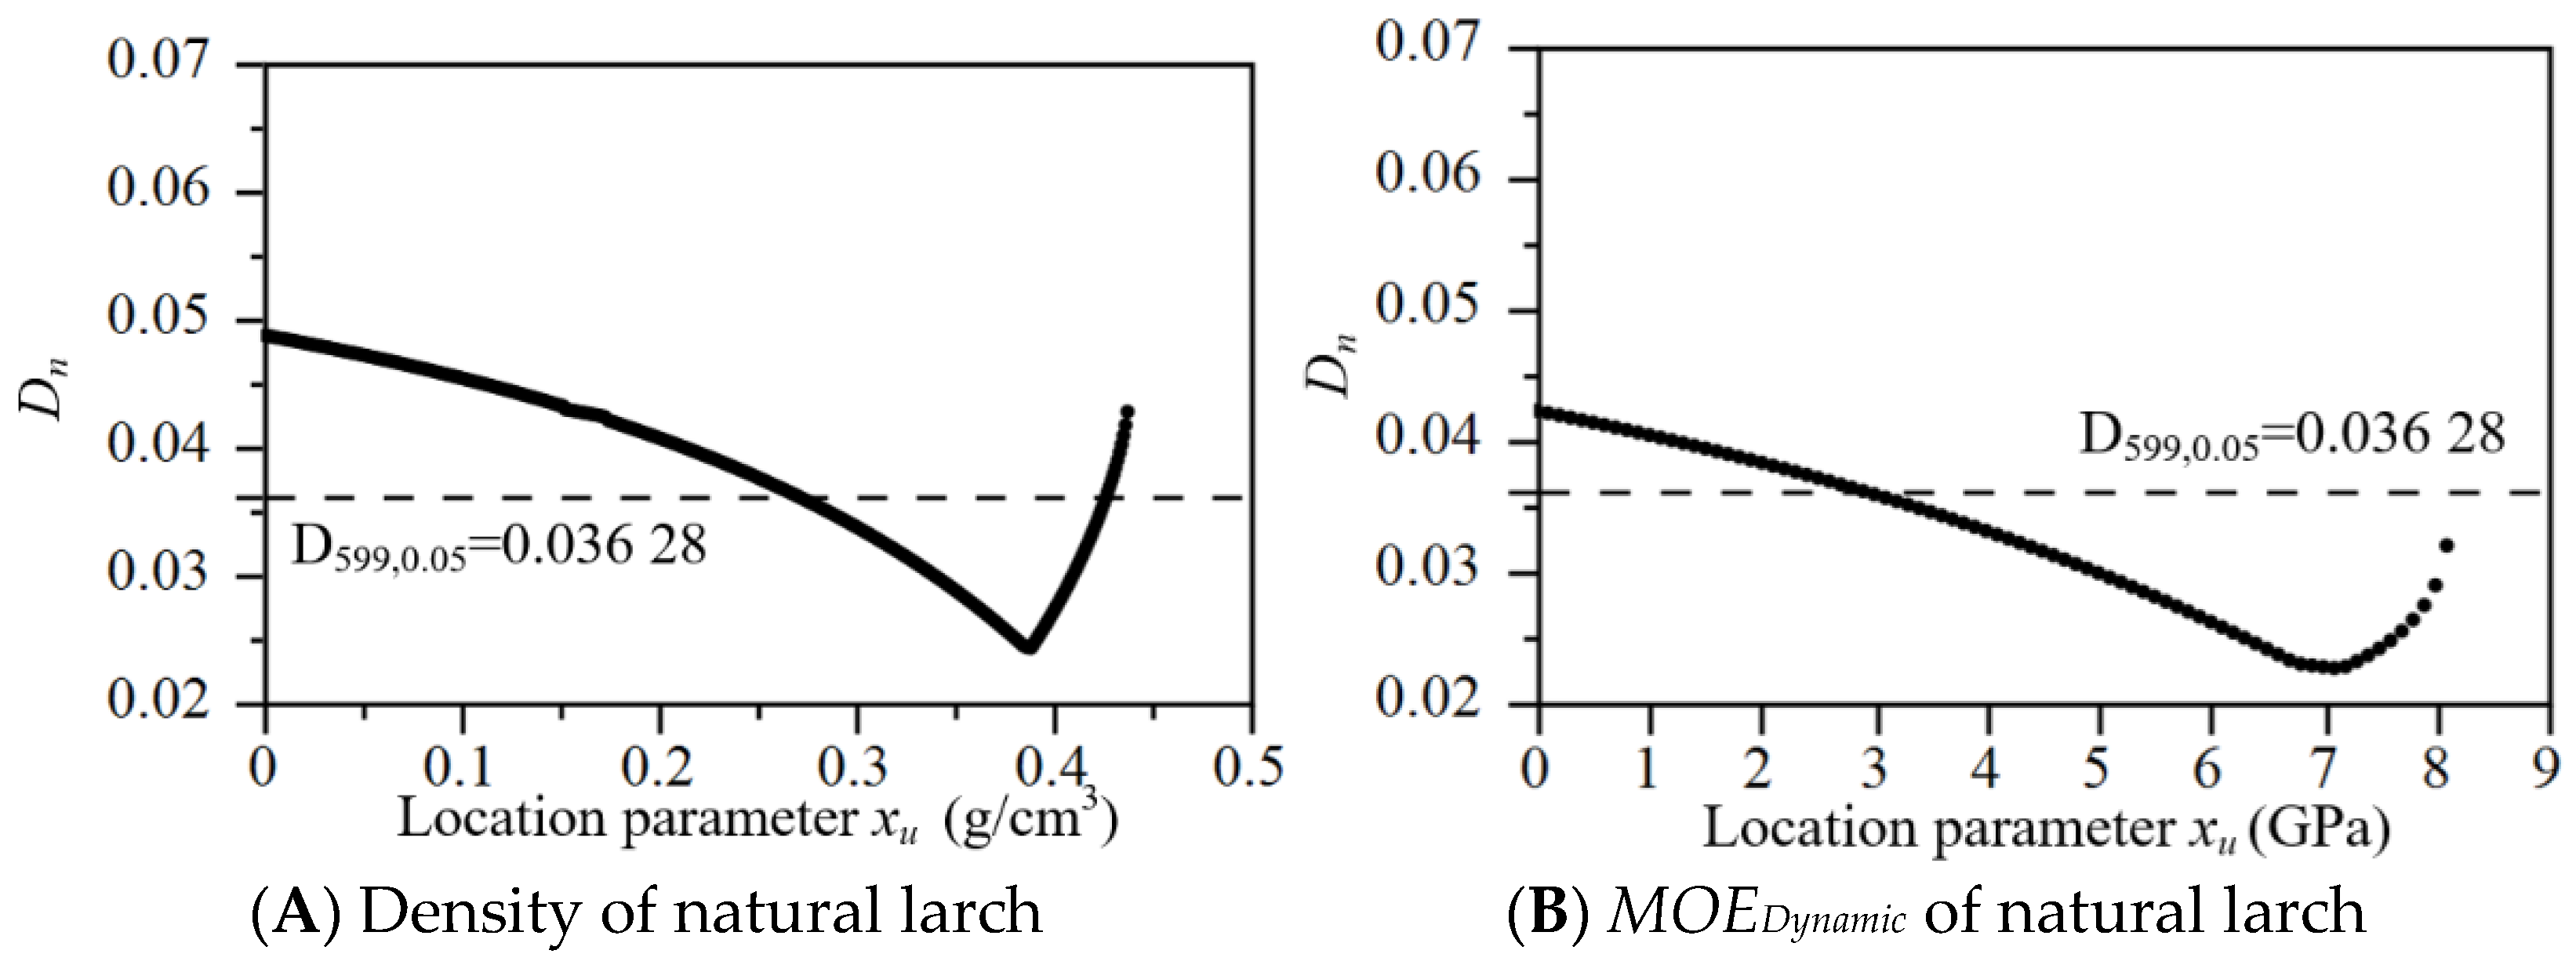
3.4. Determine the Characteristic Based on Distribution of Density and MOE

The characteristic value is the 5th-percentile value at 75% confidence level, also known as the standard value in China according to GB 5005 [2], forms the basis of the design values and is crucial for the safety and reliability of wood constructions. According to ASTM D2915-10 [29] and Zhong Yong [30], both parametric and non-parametric methods can be used to calculate the characteristic value of the lumber density and MOE. The parametric method was used to calculate the characteristic value according to the formula E k , e = x ¯ k   s , where the k value is decided by the number of samples and the confidence level. If the average value x ¯ and standard variation s were known, the characteristic value E k , e could be calculated. In turn, the non-parametric method was based on the order number of the test value to estimate the characteristic value, and the order was based on the sample number and confidence level. Generally, the parametric method is considered as more effective when the data distribution model is known in advance, while the non-parametric method is associated with smaller errors. Table 6 reports the determined characteristic values.
The characteristic values of the density and MOEDynamic for natural and planted larch lumber via the parametric and non-parametric methods where highly similar, with differences of 1.92%, 0.01%, 2.13%, and 2.90%, respectively. The differences between the characteristic values calculated by the parametric method and the 5% quantile under the best distribution were 0, −0.99%, −2.13%, and −4.48%, respectively. The corresponding non-parametric method differences were −1.92%, −0.90%, 0, and −1.63%. This indicates that the characteristics of the density and MOEDynamic for natural and planted larch calculated by the parametric and non-parametric methods were almost equal. The planted larch MOEDynamic calculated by the parametric method was slightly smaller than that of the non-parametric method and the 5% quantile under the best distribution. This may be attributed to the MOEDynamic distribution model (Figure 6D), with the median mean value exceeding the mean value of the data. More specifically, with the exception of the natural larch lumber density, the characteristic values calculated by the parametric method were slightly lower than the non-parametric values. Thus, the parametric method can more effectively estimate the characteristic value for larch and should be the preferred approach to determine the characteristic values of density and MOE for natural and planted larch. The characteristic density values of natural and planted larch were determined as 0.53 g/cm3 and 0.46 g/cm3; the characteristic MOEDynamic values were 11.05 GPa and 9.39 GPa; and the characteristic MOEstatic values in flatwise samples were 11.05 × 0.791 + 2.749 = 11.49 GPa and 9.39 × 0.791 + 2.749 = 10.17 GPa, respectively. By taking into account the horizontal adjustment factor, the characteristic MOEstatic in edgewise values for natural and planted larch were 11.19/1.15 = 9.73 GPa (9730 MPa) and 10.17/1.15 = 8.84 GPa (8840 MPa); and the characteristic values of density were 0.53 g/cm3 (530 kg/m3) and 0.46 g/cm3 (460 kg/m3), respectively.
By comparing the value with the requirement of EN 338:2016, Structural timber. Strength classes [31], the standard MOE value of natural and planted larch was able to meet the requirements of the standard modulus with grades C40 and C35. The standard MOE of both larch groups exceeded the standard modulus of elasticity for visual grade larch with an Ic grade in GB 5005, where the standard MOE should greater than 8.6 GPa [2]. Thus, the number of MOE tests for visual natural and planted larch lumber can potentially be reduced during factory processing. The grading of natural and planted larch should be performed using the FFV method as it is able to increase the characteristic values for high density and MOE lumber via increasing the mean value or decreasing the variation in larch.

4. Conclusions

The results presented in the current paper can serve as a point of reference to promote the application of natural and planted larch for wooden-based buildings. Based on the experimental tests and analysis, we determined the following key conclusions as follows:
  • A relatively strong linear relationship was observed between the dynamic and static MOE of the larch lumber, proving the FFV method as reliable for the testing of the dynamic and static MOE estimations of larch dimension lumber based on the equation MOEstatic = 0.791 × MOEDynamic + 2.749 (R2 = 0.758).
  • According to statistical analysis and non-parametric testing, the density and MOEstatic of the planted larch lumber were significantly lower (p = 0.01) than those of natural larch lumber, and the average density and MOEstatic of planted larch were 13.6% and 12.7% lower those that of natural larch, respectively.
  • The density determined from clear samples could at times be used to evaluate the average density of lumber; however, this was not the case for the MOEstatic. This was because the average density obtained from full size testing was very close to the average density of the small clear samples, yet the average MOEstatic obtained from the full-size tests was significantly lower than that of the small clear specimens.
  • The 3-parameter Weibull distribution model optimally fits the density and MOE of natural and planted larch, as it was the only distribution to pass the K-S test. In particular, the distribution for the measured data was left-biased, and thus there were more samples with a low and medium density and elastic modulus.
  • The parametric method was demonstrated to be more effective in calculating the characteristic values of natural and planted larch compared to the non-parametric method. The standard value of MOEstatic for natural and planted larch were 9.73 GPa and 8.84 GPa, and hence the MOEstatic met lumber grades C35 and C30.

Author Contributions

Conceptualization, Z.T., Z.W. and H.R.; funding acquisition, H.R.; investigation, Z.T.; methodology, Z.T., J.X. and M.L.; resources, Y.G.; supervision, E.S. and H.R.; writing—original draft, Z.T.; writing—review and editing, E.S. All authors have read and agreed to the published version of the manuscript.

Funding

This research was funded by National Natural Science Foundation of China, grant number 31971596 and the Chinese Scholarship Council grant number 20190320022.

Institutional Review Board Statement

Not applicable.

Informed Consent Statement

Not applicable.

Acknowledgments

The authors are grateful for the financial support provided by the National Natural Science Foundation of China (Research on fracture mechanism of cross layer in cross-laminated timbe (CLT) under bending stress. Grant number 31971596) and the Chinese Scholarship Council (No. 20190320022).

Conflicts of Interest

The authors declare that they have no known competing financial interests or personal relationships that could have appeared to influence the work reported in this paper.

References

  1. Pajchrowski, G.; Noskowiak, A.; Lewandowska, A.; Strykowski, W. Wood as a Building Material in the Light of Environmental Assessment of Full Life Cycle of Four Buildings. Constr. Build. Mater. 2014, 52, 428–436. [Google Scholar] [CrossRef]
  2. GB 5005, Code for Design of Timber Structures; Ministry of Housing and Urban Rural Construction of the People’s Republic of China: Beijing, China, 2017.
  3. Jiang, J.; Lu, J.; Ren, H. Study on Characteristic Values for Strength Properties of Chinese Larch Dimension Lumber. J. Build. Mater. 2012, 15, 361–365. [Google Scholar]
  4. Tian, Z.; Wang, Z.; Wang, J.; Zhang, Z.; Ge, P.; Lv, Y.; Ren, H. Classification in Modulus of Elasticity and Mechanical Properties of Larch Lumber in Mohe. J. Northwest For. Univ. 2017, 32, 211–215. [Google Scholar]
  5. Zhong, Y.; Wu, G.; Ren, H. Design Value of Tension of Domestic Dimension Lumber for Structural Use. Sci. Silvae Sin. 2018, 54, 100–112. [Google Scholar]
  6. Zhong, Y.; Ren, H.-Q.; Jiang, Z.-H. Experimental and Statistical Evaluation of the Size Effect on the Bending Strength of Dimension Lumber of Northeast China Larch. Materials 2016, 9, 89. [Google Scholar] [CrossRef] [Green Version]
  7. Zhong, Y.; Ren, H. Reliability Analysis for the Bending Strength of Larch 2x4 Lumber. Bioresources 2014, 9, 6914–6923. [Google Scholar] [CrossRef] [Green Version]
  8. Lou, W.; Wang, Z.; Luo, X.; Guo, W.; Ren, H. Full Size Bending Mechanical Properties of Dahurian Larch Dimension Lumber. J. Anhui Agric. Univ. 2011, 2, 009. [Google Scholar]
  9. Wang, Z.; Ren, H.; Luo, X.; Zhou, H. Mechanical Stress Grading of Larch Dimension Lumber from Northeastern China. China Wood Ind. 2009, 3, 002. [Google Scholar]
  10. Porteous, J.; Kermani, A. Structural Timber Design to Eurocode 5; John Wiley & Sons: Hoboken, NJ, USA, 2013. [Google Scholar]
  11. Lin, Y.; Wang, Y.; Jiang, S. GB 50005-2003 Code for Design of Timber Structures; China Architecture & Building Press: Beijing, China, 2003. [Google Scholar]
  12. Rosowsky, D.; Ellingwood, B. Limit-State Interactions in Reliability-Based Design for Wood Structures. J. Struct. Eng. 1992, 118, 813–827. [Google Scholar] [CrossRef]
  13. Ross, R.J.; Brashaw, B.K.; Pellerin, R.F. Nondestructive Evaluation of Wood. For. Prod. J. 1998, 48, 14. [Google Scholar]
  14. Sales, A.; Candian, M.; de Salles Cardin, V. Evaluation of the Mechanical Properties of Brazilian Lumber (Goupia Glabra) by Nondestructive Techniques. Constr. Build. Mater. 2011, 25, 1450–1454. [Google Scholar] [CrossRef]
  15. Wang, Z.; Li, L.; Gong, M. Measurement of Dynamic Modulus of Elasticity and Damping Ratio of Wood-Based Composites Using the Cantilever Beam Vibration Technique. Constr. Build. Mater. 2012, 28, 831–834. [Google Scholar] [CrossRef]
  16. Olsson, A.; Oscarsson, J.; Serrano, E.; Källsner, B.; Johansson, M.; Enquist, B. Prediction of Timber Bending Strength and In-Member Cross-Sectional Stiffness Variation on the Basis of Local Wood Fibre Orientation. Eur. J. Wood Wood Prod. 2013, 71, 319–333. [Google Scholar] [CrossRef] [Green Version]
  17. Olsson, A.; Oscarsson, J. Strength Grading on the Basis of High Resolution Laser Scanning and Dynamic Excitation: A Full Scale Investigation of Performance. Eur. J. Wood Wood Prod. 2017, 75, 17–31. [Google Scholar] [CrossRef] [Green Version]
  18. Brunetti, M.; Burato, P.; Cremonini, C.; Negro, F.; Nocetti, M.; Zanuttini, R. Visual and Machine Grading of Larch (Larix Decidua Mill.) Structural Timber from the Italian Alps. Mater. Struct. 2015, 49, 2681–2688. [Google Scholar] [CrossRef]
  19. Zhang, X.; Yin, Y.; Jiang, X. Evaluation of Bending Properties of Chinese Fir Plantation by Two Nondestructive Testing Methods. J. Build. Mater. 2010, 13, 836–840. [Google Scholar]
  20. Jiang, J.; Lv, J.; Ren, H.; Luo, X.; Long, C.; Guo, W. Evaluation of Modulus of Elasticity for Dimension Lumber by Three Nondestructive Techniques. J. Zhejiang AF Univ. 2008, 25, 277–281. [Google Scholar]
  21. Arriaga, F.; Monton, J.; Segues, E.; Íñiguez-Gonzalez, G. Determination of the Mechanical Properties of Radiata Pine Timber by Means of Longitudinal and Transverse Vibration Methods. Holzforschung 2014, 68, 299–305. [Google Scholar] [CrossRef]
  22. Pukelsheim, F. The Three Sigma Rule. Am. Stat. 1994, 48, 88–91. [Google Scholar]
  23. ASTM. Standard Test Method of Static Tests of Lumber in Structure Sizes; ASTM International: West Conshohocken, PA, USA, 2015. [Google Scholar]
  24. Lv, J.; Jiang, J.; Ren, H.; Luo, X. GB/T 28993-2012 Standard Test Methods for Mechanical Properties of Structural Lumber; Standardization Administration of the People’s Republic of China: Beijing, China, 2012. [Google Scholar]
  25. Wang, Z.; Wang, Z.; Wang, B.J.; Wang, Y.; Liu, B.; Rao, X.; Wei, P.; Yang, Y. Dynamic Testing and Evaluation of Modulus of Elasticity (MOE) of SPF Dimensional Lumber. BioResources 2014, 9, 3869–3882. [Google Scholar] [CrossRef] [Green Version]
  26. Pellicane, P. Goodness-of-Fit Analysis for Lumber Data. Wood Sci. Technol. 1985, 19, 117–129. [Google Scholar] [CrossRef]
  27. Wu, S.; Ye, J. Critical Value Analysis of K-S Method Test with Unknown Parameters. Port Eng. Technol. 1990, 1, 6–20. [Google Scholar]
  28. Zhou, X.; Zhang, J.; Zhou, H.; Sun, X.; Ren, H.; Zhao, R. Tree Age’s Effects on Physical and Mechanical Properties of Larix Kaempferi Wood. China For. Sci. Technol. 2014, 28, 54. [Google Scholar]
  29. ASTM. Standard Practice for Sampling and Data-Analysis for Structural Wood and Wood-Based Products; ASTM International: West Conshohocken, PA, USA, 2017. [Google Scholar]
  30. Zhong, Y.; Wu, G.; Ren, H.; Sun, Z.; Jiang, Z. Determination of Characteristic Strength for Structural Wood Materials by Nonparametric Method. J. Build. Struct. 2018, 42, 142–150. [Google Scholar]
  31. BS EN 338:2016. Structural Timber–Strength Classes, European Committee for Standardization; BSI standard Publucation: London, UK, 2016. [Google Scholar]
Figure 1. Principle for the determination of the elasticity modulus via FFV (EFFV).
Forests 12 00883 g001
Figure 2. Test set-up (a) and screenshot of the software to determine the resonance frequency (fm) (b).
Forests 12 00883 g002
Figure 3. Schematic of the static MOE tests.
Forests 12 00883 g003
Figure 4. Relationship between the dynamic MOE values and static MOE values.
Forests 12 00883 g004
Figure 5. Density and MOE test results of the natural and planted larch dimension lumber. Note: The horizontal line in the boxplots are the 5th, 25th, 50th, 75th, and 95th percentile; inside the boxplot is the confidence diamond plot of the mean value, and outside the boxplot is the violin plot.
Forests 12 00883 g005
Figure 6. Dn values of the Weibull distribution compared with the K-S critical value. Note: Dn is the maximum difference value between the assumed distribution function and the order statistics, and D n , 0.05 is the critical value for the K-S test. Only the Dn is smaller than D n , 0.05 , so the Weibull distribution with three parameters was accepted after the K-S test.
Forests 12 00883 g006aForests 12 00883 g006b
Figure 7. Distribution histograms and fitting curves of larch lumber MOE.
Forests 12 00883 g007
Table 1. Weibull distribution functions and parameters.
Probability Density Function (PDF)Cumulative Distribution Function (CDF)MeanVariance
f ( x ) = k λ ( x x u λ ) k 1 e [ x x u λ ] k F ( x ) = 1 e [ x x u λ ] k λ Γ ( 1 + 1 k ) λ 2 [ Γ ( 1 + 2 k ) ( Γ ( 1 + 1 k ) ) 2 ]
Note: xu = 0 represents the 2-parameter distribution.
Table 2. Density and MOE statistics of the two-dimensional larch lumber types.
GroupNDensityMOEDynamicMOEstatic
Mean (g/cm3)SD (g/cm3)CVMean (GPa)SD (GPa)CVMean (GPa)SD (GPa)CV
Natural larch5990.660.0812.00%15.522.9719.12%15.022.3515.62%
Planted larch5960.570.0611.12%13.102.7821.20%13.112.2016.75%
Note: N is the number of samples, SD denotes the standard deviation, and CV is the coefficient of variation.
Table 3. t-Test and Wilcoxon test results of the density and MOE.
Experimental ConditionsShapiro–Wilk TestF-Testt-TestWilcoxon Test
WProb < WF Ratiop-Valuet RatioProb > |t|ZProb > |Z|
DensityNatural larch0.99760.54811.5745<0.0001 **22.2776<0.0001 **19.0425<0.0001 **
Planted larch0.9853<0.0001 **
MOEDynamicNatural larch0.99770.58631.14200.105114.5581<0.0001 **13.5729<0.0001 **
Planted larch0.9824<0.0001 **
Note: ** denotes significant differences at the 0.01 level.
Table 4. K-S tests of the normal and lognormal distributions based on the estimated parameters.
SamplesPossible Distribution ParametersValue of DnCritical Value ( D n , 0.05 ) Reject or Accept
TypeMeanVariance
ρ of natural larch n = 599Normal0.660 480.006 280.031 160.036 20Accept
Lognormal−0.422 150.014 990.054 24Reject
E of natural larch n = 599Normal15.023 275.507 480.016 940.036 20Accept
Lognormal2.696 950.026 020.036 55Reject
ρ of planted larch n = 596Normal0.568 210.003 990.039 200.036 29Reject
Lognormal−0.571 060.012 130.021 63Accept
E of planted larch n = 596Normal13.109 234.822 480.064 630.036 29Reject
Lognormal2.559 430.027 810.044 54Reject
Notation: ρ is density, E is the dynamic MOE determined via FFV, Dn is the maximum difference value between the assumed distribution function and the order statistics, and D n , 0.05 is the critical value for the K-S test.
Table 5. K-S tests of the Weibull distribution with two and three parameters.
SamplesPossible Weibull Distribution ParametersValue of D n Critical Value ( D n , 0.05 ) Reject or Accept
Location x u Shape
k
Scale
λ
MeanVariance
ρ of natural larch n = 59909.036 150.695 550.660.007 600.048 700.036 28Reject
0.393.796 890.299 160.660.006 320.024 44Accept
E of natural larch n = 59906.948 9416.024 6714.986.425 590.042 220.036 28Reject
7.103.724 028.766 3915.015.608 990.022 60Accept
ρ of planted larch n = 59609.042 210.597 050.570.005 600.075 710.036 37Reject
0.412.707 170.179 900.570.004 060.031 80Accept
ρ of planted larch n = 59606.252 0614.052 7713.075.942 080.067 660.036 37Reject
8.342.310 855.384 0913.114.796 820.035 16Accept
Notation: ρ is density, and E is the dynamic MOE determined via FFV. Only the Weibull distribution with two parameters, with a location of 0, and the Weibull distribution with three parameters with the smallest D n value is shown in Table 5.
Table 6. Characteristic values of density and MOE for the larch dimension lumber.
SampleStatistical Value5% Quantile under the
Best Distribution
Characteristic Value
MeanSDNormalLognormalWeibullParametric MethodNon-Parametric Method
ρ of natural larch (g/cm3)0.660.0790.53--0.530.52
E of natural larch (GPa)15.022.34711.16--11.0511.06
ρ of planted larch (g/cm3)0.570.063-0.47-0.460.47
E of planted larch (GPa)13.112.196--9.839.399.67
Notation: ρ is density, E is the dynamic MOE determined via FFV, SD denotes the standard deviation, and CV is the coefficient of variation.
Publisher’s Note: MDPI stays neutral with regard to jurisdictional claims in published maps and institutional affiliations.

