Article

Evaluation of the Equity and Regional Management of Some Urban Green Space Ecosystem Services: A Case Study of Main Urban Area of Xi’an City

1
School of Geography and Tourism, Shaanxi Normal University, Xi’an 710119, China
2
College of Geomatics, Xi’an University of Science and Technology, Xi’an 710054, China
*
Author to whom correspondence should be addressed.
Forests 2021, 12(7), 813; https://doi.org/10.3390/f12070813
Submission received: 4 May 2021 / Revised: 17 June 2021 / Accepted: 17 June 2021 / Published: 22 June 2021
(This article belongs to the Section Forest Ecology and Management)

Abstract

:
Urban green spaces can provide many types of ecosystem services for residents. An imbalance in the pattern of green spaces leads to an inequality of the benefits of such spaces. Given the current situation of environmental problems and the basic geographical conditions of Xi’an City, this study evaluated and mapped four kinds of ecosystem services from the perspective of equity: biodiversity, carbon sequestration, air purification, and climate regulation. Regionalization with dynamically constrained agglomerative clustering and partitioning (REDCAP) was used to obtain the partition groups of ecosystem services. The results indicate that first, the complexity of the urban green space community is low, and the level of biodiversity needs to be improved. The dry deposition flux of particulate matter (PM2.5) decreases from north to south, and green spaces enhance the adsorption of PM2.5. Carbon sequestration in the south and east is higher than that in the north and west, respectively. The average surface temperature in green spaces is lower than that in other urban areas. Second, urban green space resources in the study area are unevenly distributed. Therefore, ecosystem services in different areas are inequitable. Finally, based on the regionalization of integrated ecosystem services, an ecosystem services cluster was developed. This included 913 grid spaces, 12 partitions, and 5 clusters, which can provide a reference for distinct levels of ecosystem services management. This can assist urban managers who can use these indicators of ecosystem service levels for planning and guiding the overall development pattern of green spaces. The benefits would be a maximization of the ecological functions of green spaces, an improvement of the sustainable development of the city, and an improvement of people’s well-being.

1. Introduction

Ecosystem services were first proposed by Holdren and Ehrlic in the 1970s [1] and are defined as the benefits that human society can obtain from the ecosystem [2,3,4]. Urban green spaces are key public resources that provide numerous ecosystem services that promote the physical and mental health of urban citizens, including microclimate regulation [5,6], carbon fixation and oxygen release [7], noise reduction [8], rainstorm interception, air purification [9], and leisure and entertainment services [10]. By optimizing the ecological structure and coupling it with other ecological spaces, urban green spaces help provide places for people to rest, build social ties, and realize economic benefits [11]. However, with the continuous decline of urban resources, the total area of green space continues to decrease and become fragmented [12]. This study highlights the significance of an optimal allocation of ecosystem service patterns.
There are various types of urban green space ecosystem services. Researchers have used different index systems [13,14] and diverse methods [15] to measure numerous services from different perspectives, and constructed evaluation frameworks for urban green space ecosystem services [16,17]. The exploration and analysis of urban ecosystem services and their spatial patterns can balance the coordination between ecosystem services and urban economic and social functions. Moreover, the improvement of urban environments and urban ecological construction is of vital importance. Indeed, some regional studies have identified significant differences in the number of available green spaces enjoyed by urban residents [18,19]. These differences have been directly related to differences in residents’ health [20]. Equity is a social expression that indicates that something is reasonable and fair in terms of rights, distributions, opportunities, and justice [21]. The equity of public resources, such as green spaces, can be defined as everyone having equal rights and access to enjoy green space resources and related services. The implementation of the social equity principle related to urban green spaces often depends, among other criteria, on the number and accessibility of green spaces. The equity of green space resources cannot satisfy the basic principles of sustainable social development [22,23,24]. Urban green spaces differ based on plant species, plant community diversity, plant leaf area index, and other conditions. Therefore, fair allocation based on the ecosystem services provided by urban green space is more efficient and effective than traditional methods for equitably distributing social resources.
The evaluation and optimization of the equity of urban green space can improve the supply of green space ecological products and the level of ecosystem services. However, the fragmentation of green spaces has resulted in difficulties in optimizing urban green space patterns, and the interlacing of administrative boundaries will destroy the integrity of ecological areas. The management of the ecosystem service cluster [25] believes that nature may be regarded as a collection of various ecosystem services, which helps to improve the management strategies for multi-functional landscape research. Moreover, urban green space ecosystem service management has a certain referential significance for urban grid management, which can realize institutionalized, standardized, and precise management. The traditional clustering process does not consider the spatial geometric relationships [26,27]. The exploratory spatial data analysis method is uncertain. Therefore, an objective, quantitative, repeatable, and transparent method is necessary to identify uniform green space areas to meet the scalable statistical stability and to robustly estimate the urban green space ecosystem services. Regionalization with dynamically constrained agglomerative clustering and partitioning (REDCAP) is a new spatial clustering and zoning method proposed by Guo [28]. This algorithm can divide a region into multiple spatially contiguous regions and has been applied to the establishment of climate zoning [29], ecological zoning [30], and variable rate agricultural management areas [31].
It is imperative for those responsible for regulating urban ecological environments efficiently to use green space systems to alleviate the negative impacts of urbanization on ecosystems. To aid in achieving this goal, this study contributes to the existing literature by exploring the spatial pattern of urban green spaces from the perspective of ecosystem services. We selected the main urban area of Xi’an, China as the study area. The main contributions of this study are twofold. First, using remote sensing land-cover maps and field sampling, we determined the existing spatial equity of urban green space resources by identifying and analyzing the existing ecosystem services of urban green space resources based on the current environmental problems. Second, based on the REDCAP algorithm and related studies, we optimized the integrated ecosystem service under the equity threshold of designated urban green space and realized the regional ecosystem service management.

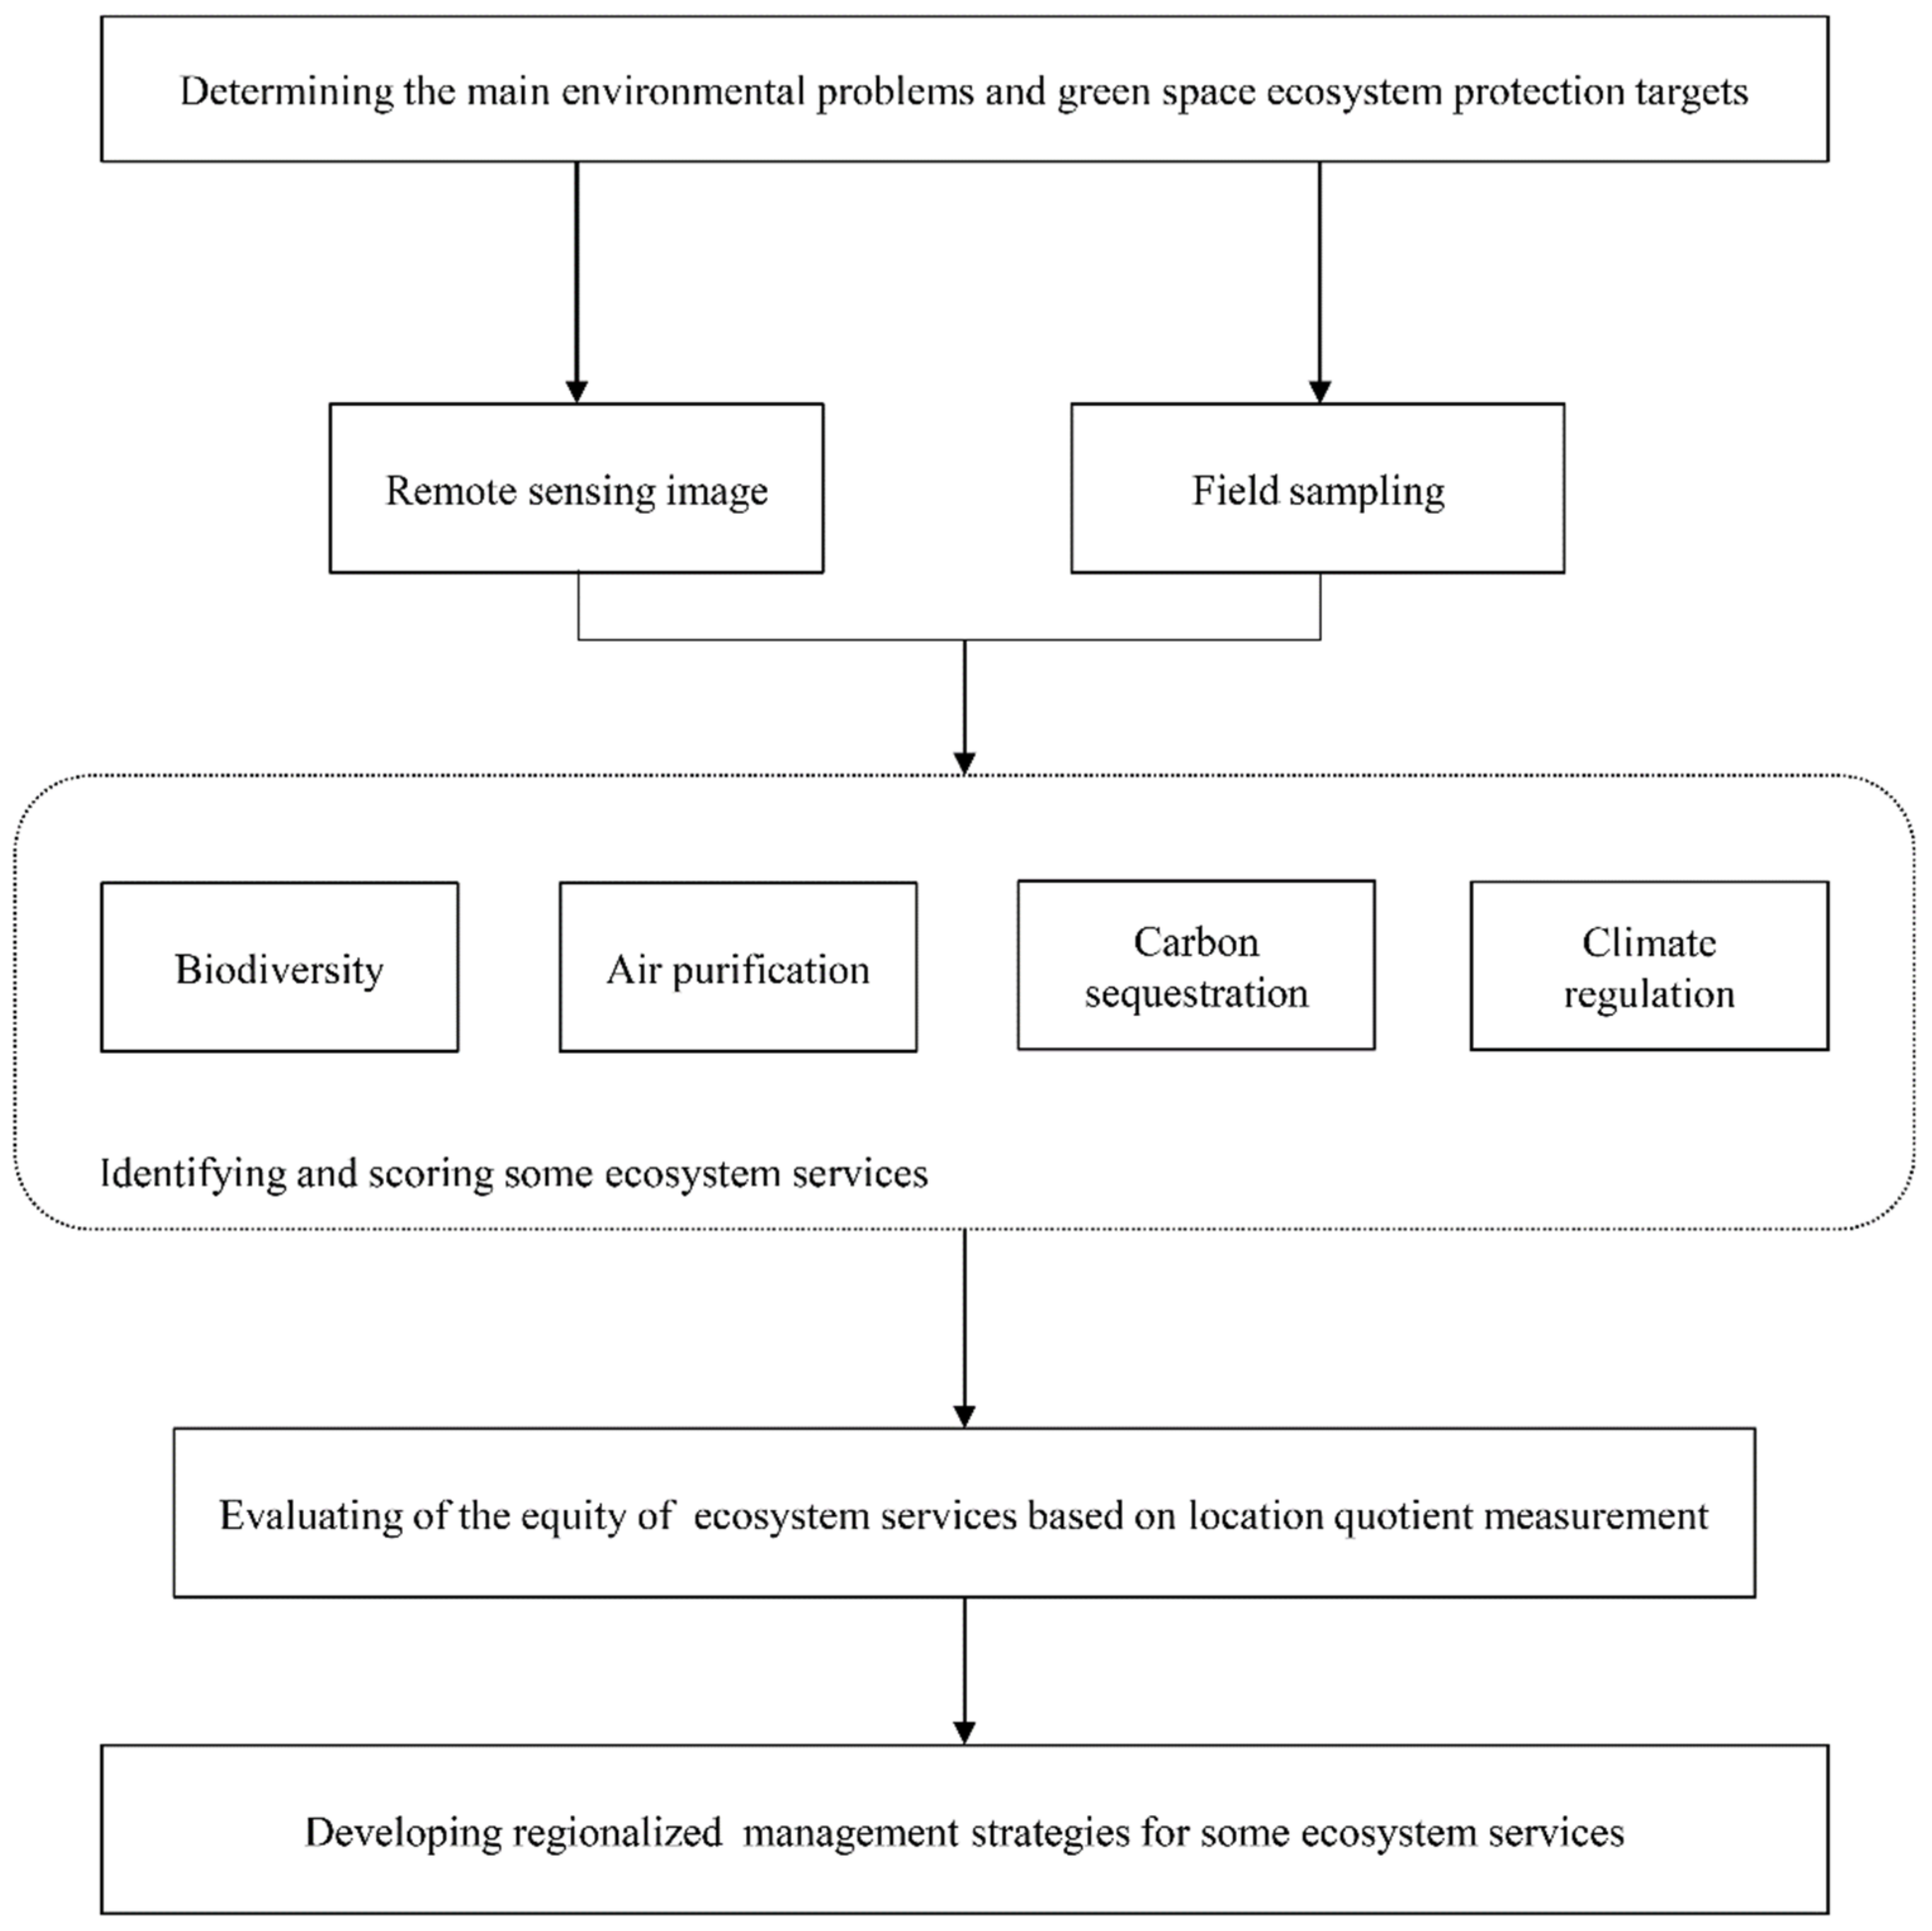
2. Materials and Methods

The framework of the research contained the following 4 steps (Figure 1): (1) determining the main environmental problems and green space ecosystem protection targets; (2) identifying and scoring some ecosystem services; (3) evaluating the equity of ecosystem services based on the location quotient measurement; (4) developing regionalized management strategies for some ecosystem services.

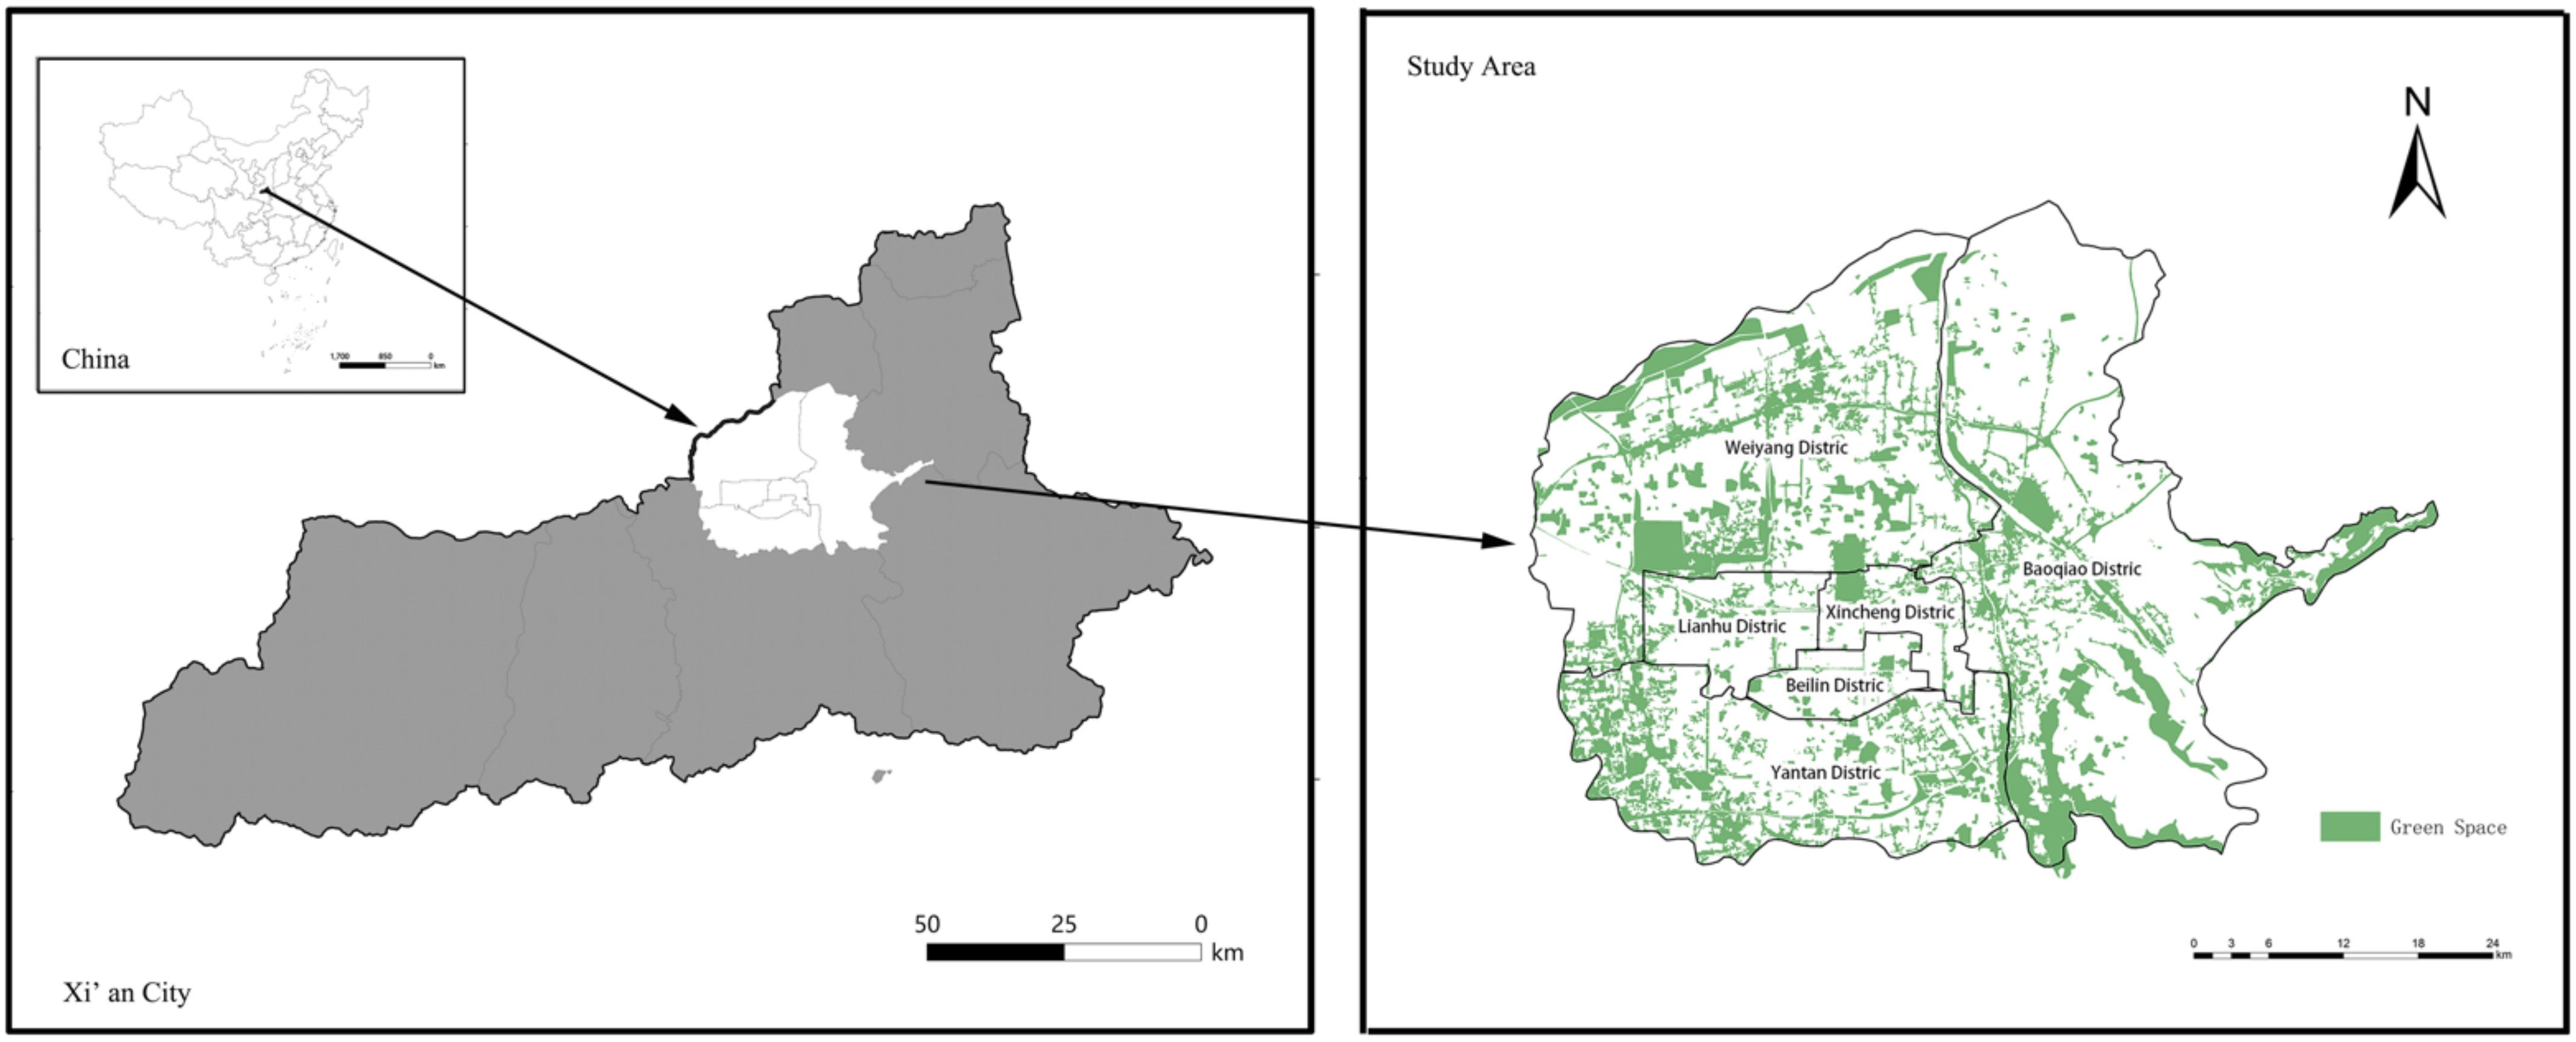
2.1. Study Area and Data Sources

The study area is the main urban area of Xi’an City, China, including Yanta District, Lianhu District, Xincheng District, Beilin District, Weiyang District, and Baqiao District. The geographic location is in the central Shaanxi Plain, with an area of 844.75 km2. Recently, the construction of urban green space in Xi’an City has been continuously developing. Weiyang and Baqiao Districts have abundant water resources and green space resources, including the Wei, Ba, and Chan rivers. Based on the Sentinel-2, 10 m remote sensing image data from 2018, the distribution of green spaces in Xi’an City is primarily in relatively small, isolated patches, with few large plots (Figure 2).
In this study, the data we used mainly included the following: (1) basic geographic information data of Xi’an City, including administrative districts and counties, mainly from the National Geomatics Center of China; (2) Sentinel-2, 10 m remote sensing image data, obtained on 14 January and 23 June 2018; (3) meteorological data, including data on wind speed and direction, temperature, relative humidity, and precipitation, mainly from the China Meteorological Administration (http://data.cma.cn/, accessed on 20 May 2020); (4) PM2.5 data from the Ministry of Ecology and Environment of the People ’s Republic of China (http://www.mee.gov.cn/, accessed on 10 March 2020), consisting of hourly real-time data of the continuous measurement of PM2.5 particulate matter from 13 national monitoring stations in Xi’an; (5) atmospheric profile parameters from the National Aeronautics and Space Administration (https://www.nasa.gov/, accessed on 1 May 2020); (6) relevant population, social, and economic data from the Statistical Yearbook of Xi’an City, some of which were obtained by field measurements.

2.2. Field Survey

We began our field survey by selecting various existing green space quadrats in 6 urban districts of Xi’an City. To maintain the universality of the quadrats, several types of green spaces were selected. These included parks, community green spaces, university campuses, and scenic locales. We used a hand-held GPS or other mobile devices capable of obtaining latitude and longitude information to define 20 m × 20 m sample squares in the field. Other tools used for the field measurements included a tree diameter measuring tape, an altimeter, and the “Xingse” app [32] for identifying species. Field data were collected between June and August 2018. The collected field data included tree diameters at breast height (DBH, 1.3 m above the ground), heights under branches, left and right crown widths, tree heights, health status, and coordinates. A total of 121 groups of measured data samples were collected: 25 groups in Yanta District, 25 groups in Beilin District, 25 groups in Lianhu District, 22 groups in Xincheng District, 16 groups in Weiyang District, and 8 groups in Baqiao District. A total of 1795 trees were measured.

2.3. Ecosystem Service Estimation

Based on the status of the ecological environment in the study area, we selected 4 services for calculation: biodiversity, carbon sequestration, air purification, and climate regulation. Based on the field measurement data and remote sensing images, biodiversity services used the inversion model of species diversity in the arbor layer [33] for estimating biodiversity. The sedimentation flux [34] was calculated based on the sedimentation rate. The leaf area indexes of various tree species and the ability of green spaces to remove PM2.5 were jointly evaluated. We obtained hourly PM2.5 concentration data from 14 January 2018. Using remote sensing tools and the InVEST Carbon module [35], the carbon sequestration service capacity and the spatial distribution of green spaces in the study area were studied. The mono-window algorithm [36] was used to calculate the land surface temperature based on the image data acquired on 23 June 2018. The specific measurement index system is presented in Table 1.
In the above formulas, NDVI is the normalized difference vegetation index [38], TC2 is the greenness, and TC3 is the humidity. The variable F is the dry deposition flux, LAI is the leaf area index, T indicates 24 h per day, and R is the resuspension rate. Variables Csoil, Cabove, Cbelow, and Cdead correspond to the carbon density of soil, aboveground and underground vegetation, and dead organic matter, respectively. Additionally, S is the area, ε is the surface emissivity, τ is the atmospheric transmittance, Td is the surface brightness temperature, and Ta is the average temperature of the atmosphere.

2.4. Evaluation of the Equity

This study introduced the location quotient [39] to analyze the spatial distribution patterns of ecosystem service equity. Assuming that the location quotient of each regional unit is the per capita green area of the population in the region and the quality of the 4 ecosystem services, the formula for the location quotient is as follows:
Q S i = G i P i G P
where Q S i refers to the location quotient of the i-th spatial area unit; G i represents the green area in the i-th spatial area unit and the corresponding quality of 4 types of ecosystem services; P i refers to the permanent resident population in the i-th spatial area unit Population; G refers to the total green area and the quality of ecosystem services in the entire study area; P refers to the total population of the entire study area.

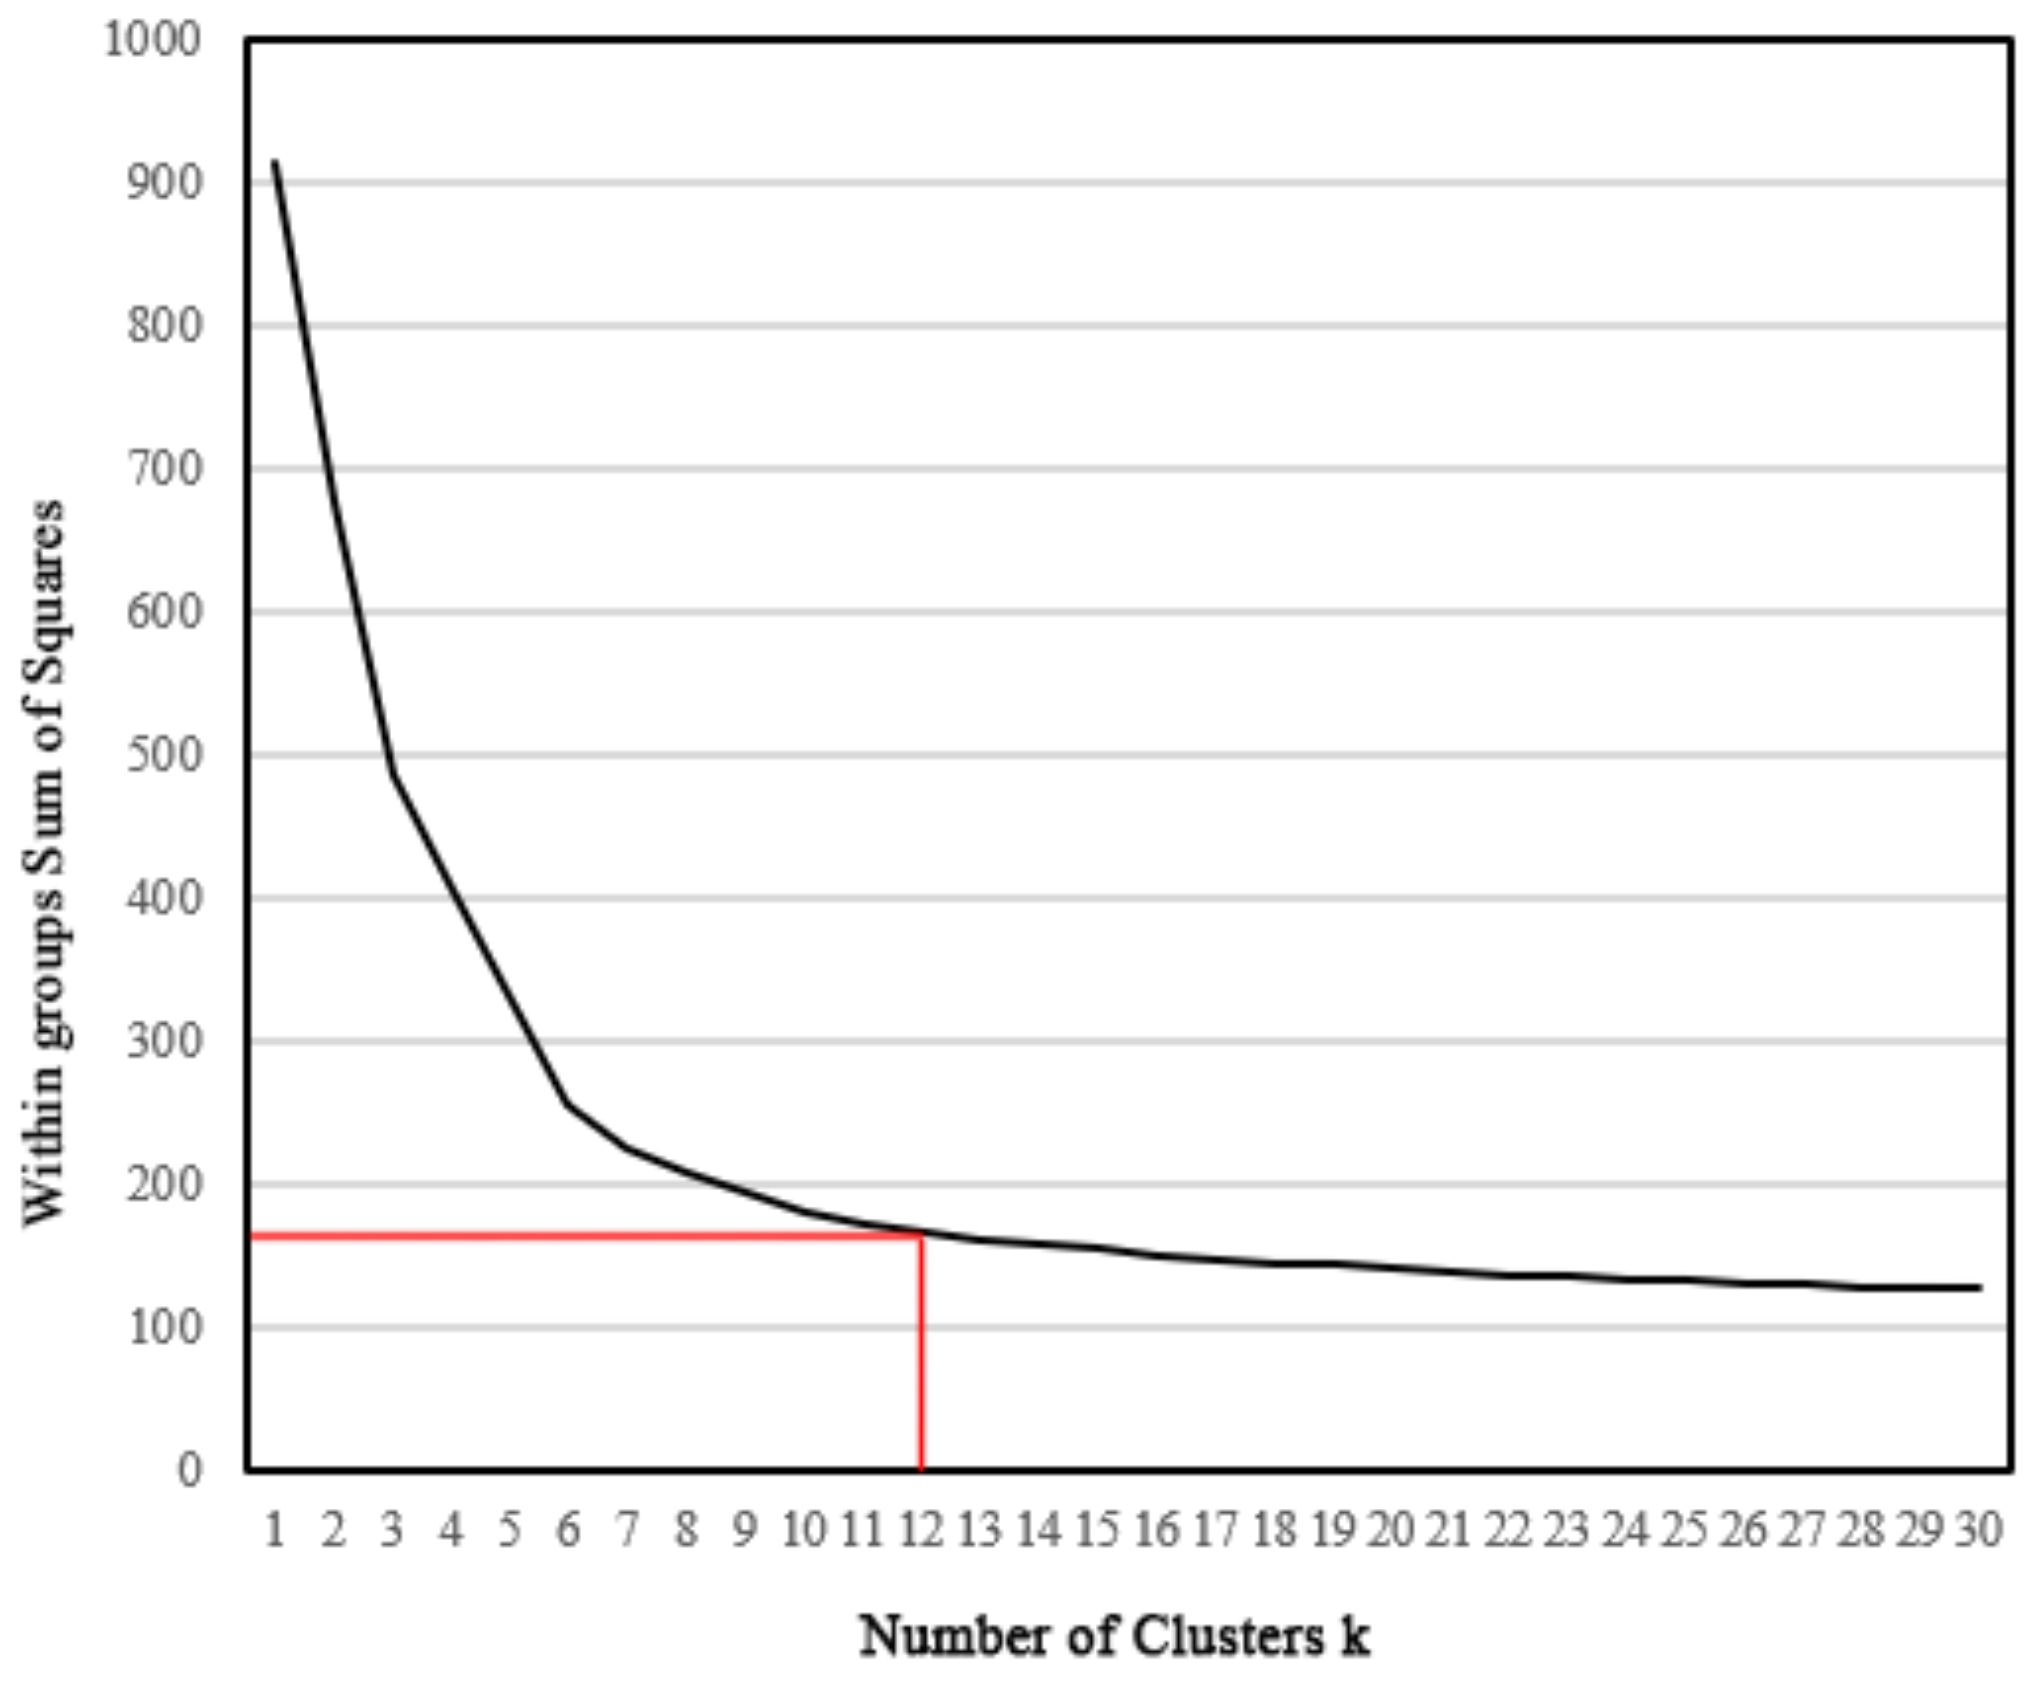
2.5. Regionalization

In this study, we used the regionalization method to accurately cluster and partition areas whose equity evaluation needs to be improved. This method is based on dynamic constraint aggregation clustering and partitioning. The algorithm is based on 6 regionalization methods, which combine 3 clustering methods (single-link clustering, average link clustering, and full link clustering) and 2 spatial constraint strategies (first-order constraints and full-order constraints). We chose the full-order constraint strategy, which is based on the distance-based k-nearest neighbor matrix and a set of driving agglomerative clustering methods. Average link clustering ( d A L K ) defines the distance between 2 clusters as the average difference between all pairs of data points across clusters.
d A L K L , M = 1 L M u L v M d u v
where |L| and |M| are the number of data points in clusters L and M, respectively; uL and vM are two data points; d u v is the dissimilarity between u and v.
The merging process uses the full-order constraint strategy to merge adjacent constraints. Continuity-constrained clustering does not allow 2 spatially discontinuous clusters to be merged. This is the difference between classical spatial clustering and regionalization. The full-order constraint strategy includes all edges in the clustering process and defines the distance between 2 clusters from all edges. This strategy is dynamic because it updates the adjacency matrix after each merge to track all edges connecting 2 different clusters.

3. Results

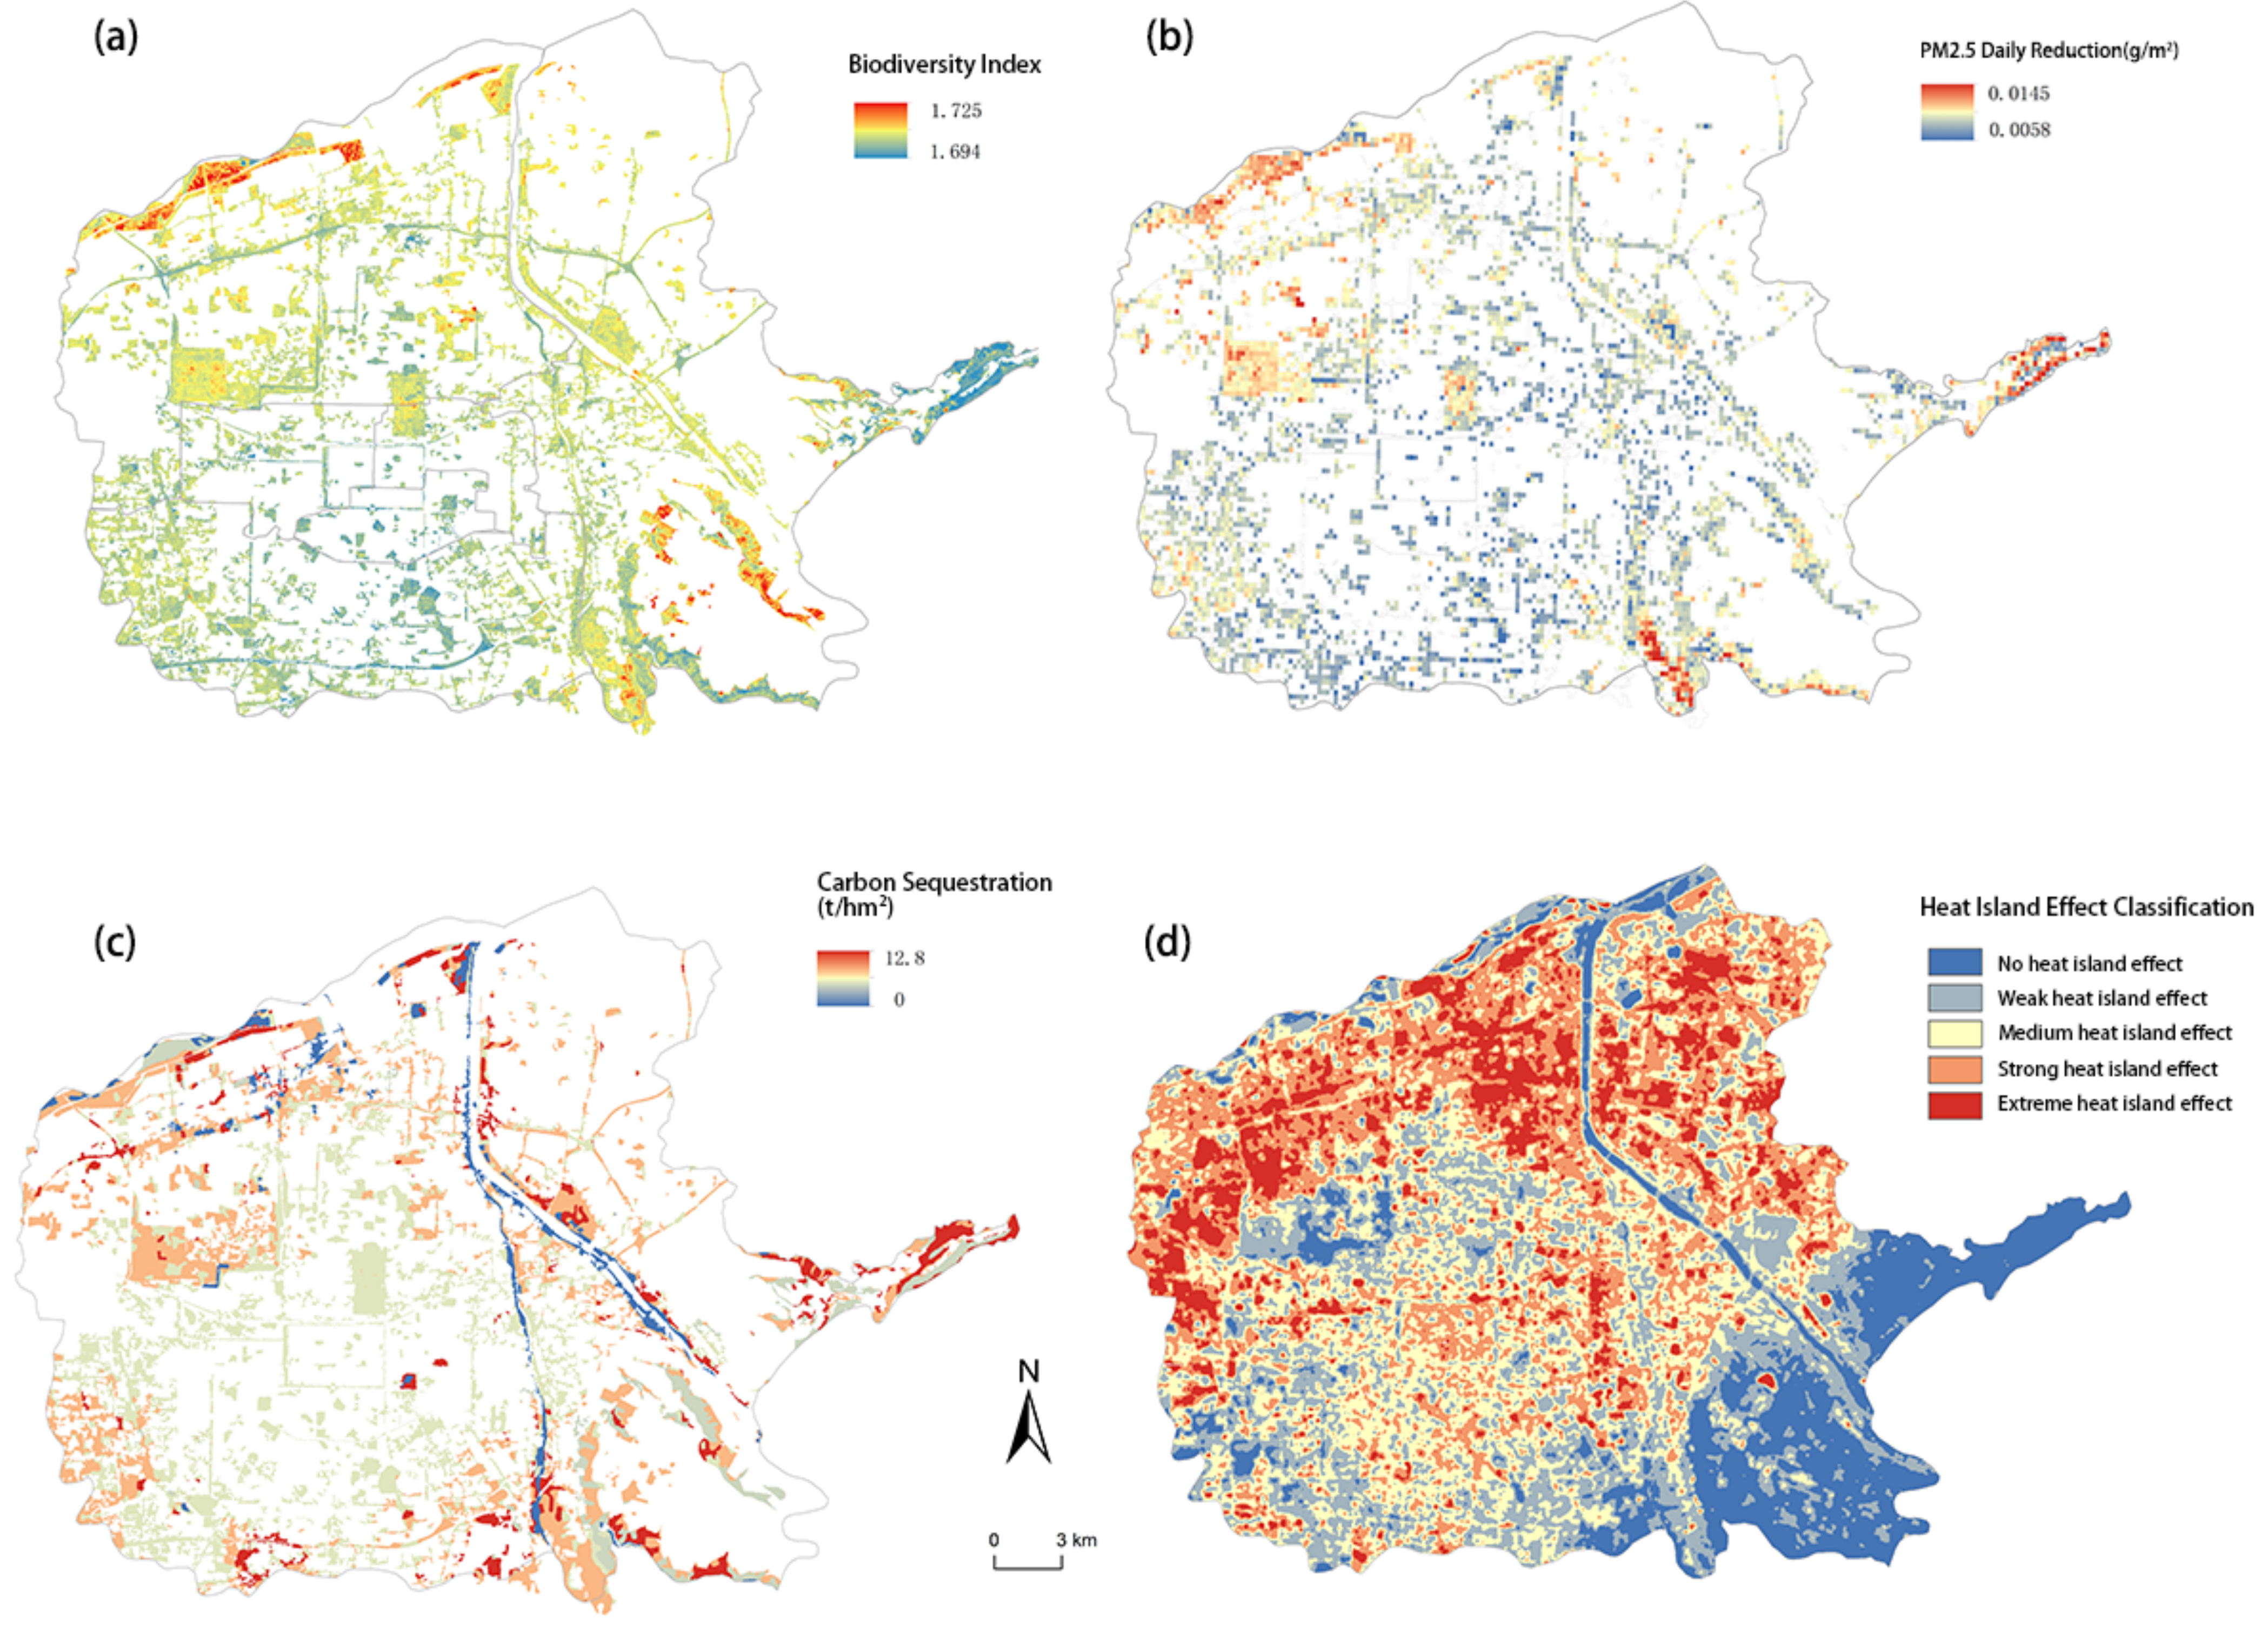
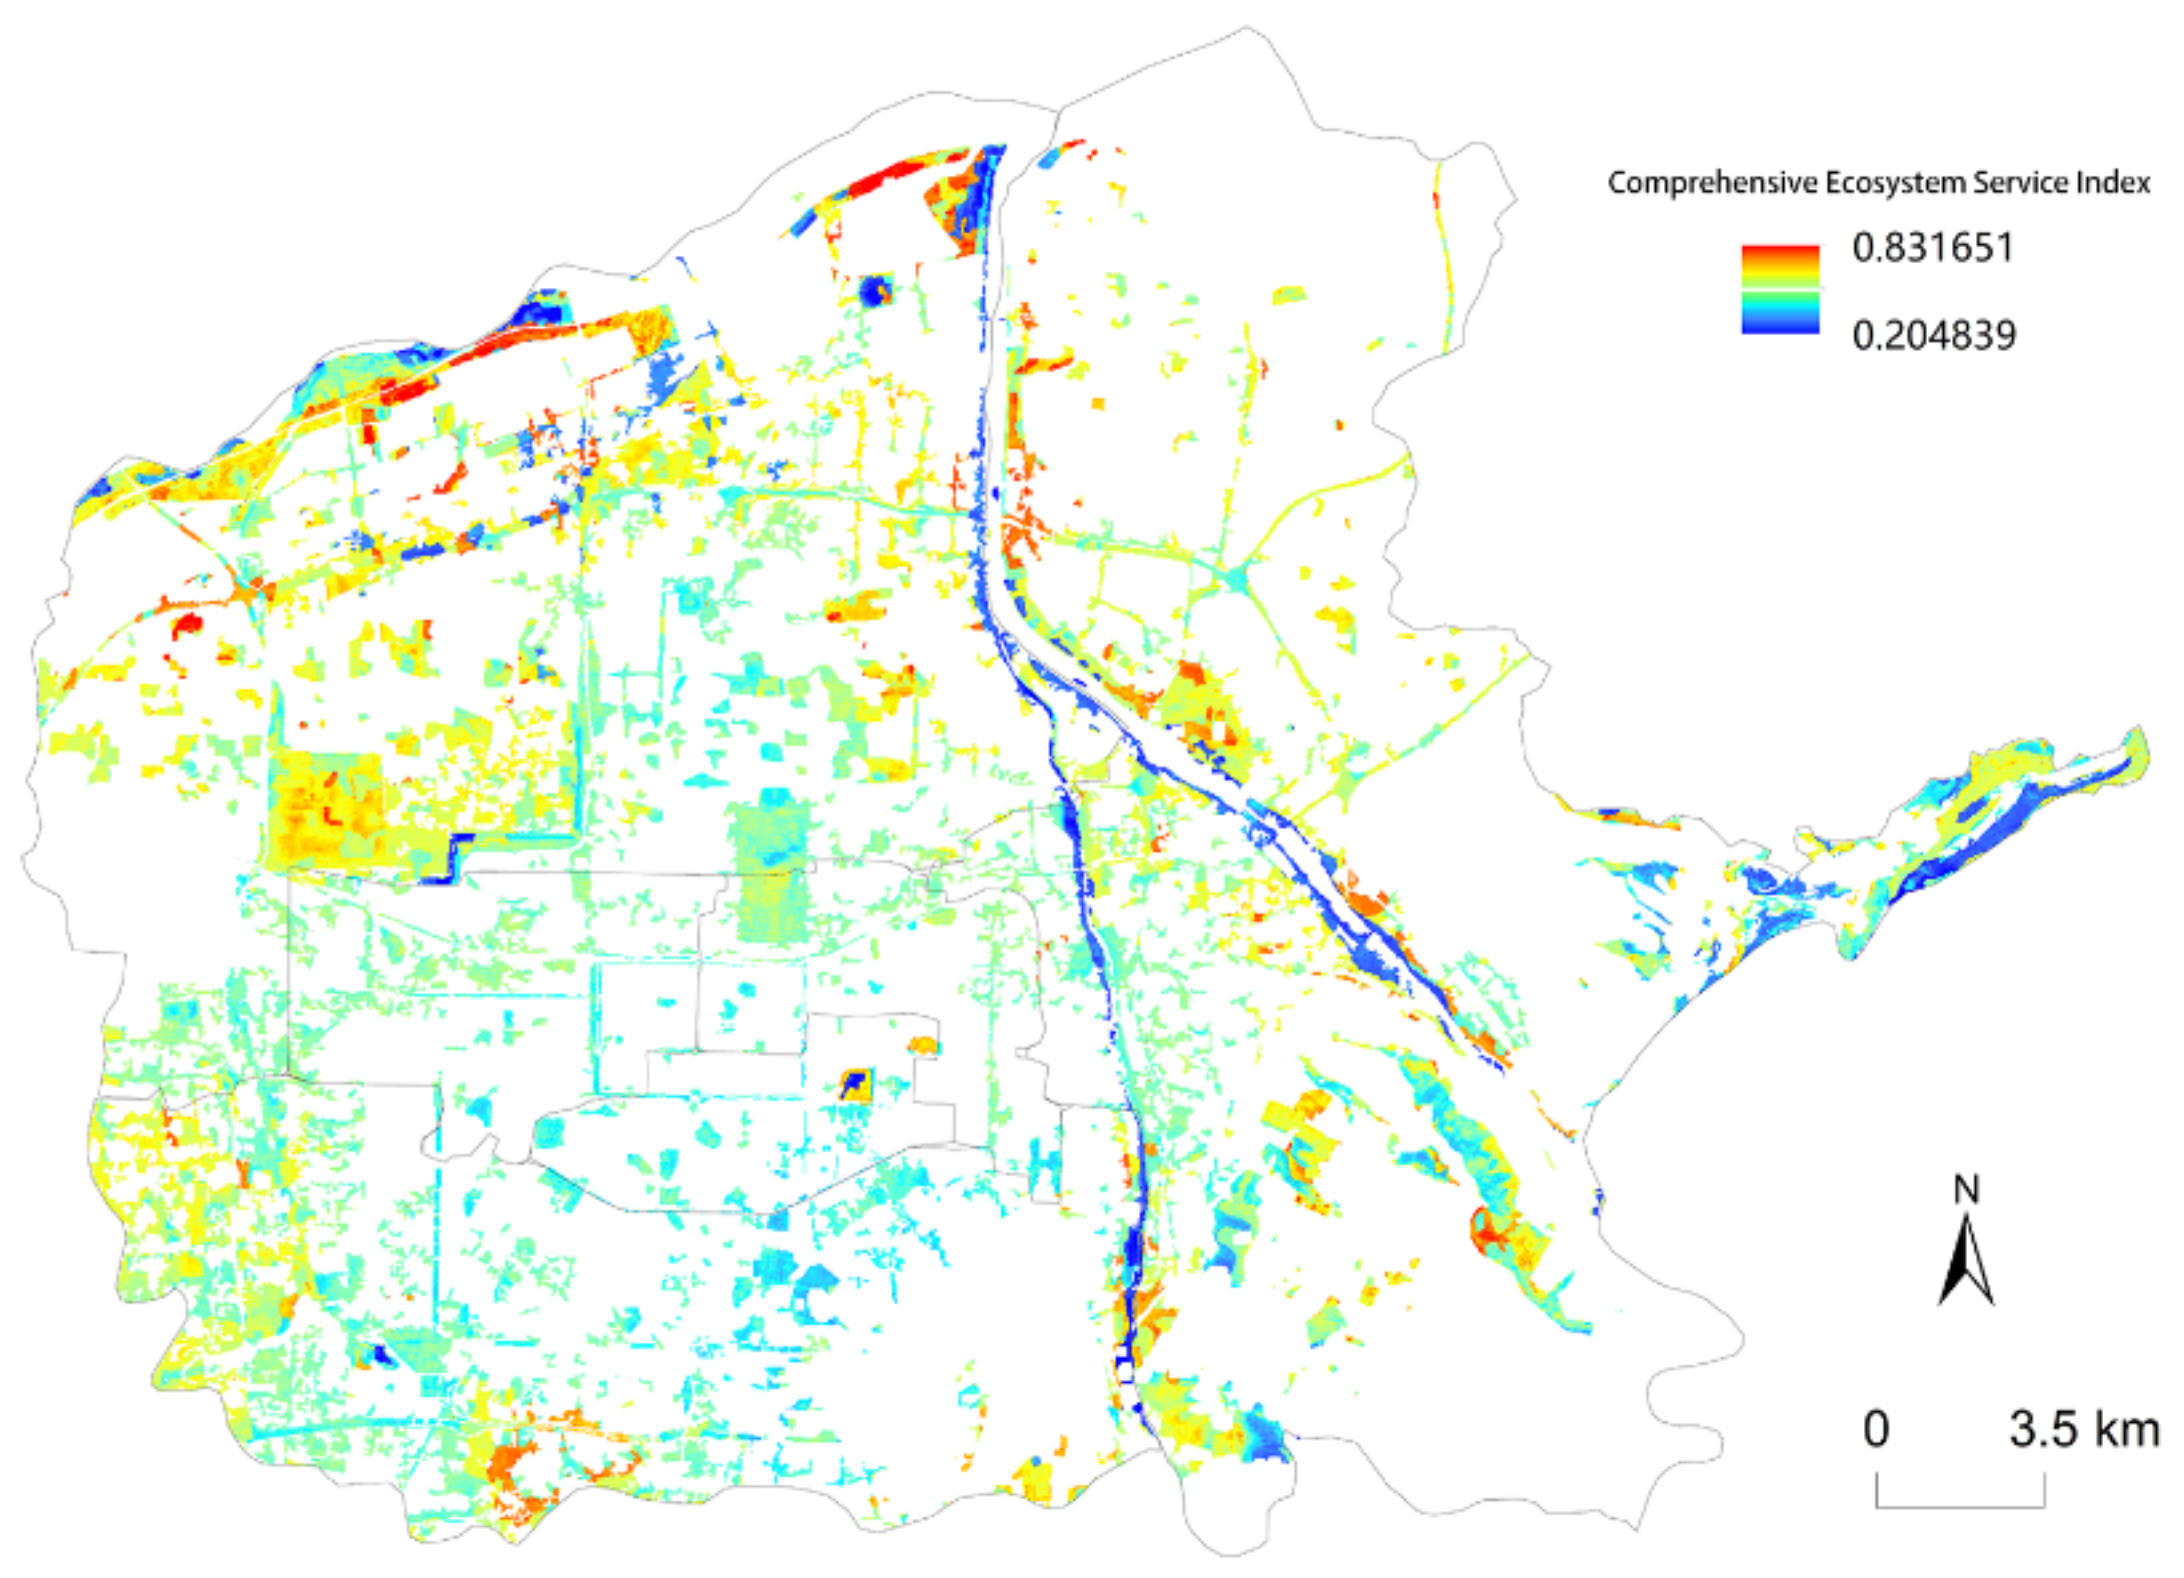
3.1. Ecosystem Service Estimation

The ecosystem services were measured as shown in Figure 3. The diversity index ranged from 1.694 to 1.725. Higher values are mainly distributed in places such as parks and their vicinities (e.g., Xi’an Botanical Garden, Baqiao Ecological Wetland Park, and Weihe City Sports Park). The lowest values occurred in towns surrounding the colonies east of Baqiao District, and near the West Hi-tech Zone and Hancheng Interchange. Overall, the Xi’an green space revealed low complexity of community structures, an uneven distribution of green spaces, a high frequency of single plants, and low biodiversity.
In this study, the urban green spaces showing the greatest reduction of PM2.5 were areas with high plant coverage, such as Weihe City Sports Park in the northern section of the study area, Hanchangan City Relics Park in the west, Daming Palace National Relics Park in the central part of the study area, Baqiao Ecological Wetland Park in the east, and some tourist scenic locales. The maximum PM2.5 reduction was 0.0145 g/m3. The minimum reduction was 0.0058 g/m3. Dense networks of roads appeared to be a key factor in areas with lower PM2.5 reduction. The poor particulate capture effect of plants is mainly attributed to the high pollution, frequent road dust, and other related factors.
There were considerable variations in the carbon storage capacity of different regions in the study area. Carbon sequestration in the south and east was greater than that in the north and west, respectively. The Weiyang, Yanta, and Baqiao districts demonstrated greater carbon sequestration than other areas. The maximum sequestration value was 12.8 t/hm2. Large parks, university campuses, and scenic spots with long-established vegetation had the greatest capacity for carbon sequestration.
Land surface temperatures (LSTs), as obtained from remote sensing images on 23 June 2018, ranged from 20.2 to 54.1 °C. The natural break-point method was used to classify the LSTs. Land surface temperatures decreased from northwest to southeast. High-temperature areas were larger, localized, and contiguous, while low-temperature areas were more scattered. Low-temperature areas appeared near water bodies and large parks. Further analysis of the relationship between urban green spaces and the heat island region shows that the low NDVI area and the high LST area have a high degree of alignment. The high NDVI areas were mostly in urban parks and the low NDVI areas were mainly rivers and other water bodies, as well as areas with less green space near the urban center. The NDVI of the study area was significantly negatively correlated with LST (0.01). This indicates that the LST in the green spaces with higher vegetative coverage was lower than that in other areas. Therefore, green spaces can reduce LSTs and alleviate urban heat island effects.
Field measurements were conducted to verify remotely sensed data. For biodiversity services, the correlation coefficient between the measured values and remote sensing simulated values was 0.887. This suggests a significant correlation at the 0.01 confidence level. Because green space structure information is difficult to identify and judge, a green space community with poor structure has low diversity levels despite high vegetation coverage, so the index results obtained by variable parameter inversions in this study are higher than the measured values. The biomass of various tree species was calculated for carbon sequestration services combined with the allometric growth equation [40]. The correlation coefficient between the measured calculated value and the model simulated value was 0.811, which indicates a significant correlation at a confidence level of 0.01. In addition to carbon fixation by above-ground plants through photosynthesis, the InVEST model also estimates carbon density in soil and carbon sequestration accumulated by humus (dead organic matter, such as plant leaves and branches). Therefore, the model estimates are generally greater than the actual values.

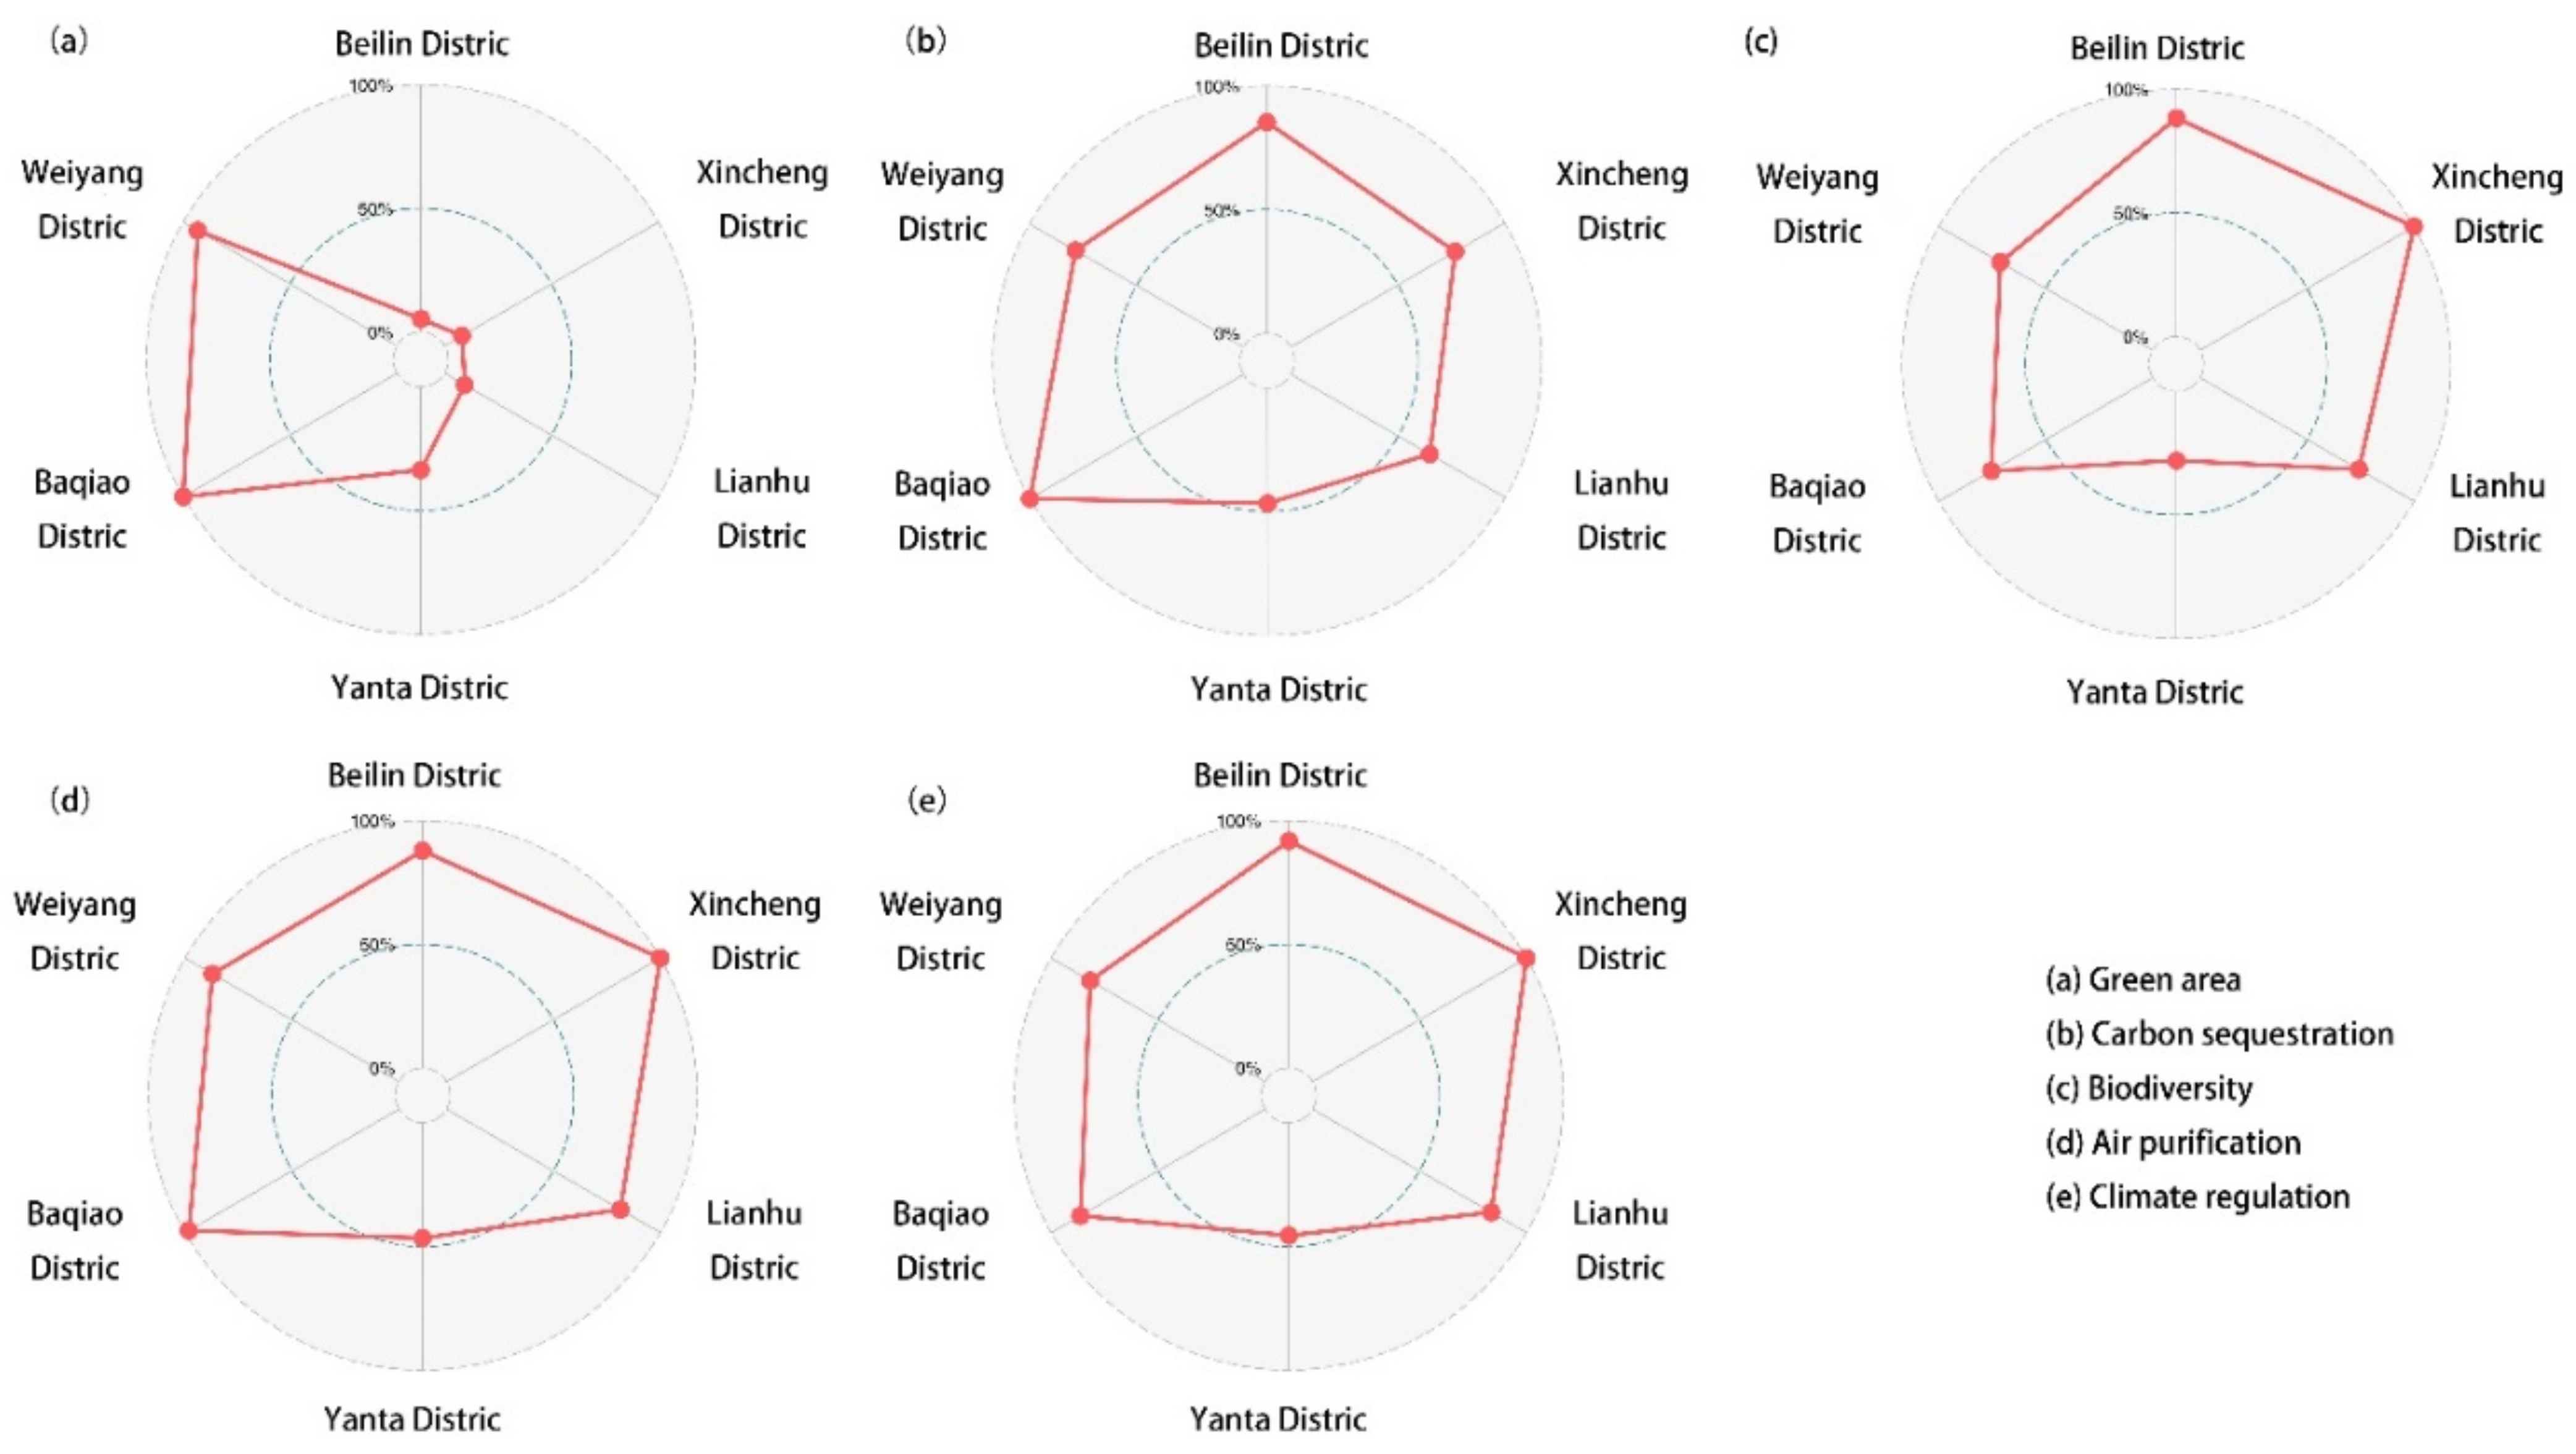
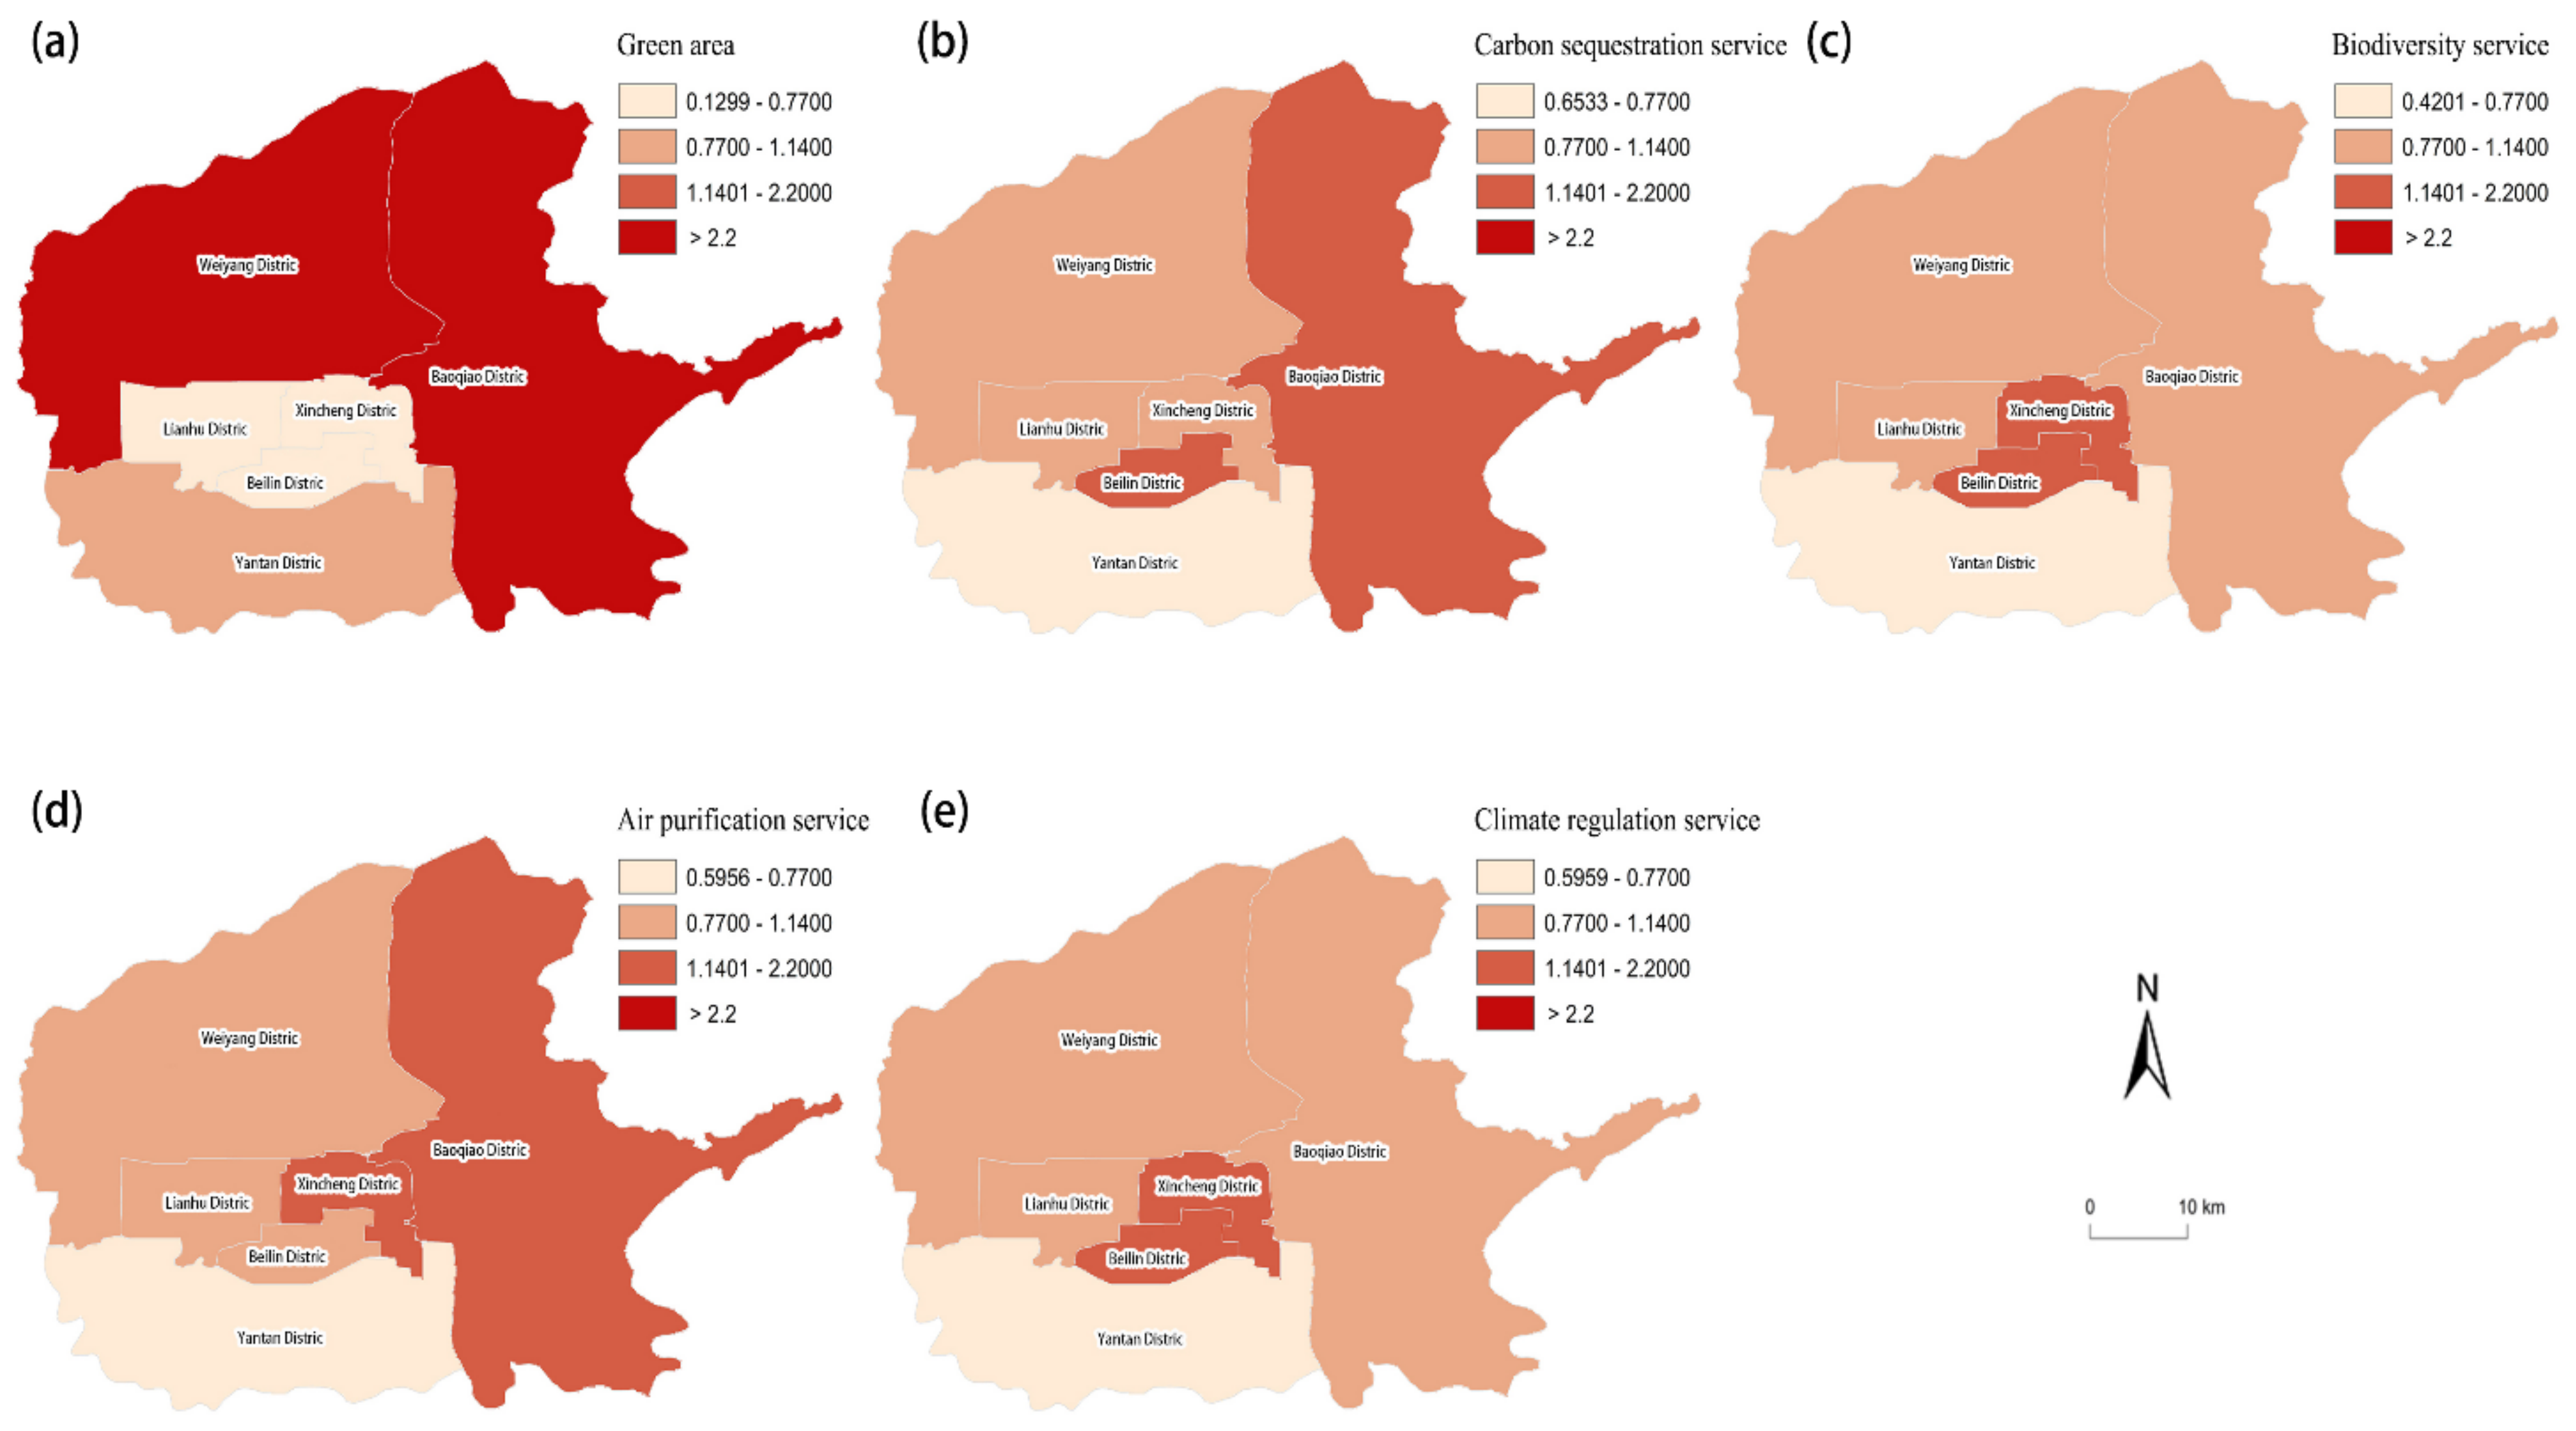
3.2. Evaluation of the Equity

The material quality of ecosystem services makes it possible to quantify equity. Based on the concept of social equity and the ecosystem services of urban green space systems, we established a quantitative index for evaluating the equity of urban green spaces in the study area. The equity levels were defined according to the location quotient value, as shown in Table 2.
Figure 4 depicts the regional distribution of the location quotient. It shows that different regional units have varying degrees of differences in green space area, plant community richness, carbon sequestration ability of tree species, air purification, and climate regulation. Figure 5 shows the difference in the per capita level of ecosystem services combined with regional population factors. These differences indicate that there is an imbalance in ecosystem services among different regions.
The results show that there are notable differences in the location quotients of ecosystem services among different administrative regions. Although the green space of Yanta District is in the upper level, the per capita service value of the four types of ecosystems is low. The per capita green space in Baqiao District is relatively high, and the level of air purification services and carbon sequestration services are also high. The per capita level of biodiversity, climate regulation, and air purification ecosystem services in Xincheng District are relatively high. Beilin District has a relatively high level of biodiversity, carbon sequestration, and climate regulation services. The per capita level of ecosystem services in Lianhu and Weiyang districts is at a medium level. According to the data, the population density of Yanta District is approximately 45,000 people per square kilometer, which is approximately twice that of Baqiao District. There are many different types of green spaces in Yanta District, such as parks and scenic spots, but the per capita level of green space ecosystem services is still low. Thus, it can be seen that in areas with low population density, the per capita green space ecosystem service level is higher. Therefore, considering population density factors when planning the spatial distribution pattern of green space ecosystem services is essential for achieving social equity.

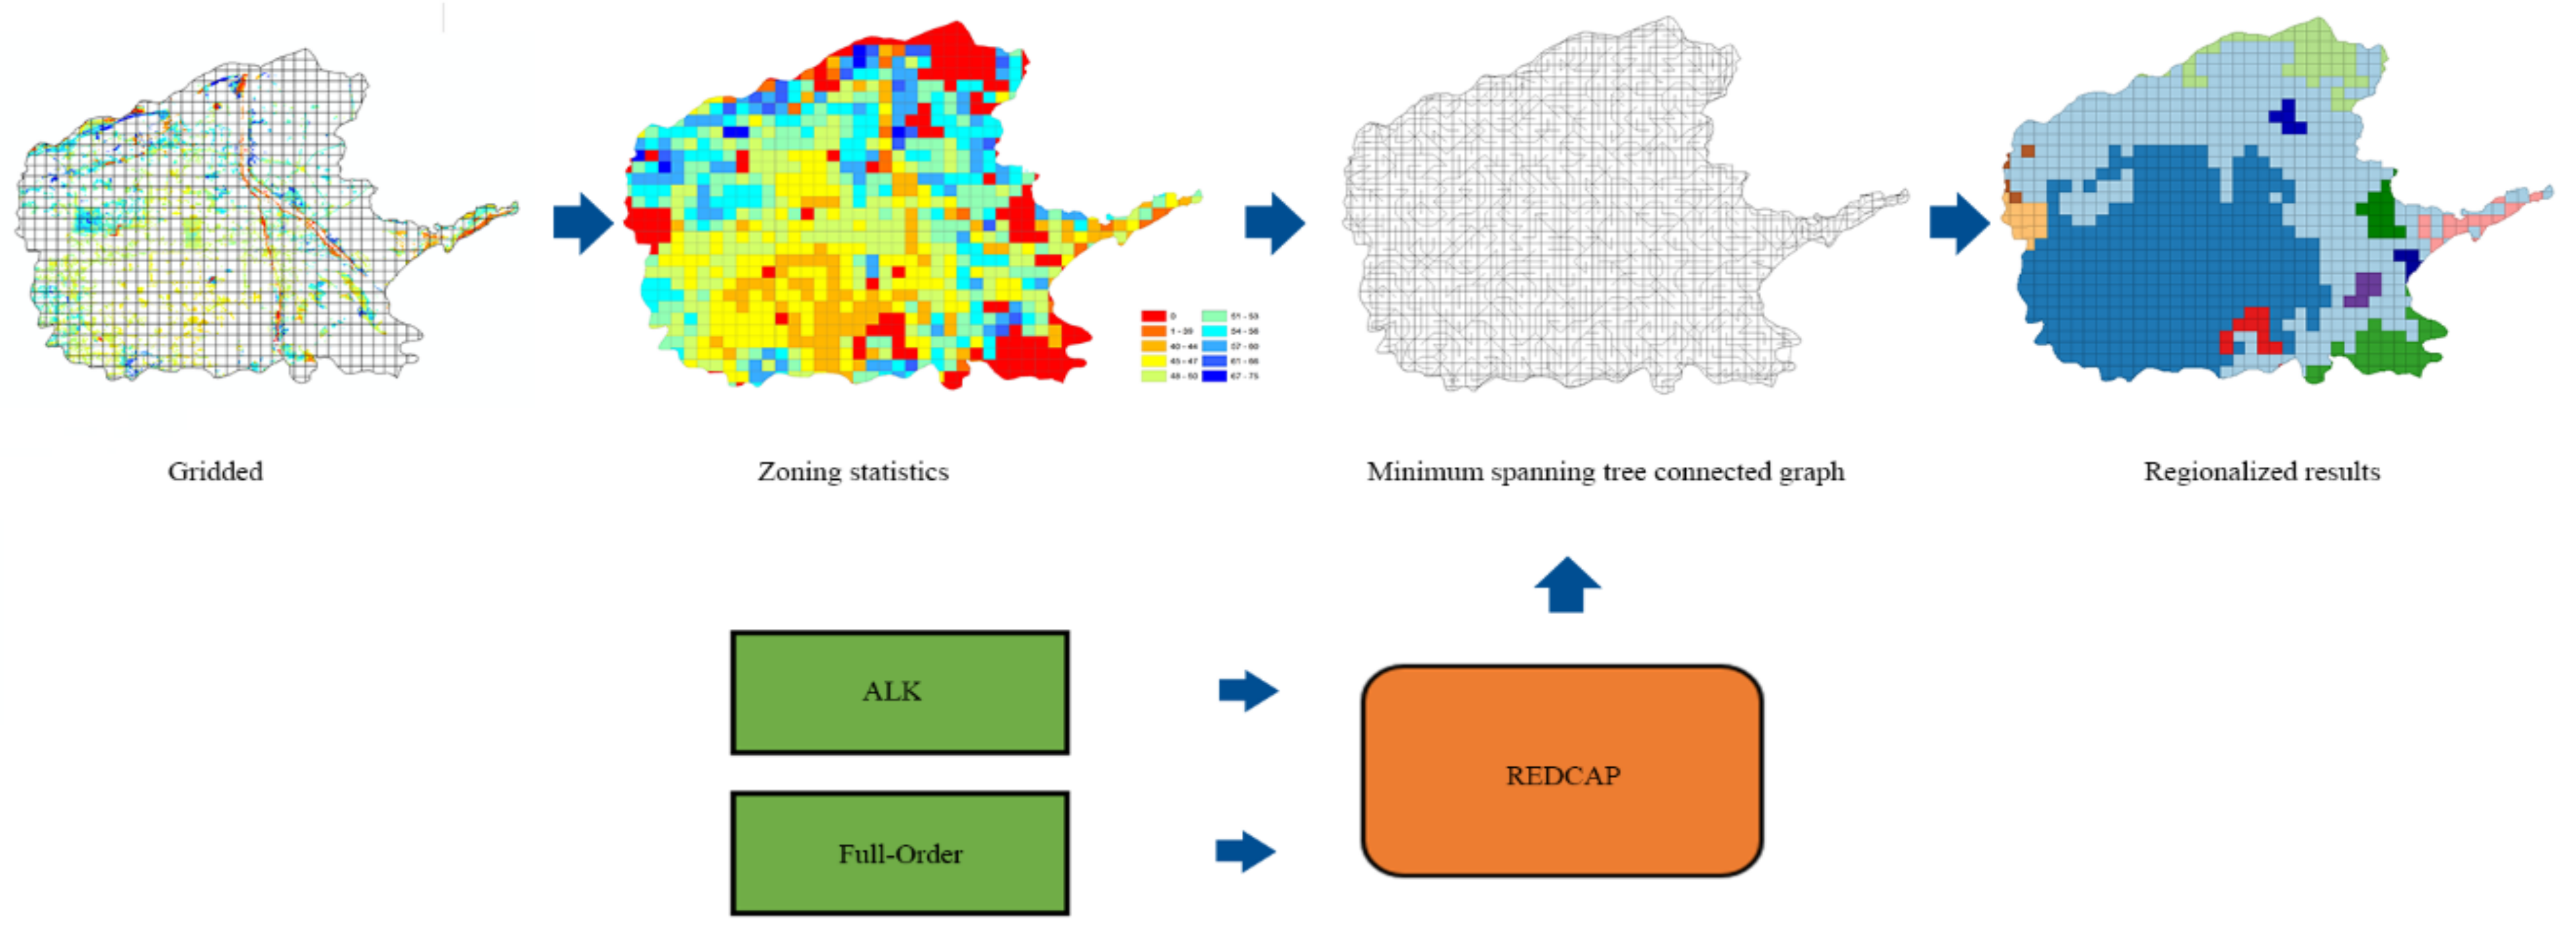
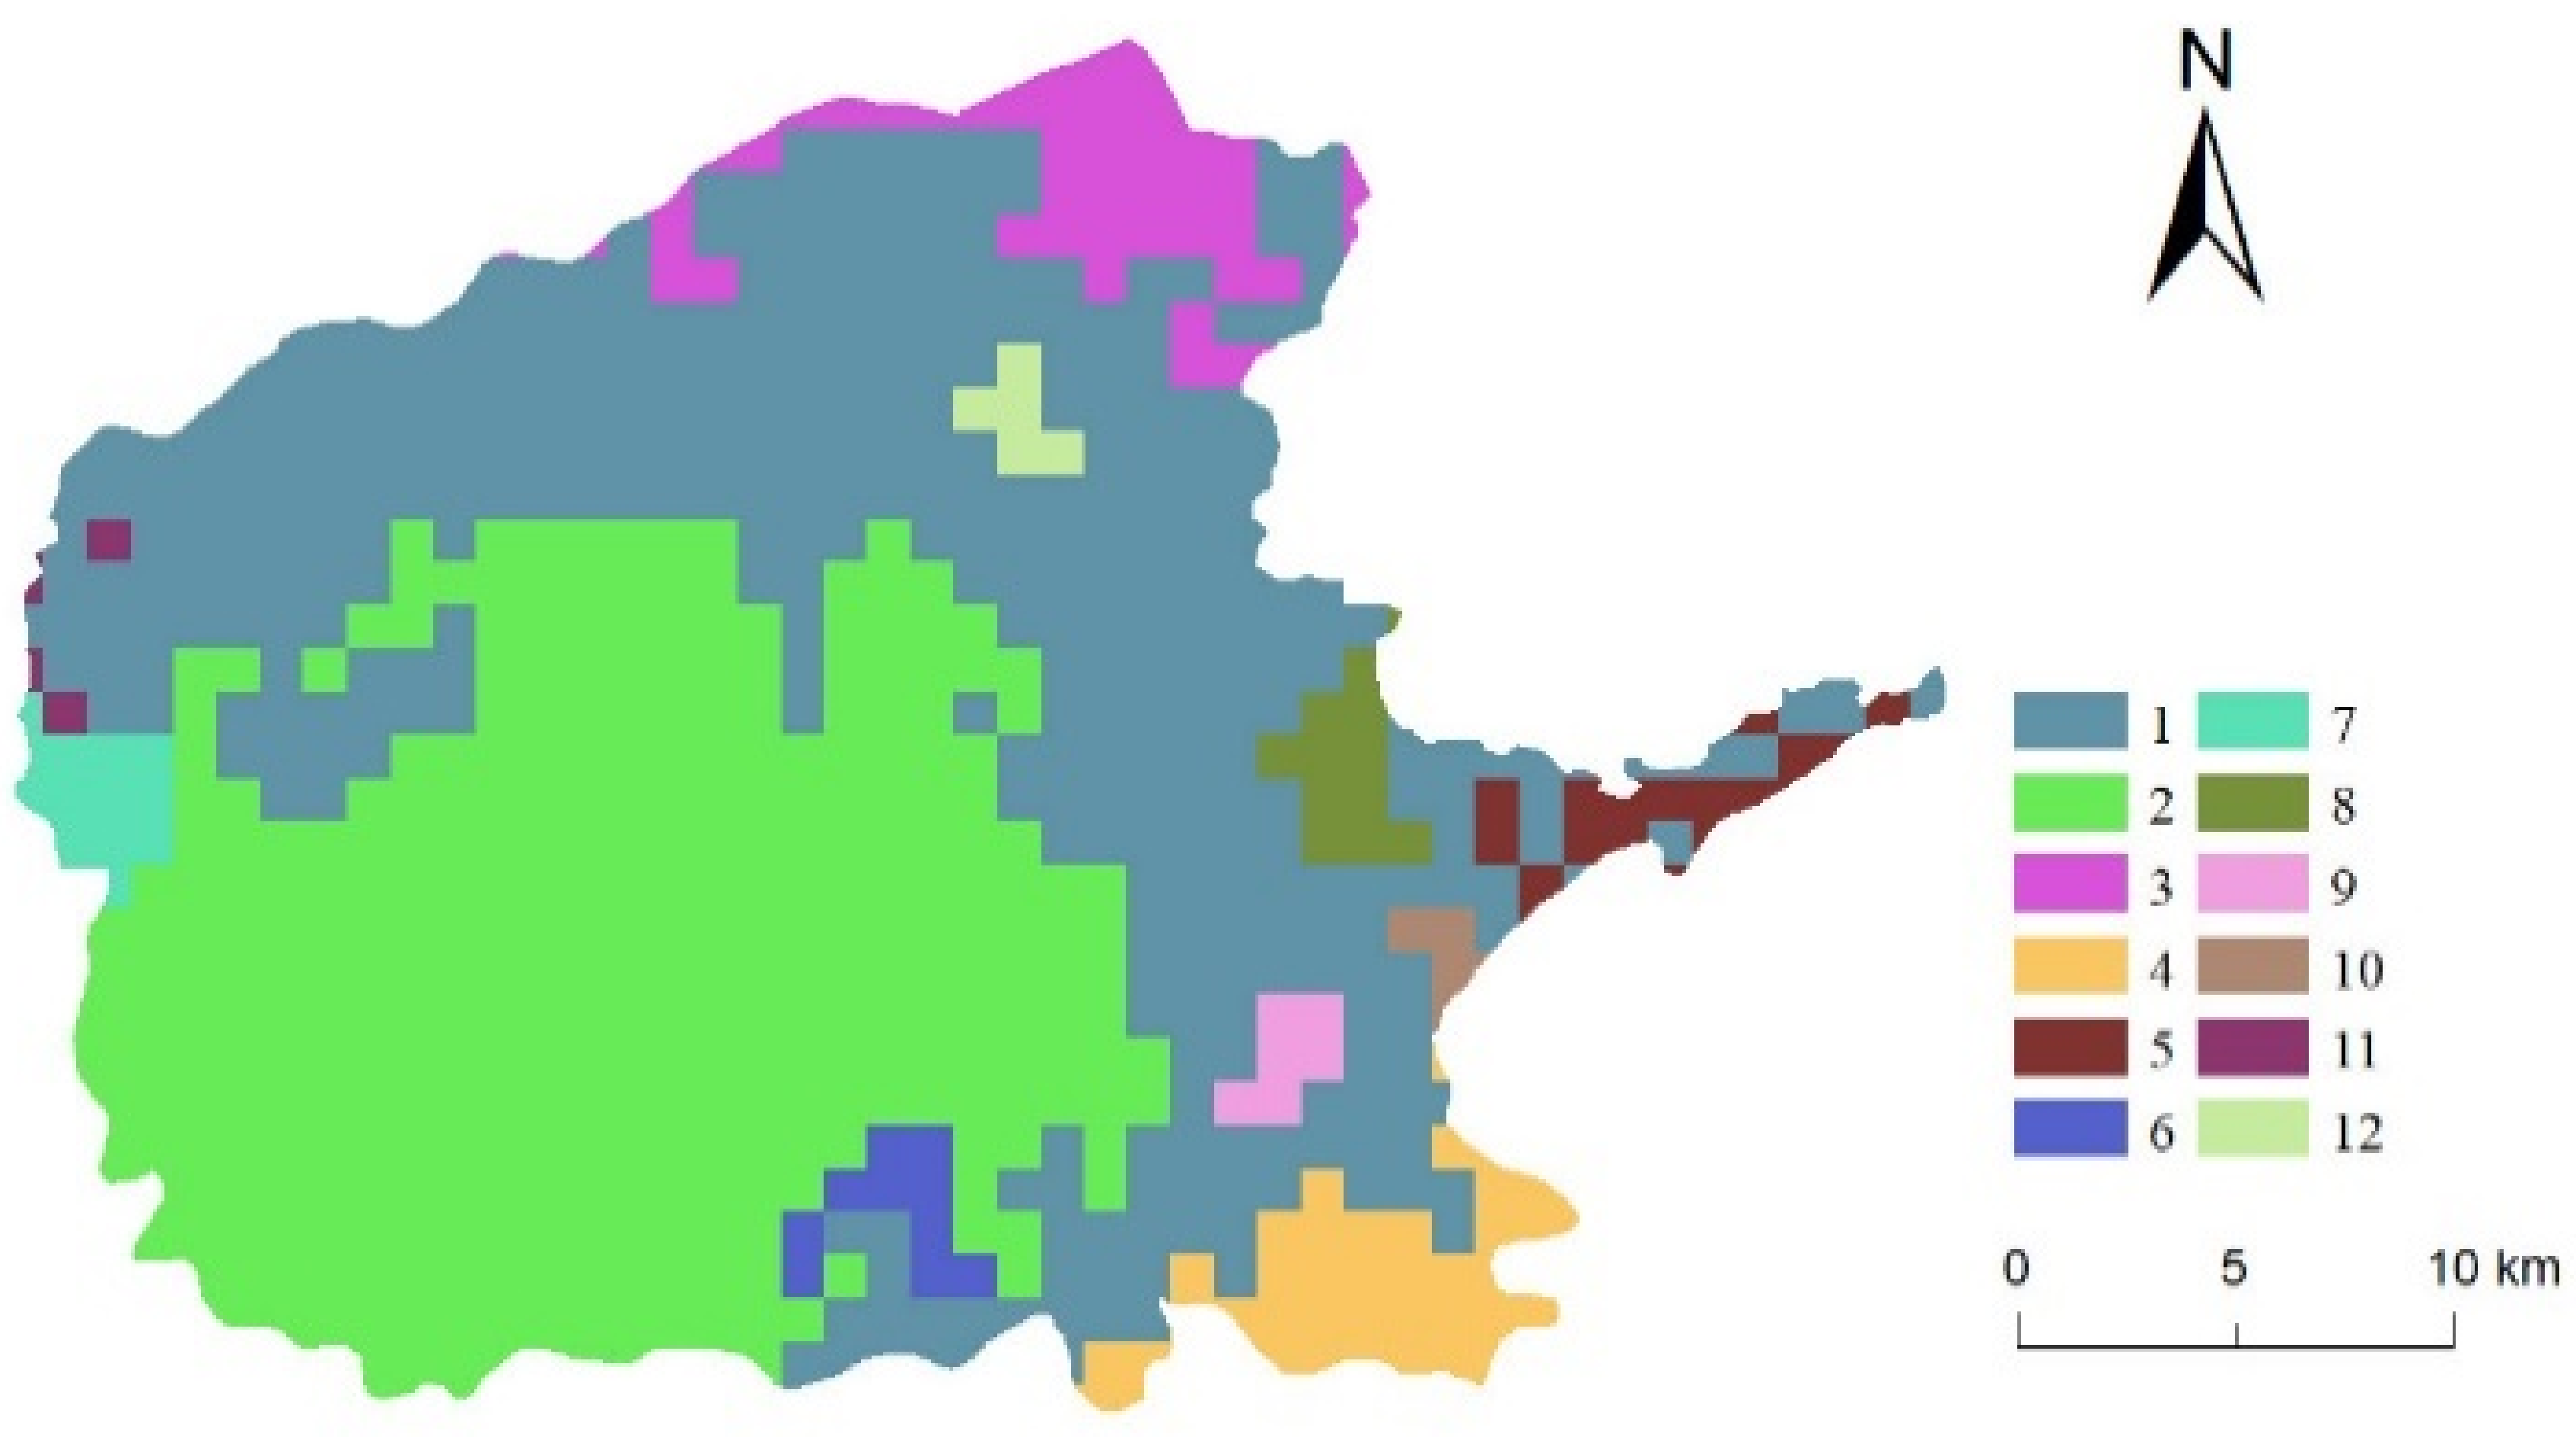
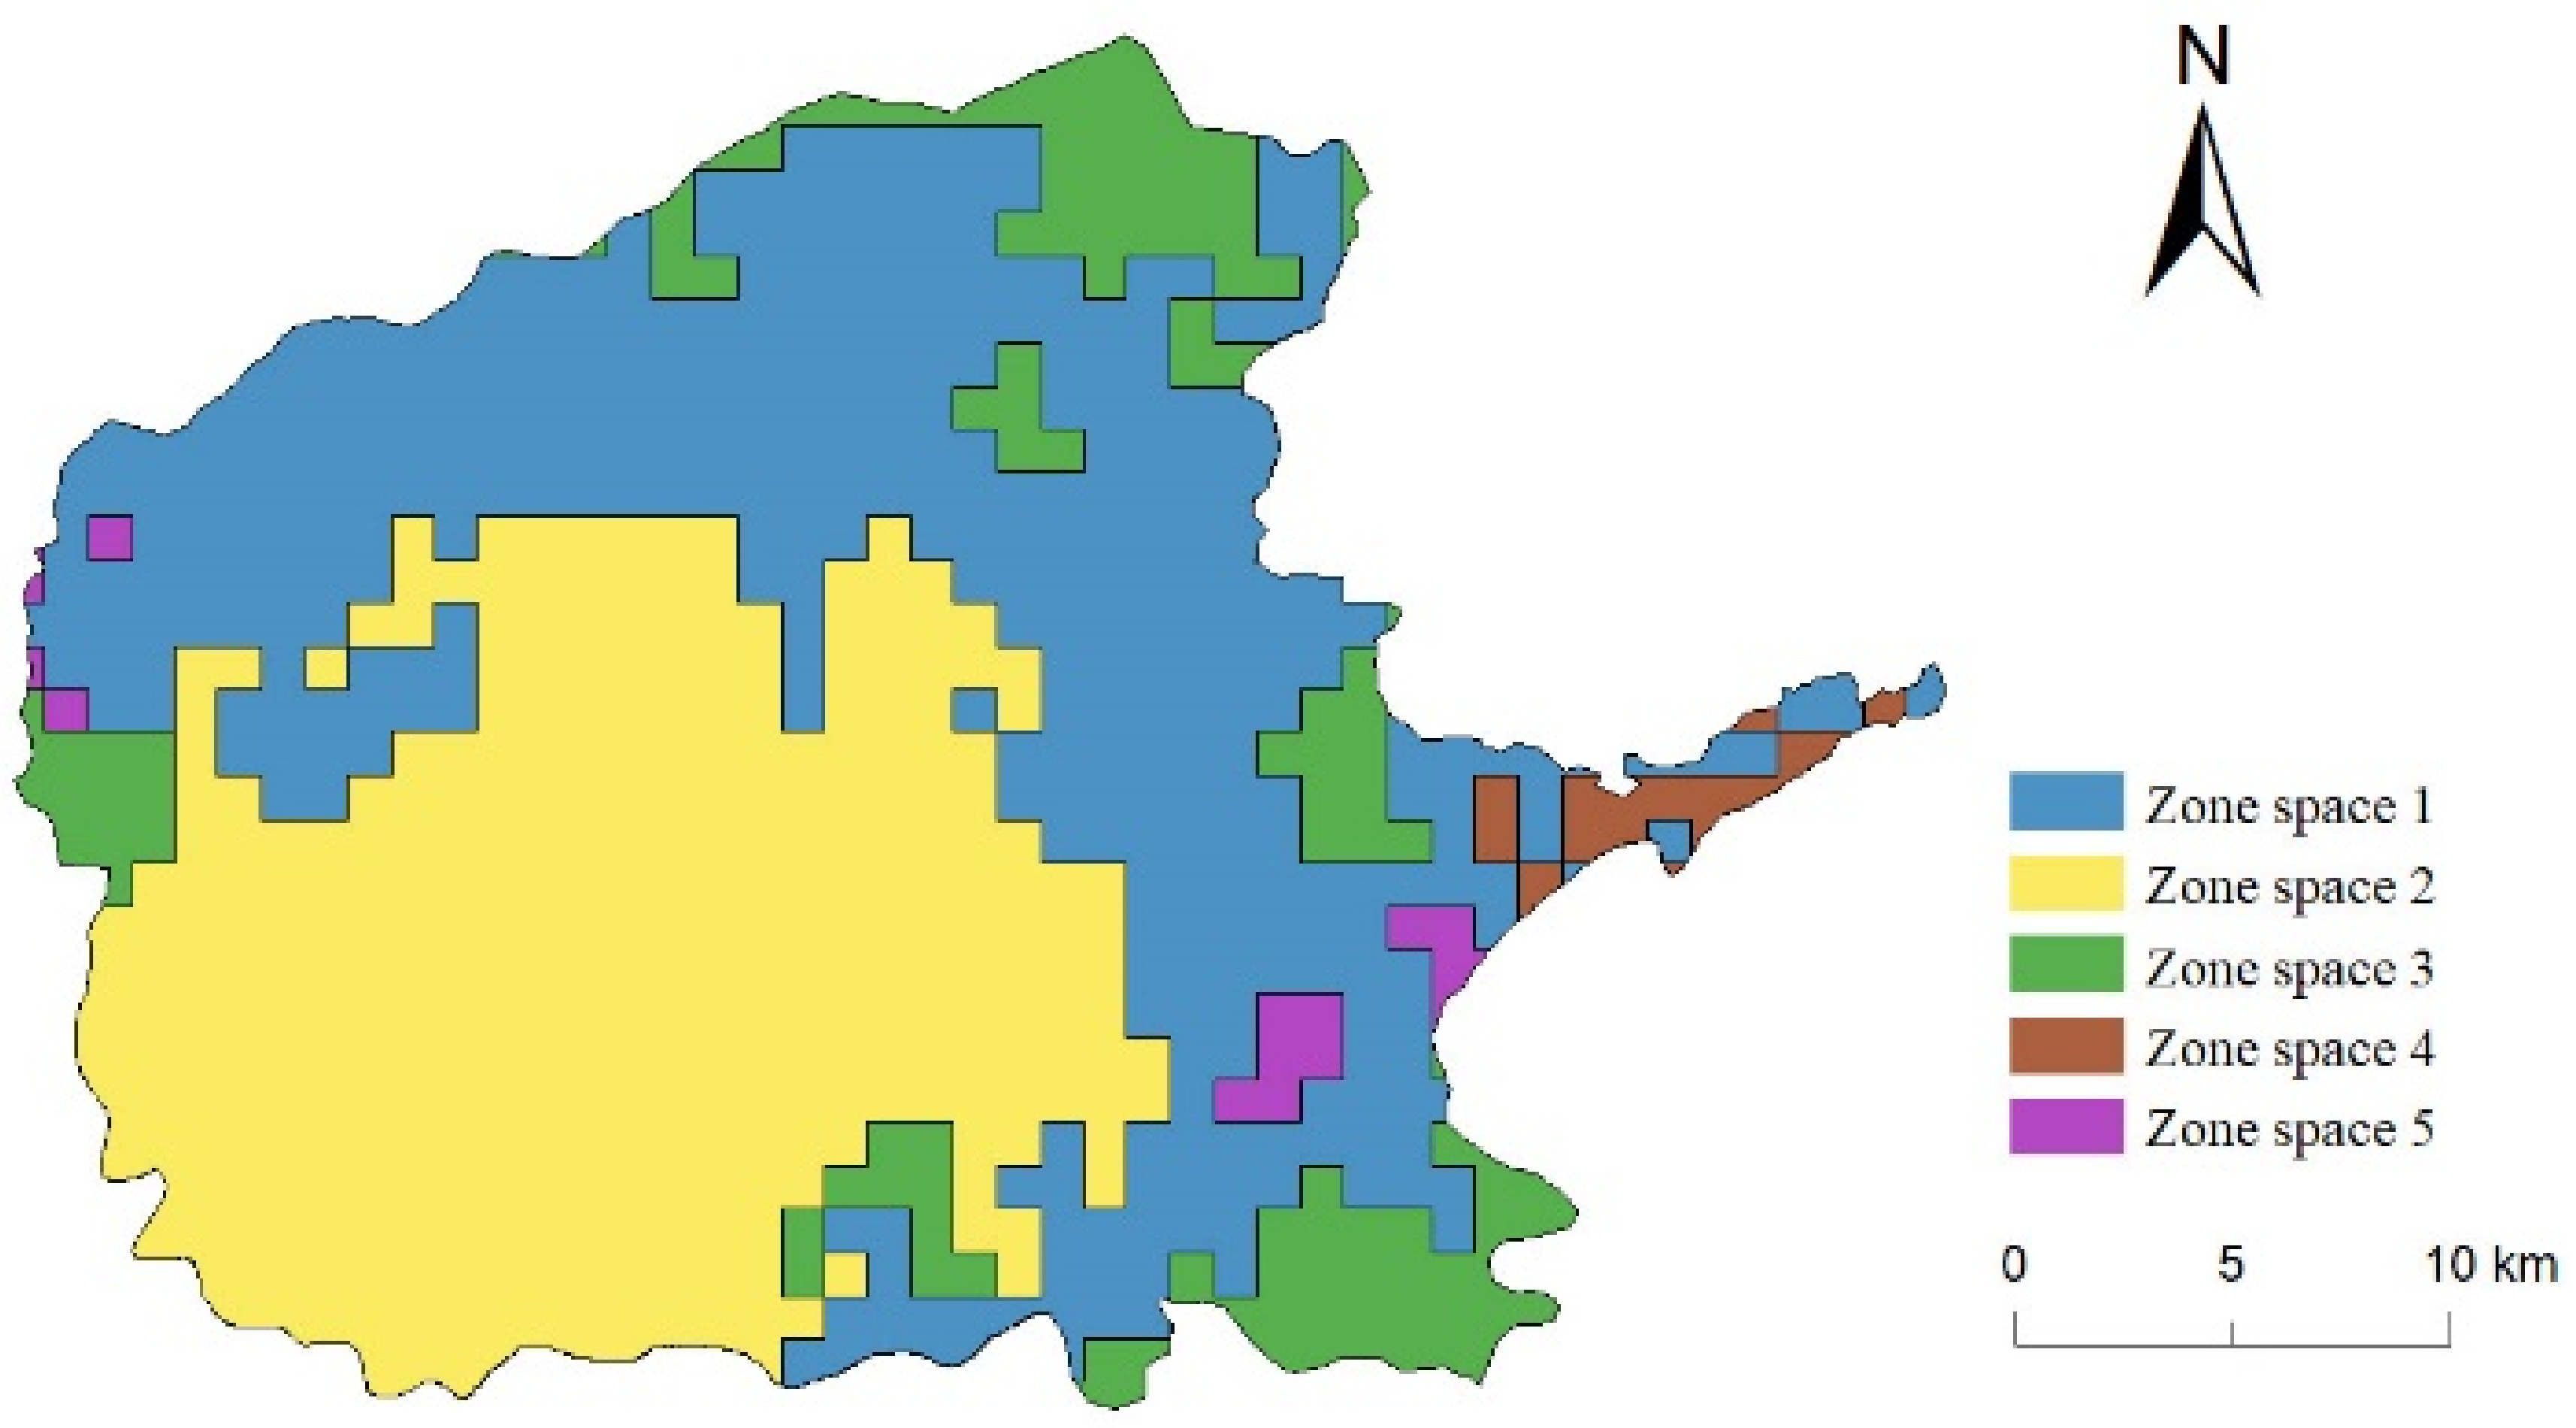
3.3. Regionalization

According to the results of the equity assessment, ecosystem services with lower or middle locational quotients (less than 1.14) in each administrative regional unit were selected for optimization. To eliminate the impacts of dimensionless inconsistencies among various service indicators, it is necessary to normalize the results for biodiversity, carbon sequestration, air purification, and climate regulation. After standardizing these results, the spatial distribution of comprehensive ecosystem services to be improved can be obtained (Figure 6).
The lower the integrated ecosystem service index, the higher the value of its optimization in promoting the ecosystem service value of the whole region. By examining this spatial distribution, local areas that should be prioritized for improvement can be intuitively judged. However, the fragmented green landscape ecology cannot be optimized for ecosystem service management. The spatial regionalization of ecosystem services facilitates the implementation of precise regulation and control of green space development by relevant government departments. Based on a grid scale of 1 km, we created 913 grid spaces. The integrated ecosystem service index of the corresponding grid was calculated, and the study area was divided into areas proposed for different degrees of improvement based on the REDCAP method. The average value of the integrated ecosystem services index of each grid was counted as the input data by zoning. The spatial weight matrix was generated by the distance-based K-nearest neighbor matrix method. The clustering of continuous and uniform blocks was identified using the REDCAP method. The specific process is shown in Figure 7. We selected the in-group squared error sum to determine the optimal number of clusters and used the Factoextra package in R for calculation. The inflection point diagram in Figure 8 shows that when the cluster exceeded 12, the variance in the clusters did not significantly decrease. Therefore, the optimal number of clusters was 12.
After the regionalization of the 913 ecological grid spaces, 12 types of clusters were obtained, and 5 types of ecosystem service zones were determined by reclassification according to the statistical values of each homogeneous region (see Table 3). Figure 9 and Figure 10 show the results of the homogeneous regions as determined by REDCAP.
Cluster 1 (Zone space 1) covers most areas of Weiyang and Baqiao districts. The water system in the study area is mainly distributed in this cluster, including one east–west (Wei river) and two north–south (Chan and Ba rivers) large water bodies. The pace of green space construction in this region has accelerated in recent years. The richness of green space species diversity and the ecosystem service level of the road green belt needs to be improved. Owing to natural and geographic factors, such as wind direction, air quality is relatively poor in the southern part of the Weibei Tableland and in the western part of the Bailu Plain.
Cluster 2 (Zone space 2) is in the highly urbanized Beilin, Yanta, Xincheng, and Lianhu districts. There is a large degree of fragmentation of green space, with many parks, university and community green spaces, and green belts in the region. Because of the consideration given to the ecological environment during urban construction, the overall ecosystem service level is relatively high.
Clusters 3, 4, 6, 7, 8, and 12 (Zone space 3) in the study area are locations where green resources are not distributed or where the relative equity index has been reached. Cluster 5 (Zone space 4) is a mountainous region, which also has a high level of ecosystem services. Clusters 9, 10, and 11 (Zone space 5) have relatively high farmland distribution, a low urbanization rate, little vegetation providing ecological benefits, and a low ecosystem service index.

4. Discussion

4.1. Explanation of the Study Perspective

In recent years, the rate of urbanization has been rapidly increasing worldwide. The pace of urban construction has accelerated in Xi’an City and the national central cities in China, and it is imperative to alleviate the negative impact of urbanization on the ecosystem. The results of this study show a diversity index range of 0.694~1.725, urban green space PM2.5 reductions in the range of 0.0058–0.0145 g/m3, and a maximum urban green space carbon storage value of 12.8 t/hm2. The spatial distribution of individual ecosystem services varies greatly. These results are consistent with the conclusions of previous studies [13,15]. Based on the equity results, partitioning revealed 12 clusters with distinct characteristics and 5 types of ecosystem service zones. Different types of ecosystem service zones have distinct characteristics, which is a major difference between this study and others. As one of the basic conditions to ensure the sustainable development of the city, the spatial form of the urban green space system should gradually move from decentralization to connection. Only by further integrating green spaces with urban spaces can the green space system exert its ecological benefits.
With the continuous development of urban areas, an increasing variety of trees has been introduced into parks. This includes some tall broad-leaved tree species, which block sunlight from reaching the neighboring lower plants. This shading leads to poor growth of pine and other low-growing trees. The park green spaces are an important part of urban green spaces, so the health of plants in parks should be considered [41]. Planners should optimize plant layout, provide good growth conditions for plants, and improve the level of urban green space systems. However, for specific locations, such as the area near the railway station and some communities with fewer green resources, trees with higher carbon sequestration potential (such as sycamore and Golden rain tree) should be planted. The local ecosystem service level should be improved by increasing community green spaces.
According to the field survey data, Oleaceae is a broad-leaved evergreen tree that is widely planted in the study area. It has strong adaptability and remains green throughout the year. It provides shade in summer, has strong cold resistance, can purify air, and blocks dust. A disadvantage is the large, viscous, dark fruit it produces. When the tree sheds its fruit, roads are often stained and mottled with black, and pedestrians are reluctant to walk under the trees. When planning future urban green space systems, suitable tree species should be chosen according to local conditions [42]. To improve air quality, planners could plant more plant species with higher leaf area indexes and consider adjusting the arrangement of buildings and green plants according to wind direction factors. Xi’an City is in the warm deciduous broad-leaved forest belt. On the premise that native tree species are the primary species present, the numbers of exotic tree species (such as those with a strong resistance to adversity and high ornamental value) and evergreen broad-leaved tree species should be appropriately increased. Spatial optimization of urban green space ecosystem services is an effective way to maximize the ecological benefits of urban green spaces. System planning should include the consideration of local conditions. Moreover, a deeper coupling mechanism between urbanization and the environment remains to be explored.

4.2. Method Comparison

Optimization based on the goal of ecosystem service clusters can incorporate the functional attributes of ecological land to the maximum extent and can quantify the proportions of different ecosystem service spaces. This helps to form a relationship between the green space system and ecological functions in deep systems. As a layered, aggregated approach, the REDCAP method generates a hierarchy based on a region (the entire data set) that continues up to a specified maximum number of subregions. It considers the spatial relation between the geometric figures in the form of spatial weights. Compared with traditional methods such as K-means clustering, hierarchical methods are particularly suitable for such applications because ecological and geographical entities are arranged hierarchically [43]. Although we identified statistical optimizations with regard to cluster size, REDCAP suggests no assumptions about the appropriate analysis and display scale. Instead, it helps explore the regionalization pattern, as users can easily select and display any number of desired clusters, illustrate how the regional pattern changes with classification details, thereby allowing the examination of cluster boundaries. This is valuable for understanding the similarities between spatial units and regions. Spatial information is presented over a wider area, allowing users to examine changes in the characteristics of individual units. In contrast to traditional K-means clustering, the hierarchical nature of REDCAP provides a more flexible platform for exploring the relative relationships between regions. We advocate that, where appropriate, more consideration should be given to spatial continuity as a method of diminishing regionalization constraints.

4.3. Limitations of This Study

Different vegetation types contribute differently to human health. In this study, only trees were considered as the main source of ecosystem services. Information on shrubs and herbs was not collected. Future studies should fully consider the urban green space systems to compile more complete data. Hyperspectral remote sensing and LIDAR technology could also be used to improve the information collection of green space tree species.
Based on a comprehensive consideration of the characteristics of the study area, and in view of the current situation of rapid urbanization, this study provides a reference for the future planning of urban ecosystem services. However, if there is a need for a more comprehensive evaluation of urban green space systems, the results of the current study will need to be augmented. For example, various trees have properties that facilitate particulate capture and noise reduction [44]. Furthermore, ecological function, disaster refuge, and disaster reduction systems could also be considered in green space planning [45].
In this study, the calculation of the per capita index of green space equity evaluation is based on district-level administrative units. In the future, subdistrict-level data should be considered to increase the level of regional differentiation.

5. Conclusions

This study used satellite remote sensing and field sampling data to map ecosystem services of the green space system in the main urban area of Xi’an City. We evaluated and analyzed the equity of ecosystem services of the green space system in the study area. At the urban level, green space resources are unevenly distributed, and the spatial distribution of ecosystem services in different regions is generally inefficient, with obvious inequity.
Based upon the results of the evaluation, we propose a new strategy for the regionalization and management of some ecosystem services. The REDCAP algorithm was used in combination with the number structure and spatial distribution of regionalization for creating a comprehensive index of ecosystem services in the study area. We developed 913 grid spaces, 12 partitions, and 5 zones to differentiate distinct levels of ecosystem services. The results of this study can help optimize green space planning guidance for the improvement of the urban ecological environment, to further meet the demands of residents of the ecological environment, and to promote the harmonious development of humans and the environment.

Author Contributions

Conceptualization, H.D. and J.L.; methodology, H.D.; software, H.D. and J.L.; validation, H.D.; formal analysis, H.D.; investigation, H.D.; resources, Y.Z.; data curation, Y.Z.; writing—original draft preparation, H.D.; writing—review and editing, J.L. and Z.Z.; visualization, J.L. and Z.Z.; supervision, J.L. and Z.Z.; project administration, J.L. and Z.Z.; funding acquisition, J.L. and Z.Z. All authors have read and agreed to the published version of the manuscript.

Funding

This study was jointly supported by the National Natural Science Foundation of China (Grant No. 42071285, 41771576) and the Fundamental Research Funds for the Central Universities, Shaanxi Normal University (GK201901009).

Data Availability Statement

The employed remote sensing data and statistical data are openly available from the corresponding website. Survey data and the processed data are available upon request.

Conflicts of Interest

The authors declare no conflict of interest.

References

  1. Holdren, J.P.; Ehrlich, P.R. Human population and the global environment. Am. Sci. 1974, 62, 282–292. [Google Scholar] [PubMed]
  2. Millennium Ecosystem Assessment. Ecosystems and Human Well-Being: Policy Responses; Findings of the Responses Working Group; Island Press: Washington, DC, USA, 2005. [Google Scholar]
  3. Kumar, P. The Economics of Ecosystems and Biodiversity: Ecological and Economic Foundations; Earthscan: London, UK, 2010. [Google Scholar]
  4. Costanza, R.; d’Arge, R.; de Groot, R.; Farber, S.; Grasso, M.; Hannon, B.; Limburg, K.; Naeem, S.; O’Neill, R.V.; Paruelo, J.; et al. The value of the world’s ecosystem services and natural capital. Nature 1997, 387, 253–260. [Google Scholar] [CrossRef]
  5. Estoque, R.C.; Murayama, Y.; Myint, S.W. Effects of landscape composition and pattern on land surface temperature: An urban heat island study in the megacities of Southeast Asia. Sci. Total. Environ. 2016, 577, 349–359. [Google Scholar] [CrossRef] [PubMed]
  6. Mirzaei, P.A. Recent challenges in modeling of urban heat island. Sustain. Cities Soc. 2015, 19, 200–206. [Google Scholar] [CrossRef] [Green Version]
  7. Liddicoat, C.; Bi, P.; Waycott, M.; Glover, J.; Lowe, A.J.; Weinstein, P. Landscape biodiversity correlates with respiratory health in Australia. J. Environ. Manag. 2018, 206, 113–122. [Google Scholar] [CrossRef] [PubMed]
  8. Bolund, P.; Hunhammar, S. Ecosystem services in urban areas. Ecol. Econ. 1999, 29, 293–301. [Google Scholar] [CrossRef]
  9. Jones, L.; Vieno, M.; Fitch, A.; Carnell, E.; Steadman, C.; Cryle, P.; Holland, M.; Nemitz, E.; Morton, D.; Hall, J.; et al. Urban natural capital accounts: Developing a novel approach to quantify air pollution removal by vegetation. J. Environ. Econ. Policy 2019, 8, 413–428. [Google Scholar] [CrossRef] [Green Version]
  10. Tzoulas, K.; Korpela, K.; Venn, S.; Yli-Pelkonen, V.; Kaźmierczak, A.; Niemela, J.; James, P. Promoting ecosystem and human health in urban areas using Green Infrastructure: A literature review. Landsc. Urban Plan. 2007, 81, 167–178. [Google Scholar] [CrossRef] [Green Version]
  11. Felix, K.; Barbara, D.; Barbara, W.; Yvonne, W.; Matthias, B. GIS-assisted mapping of landscape suitability for nearby recreation. Landsc. Urban Plan. 2012, 105, 385–399. [Google Scholar] [CrossRef]
  12. Liu, S.; Zhang, X.; Feng, Y.; Xie, H.; Jiang, L.; Lei, Z. Spatiotemporal Dynamics of Urban Green Space Influenced by Rapid Urbanization and Land Use Policies in Shanghai. Forests 2021, 12, 476. [Google Scholar] [CrossRef]
  13. Han, Y.; Zhou, Z. Evaluation on ecosystem services in haze absorption by urban green land and its spatial pattern analysis in Xi’an. Geogr. Res. 2015, 34, 1247–1258. (In Chinese) [Google Scholar]
  14. Zhang, Y.; Jing Li, J.; Zhou, Z. Exploring Expedient Protected Area for Ecosystem Services: Decision-Making Method with a New Algorithm. Sustainability 2019, 11, 5599. [Google Scholar] [CrossRef] [Green Version]
  15. Hu, Z.; Zhou, Z. Ecosystem services evaluation and its spatial pattern analysis of urban green land in Xi’an City. Arid Land Geogr. 2013, 36, 553–561. (In Chinese) [Google Scholar]
  16. Zhao, X.; Wang, J.; Su, J.; Sun, W. Ecosystem service value evaluation method in a complex ecological environment: A case study of Gansu Province, China. PLoS ONE 2021, 16, e0240272. [Google Scholar] [CrossRef]
  17. Xu, L.; You, H.; Li, D.; Yu, K. Urban green spaces, their spatial pattern, and ecosystem service value: The case of Beijing. Habitat Int. 2016, 56, 84–95. [Google Scholar] [CrossRef]
  18. Lorien, N.; Michael, J.M.; Cynthia, G.; Stephen, R.J.S.; Lu, Y. Who has access to urban vegetation? A spatial analysis of distributional green equity in 10 US cities. Landsc. Urban Plan. 2019, 181, 51–79. [Google Scholar] [CrossRef]
  19. Rebecca, L.R.; Natalie, M.G. Green justice in the city: A new agenda for urban green space research in Europe. Urban For. Urban Green. 2016, 19, 123–127. [Google Scholar] [CrossRef]
  20. Honor, B.; Susan, H.; Léa, F.; Anna, H.; Daniela, F. Associations between Green Space and Health in English Cities: An Ecological, Cross-Sectional Study. PLoS ONE 2015, 10, e0125450. [Google Scholar] [CrossRef]
  21. Konow, J. Which Is the Fairest One of All? A Positive Analysis of Justice Theories. J. Econ. Lit. 2003, 41, 1188–1239. [Google Scholar] [CrossRef] [Green Version]
  22. Li, C.; Zhao, J. Investigating the Spatiotemporally Varying Correlation between Urban Spatial Patterns and Ecosystem Services: A Case Study of Nansihu Lake Basin, China. Int. J. Geo Inf. 2019, 8, 346. [Google Scholar] [CrossRef] [Green Version]
  23. Yang, G.; Zhao, Y.; Xing, H.; Fu, Y.; Liu, G.; Kang, X.; Mai, X. Understanding the changes in spatial fairness of urban greenery using time-series remote sensing images: A case study of Guangdong-Hong Kong-Macao Greater Bay. Sci. Total Environ. 2020, 715, 136763. [Google Scholar] [CrossRef]
  24. Chang, J.; Qu, Z.; Xu, R.; Pan, K.; Xu, B.; Min, Y.; Ren, Y.; Yang, G.; Ge, Y. Assessing the ecosystem services provided by urban green spaces along urban center-edge gradients. Sci. Rep. 2017, 7, 11226. [Google Scholar] [CrossRef] [Green Version]
  25. Kareiva, P.; Watts, S.; McDonald, R.; Boucher, T. Domesticated nature: Shaping landscapes and ecosystems for human welfare. Science 2007, 316, 1866–1869. [Google Scholar] [CrossRef] [PubMed] [Green Version]
  26. Wang, H.; Gao, N.; Wang, Z.; Sha, W.; Wu, J. Urban ecological management division based on ecosystem services: A case study of Shenzhen City. Acta Ecol. Sin. 2020, 40, 8504–8515. (In Chinese) [Google Scholar]
  27. Liu, Y.X.; Li, T.; Zhao, W.W.; Wang, S.; Fu, B.J. Landscape functional zoning at a county level based on ecosystem services bundle: Methods comparison and management indication. J. Environ. Manag. 2019, 249, 109315. [Google Scholar] [CrossRef] [PubMed]
  28. Guo, D. Regionalization with dynamically constrained agglomerative clustering and partitioning (REDCAP). Int. J. Geogr. Inf. Sci. 2008, 22, 801–823. [Google Scholar] [CrossRef]
  29. Fovell, R.G.; Fovell, M.Y.C. Climate zones of the conterminous United States defined using cluster analysis. J. Clim. 1993, 6, 2103–2135. [Google Scholar] [CrossRef] [Green Version]
  30. Handcock, R.N.; Csillag, F. Spatio-temporal analysis using a multiscale hierarchical ecoregionalization. Photogramm. Eng. Remote Sens. 2004, 70, 101–110. [Google Scholar] [CrossRef] [Green Version]
  31. Boluwade, A.; Madramootoo, C.; Yari, A. Application of unsupervised clustering techniques for management zone delineation: Case study of variable rate irrigation in Southern Alberta, Canada. J. Irrig. Drain. Eng. 2016, 142, 05015007. [Google Scholar] [CrossRef]
  32. Chen, M. Xingseapp: Meet the Plants of the World. Computer Software Program Produced by the Authors at the Hangzhou Glority Software Co., Ltd., China. 2019. Available online: http://www.xingseapp.com (accessed on 16 January 2021).
  33. Ma, M.; Wang, D.; Liu, Y. Spatial Distribution of Carbon in Natural Pinus tabulaeformis Forest Ecosystem at Huoditang Forest Region in the Qinling Mountains. J. Southwest Univ. Nat. Sci. Ed. 2009, 31, 114–118. [Google Scholar]
  34. Nowak, D.J.; Hirabayashi, S.; Bodine, A.; Hoehn, R. Modeled PM2.5 removal by trees in ten U.S. cities and associated health effects. Environ. Pollut. 2013, 178, 395–402. [Google Scholar] [CrossRef]
  35. Sharp, R.; Chaplin-Kramer, R.; Wood, S.; Guerry, A.; Tallis, H.; Ricketts, T. InVEST 3.3.2 User’s Guide; The Natural Capital Project, Stanford University: Stanford, CA, USA; University of Minnesota: Minneapolis, MN, USA; The Nature Conservancy: Arlington, VA, USA; World Wildlife Fund: Gland, Switzerland, 2016. [Google Scholar]
  36. Yu, X.; Guo, X.; Wu, Z. Land Surface Temperature Retrieval from Landsat 8 TIRS—Comparison between Radiative Transfer Equation-Based Method, Split Window Algorithm and Single Channel Method. Remote Sens. 2014, 6, 9829–9852. [Google Scholar] [CrossRef] [Green Version]
  37. Shannon, C.E. The mathematical theory of communication. 1963. M.D. Comput. Comput. Med. Pract. 1997, 14, 306–317. [Google Scholar] [PubMed]
  38. Paruelo, J.M.; Epstein, H.E.; Lauenroth, W.K.; Burke, I.C. ANPP estimates from NDVI for the central grassland region of the United States. Ecology 1997, 78, 953–958. [Google Scholar] [CrossRef]
  39. Haggett, P. Location Analysis in Human Geography; Edward Arnold Ltd.: London, UK, 1965; pp. 33–40. [Google Scholar]
  40. Li, W.; Wang, C.; Zhang, Q. Differentiation of stand individuals impacts allometry and biomass allocation of Larix gmelinii trees. Acta Ecol. Sin. 2015, 35, 1679–1687. (In Chinese) [Google Scholar]
  41. Talal, M.L.; Santelmann, M.V. Vegetation management for urban park visitors: A mixed methods approach in Portland, Oregon. Ecol. Appl. 2020, 30, e02079. [Google Scholar] [CrossRef] [Green Version]
  42. Duncan JM, A.; Boruff, B.; Saunders, A.; Sun, Q.; Hurley, J.; Amati, M. Turning down the heat: An enhanced understanding of the relationship between urban vegetation and surface temperature at the city scale. Sci. Total. Environ. 2019, 656, 118–128. [Google Scholar] [CrossRef]
  43. McLaughlin, S.P. Are Floristic Areas Hierarchically Arranged? J. Biogeogr. 1992, 19, 21–32. [Google Scholar] [CrossRef]
  44. Salmond, J.A.; Tadaki, M.; Vardoulakis, S.; Arbuthnott, K.; Coutts, A.; Demuzere, M.; Dirks, K.N.; Heaviside, C.; Lim, S.; Macintyre, H. Health and climate related ecosystem services provided by street trees in the urban environment. Environ. Health 2016, 15, S36. [Google Scholar] [CrossRef] [Green Version]
  45. Tong, Y.; Lin, H. Patterns and its Disaster Shelter of Urban Green Space in Mining Cities: Empirical Evidence from Jiaozuo City, China. Appl. Mech. Mater. 2013, 2301, 2510–2514. [Google Scholar] [CrossRef]
Figure 1. Illustration of the framework.
Forests 12 00813 g001
Figure 2. Study area.
Forests 12 00813 g002
Figure 3. Evaluation of ecosystem services in urban green spaces. (a) Biodiversity map. (b) PM2.5 daily Reduction map. (c) Carbon sequestration map. (d) Heat island effect map.
Forests 12 00813 g003
Figure 4. Location quotient distribution pattern of green space area and ecosystem services. (a) Green area map. (b) Carbon sequestration map. (c) Biodiversity map. (d) Air purification map. (e) Climate regulation map.
Forests 12 00813 g004
Figure 5. Per capita green space area and ecosystem services in the administrative region of the main urban area of Xi’an City. (a) Green area. (b) Carbon sequestration. (c) Biodiversity. (d) Air purification. (e) Climate regulation.
Forests 12 00813 g005
Figure 6. Optimal cluster number selection.
Forests 12 00813 g006
Figure 7. Regionalization process diagram.
Forests 12 00813 g007
Figure 8. Comprehensive ecosystem service evaluation map.
Forests 12 00813 g008
Figure 9. Regionalized results.
Forests 12 00813 g009
Figure 10. Zoning group ecosystem service cluster.
Forests 12 00813 g010
Table 1. Indexes and methods for estimating ecosystem service functions.
Evaluation TypeCalculation FormulaDescription
Biodiversity H = 0.096 NDVI + 0.131 T C 2 + 0.143 T C 3 + 1.673
R 2 = 0.637 , P < 0.01
H is the Shannon Wienner Index [37].
Air purification C = F × L A I × T × 1 R C is the amount of PM2.5 that can be removed per unit area in a day without rainfall.
Carbon sequestration C s t o r a g e = C s o i l + C a b o v e + C b e l o w + C d e a d × S Cstorage is the total carbon storage.
Climate regulation T S = a × 1 C D + b × 1 C D + C + D × T d D × T a C
C = ε τ ;   D = 1 τ 1 + 1 ε τ
a = 67.355351 ,   b = 0.458606
T S is the surface temperature.
Table 2. The classification standard of the location quotient value.
LevelLocation QuotientDescription
Low<0.77The regional per capita ecosystem service level is lower than the average level of the study area.
Medium0.77–1.14 (with)Basically equal to the average level of the study area.
High1.14 (without)–2.2The regional per capita ecosystem service level is higher than the average level of the study area.
Extreme>2.2The regional per capita ecological service level is twice as high as the average level of the study area.
Table 3. Statistics of homogeneous regions.
Ecosystem Services IndexClusters
123456789101112
Area361.4346.236.3429.2111.241010.7110.876.0263.1322.6335.017
Mean52.7945.500.72940.6800030.3318.220.60
Q1504500380000000
Median5447004100045000
Q3564900410004543510
STD7.4599.45404.4393.06100023.524.9828.210
Publisher’s Note: MDPI stays neutral with regard to jurisdictional claims in published maps and institutional affiliations.

