Abstract
Radial stem size changes, measured with automated dendrometers at intra-daily resolution, offer great potential to link environmental conditions with tree physiology at the seasonal scale. Such measurements need to be time-aligned, cleaned of outliers and shifts, gap-filled and analysed for reversible (water-related) and irreversible (growth-related) fractions to obtain physiologically meaningful data. Therefore, comprehensive tools are needed for reproducible data processing and analytics of dendrometer data. Here we present a transparent method, compiled in the R package treenetproc, to turn raw dendrometer data into clean, physiologically interpretable information, i.e., stem growth, tree water deficit, growth phenological phases, mean daily shrinkage and their respective timings. The removal of errors is facilitated by additional functions and supported with graphical visualizations. To ensure reproducible data handling, the processing parameters and induced changes to the raw data are documented in the output and, thus, are a step towards a standardized processing of automatically measured stem radius time series. We discuss examples, such as the seasonality of growth or the dependence of growth on atmospheric and soil drought. The presented growth and water-related physiological variables at high temporal resolution offer novel physiological insights into the seasonally varying responses of trees to changing environmental conditions.
1. Introduction
Tree water use and wood growth are closely coupled processes and jointly define a tree’s physiology on a daily to seasonal time scale. Underlying mechanisms linking the two processes thus need to be understood. To this end, robust data and consequently accurate and reproducible monitoring and processing methods, are essential. Radial stem data measured by automatic dendrometers provide information on the interface between radial stem growth and tree water relations, and can deliver highly resolved, long-term tree-specific monitoring data [1,2,3,4], complementary to temporally highly resolved sap flux data [5,6]. At present, dendrometer studies have captured daily shrinkage patterns [7,8] and developed sophisticated methods to isolate distinct phases of contraction, expansion and stem-radius increment [9]. Long time series have been deemed particularly valuable in capturing responses of wood formation and dehydration to large gradients of environmental conditions. These are essential for understanding seasonal tree growth and carbon allocation dynamics [10,11], which depend not only on current but also on historic environmental conditions several years back in time [12,13,14,15,16].
The ability to obtain seasonal dynamics of biologically meaningful proxies from subhourly stem radius data is a critical nexus for future tree physiological research and can bridge the gap between high resolution mechanistic models and long-term observational studies [10,17]. The tree’s seasonal dynamics of stem shrinkage patterns (often expressed as tree water deficit; [4,18,19]) in response to drought has allowed us to assess the lesser explored in situ hydraulic capacitance of the bark tissue for specific tree species [20,21] and model the water stress levels they experience [22,23]. Moreover, dendrometers, with careful consideration of their strengths and limitations (cf. [24,25]), could support analyses which assess the impact of intra-annual climatic variability on tree growth from wood formation studies [26,27]. Dendrometers have, therefore, the potential to scale labour-intensive and destructive wood sampling and analyses, and provide information on growth phenology and rates, at a much higher temporal resolution than the (bi-)weekly resolution achieved by taking wood samples [28]. Although extracting hydraulic dynamics, growth phenology and radial increment from dendrometer measurements are not without pitfalls (i.e., stem shrinkage preventing appropriate detection of growth start and end; [29]), they provide a promising and cost-effective method to derive such proxies at sub-daily resolutions. Yet, realizing this potential requires reproducible and user-friendly ways of data processing being able to separate water-related from growth-related dynamics.
Processing long-term raw dendrometer measurements to physiologically meaningful proxies can be challenging, mainly for two reasons (Figure 1). First, raw measurements often contain outliers, errors, shifts or jumps in the data due to adjustments of the device in the field, electronic failures or external mechanical disturbances. Therefore, data cleaning is often manually performed, time-consuming and not reproducible. Second, radial stem size changes comprise a reversible tree water-related and an irreversible growth-induced fraction, i.e., swelling and shrinking of the stem due to changing water potentials, and irreversible radial growth due to cell division and cell enlargement in the cambium [2,4,29]. These two processes need to be separated to obtain drivers of growth and tree water deficit (Figure 1). Although a handful of tools already exist to analyse seasonal, cyclic or daily patterns in dendrometer data, or to evaluate dendrometer data quality [30,31,32], they require cleaned or gap-filled data and, thus, do not offer the functionality to systematically and automatically clean data. Furthermore, they do not separate dendrometer data into water-related and growth-induced fractions with a focus on seasonal dynamics. In addition, methodological details for determining the start and end of the growing season while allowing for uncertainty analyses on the specified dates are missing. Finally, no existing tool provides a comprehensive range of standardized derived variables, or gives an integrated documentation of all induced changes to the raw data to elucidate critical data processing steps [33].
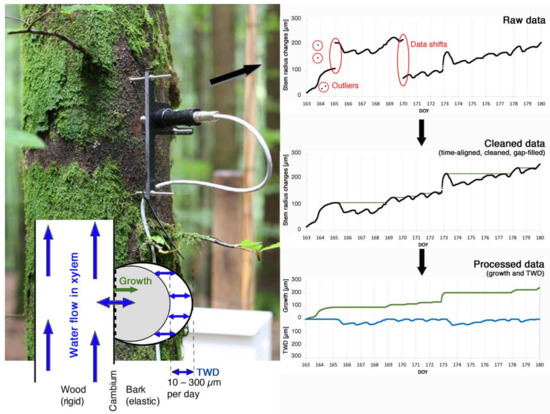
Figure 1.
Processing raw stem radius measurements to physiologically meaningful data of growth and tree water relations. The automated point dendrometer mounted on a tree stem measures highly resolved stem size changes at a micrometre resolution. Stem radius changes are the result of cell division and enlargement in the cambium (growth), and hydraulically-induced pressure changes leading to shrinkage and swelling of elastic stem tissues. Measured raw data needs to be time-aligned, cleaned, and gap filled before being separated into the irreversible growth and the reversible tree water deficit (TWD) induced fractions of stem size changes.
Here we present the functionality of the R package treenetproc, which provides a means to clean long-term (i.e., multiannual) time series of dendrometer data by time-aligning the dataset, detecting and removing outliers and correcting for erroneous shifts and jumps. Visualisation and clear documentation of the changes allow for checking the cleaned data and ensure reproducibility. In addition, the R package facilitates the manual and reportable removal of remaining errors. Furthermore, the cleaned dendrometer time series can be partitioned into growth and water-related components according to the zero growth (ZG) concept of Zweifel et al., [4], utilizable in seasonal analyses of tree-specific water and carbon related proxies. Note that the ZG concept assumes that growth begins when the previous maximum stem diameter is exceeded and ends when stem shrinkage occurs. Consequently, the ZG concept considers growth to occur during periods without stem shrinkage only, based on the theory that a turgor pressure threshold has to be reached in the cambium before cell division and cell enlargement are possible [22,34,35]. In addition, treenetproc provides a standardised and flexible calculation of critical phenological growth phases such as the beginning and end of stem growth within the growing season. It also calculates the timing and rate of change of different phases of stem shrinkage and expansion and provides a variety of ways to better contextualise dendrometer data to changing environmental conditions [4]. The presented method serves as a potential benchmark for extracting and analysing the seasonal variability of water use and growth obtained in situ from dendrometers. It is thus consistent with the necessary evolution from an annual to an intra-annual focus of tree-specific water and carbon-related responses to environmental change [11].
2. Data Processing Structure
To generate a standardized workflow for extracting relevant seasonal proxies from stem radius data, the data processing structure needs to be defined. The general workflow of treenetproc to extract relevant seasonal proxies from stem radius data is composed of three main steps including multiple functions (Figure 2). In step 1 (time alignment), raw dendrometer and, optionally, temperature data are aligned to user-defined, regular time steps. The output of this first processing step are data of the level one (L1; Table 1). Optionally, this step offers functions to plot and correct the L1 data.
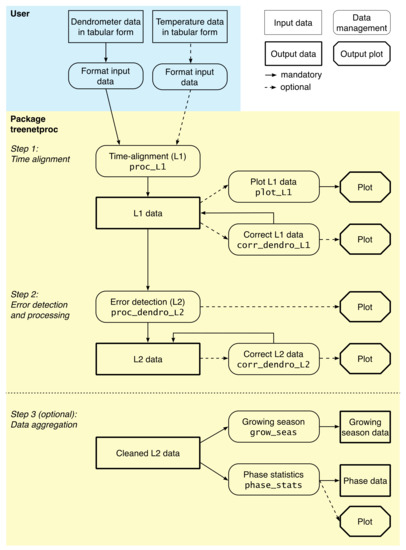
Figure 2.
Workflow of treenetproc. Functions of the package are shown in rounded rectangles, including a description of the functionality (first line) and the name of the function (second line). Outputs of the functions are shown as rectangles (data output) and octagons (graphical output). Solid arrows indicate the regular workflow, dashed arrows indicate the optional, user-induced workflow.

Table 1.
Output variables of functions of treenetproc.
The use of temperature data, in addition to stem radius data, is highly recommended since it increases the quality of the cleaning process by automatically adjusting the error detection in periods of low temperatures. Temperatures below zero degree Celsius can induce stem freezing, which leads to stem shrinkage patterns that are an order of magnitude larger than the typical shrinkage patterns within the growing season (Figure S1). Similarly, the thawing of the stem induces magnified stem expansion rates and may occur up to several degrees Celsius above zero depending on the rate of the temperature increase after a frost. These exceptionally large shrinkage and expansion patterns were found to be caused by the steep water potential gradients induced by ice in parts of the stem tissues, moving intracellular water in or out of the living cells [7,36,37]. To prevent the classification of these patterns as outliers, a user-defined temperature threshold (frost_thr) flags such periods (referred to as frost period).
In step 2 (error detection and processing), outliers and shifts in the L1 data are detected and removed or corrected, processing the data to level two (L2). Optionally, this step offers functions to visualise and manually correct the L2 data again. In the third step, the L2 data is analysed and several derived variables are calculated (Table 1). A detailed example in the Supplementary Information illustrates the different functionalities. Finally, in step 3 (data aggregation), relevant physiological proxies are extracted which allow the analysis of tree-specific seasonal water and growth dynamics (detailed below).
The two core functions of treenetproc (proc_L1 and proc_dendro_L2) are capable of processing a continuous data stream out of, for example, an SQL database or directly from a data logger. Other functions of the package require user-input or are applicable retrospectively only (Figure 1). In the following, all three steps presented in Figure 1 are addressed in more detail. For sample code, and a demonstration of an exemplary workflow, see also the vignette Introduction to treenetproc included in the R package (vignette(treenetproc)).
3. Data Requirements and Temporal Alignment
Clear and easily adoptable input data requirements are critical for the usability of a methodological framework. We thus chose a simple raw data format which can be uploaded in R, e.g., as csv-file, and needs to be formatted as a data frame in long (Table S1) or wide (Table S2) format to be used by the package. In addition, a column with timestamps (ts) in any standard date format is required (e.g., %Y-%m-%d %H:%M:%S). If the optional temperature data (in °C) is provided in the same file as the dendrometer data (in µm), the name of the temperature data series has to contain the string “temp” to be identified as a temperature time series (Table S2).
Key to all other processing steps is the proper time alignment of dendrometer (and temperature) data to a user-defined and regular time step performed with the function proc_L1 (Figure 2). The temporal resolution of the time-alignment is specified with the argument reso (in minutes, i.e., reso = 10 leads to a 10-min resolution). Noteworthy, the time-alignment uses a linear interpolation between the two closest measurement points in the raw dataset to obtain the values at the specified time resolution (Figure S2). The linear interpolation in this step is restricted to gaps smaller than three timestamps. Larger gaps are filled with NA values at the respective time intervals. Note that the next processing step (function proc_dendro_L2) includes a user-defined gap-filling parameter not linked to the functionality here.
4. Outliers, Error Detection and Processing
Outlier and error detection, and eventual processing of the dendrometer data, are done with the function proc_dendro_L2. Yet, outlier removal in time series has to be performed with care, which has already received much attention in the literature (e.g., [38]). Outlier and error detection can be based on the frequency distribution of first order differences of the L1 data (diff; [39]; Figure S3). Since the frequency distribution of diff is typically very narrow, i.e., most values of diff are close to zero, all values within the 30% and 70% percentile are removed before calculating thresholds for data outliers and shifts. This step increases the quality of the automatically adjusted thresholds for different datasets from various sites and tree species. The thresholds for outlier (tol_out) and jump (tol_jump) detection are then calculated based on the first and fourth quartile of diff plus a tolerance value. The tolerance value is defined as the median of the absolute deviations (mad) multiplied by the user-defined parameters tol_out and tol_jump, respectively (Table 2, Figure 3). Cleaned data series (L2 data) can be gap-filled according to the custom-set parameter interpol (in minutes) which defines the maximum gap size that is linearly interpolated (Figure S2). The cleaned and gap-filled data are used to compute time series of tree water deficit (twd) and annually accumulated growth (gro_yr), which are reported in the output data frame (Table S3).
Table 2.
Customised parameters of the function proc_dendro_L2. The first two parameters (in bold) are most important to optimise error detection.
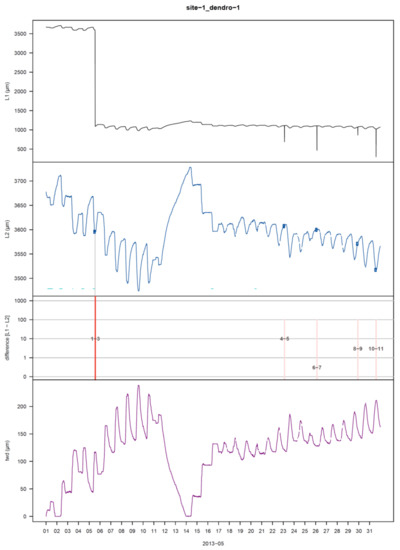
Figure 3.
Visualisation plot of the function proc_dendro_L2 with argument plot_period = “monthly”. The first panel shows the stem radius changes of time-aligned dendrometer data (L1). The second panel shows cleaned L2 data. Horizontal cyan lines at the bottom of the panel indicate potential frost periods. Blue circles indicate interpolated data points. The third panel shows the correction-induced differences between L1 and L2 data (red) on a logarithmic scale. Erroneous, deleted values are shown with pink lines without a relevant scale (set to 100). Every change to the data gets an ID and facilitates the functions for manual corrections. The last panel shows the tree-water deficit (twd).
The quality of the automated data processing depends on an appropriate set of parameters, and the provided default values do not in any case, lead to the best results. Evaluating the output is thus key to optimize the processing accuracy. The processed L2 data are systematically visualised in user-defined diagrams (Figure 3) to identify remaining errors or erroneously changed data. For example, a too high value of tol_jump will not correct all jumps or shifts in the dataset. In contrast, a too low value may, in the worst case, lead to an attenuation of the shape of the stem size curve over time. The plots of the processed results are designed to visually recognise such discrepancies and offer user-defined display options. The time period of the plots displayed can be adjusted (plot_period: monthly, yearly, full, Figure 3) as well as restrictions to include only periods in the plots in which raw data have been changed during processing (plot_show: diff).
For remaining errors, treenetproc offers functions to overrule introduced changes or force changes that were not automatically made. Generally, it is advisable to remove periods of obvious erroneous data after time-alignment with the function corr_dendro_L1 (Figure 2). However, it can also be performed as a processing step later with the function corr_dendro_L2. This function additionally allows for reversing accidentally induced changes with the argument reverse by using the ID number apparent in the plot with the user-defined resolution plot_period = monthly (Figure 3). Finally, an undetected shift in the time series can be forced to be corrected with the argument force and a date within five days prior to the shift to be corrected (Figure S4). The length of this period is adjustable with the argument n_days.
During the data cleaning process, all utilized parameter settings and user decisions are systematically documented. All changes to the data are flagged at the respective timestamps with different labels. The number after the flag label specifies in which iteration of the cleaning process the changes occurred (Table S4). Additionally, all parameters of the function proc_dendro_L2 and the R package version number are printed at the bottom of the visualisations. treenetproc thereby ensures the reproducibility of the data processing, a fundamental quality criterion of any method in computational science [33].
5. Data Aggregation and Examples of Relevant Seasonal Tree Physiological Proxies
The R package treenetproc offers novel possibilities in the processing of relevant, tree physiological proxies on a seasonal time scale. As mentioned above, the determination of the beginning and end of the growing season is a key parameter and has had limited reproducibility in different works (cf. [40]), but a proximally comparable method presented here has already been applied successfully [41,42]. With treenetproc, we attempt to provide a more standardized and flexible practise for extracting such parameters. The function grow_seas returns the day of year of growth onset and growth cessation (as exemplified in Figure 4) from L2 dendrometer data. To clarify, growth onset (gro_start) can be defined as the day of year at which the maximum stem radius value of the past year is crossed, based on the ZG concept [4]. Growth cessation (gro_end) is considered as the day of year at which the maximum value is reached. To increase the comparability of these variables between studies, and reduce the impact of erratic data points in the asymptotic phase of the annual growth curve, a user-defined adjustable tolerance value (tol_seas) is used to adjust gro_start and gro_end. By default, tol_seas is set to 5% defining gro_start as the day of the year at which 5% of yearly growth is surpassed. Likewise, gro_end represents the day of year at which 95% of yearly growth is reached. Determination of the beginning and end of the growth period may be inaccurate if the annual growth rate is small and water-induced shrinkage and swelling are large in proportion (see [24,25]). In such cases it may be advisable to adjust the threshold value tol_seas. Values of gro_start and gro_end start from the second year only, since their calculation depends on the previous years’ data. Thus, multiple years of dendrometer measurements (i.e., Figure 5a) allow establishment of seasonal phenological dynamics in a consistent way and assess the uncertainty and interannual variability in growth start and cessation at the tree specific level (i.e., relatively late start of growth in 2012 for the Fagus sylvatica tree in Figure 5c).
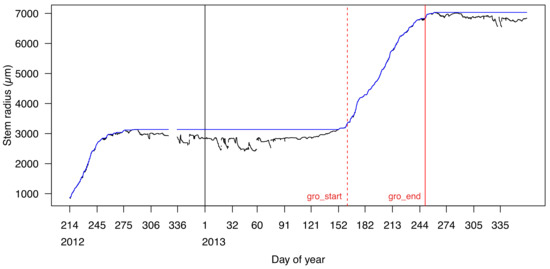
Figure 4.
Calculation of start (gro_start, red dashed line) and cessation (gro_end, red solid line) of the growing season by the function grow_seas with a 5% uncertainty tolerance (tol_seas = 0.05).
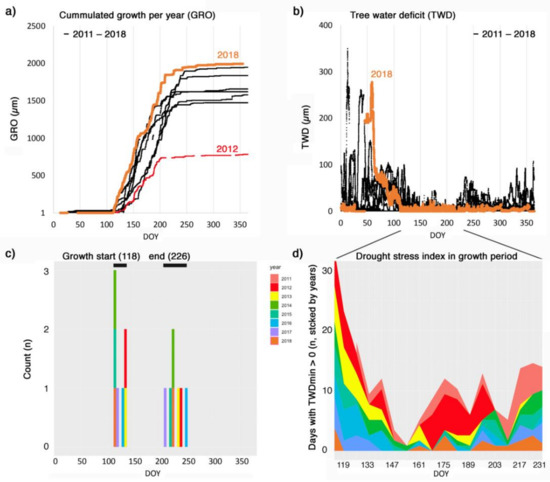
Figure 5.
Example of stem radius data of a beech tree over eight years at a 10 min time resolution (TreeNet Lausanne, Switzerland). (a) Accumulated growth per year (GRO). The year with the summer drought (2018) and the year with the lowest growth (2012) are coloured. (b) Tree water deficit (TWD). (c) Timing of growth start and growth end (median in brackets). Years are colour coded. (d) Drought stress index derived from TWD for the growth period. The index counts days with a minimum TWD > 0 per week, i.e., days where the loss of water was larger than the uptake. Note, these diagrams are not direct outputs of treenetproc and are solely intended as a possible representation of results relevant for users.
Analysing interannual differences in seasonal dynamics of both growth (GRO) and tree water deficit (TWD) dynamics, provided by proc_dendro_L2, can generate insights into both climatic regulation of growth rates and water stress. As an example, interannual growth patterns can be recalculated to weekly growth rates (GR, determined from GRO data obtained from treenetproc), comparable to the classical xylogenesis sampling frequency [27], but including new cells in wood and bark. As such, one can analyse the within year growth dynamics (i.e., Figure 6a) and relate this to weekly averaged climatic conditions (i.e., Figure 6b). The example of an individual beech tree (F. sylvatica) in Figure 6 is an illustration of how to utilize proc_dendro_L2 output. The example shows reduced growth activity during periods of exceptionally high vapour pressure deficit (VPD), indicating the potential importance of atmospheric drought in addition to the known effects of dry soil [4,10]. Further, information on weekly growth rates could be incorporated into intra-annual climate-growth relationships, as currently performed on wood anatomical features [43]. For example, when isolating the daily minimum TWD (TWDmin), mainly associated with the lack of stem rehydration [20,22,23], we see that although 2015 was exposed to more negative daily soil water potentials (SWP), this did not lead to a general, substantial increase in TWDmin, hinting at a decoupling of soil drought from TWDmin in this case. Such seasonal patterns in GRO and TWDmin, when performed with ample replication, can be obtained with treenetproc and thus open up the potential for novel insights into the relationship between drought stress and growth rates of mature forest trees.
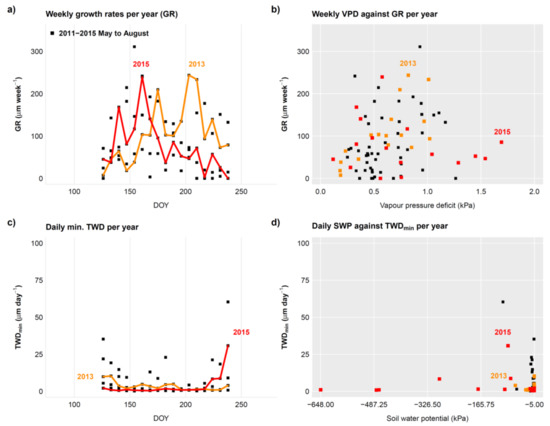
Figure 6.
Example of seasonal tree physiological proxies extracted from stem radius data of a beech tree over five years at a 10 min resolution (as presented in Figure 5). (a) Weekly growth rates per year (GR) when isolating the main growing season (May-August). The year with the drought summer (2015) and the year with the highest growth rates in summer (2013) are coloured. (b) Response of GR (from a) to the mean weekly vapour pressure deficit (VPD). (c) Daily minimum tree water deficit (TWDmin) with the same years highlighted with colour as in a. (d) Response of TWDmin to soil water potential with the same years highlighted with colour as in c. Note, these diagrams are not direct outputs of treenetproc and are solely intended as a possible representation of results relevant for users.
Finally, building upon the work presented in van der Maaten et al. ([31]; phase_def in the R package dendrometeR), we incorporated functions which allow for the detection of different shrinkage phases (useful to define the hydraulically active season [7]). The function phase_stats (Figure 2 and Figure S5) calculates shrinkage and expansion phases of intradaily resolved dendrometer data. The function returns local maxima and minima of the (L2) dendrometer data. Further variables quantifying the timing of the shrinkage and expansion phases are derived from these local maxima and minima, which depict changes in the timing of the phases depending on the season. Thus, future analyses of the timing of shrinkage and expansion phases may lead to new information about changing drivers for stem radius changes that are mainly determined by the transpiration response during the vegetation period and driven by temperature and other (unknown) factors during wintertime (deciduous trees without leaves). Furthermore, the commonly applied variable maximum daily shrinkage, referred to as mds here and in literature, can be extracted with phase_stats. The functionality and its underlying mathematical steps are explained in detail in Method S1.
6. Conclusions and Perspectives
Dendrometers are reliable and affordable tools to continuously measure seasonal stem radius change dynamics. treenetproc is an open-source R package that efficiently and transparently cleans, processes and visualises highly resolved dendrometer time series and provides user-friendly access to a range of benchmarked variables for intra-annual analyses of a tree’s water and growth dynamics. It ensures the reproducibility of data processing by documenting all user decisions and changes to the data. Overall, the functionality of treenetproc provides a step towards a standardised data processing method for dendrometer data, which was originally developed to process and analyse large live data-streams for dozens of trees at many different sites within the network TreeNet [44]. The processed data enables the user to address a wide range of novel, ecologically relevant questions about the timing of growth and their respective dependencies on (limited) water availability. The questions range from “when do trees grow?”, and “what are species-specific differences?” to “what is the impact of drought on tree water relations and growth performance?” (Figure 5 and Figure 6).
Future versions of the package are envisioned to include additional functions depending upon suggestions from the research community. With regards to data cleaning, interactive manual cleaning procedures are planned for incorporation [6,45]. Moreover, additional functions are under construction to model the timing of the hydraulically active season including the quantification of the drought stress based on the output of the function phase_stats.
7. Availability of Treenetproc
The R package treenetproc and all source code is available on GitHub [46]. In R software (R Core Team, [47]), the package can be installed with the following commands:
# install.packages(“devtools”)
library(devtools)
devtools::install_github(“treenet/treenetproc”)
treenetproc requires the package dplyr, which is automatically installed along with treenetproc. Additional documentation of the package or the functions can be accessed from the R console using the command ?treenetproc or ?function_name, respectively. Furthermore, an exemplary workflow, as well as sample code, can be found in the vignette Introduction to treenetproc that can be installed along with the package using the command:
devtools::install_github(“treenet/treenetproc”, build_vignettes = TRUE).
8. Citation
To cite the package and all dependencies, please use the output of the following command:
citation(“treenetproc”)
Supplementary Materials
The following are available online at https://www.mdpi.com/article/10.3390/f12060765/s1, Figure S1: Frost shrinkage, Figure S2: Time-alignment of raw data, Figure S3: Density distribution for detecting outliers, Figure S4: Data corrections with the function corr-dendro_L2, Figure S5: Calculation of shrinkage and expansion phases with phase_stats, Table S1: Input data format (long), Table S2: Input data format (wide), Table S3: Output data format of the function proc-dendro_L2, Table S4: List of flags, Method S1: The function phase_stats.
Author Contributions
Initiated the concept of the R package treenetproc and developed the main functions. M.H. and R.Z.; mainly wrote the manuscript, and all authors contributed to the manuscript drafts. S.K., R.L.P. and R.Z. further developed the functionality. S.K., M.H. and M.W. mainly wrote the R code. R.Z. and S.K. raised the funding. All authors have read and agreed to the published version of the manuscript.
Funding
Federal Office for the Environment (FOEN) (09.0064.PJ/R301-0223, 09.0064.PJ/Q351-1719, 00.0365.PZ I 0427-0562); Swiss Federal Institute for Forest, Snow and Landscape Research WSL (201410N1069 to M.H., 201901N1709 to M.W.); Swiss National Science Foundation (SNSF) (P2BSP3_184475 to R.L.P.).
Institutional Review Board Statement
Not applicable.
Informed Consent Statement
Not applicable.
Data Availability Statement
All data used in the paper is accessible as sample data within the R package treenetproc, which is available on GitHub [44].
Acknowledgments
We thank Alan Haynes for support in the early stages of the scripts, Reinhard Bischoff for technical support and Thomas Kramer and Markus Reinhardt for their IT support.
Conflicts of Interest
The authors declare no conflict of interest.
References
- DesLauriers, A.; Anfodillo, T.; Rossi, S.; Carraro, V. Using simple causal modeling to understand how water and temperature affect daily stem radial variation in trees. Tree Physiol. 2007, 27, 1125–1136. [Google Scholar] [CrossRef] [PubMed]
- De Swaef, T.; De Schepper, V.; Vandegehuchte, M.W.; Steppe, K. Stem diameter variations as a versatile research tool in ecophysiology. Tree Physiol. 2015, 35, 1047–1061. [Google Scholar] [CrossRef]
- Steppe, K.; Sterck, F.; Deslauriers, A. Diel growth dynamics in tree stems: Linking anatomy and ecophysiology. Trends Plant Sci. 2015, 20, 335–343. [Google Scholar] [CrossRef] [PubMed]
- Zweifel, R.; Haeni, M.; Buchmann, N.; Eugster, W. Are trees able to grow in periods of stem shrinkage? New Phytol. 2016, 211, 839–849. [Google Scholar] [CrossRef]
- Peters, R.L.; Fonti, P.; Frank, D.C.; Poyatos, R.; Pappas, C.; Kahmen, A.; Carraro, V.; Prendin, A.L.; Schneider, L.; Baltzer, J.L.; et al. Quantification of uncertainties in conifer sap flow measured with the thermal dissipation method. New Phytol. 2018, 219, 1283–1299. [Google Scholar] [CrossRef] [PubMed]
- Speckman, H.; Ewers, B.E.; Beverly, D.P. AquaFlux: Rapid, transparent and replicable analyses of plant transpiration. Methods Ecol. Evol. 2020, 11, 44–50. [Google Scholar] [CrossRef]
- King, G.; Fonti, P.; Nievergelt, D.; Büntgen, U.; Frank, D. Climatic drivers of hourly to yearly tree radius variations along a 6 °C natural warming gradient. Agric. For. Meteorol. 2013, 168, 36–46. [Google Scholar] [CrossRef]
- Van Der Maaten, E.; Pape, J.; Van Der Maaten-Theunissen, M.; Scharnweber, T.; Smiljanić, M.; Cruz-García, R.; Wilmking, M. Distinct growth phenology but similar daily stem dynamics in three co-occurring broadleaved tree species. Tree Physiol. 2018, 38, 1820–1828. [Google Scholar] [CrossRef]
- Van Der Maaten-Theunissen, M.; Bümmerstede, H.; Iwanowski, J.; Scharnweber, T.; Wilmking, M.; Van Der Maaten, E. Drought sensitivity of beech on a shallow chalk soil in northeastern Germany—A comparative study. For. Ecosyst. 2016, 3, 24. [Google Scholar] [CrossRef]
- Peters, R.L.; Steppe, K.; Cuny, H.E.; De Pauw, D.J.; Frank, D.C.; Schaub, M.; Rathgeber, C.B.; Cabon, A.; Fonti, P. Turgor—A limiting factor for radial growth in mature conifers along an elevational gradient. New Phytol. 2021, 229, 213–229. [Google Scholar] [CrossRef]
- Babst, F.; Friend, A.D.; Karamihalaki, M.; Wei, J.; von Arx, G.; Papale, D.; Peters, R.L. Modeling Ambitions Outpace Observations of Forest Carbon Allocation. Trends Plant Sci. 2021, 26, 210–219. [Google Scholar] [CrossRef]
- Anderegg, W.R.L.; Schwalm, C.; Biondi, F.; Camarero, J.J.; Koch, G.; Litvak, M.; Ogle, K.; Shaw, J.D.; Shevliakova, E.; Williams, A.P.; et al. Pervasive drought legacies in forest ecosystems and their implications for carbon cycle models. Science 2015, 349, 528–532. [Google Scholar] [CrossRef]
- Ogle, K.; Barber, J.J.; Barron-Gafford, G.A.; Bentley, L.P.; Young, J.M.; Huxman, T.E.; Loik, M.E.; Tissue, D. Quantifying ecological memory in plant and ecosystem processes. Ecol. Lett. 2015, 18, 221–235. [Google Scholar] [CrossRef]
- Zweifel, R.; Sterck, F. A Conceptual Tree Model Explaining Legacy Effects on Stem Growth. Front. For. Glob. Chang. 2018, 1, 1–9. [Google Scholar] [CrossRef]
- Kannenberg, S.A.; Novick, K.A.; Alexander, M.R.; Maxwell, J.; Moore, D.J.P.; Phillips, R.P.; Anderegg, W.R.L. Linking drought legacy effects across scales: From leaves to tree rings to ecosystems. Glob. Chang. Biol. 2019, 25, 2978–2992. [Google Scholar] [CrossRef]
- Zweifel, R.; Etzold, S.; Sterck, F.; Gessler, A.; Anfodillo, T.; Mencuccini, M.; Von Arx, G.; Lazzarin, M.; Haeni, M.; Feichtinger, L.; et al. Determinants of legacy effects in pine trees—Implications from an irrigation-stop experiment. New Phytol. 2020, 227, 1081–1096. [Google Scholar] [CrossRef]
- Zweifel, R. Radial stem variations—A source of tree physiological information not fully exploited yet. Plant Cell Environ. 2016, 39, 231–232. [Google Scholar] [CrossRef]
- Hinckley, T.M.; Bruckerhoff, D.N. The effects of drought on water relations and stem shrinkage of Quercus alba. Can. J. Bot. 1975, 53, 62–72. [Google Scholar] [CrossRef]
- Ziaco, E.; Biondi, F. Stem Circadian Phenology of Four Pine Species in Naturally Contrasting Climates from Sky-Island Forests of the Western USA. Forests 2018, 9, 396. [Google Scholar] [CrossRef]
- Zweifel, R.; Zimmermann, L.; Newbery, D.M. Modeling tree water deficit from microclimate: An approach to quantifying drought stress. Tree Physiol. 2005, 25, 147–156. [Google Scholar] [CrossRef]
- Salomón, R.L.; Limousin, J.-M.; Ourcival, J.-M.; Rodríguez-Calcerrada, J.; Steppe, K. Stem hydraulic capacitance decreases with drought stress: Implications for modelling tree hydraulics in the Mediterranean oakQuercus ilex. Plant Cell Environ. 2017, 40, 1379–1391. [Google Scholar] [CrossRef]
- Steppe, K.; De Pauw, D.J.W.; LeMeur, R.; Vanrolleghem, P. A mathematical model linking tree sap flow dynamics to daily stem diameter fluctuations and radial stem growth. Tree Physiol. 2006, 26, 257–273. [Google Scholar] [CrossRef] [PubMed]
- Dietrich, L.; Zweifel, R.; Kahmen, A. Daily stem diameter variations can predict the canopy water status of mature temperate trees. Tree Physiol. 2018, 38, 941–952. [Google Scholar] [CrossRef] [PubMed]
- Mäkinen, H.; Seo, J.-W.; Nöjd, P.; Schmitt, U.; Jalkanen, R. Seasonal dynamics of wood formation: A comparison between pinning, microcoring and dendrometer measurements. Eur. J. For. Res. 2008, 127, 235–245. [Google Scholar] [CrossRef]
- Ziaco, E.; Biondi, F.; Rossi, S.; DesLauriers, A. Environmental drivers of cambial phenology in Great Basin bristlecone pine. Tree Physiol. 2016, 36, 818–831. [Google Scholar] [CrossRef]
- Cuny, H.E.; Rathgeber, C.B.K.; Frank, D.; Fonti, P.; Mäkinen, H.; Prislan, P.; Rossi, S.; Del Castillo, E.M.; Campelo, F.; Vavrčík, H.; et al. Woody biomass production lags stem-girth increase by over one month in coniferous forests. Nat. Plants 2015, 1, 15160. [Google Scholar] [CrossRef]
- Cuny, H.E.; Fonti, P.; Rathgeber, C.B.; Von Arx, G.; Peters, R.L.; Frank, D.C. Couplings in cell differentiation kinetics mitigate air temperature influence on conifer wood anatomy. Plant Cell Environ. 2018, 42, 1222–1232. [Google Scholar] [CrossRef]
- Rathgeber, C.B.K.; Cuny, H.E.; Fonti, P. Biological Basis of Tree-Ring Formation: A Crash Course. Front. Plant Sci. 2016, 7, 734. [Google Scholar] [CrossRef]
- Deslauriers, A.; Rossi, S.; Anfodillo, T. Dendrometer and intra-annual tree growth: What kind of information can be inferred? Dendrochronologia 2007, 25, 113–124. [Google Scholar] [CrossRef]
- Cocozza, C.; Giovannelli, A.; Lasserre, B.; Cantini, C.; Lombardi, F.; Tognetti, R. A novel mathematical procedure to interpret the stem radius variation in olive trees. Agric. For. Meteorol. 2012, 161, 80–93. [Google Scholar] [CrossRef]
- Van Der Maaten, E.; van der Maaten-Theunissen, M.; Smiljanić, M.; Rossi, S.; Simard, S.; Wilmking, M.; Deslauriers, A.; Fonti, P.; Von Arx, G.; Bouriaud, O. dendrometeR: Analyzing the pulse of trees in R. Dendrochronologia 2016, 40, 12–16. [Google Scholar] [CrossRef]
- Vilenski, E.; Bak, P.; Rosenblatt, J.D. Multivariate anomaly detection for ensuring data quality of dendrometer sensor networks. Comput. Electron. Agric. 2019, 162, 412–421. [Google Scholar] [CrossRef]
- Peng, R.D. Reproducible Research in Computational Science. Science 2011, 334, 1226–1227. [Google Scholar] [CrossRef]
- Lockhart, J.A. An analysis of irreversible plant cell elongation. J. Theor. Biol. 1965, 8, 264–275. [Google Scholar] [CrossRef]
- Cabon, A.; Peters, R.L.; Fonti, P.; Martínez-Vilalta, J.; De Cáceres, M. Temperature and water potential co-limit stem cambial activity along a steep elevational gradient. New Phytol. 2020, 226, 1325–1340. [Google Scholar] [CrossRef]
- Zweifel, R.; Häsler, R. Frost-induced reversible shrinkage of bark of mature subalpine conifers. Agric. For. Meteorol. 2000, 102, 213–222. [Google Scholar] [CrossRef]
- Charrier, G.; Nolf, M.; Leitinger, G.; Charra-Vaskou, K.; Losso, A.; Tappeiner, U.; Améglio, T.; Mayr, S. Monitoring of Freezing Dynamics in Trees: A Simple Phase Shift Causes Complexity. Plant Physiol. 2017, 173, 2196–2207. [Google Scholar] [CrossRef]
- Hodge, V.J.; Austin, J. A Survey of Outlier Detection Methodologies. Artif. Intell. Rev. 2004, 22, 85–126. [Google Scholar] [CrossRef]
- Van de Wiel, L.; van Es, D.M.; Feelders, A.J. Real-Time Outlier Detection in Time Series Data of Water Sensors. In Advanced Analytics and Learning on Temporal Data. AALTD 2020; Lemaire, V., Malinowski, S., Bagnall, A., Guyet, T., Tavenard, R., Ifrim, G., Eds.; Lecture Notes in Computer Science; Springer: Cham, Switzerland, 2020; Volume 12588. [Google Scholar]
- De Mil, T.; Hubau, W.; Ilondea, B.A.; Vargas, M.A.R.; Boeckx, P.; Steppe, K.; Van Acker, J.; Beeckman, H.; Bulcke, J.V.D. Asynchronous leaf and cambial phenology in a tree species of the Congo Basin requires space–time conversion of wood traits. Ann. Bot. 2019, 124, 245–253. [Google Scholar] [CrossRef]
- Knüsel, S.; Conedera, M.; Zweifel, R.; Bugmann, H.; Etzold, S.; Wunder, J. High growth potential of Ailanthus altissima in warm and dry weather conditions in novel forests of southern Switzerland. Trees 2018, 33, 395–409. [Google Scholar] [CrossRef]
- Güney, A.; Zweifel, R.; Türkan, S.; Zimmermann, R.; Wachendorf, M.; Güney, C.O. Drought responses and their effects on radial stem growth of two co-occurring conifer species in the Mediterranean mountain range. Ann. For. Sci. 2020, 77, 1–16. [Google Scholar] [CrossRef]
- Castagneri, D.; Petit, G.; Carrer, M. Divergent climate response on hydraulic-related xylem anatomical traits of Picea abies along a 900-m altitudinal gradient. Tree Physiol. 2015, 35, 1378–1387. [Google Scholar] [CrossRef] [PubMed]
- The Network TreeNet. Available online: https://treenet.info (accessed on 9 June 2021).
- Peters, R.L.; Pappas, C.; Hurley, A.G.; Poyatos, R.; Flo, V.; Zweifel, R.; Goossens, W.; Steppe, K. Assimilate, process and analyse thermal dissipation sap flow data using the TREX r package. Methods Ecol. Evol. 2021, 12, 342–350. [Google Scholar] [CrossRef]
- Haeni, M.; Knüsel, S.; Wilhelm, M.; Peters, R.L.; Zweifel, R. Treenetproc—Clean, Process and Visualise Dendrometer Data, R Package Version 0.1.4. 2020. Available online: https://github.com/treenet/treenetproc (accessed on 8 June 2021).
- R Core Team. R: A Language and Environment for Statistical Computing; R Foundation for Statistical Computing: Vienna, Austria, 2019. [Google Scholar]
Publisher’s Note: MDPI stays neutral with regard to jurisdictional claims in published maps and institutional affiliations. |
© 2021 by the authors. Licensee MDPI, Basel, Switzerland. This article is an open access article distributed under the terms and conditions of the Creative Commons Attribution (CC BY) license (https://creativecommons.org/licenses/by/4.0/).