3.3.1. Qualitative Analysis by Gas Chromatography-Mass Spectrometry (GC-MS)
The most prominent lipophilic and hydrophilic extractives identified by GC-MS from the spruce bark hexane and water extracts are listed in
Table 3 and
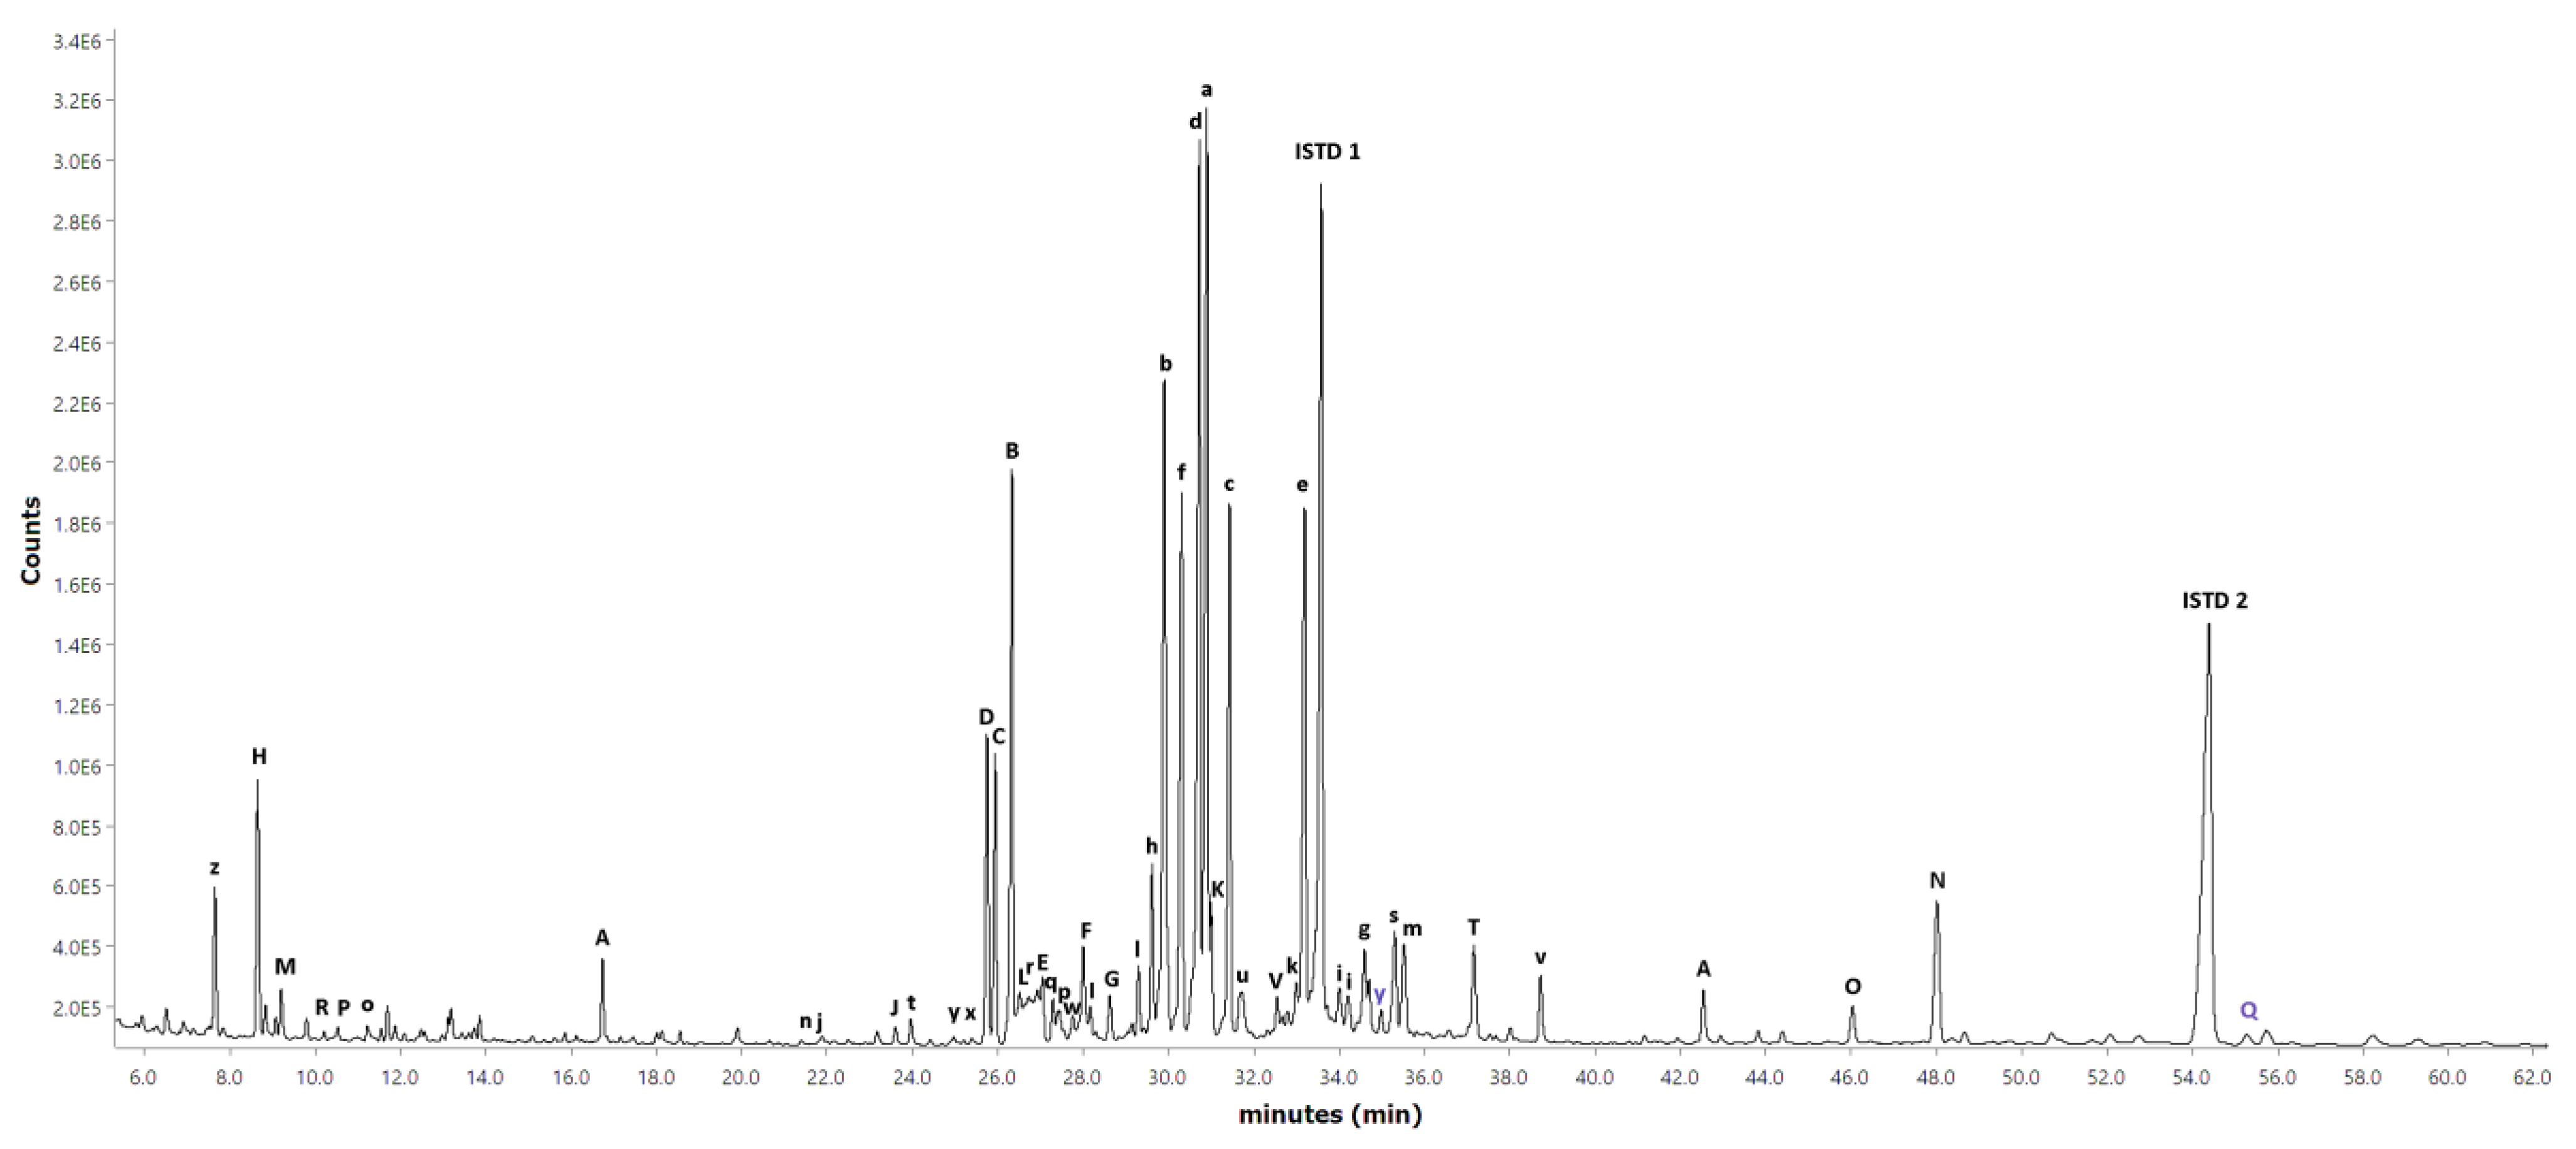
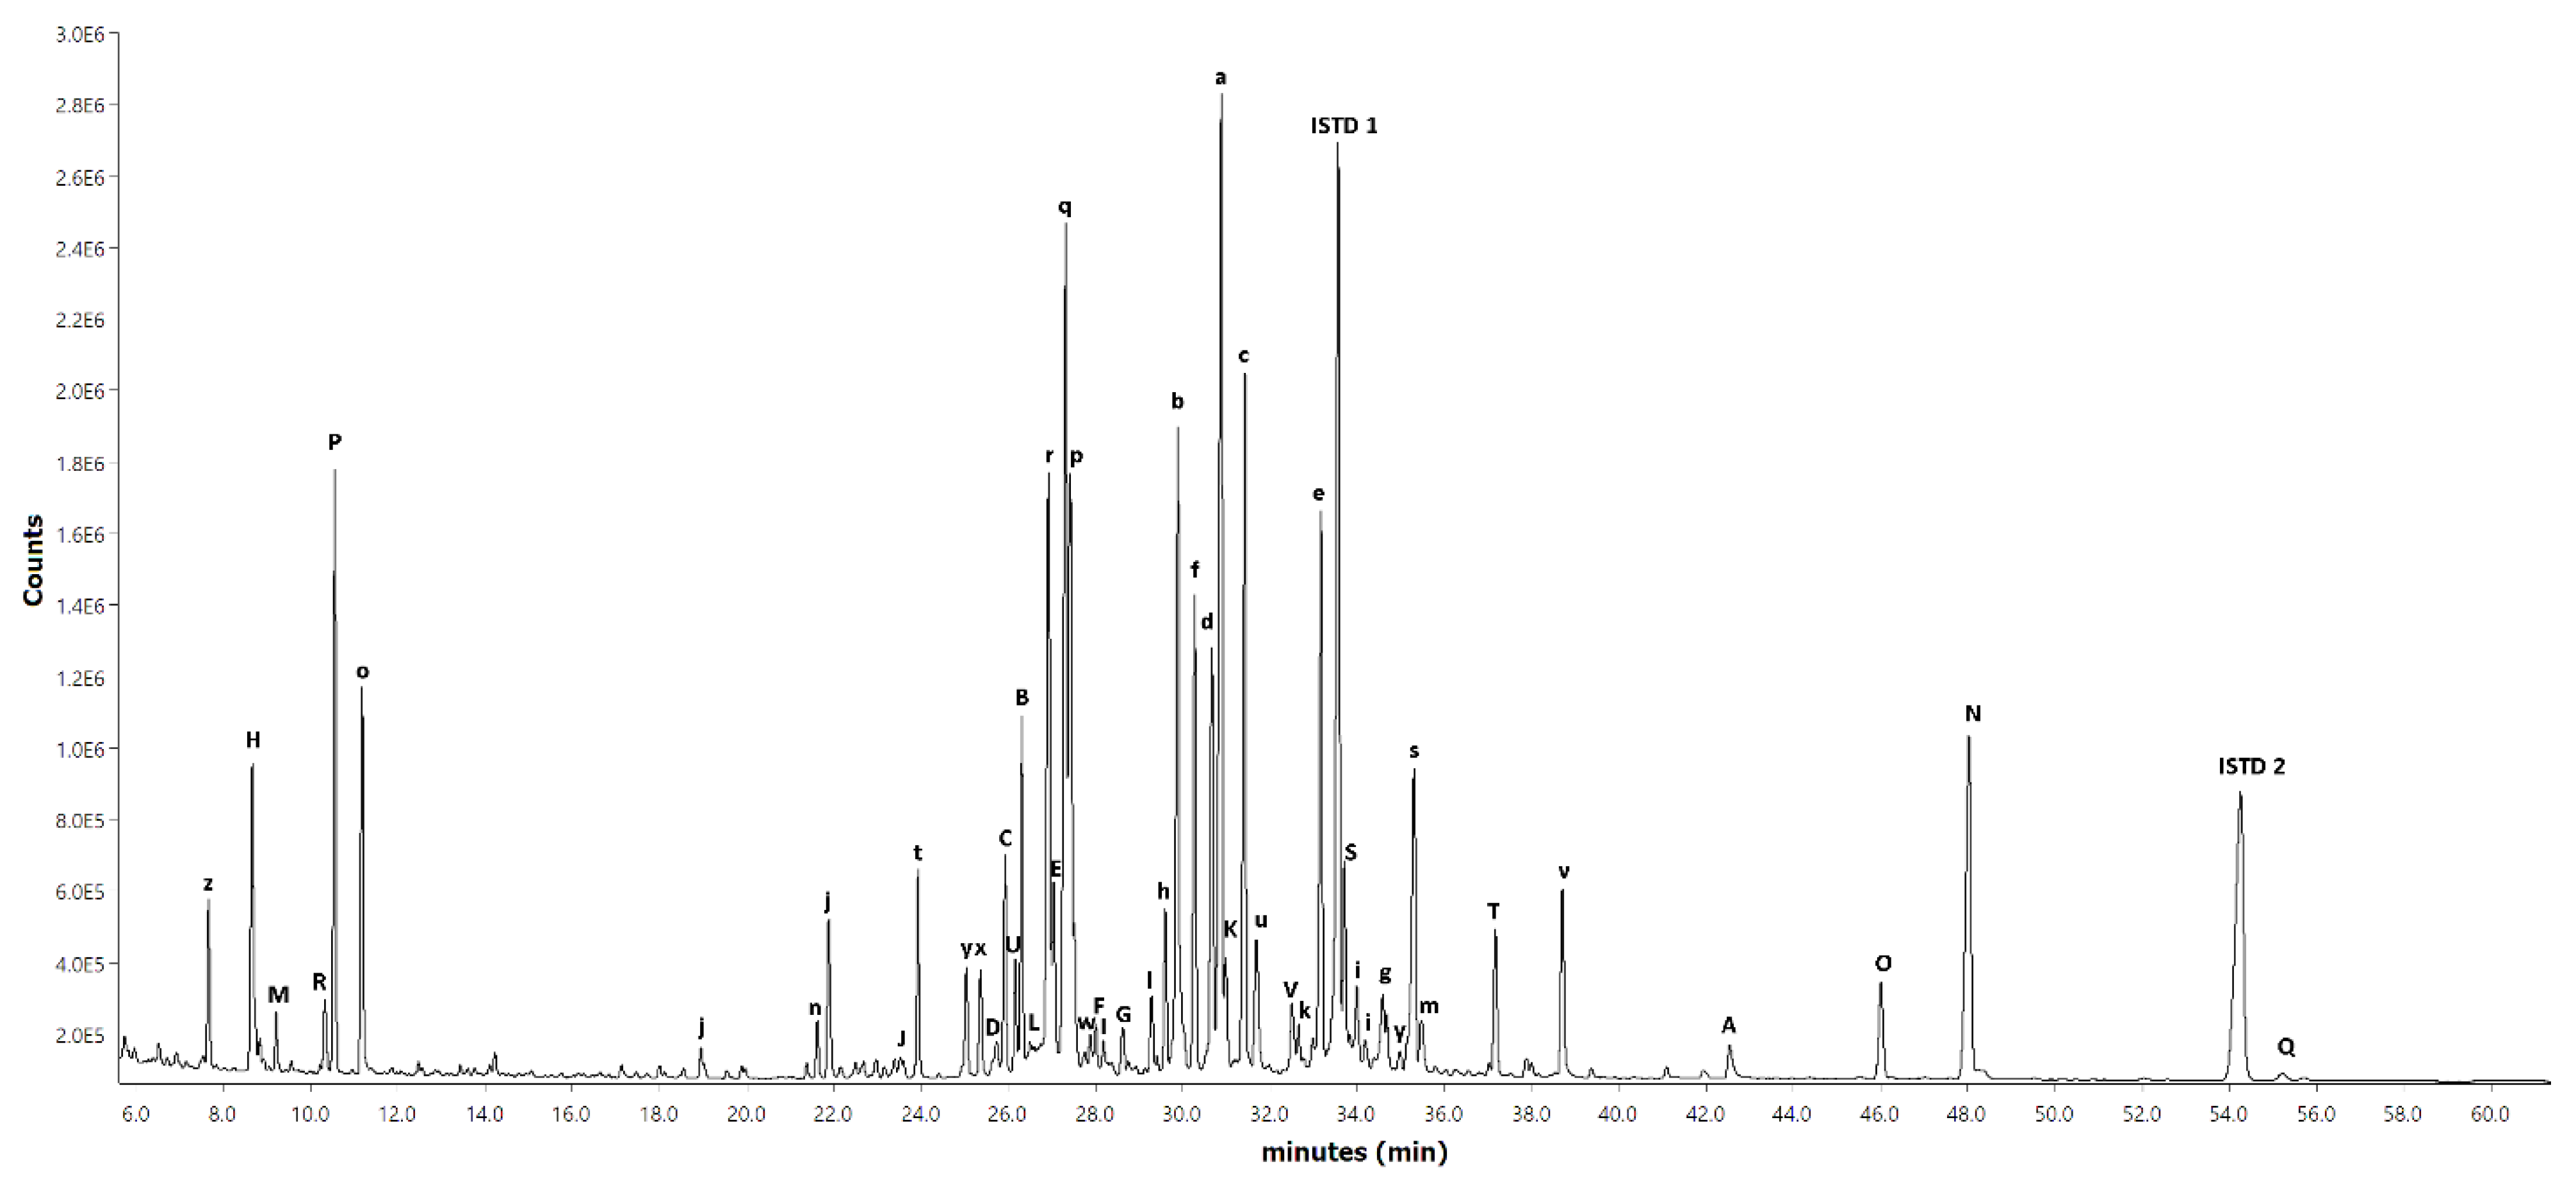
Table 4, respectively. The extractives are listed according to their significance among all the analysed samples. The main categories of lipophilic extractives were resin and fatty acids, diterpenoids, sterols and fatty alcohols (i.e., waxes). The main categories of hydrophilic extractives were sugars, organic acids, stilbenes, alcohols and flavonoids. The category defined in the table as others comprised the extractives, which (although visible in the GC chromatograms) could not be identified. Identifying these compounds was impossible either because their amount was too low, the peaks overlapped, a lack of a meaningful library match or the MS method’s solvent delay caused the peaks to be undetected. The reference chromatograms from the long-column GC-MS/FID analysis of the hexane extracts of both free and esterified extractives are given in
Appendix A and
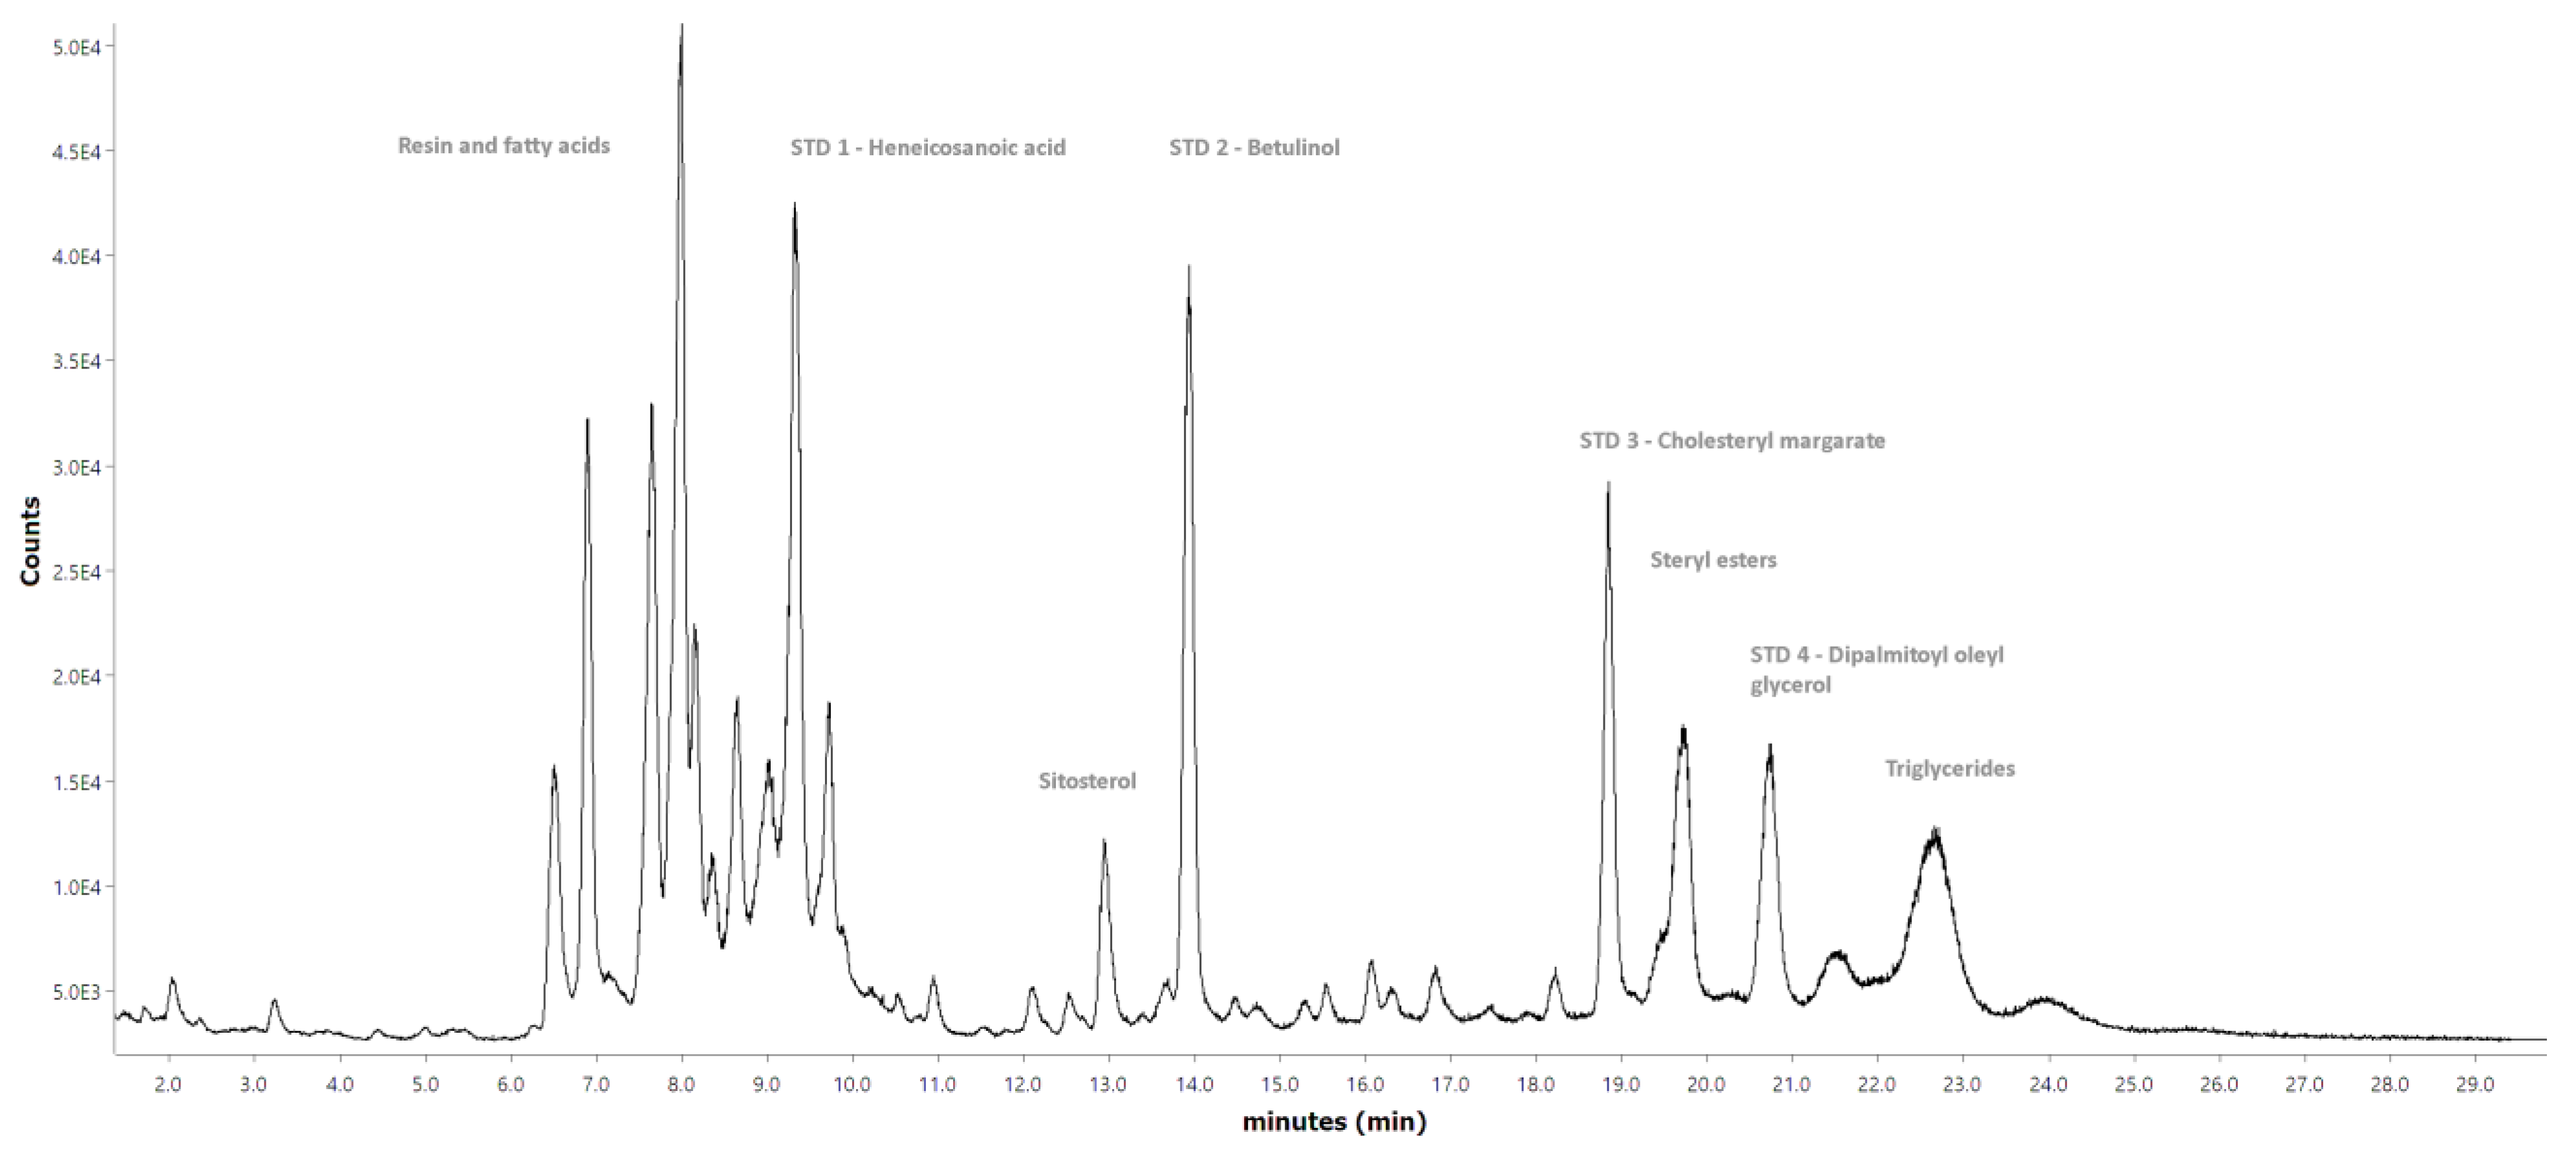
Figure A1 and
Figure A2, respectively, while the chromatogram of the short-column GC-FID for the hexane extract is shown in
Figure A3. The long- and short-column reference chromatograms for the water extract’s hydrophilic compounds can be seen in
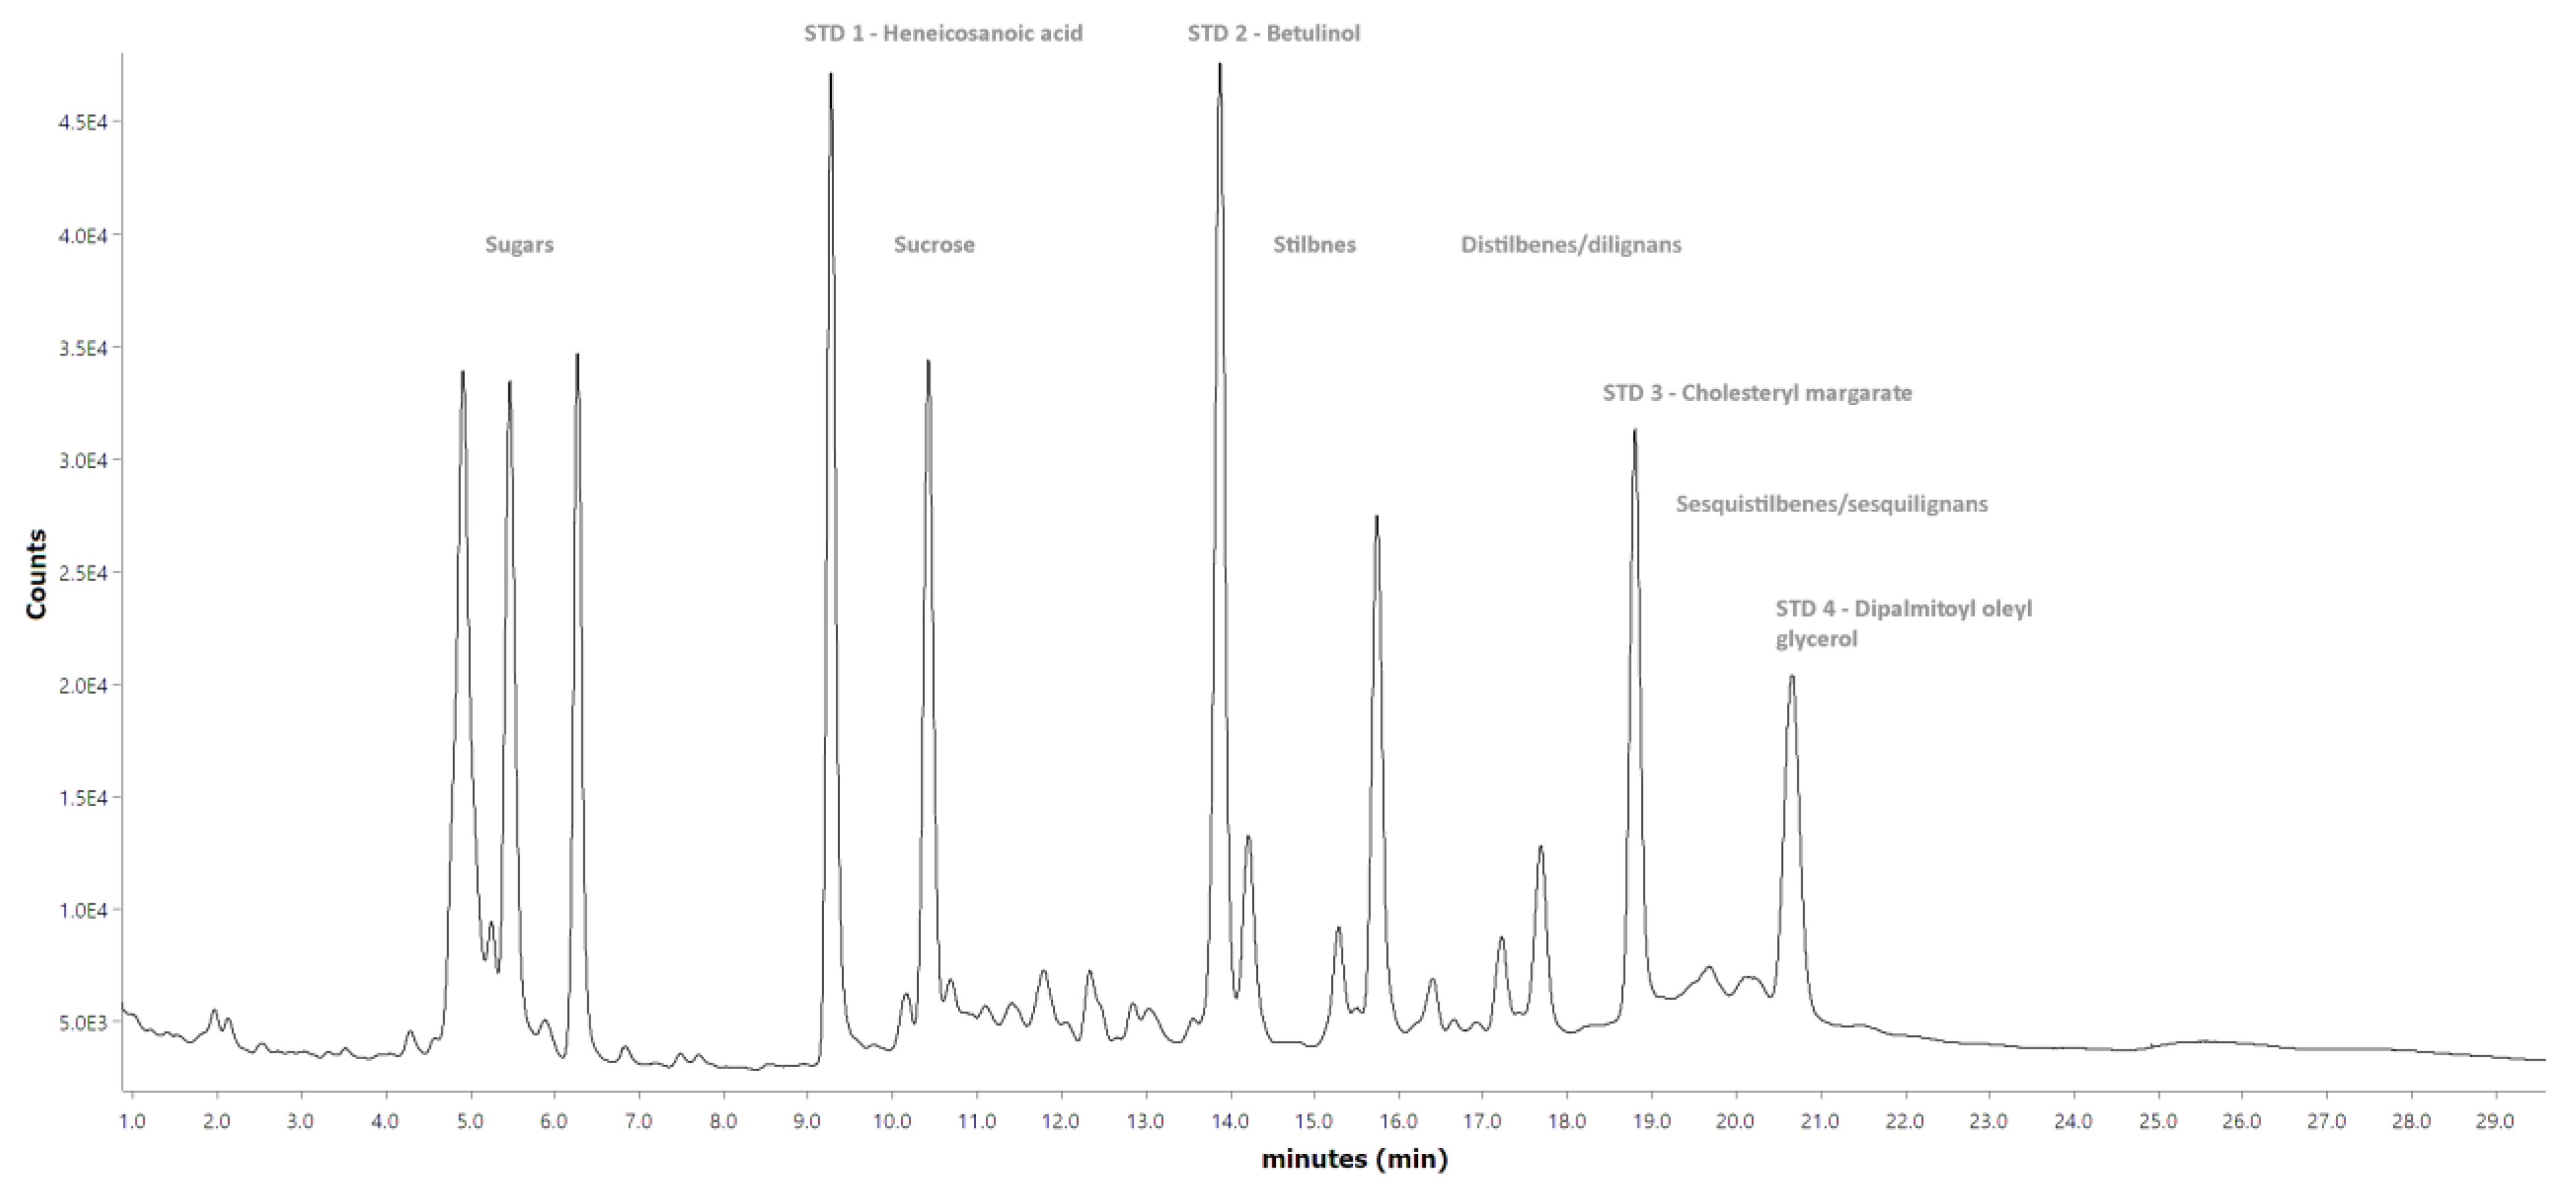
Figure A4 and
Figure A5, respectively. The compounds listed in
Table 3 and
Table 4 are linked to the chromatogram peaks with specific symbols to help with their interpretation.
As can be seen from
Table 3, resin and fatty acids together accounted for more than half of the identified lipophilic compounds, with diterpenoids, sterols and fatty alcohols being the minor compounds. The most important resin acids found from the spruce bark samples were dehydroabietic, isopimaric, abietic, levopimaric, neoabietic and palustric acids, representing 77% of the total amount of resin acids. The most prominent fatty acids were 18:1, 18:2, 18:3, 22:0, 16:0, 20:0 and 24:0, representing 88% of the total amount of fatty acids. It should be noted that many triglycerides and steryl esters had fatty acids bound to them, which were released upon hydrolysis with KOH (see
Section 2.8.1).
Detailed qualification of the lipophilic compounds visible only in the short-column spectrum, that is, steryl esters and triglycerides, was limited because this measurement was done on equipment without a mass detector and only with FID. The general group identification of triglycerides and steryl esters, as seen in
Figure A3, was, however, possible due to previous studies that used the same method for the group analysis of wood extractives [
31,
39].
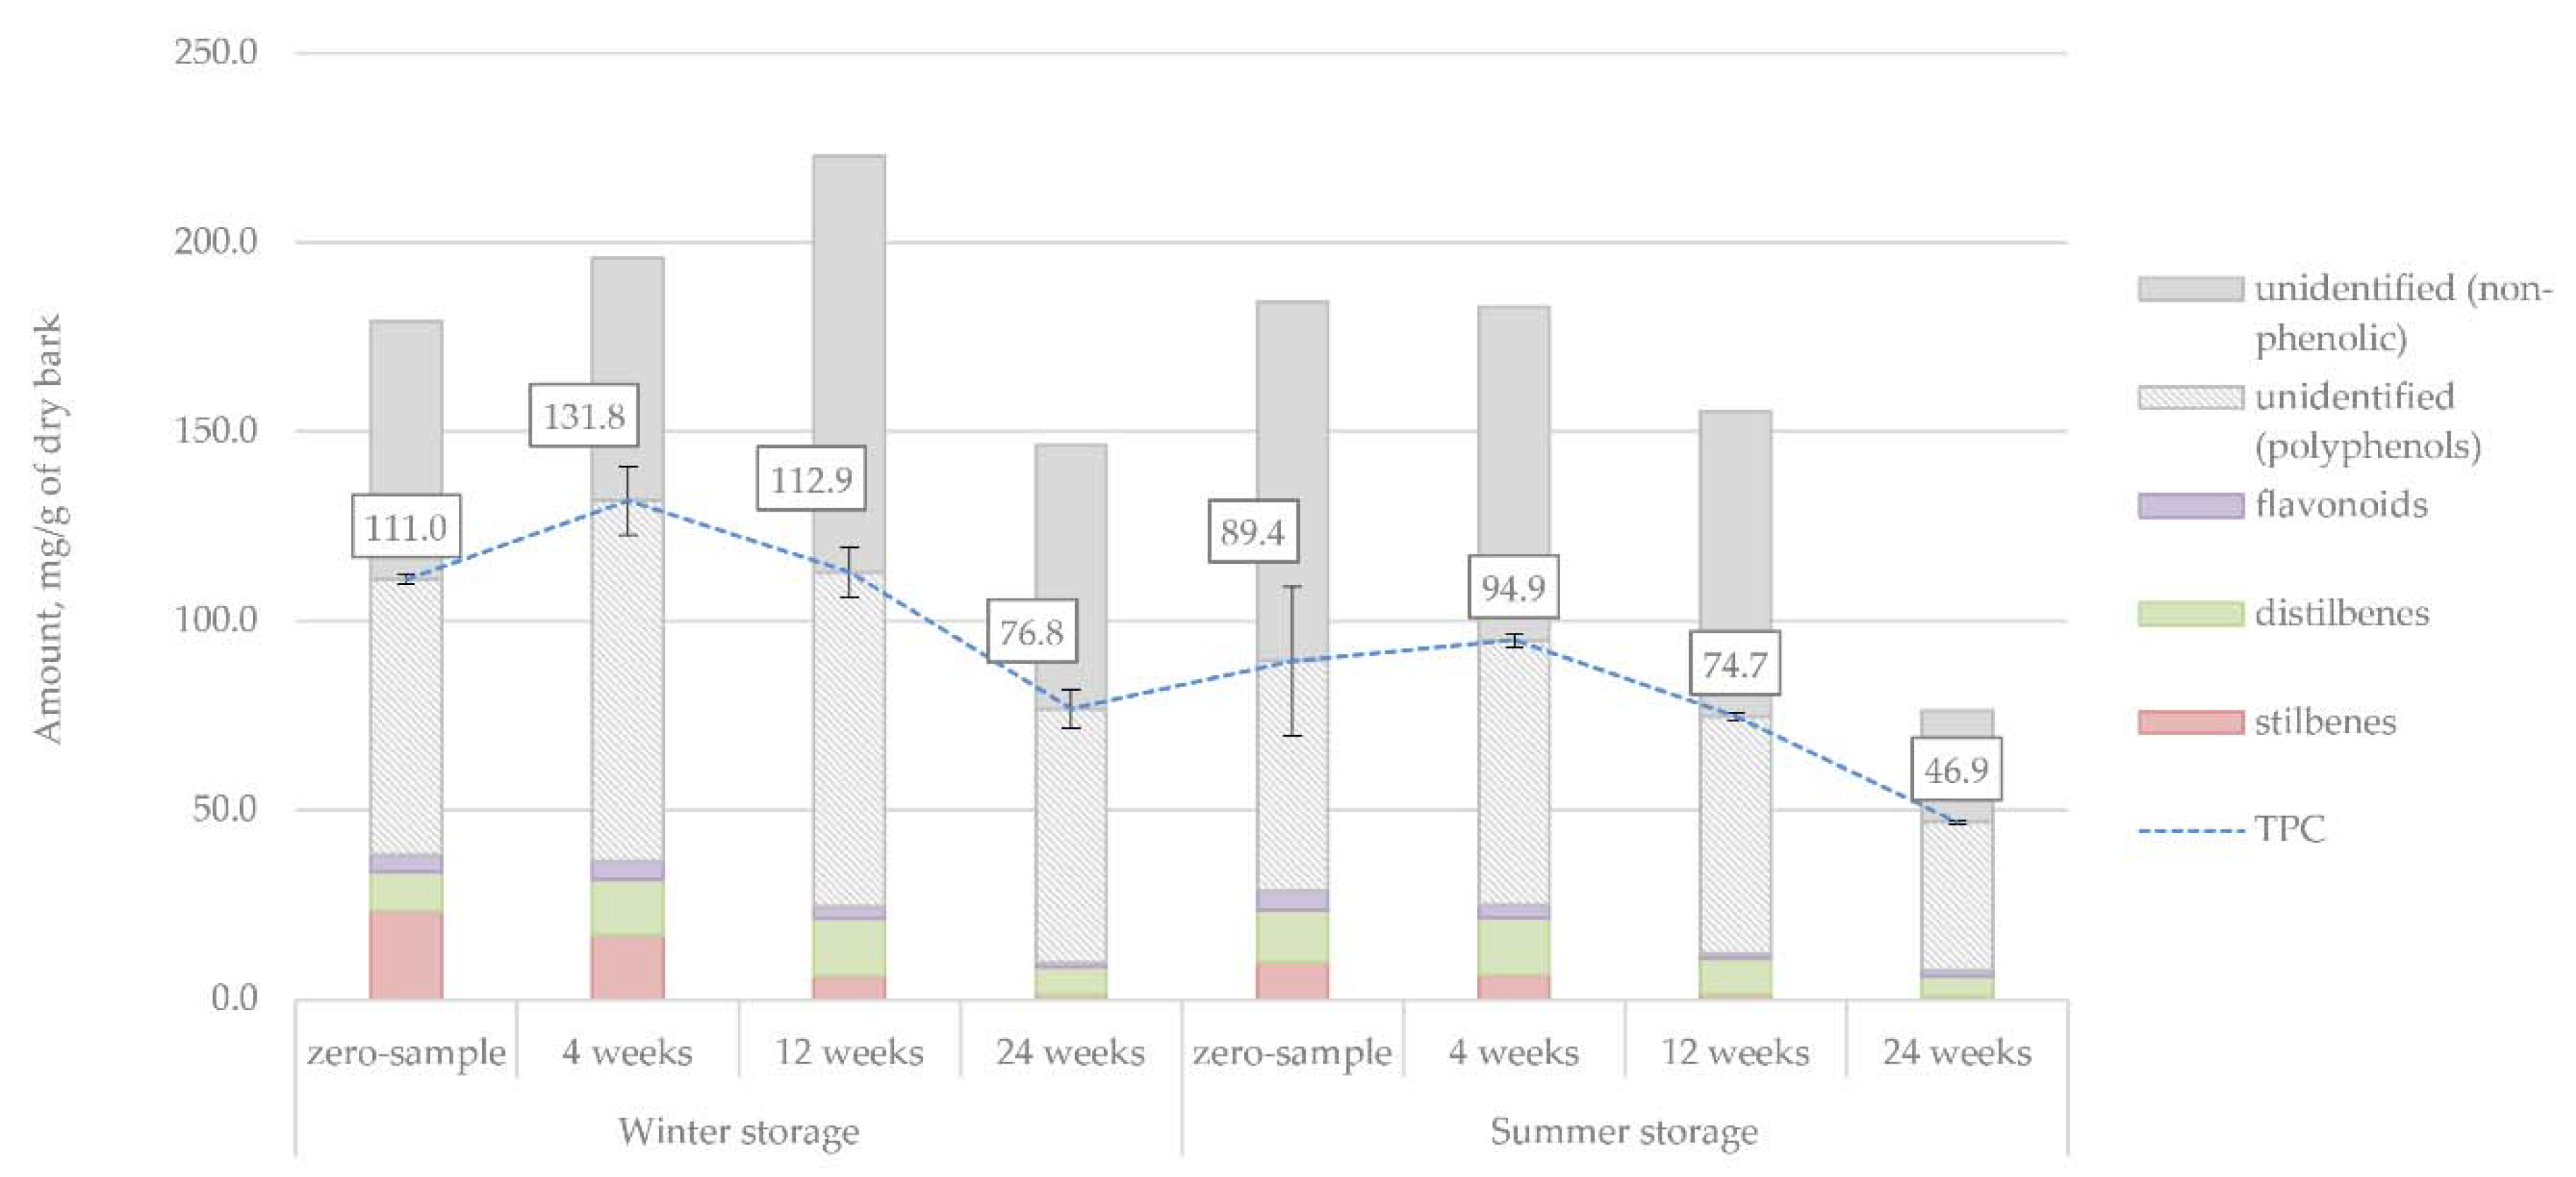
The results in
Table 4 demonstrate that the most significant part (37%) of the hydrophilic water extract in all the samples was accounted for by various soluble sugars, followed by organic acids (25%). Stilbenes and alcohols made up 11% and 10% of the identified extractives, respectively, while the amount of flavonoids present was only 4%. Even with short-column GC, a relatively large part of the water extract was left unidentified. The unidentified hydrophilic compounds contained such large oligomeric and polymeric molecules that they could not be analysed in the gas phase even after silylation. Such compounds would presumably have contained procyanidins, oligomeric phenolic compounds (e.g., stilbenes) and sugars as well as lignin. Based on a recent study’s analytical pyrolysis results, there also appeared to be lignin fragments present in hot-water extracts of spruce [
40]. However, as shown in
Figure A5, the short-column GC did reveal two additional compound groups, which, based on a previous study [
41], could be identified as dilignans and sesquilignans. However, the lack of monomeric lignans in the studied bark samples, combined with the fact that HPLC analysis of water extracts confirmed the presence of distilbenes, suggested that these compounds should more likely be counted as distilbenes and sesquistilbenes. Nevertheless, the lack of a mass detector in the short-column GC prevented the final confirmation of this presumption.
3.3.2. Quantitative Analysis by Gas Chromatography with a Flame Ionisation Detector (GC-FID)
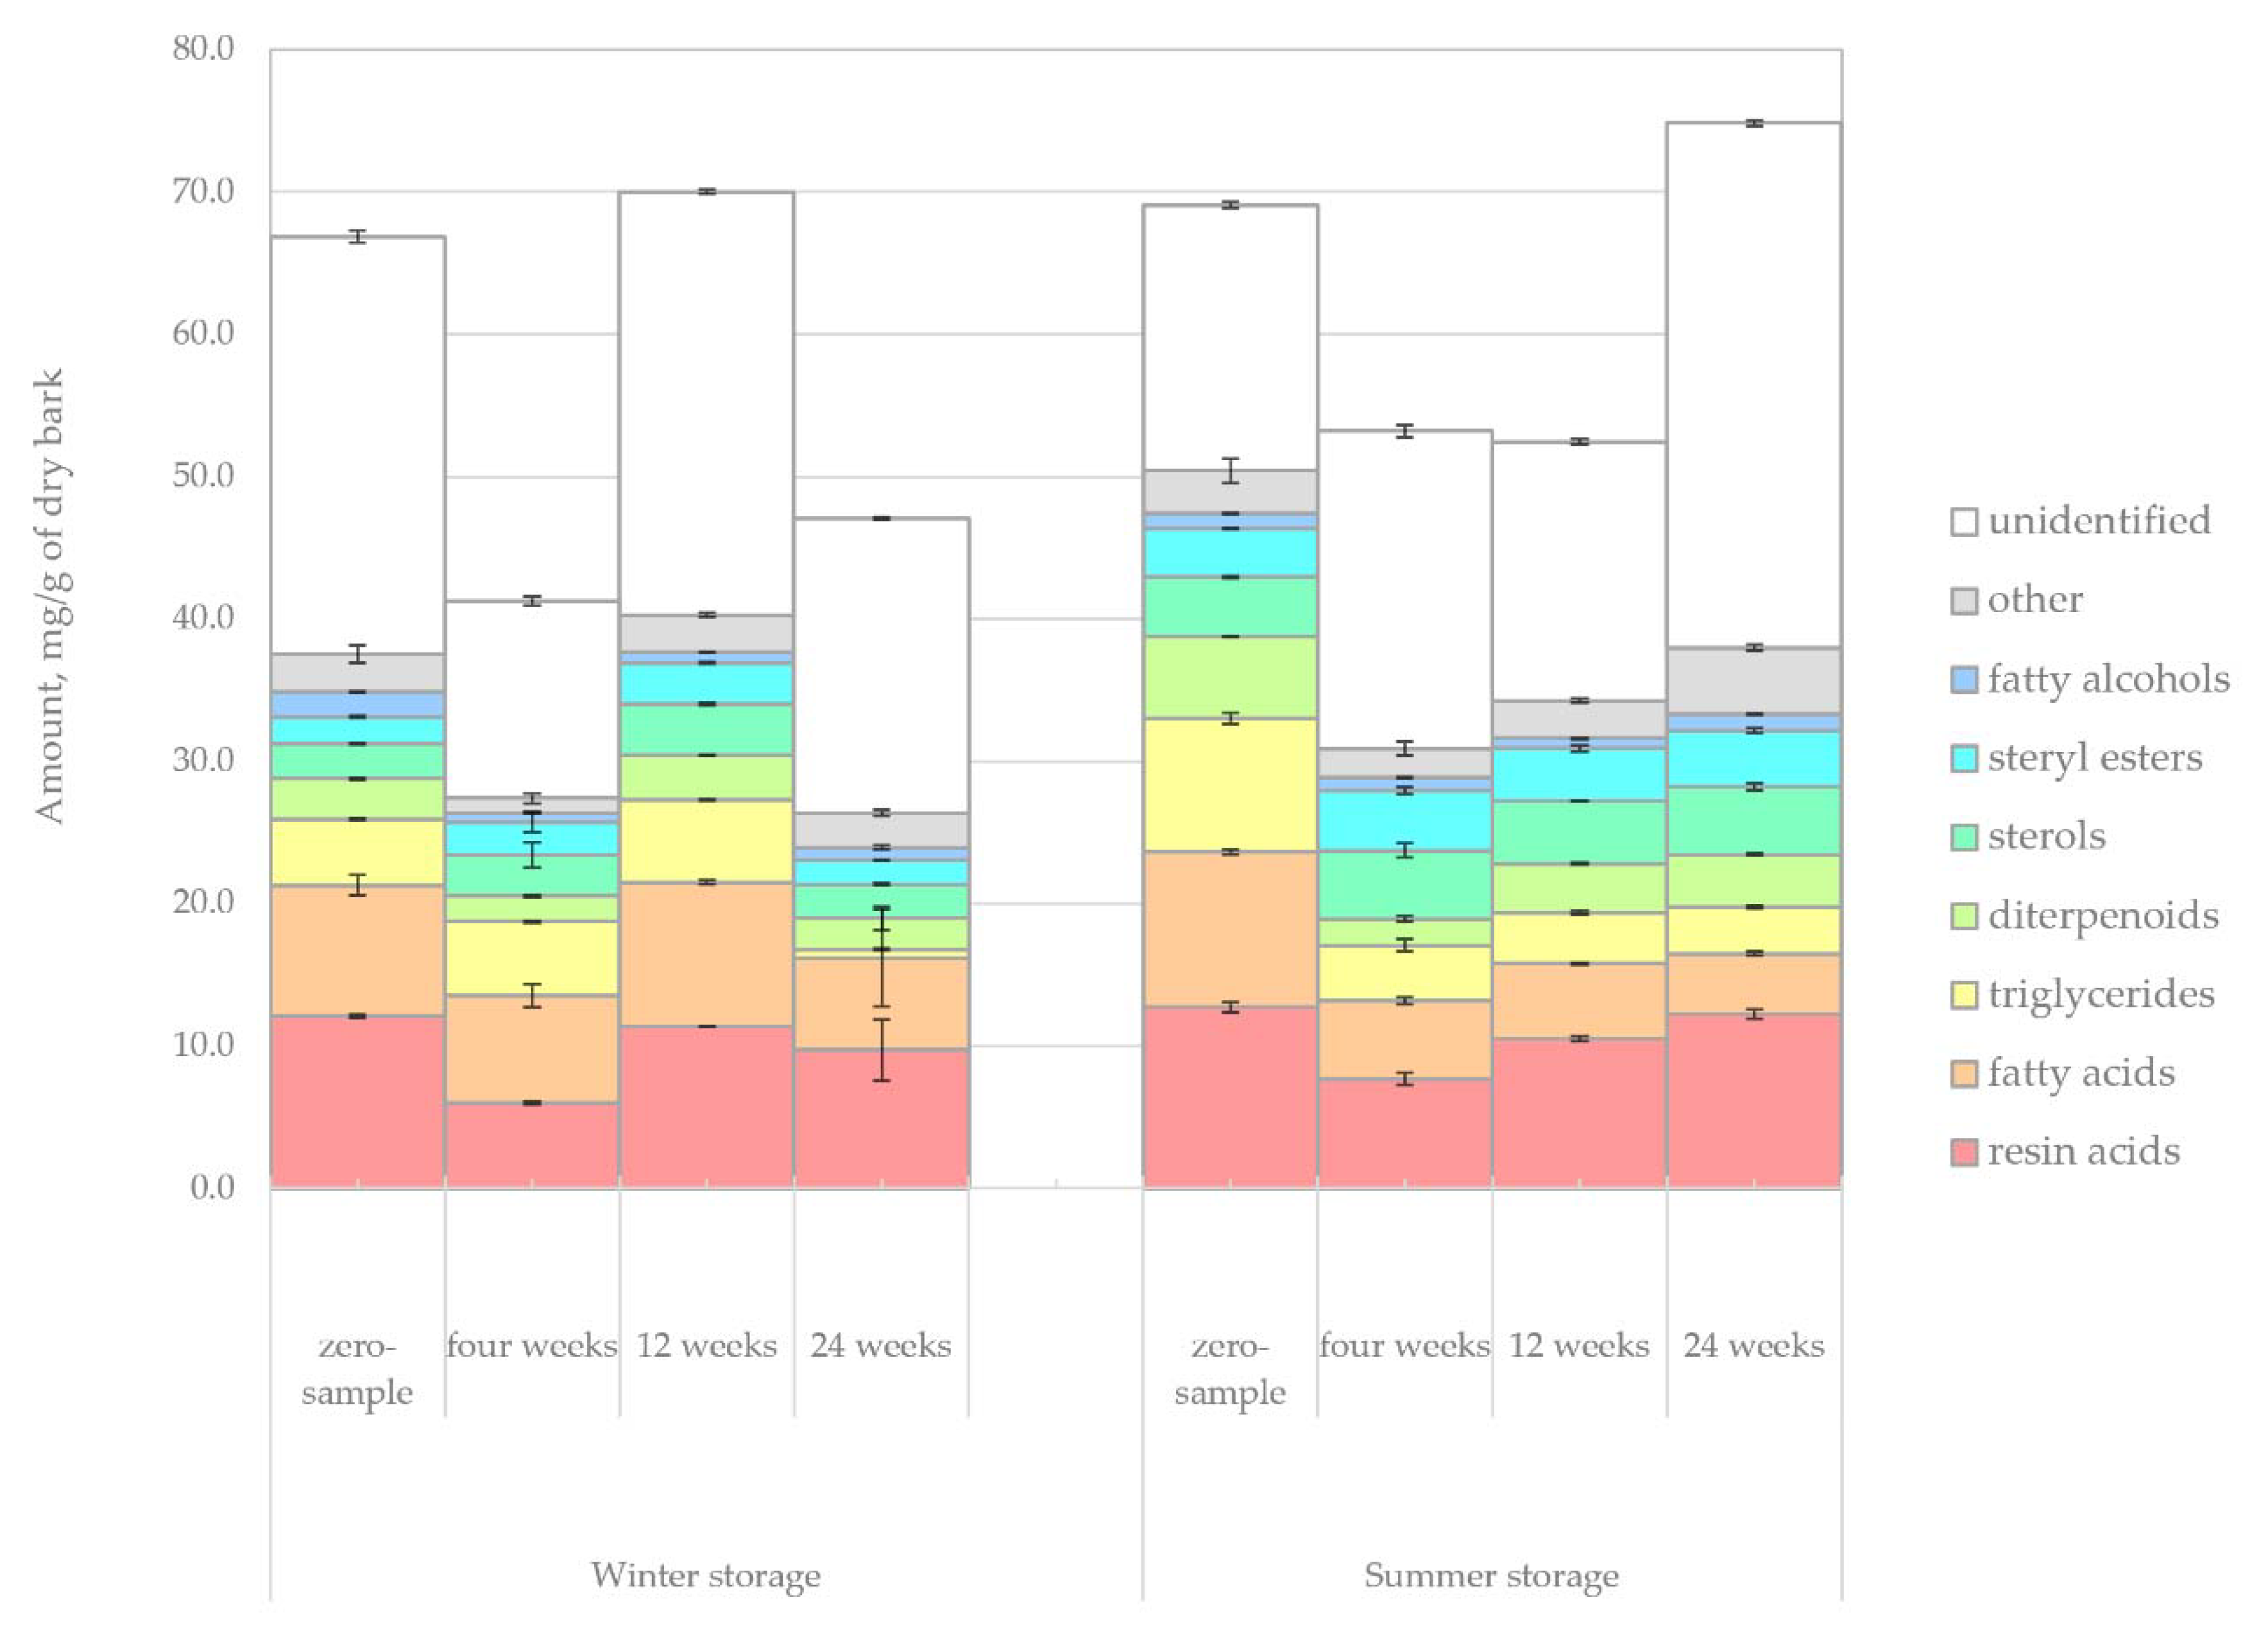
The changes in the amount of lipophilic extractives in the bark samples during winter and summer storage are shown in
Figure 4. The average amount of identified lipophilic extractives during winter and summer was around 43 mg/g and 50 mg/g of dry matter. In comparison, approximately 20 mg/g and 23 mg/g of dry matter were left unidentified using chromatographic methods during winter and summer, respectively. Based on the total amount of extractives, no clear trends in the extractives decay could be observed. Instead, the changes that were seen could be understood to reflect the natural variation in the amount of lipophilic compounds between any saw logs of similar outward appearance.
A more in-depth view of the different compound groups revealed clear trends, such as the gradual decrease of triglycerides because of hydrolysis, a well-known reaction during wood storage [
9,
15,
42]. While the summer-stored bark lost triglycerides faster at the beginning of the storage period, from week 12 onwards (as the temperatures decreased from 15 °C to 0 °C), hydrolysis reactions were also reduced. In the winter-stored bark, triglycerides’ hydrolysis was limited for the first 12 weeks of storage, after which, as the temperatures rose to 20 °C, the triglycerides were lost rapidly. A similar pattern of degradation could be seen in the total amount of fatty acids. In the summer-stored bark, compared to the winter-stored bark, there was a 44% increase of diterpenoids, 19% increase of resin acids, 4% increase of sterols, 51% increase of other lipophilic compounds, 73% increase of steryl esters and 24% increase of triglycerides during storage. The higher lipophilic content during the summer storage agreed with a previous study [
43], where it was shown that higher temperatures increased the hydrolysis of esterified compounds.
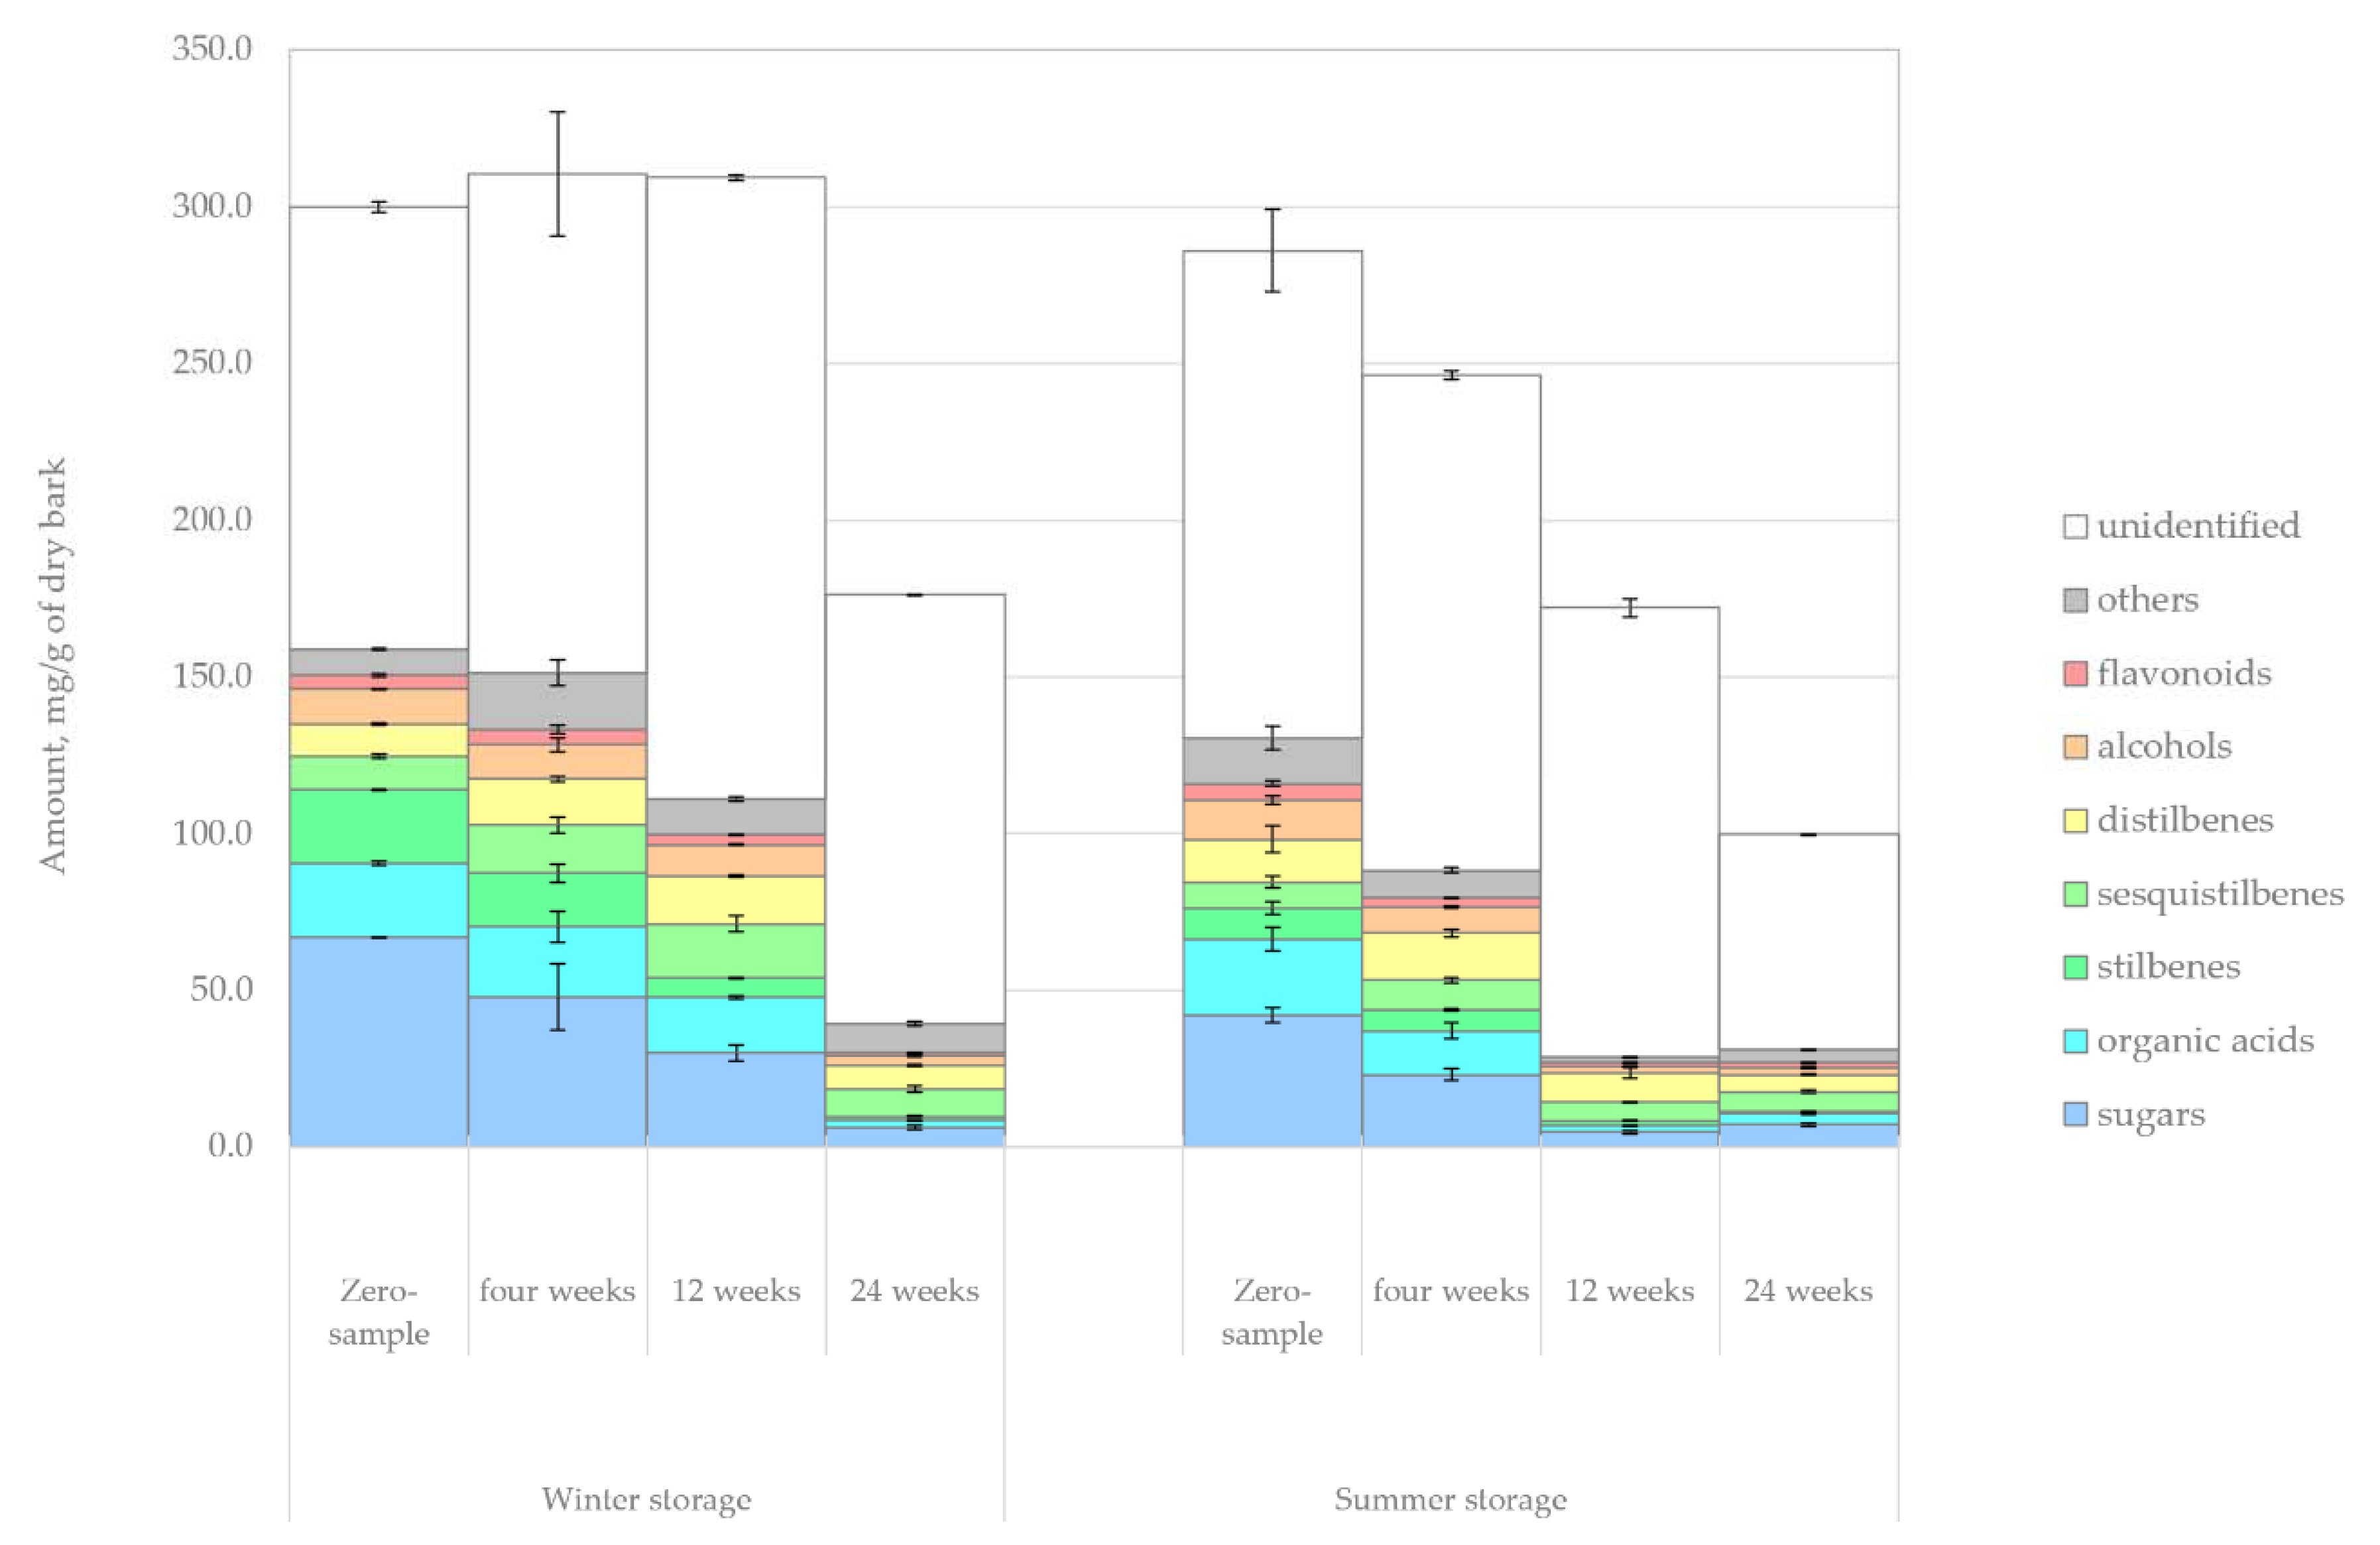
The changes in the amount of hydrophilic compounds during the winter and summer storage periods are shown in
Figure 5. Unlike in the case of lipophilic compounds, clear trends were observed for hydrophilic extractives. The total amount of extractives decreased 41% during winter storage and 62% during summer storage. This difference could easily be understood due to the seasonal effects, namely, elevated microbial activity, increased rate of hydrolysis and increased UV radiation during the warm summer months. During summer, the decrease of extractives was immediately noted after 4 weeks of storage, but the extractives content remained high for 12 weeks during winter storage.
It should be noted that the degradation rate of hydrophilic extractives reported here is not as significant as in previous studies that focus on the storage of chipped wood, bark or logging residue in large piles. Ekman, as cited by Sjöström [
42], has reported even 50% degradation of hydrophilic extractives in 50 days. A faster loss of hydrophilic compounds in pile-stored material, compared to the storage of saw logs, could be expected because, in pile storage, various factors increase the likelihood of material losses, such as smaller particle size, pile compactness and self-heating caused by microbial activity [
10,
11,
44].
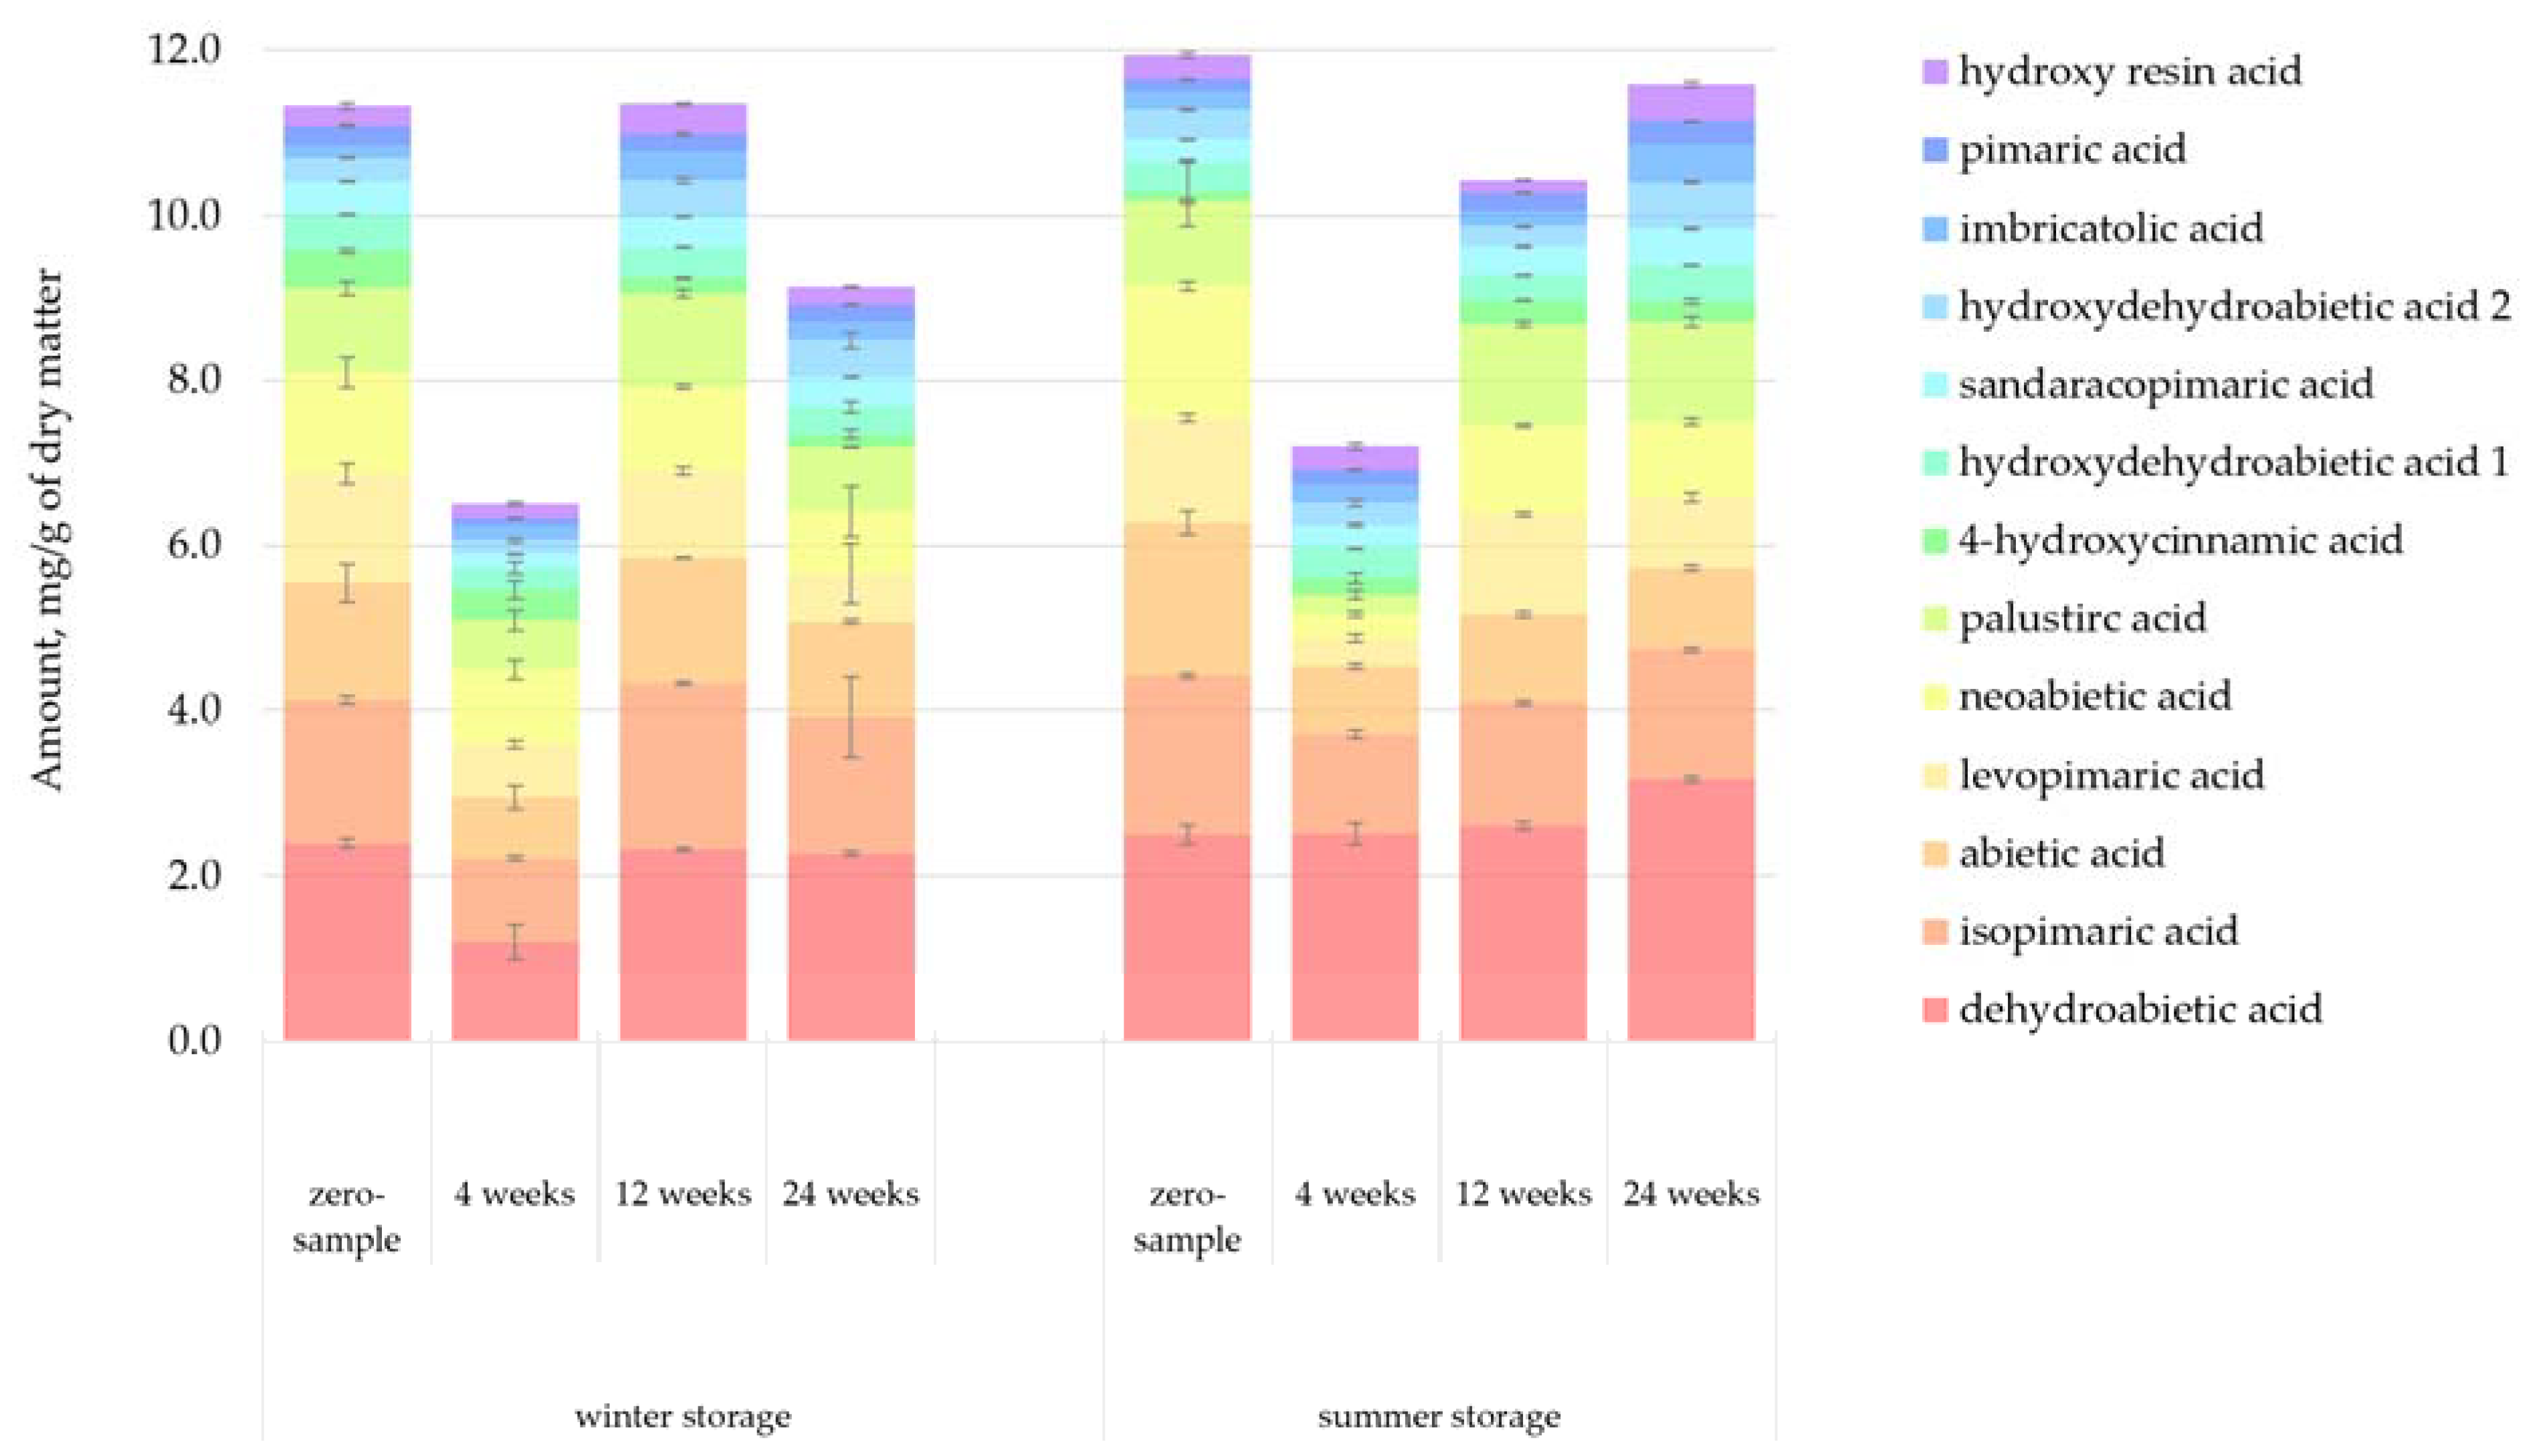
Figure 6 presents the quantified amount of resin acids in the lipophilic bark extracts. There appeared to be a general correlation between the total amount of resin acids and the total amount of lipophilic extractives. The total amount of resin acids remained relatively constant throughout the storage periods. Previous studies have demonstrated that resin acids can be resistant to microbial degradation [
16]. Samples from week 4 had a notably lower amount of resin acids compared to other samples. However, this result should be interpreted as a sign of the natural variance in the amount of lipophilic compounds between trees, not as a general principle.
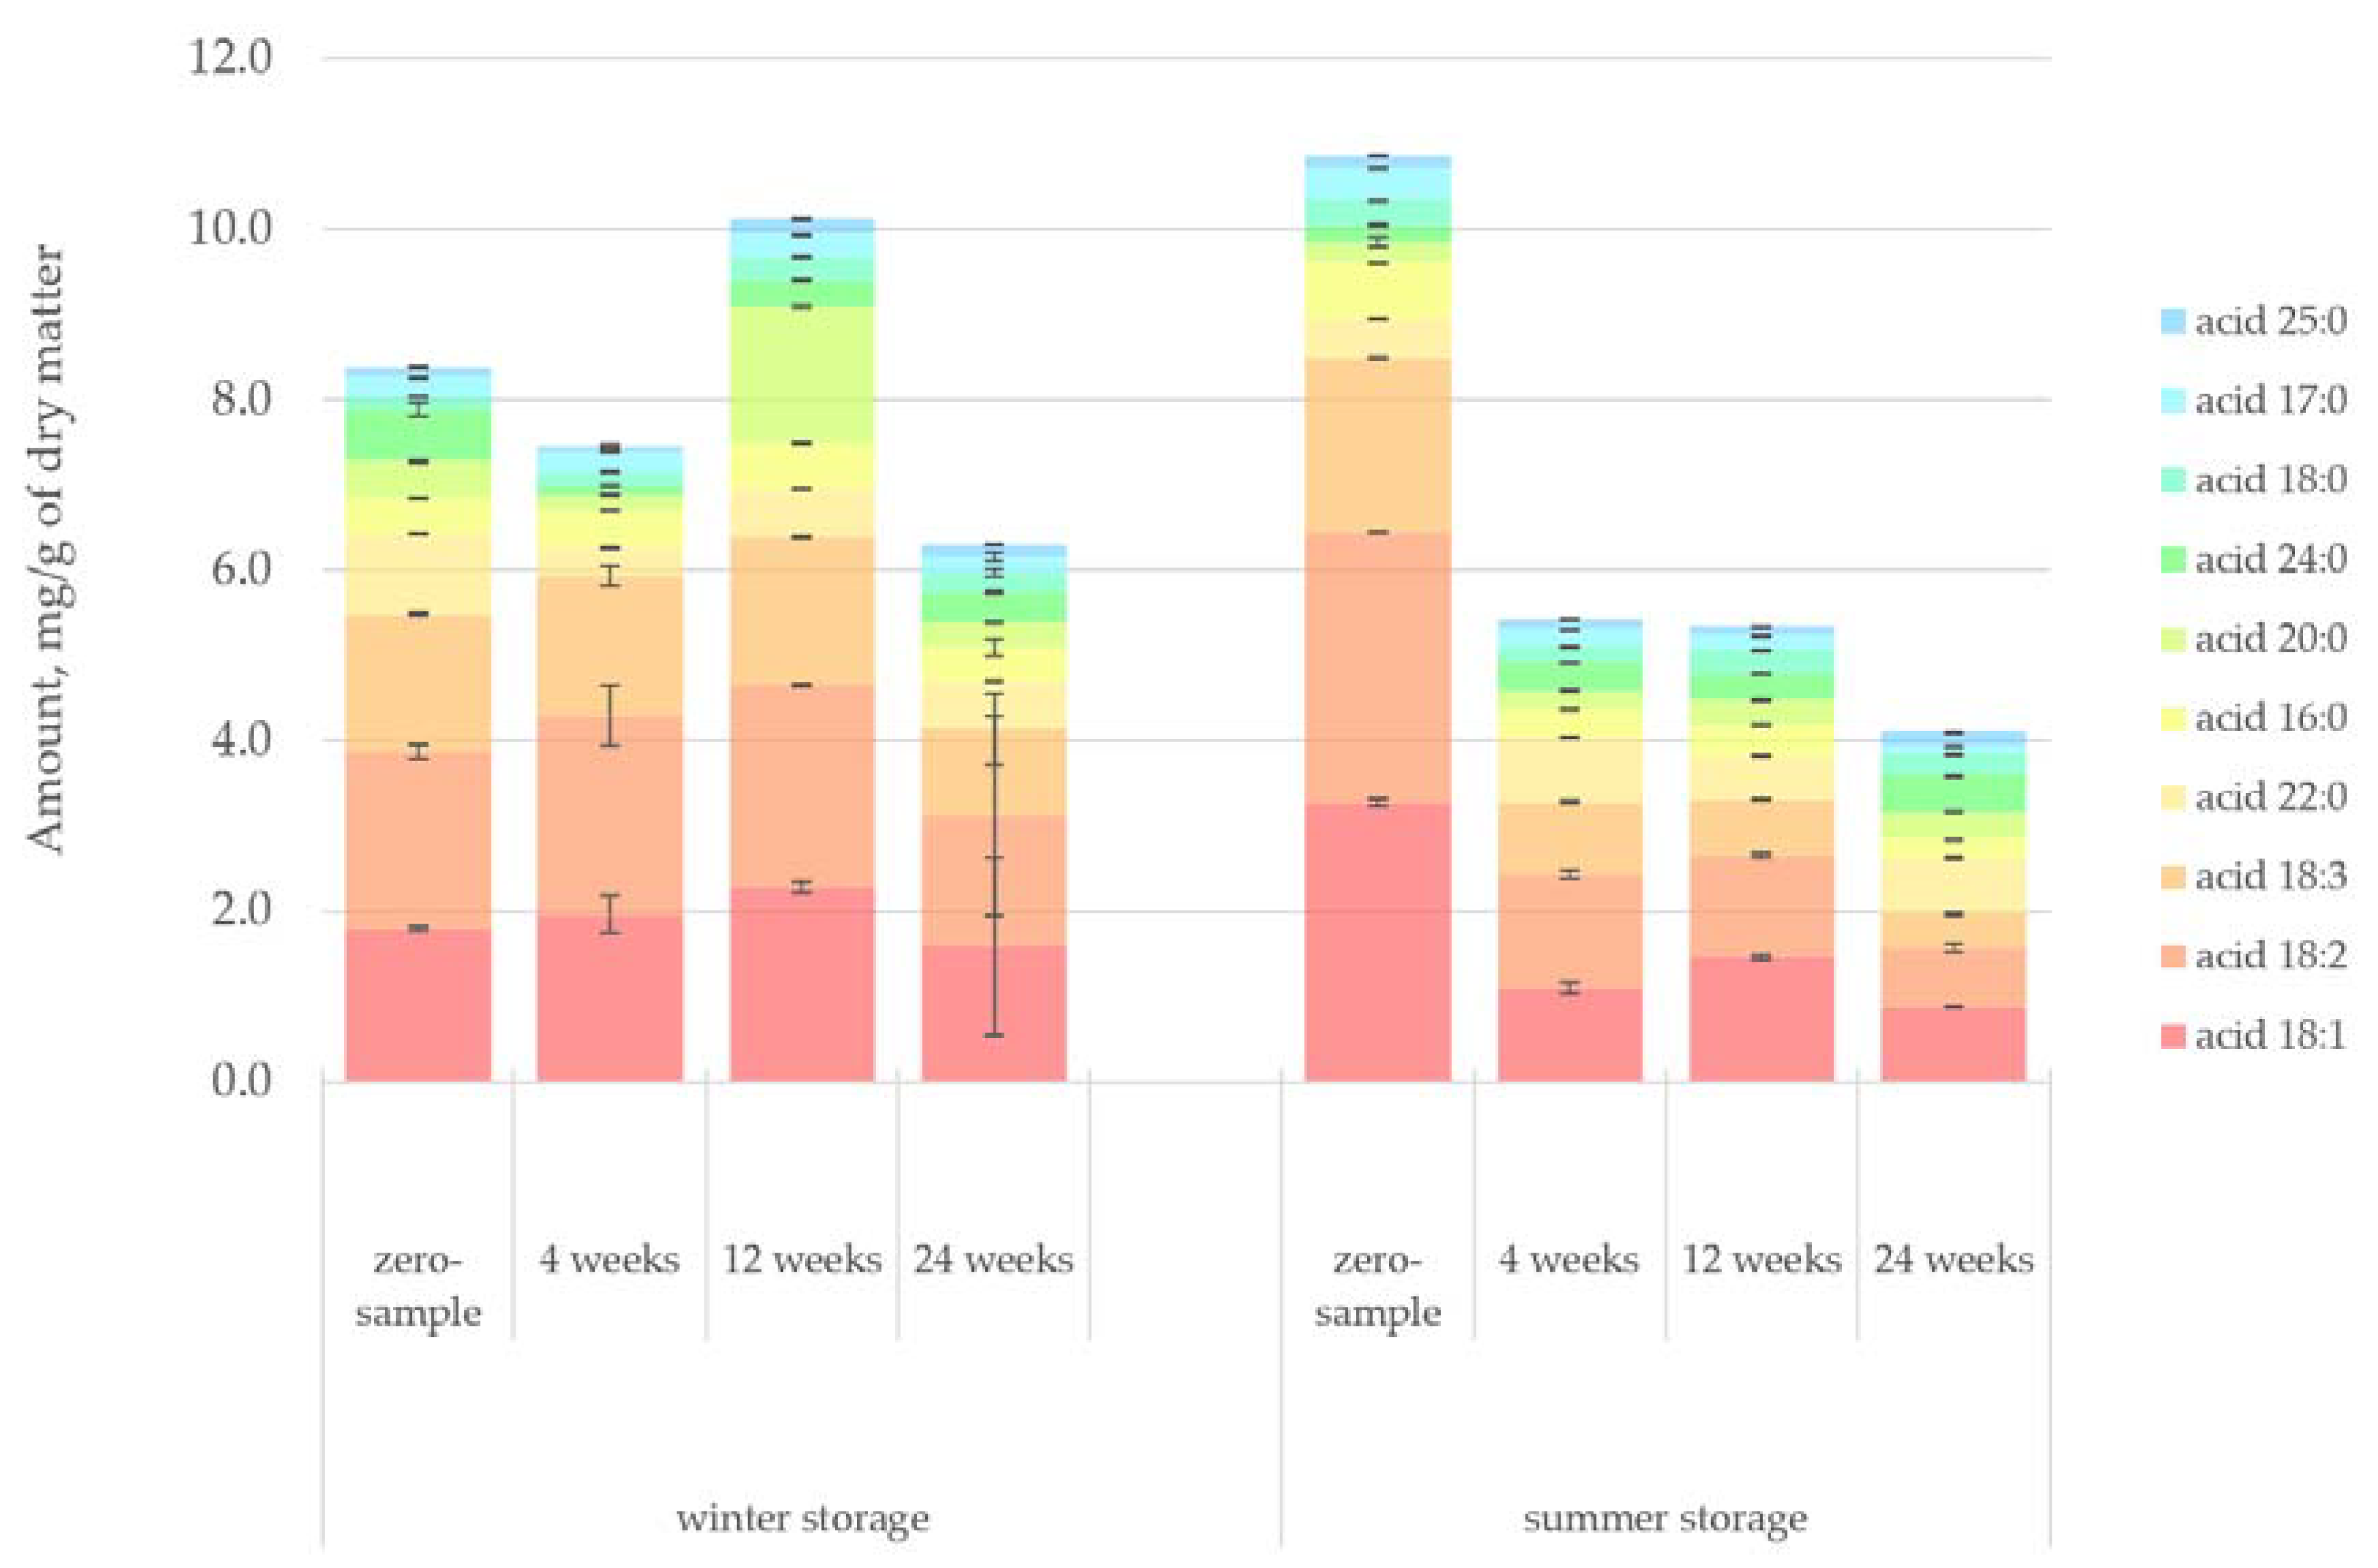
Figure 7 presents the quantified amount of fatty acids in the lipophilic bark extracts. The rate of fatty acid degradation followed a quite predictable path in both storage studies. The initial amount of fatty acids was higher at the beginning of the summer storage period. However, fatty acids also decreased faster during summer, primarily due to increased hydrolysis, oxidation and reactions of conjugated double bonds. The sample from the winter storage period at week 12 appeared to be an anomaly, having a generally high concentration of fatty acids but also a much higher amount of acid 20:0 compared to other samples. The difference might be explained by the fact that, as seen in
Table 1, the sample logs from the winter storage period at week 12 were around 30 years younger than the average age of the trees used in the study. The same observation was true for the zero-sample saw logs from the summer storage period, which had an equally high concentration of fatty acids. This result suggested that a tree’s age influences the amount of fatty acids in spruce bark. For this study, having a significant variance in tree age was an interesting factor to note but not an objective that was pursued. For meaningful inferences from tree age to extractives content to be made, the number of samples would have needed to be significantly higher. As a general principle, older trees have more resin in the heartwood. Moreover, while this behaviour could also be expected of bark, the authors of this paper are not aware of any studies that carefully demonstrate the relationship between tree age and the total extractives content of Norway spruce bark.
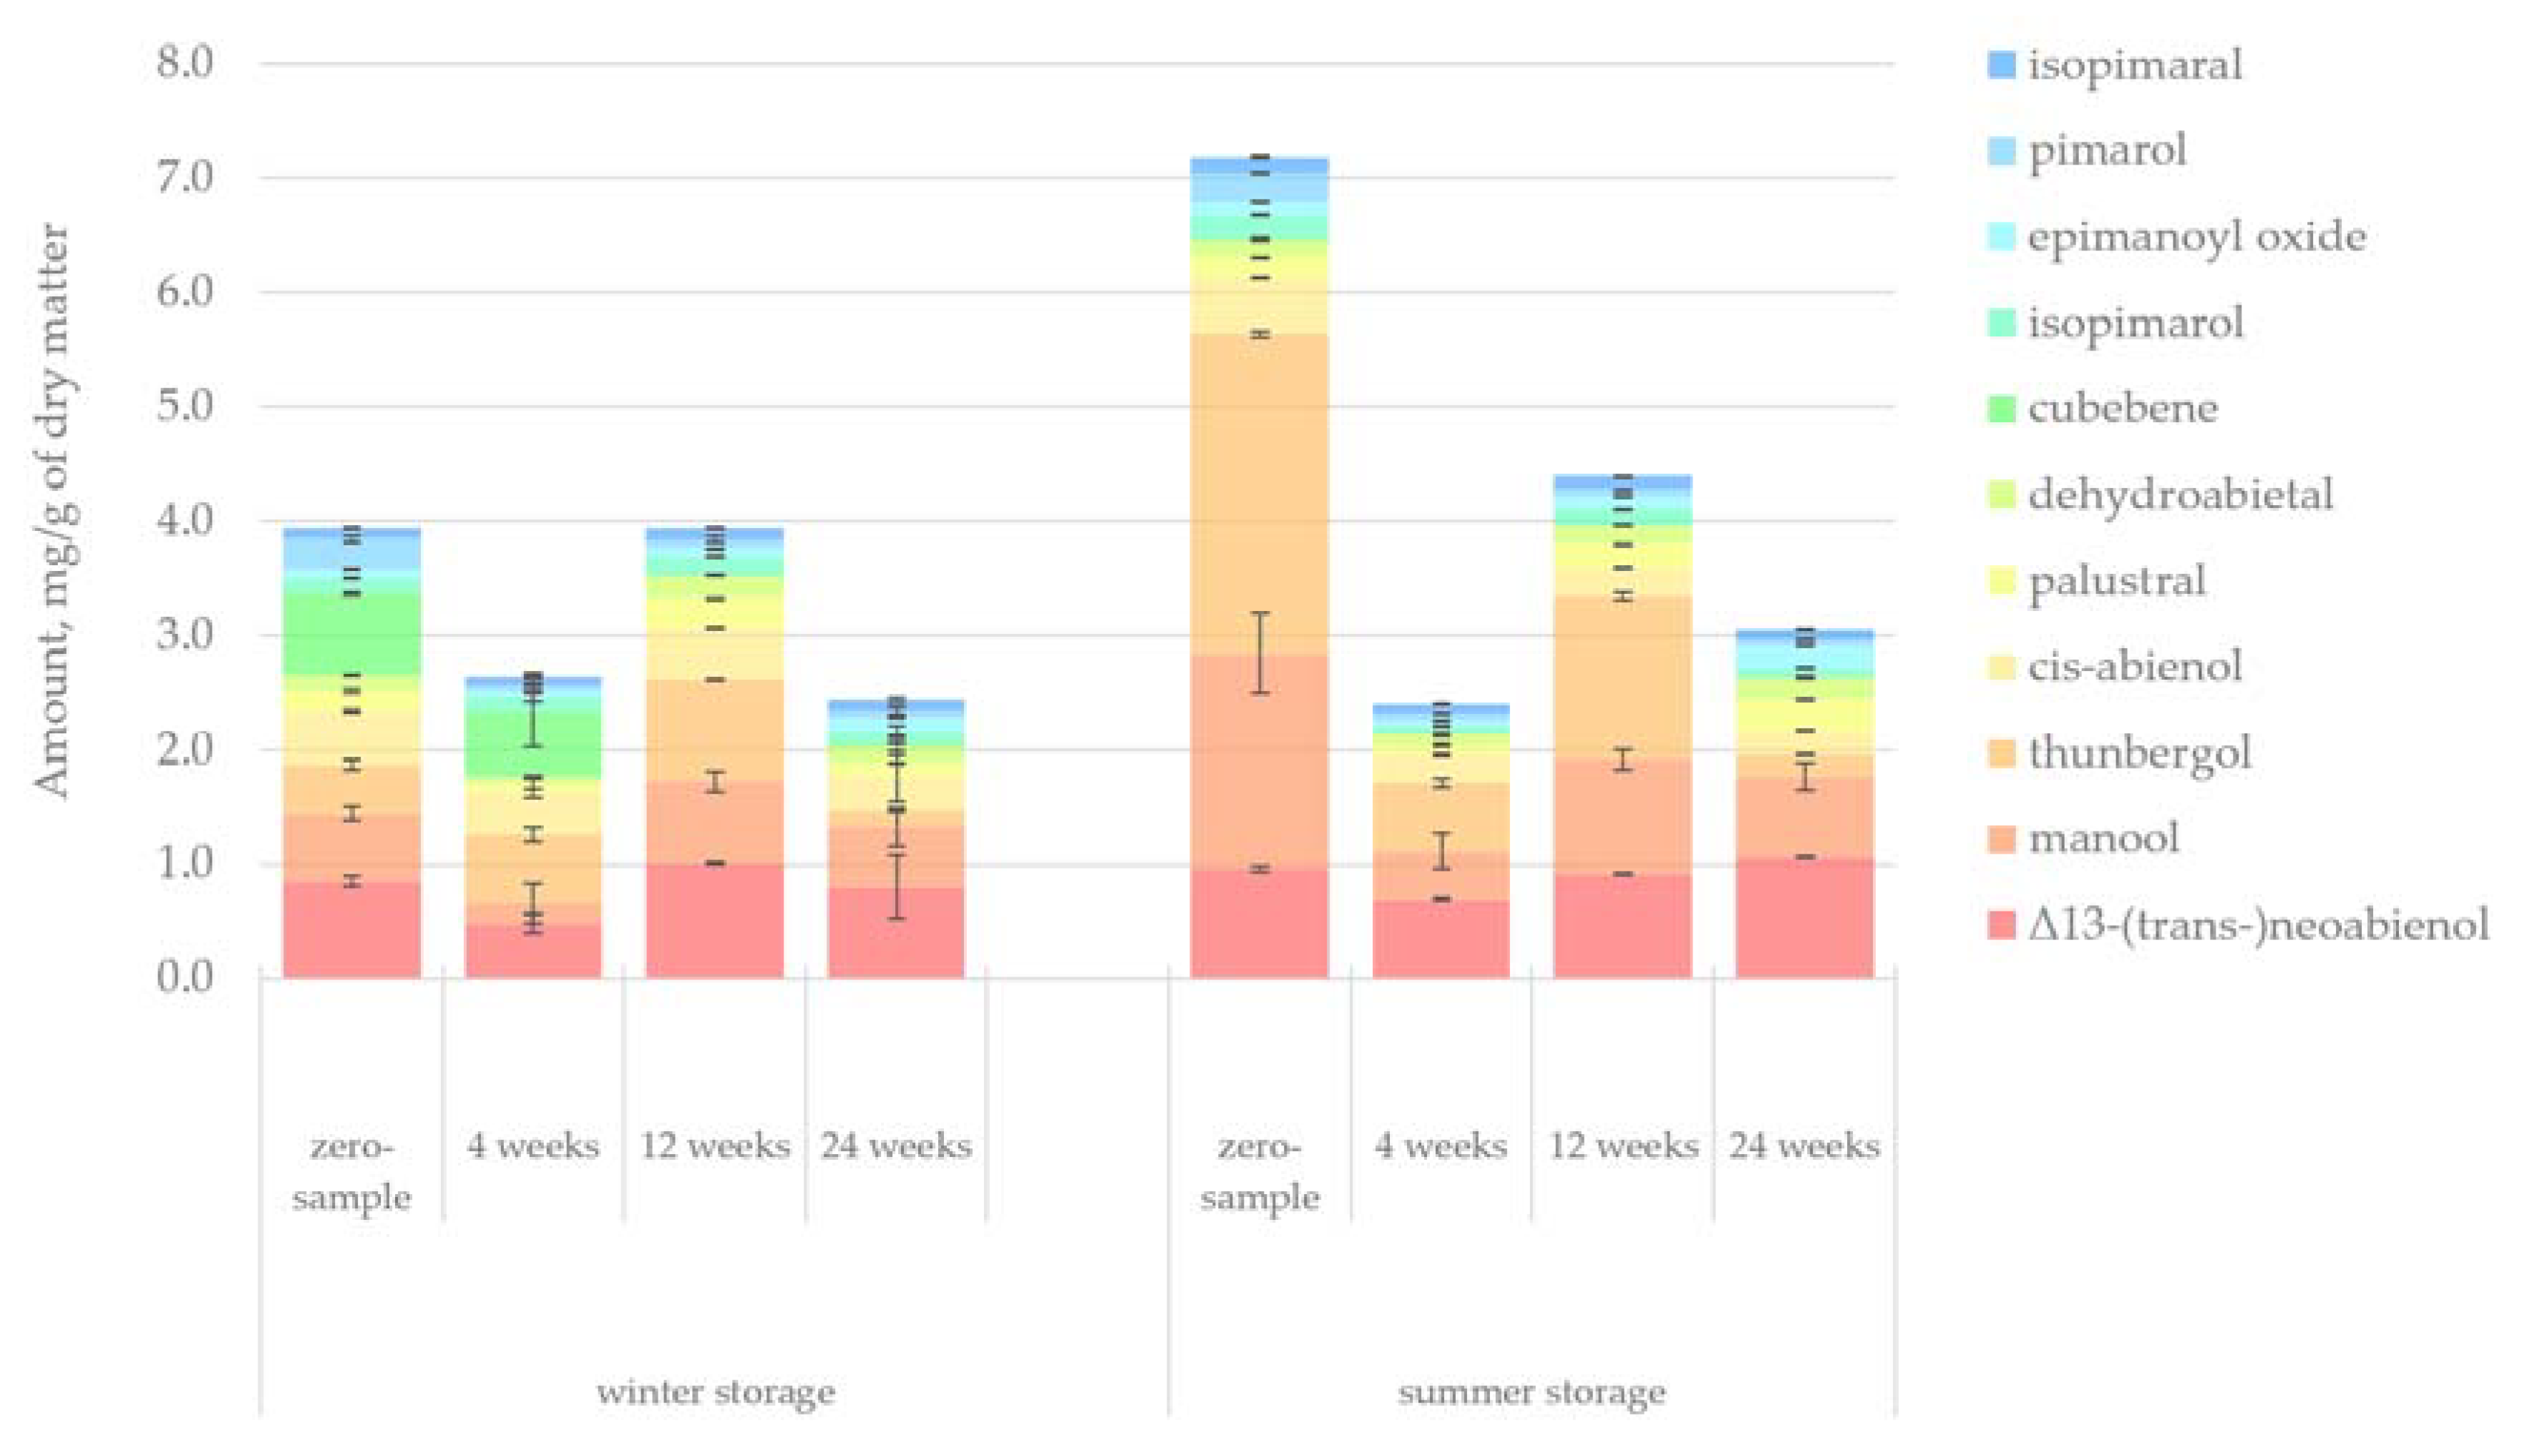
Figure 8 presents the quantified amount of diterpenoids in the lipophilic bark extracts. The total amount of diterpenoids was higher during the summer storage period, especially the amount of manool and thunbergol. Nevertheless, the amount of cubebene appeared to be higher during the winter storage period. As noted before regarding resin acids, samples at week 4 had particularly low concentrations. Despite this variation, the total amount of diterpenoids slowly decreased as the storage period lengthened.
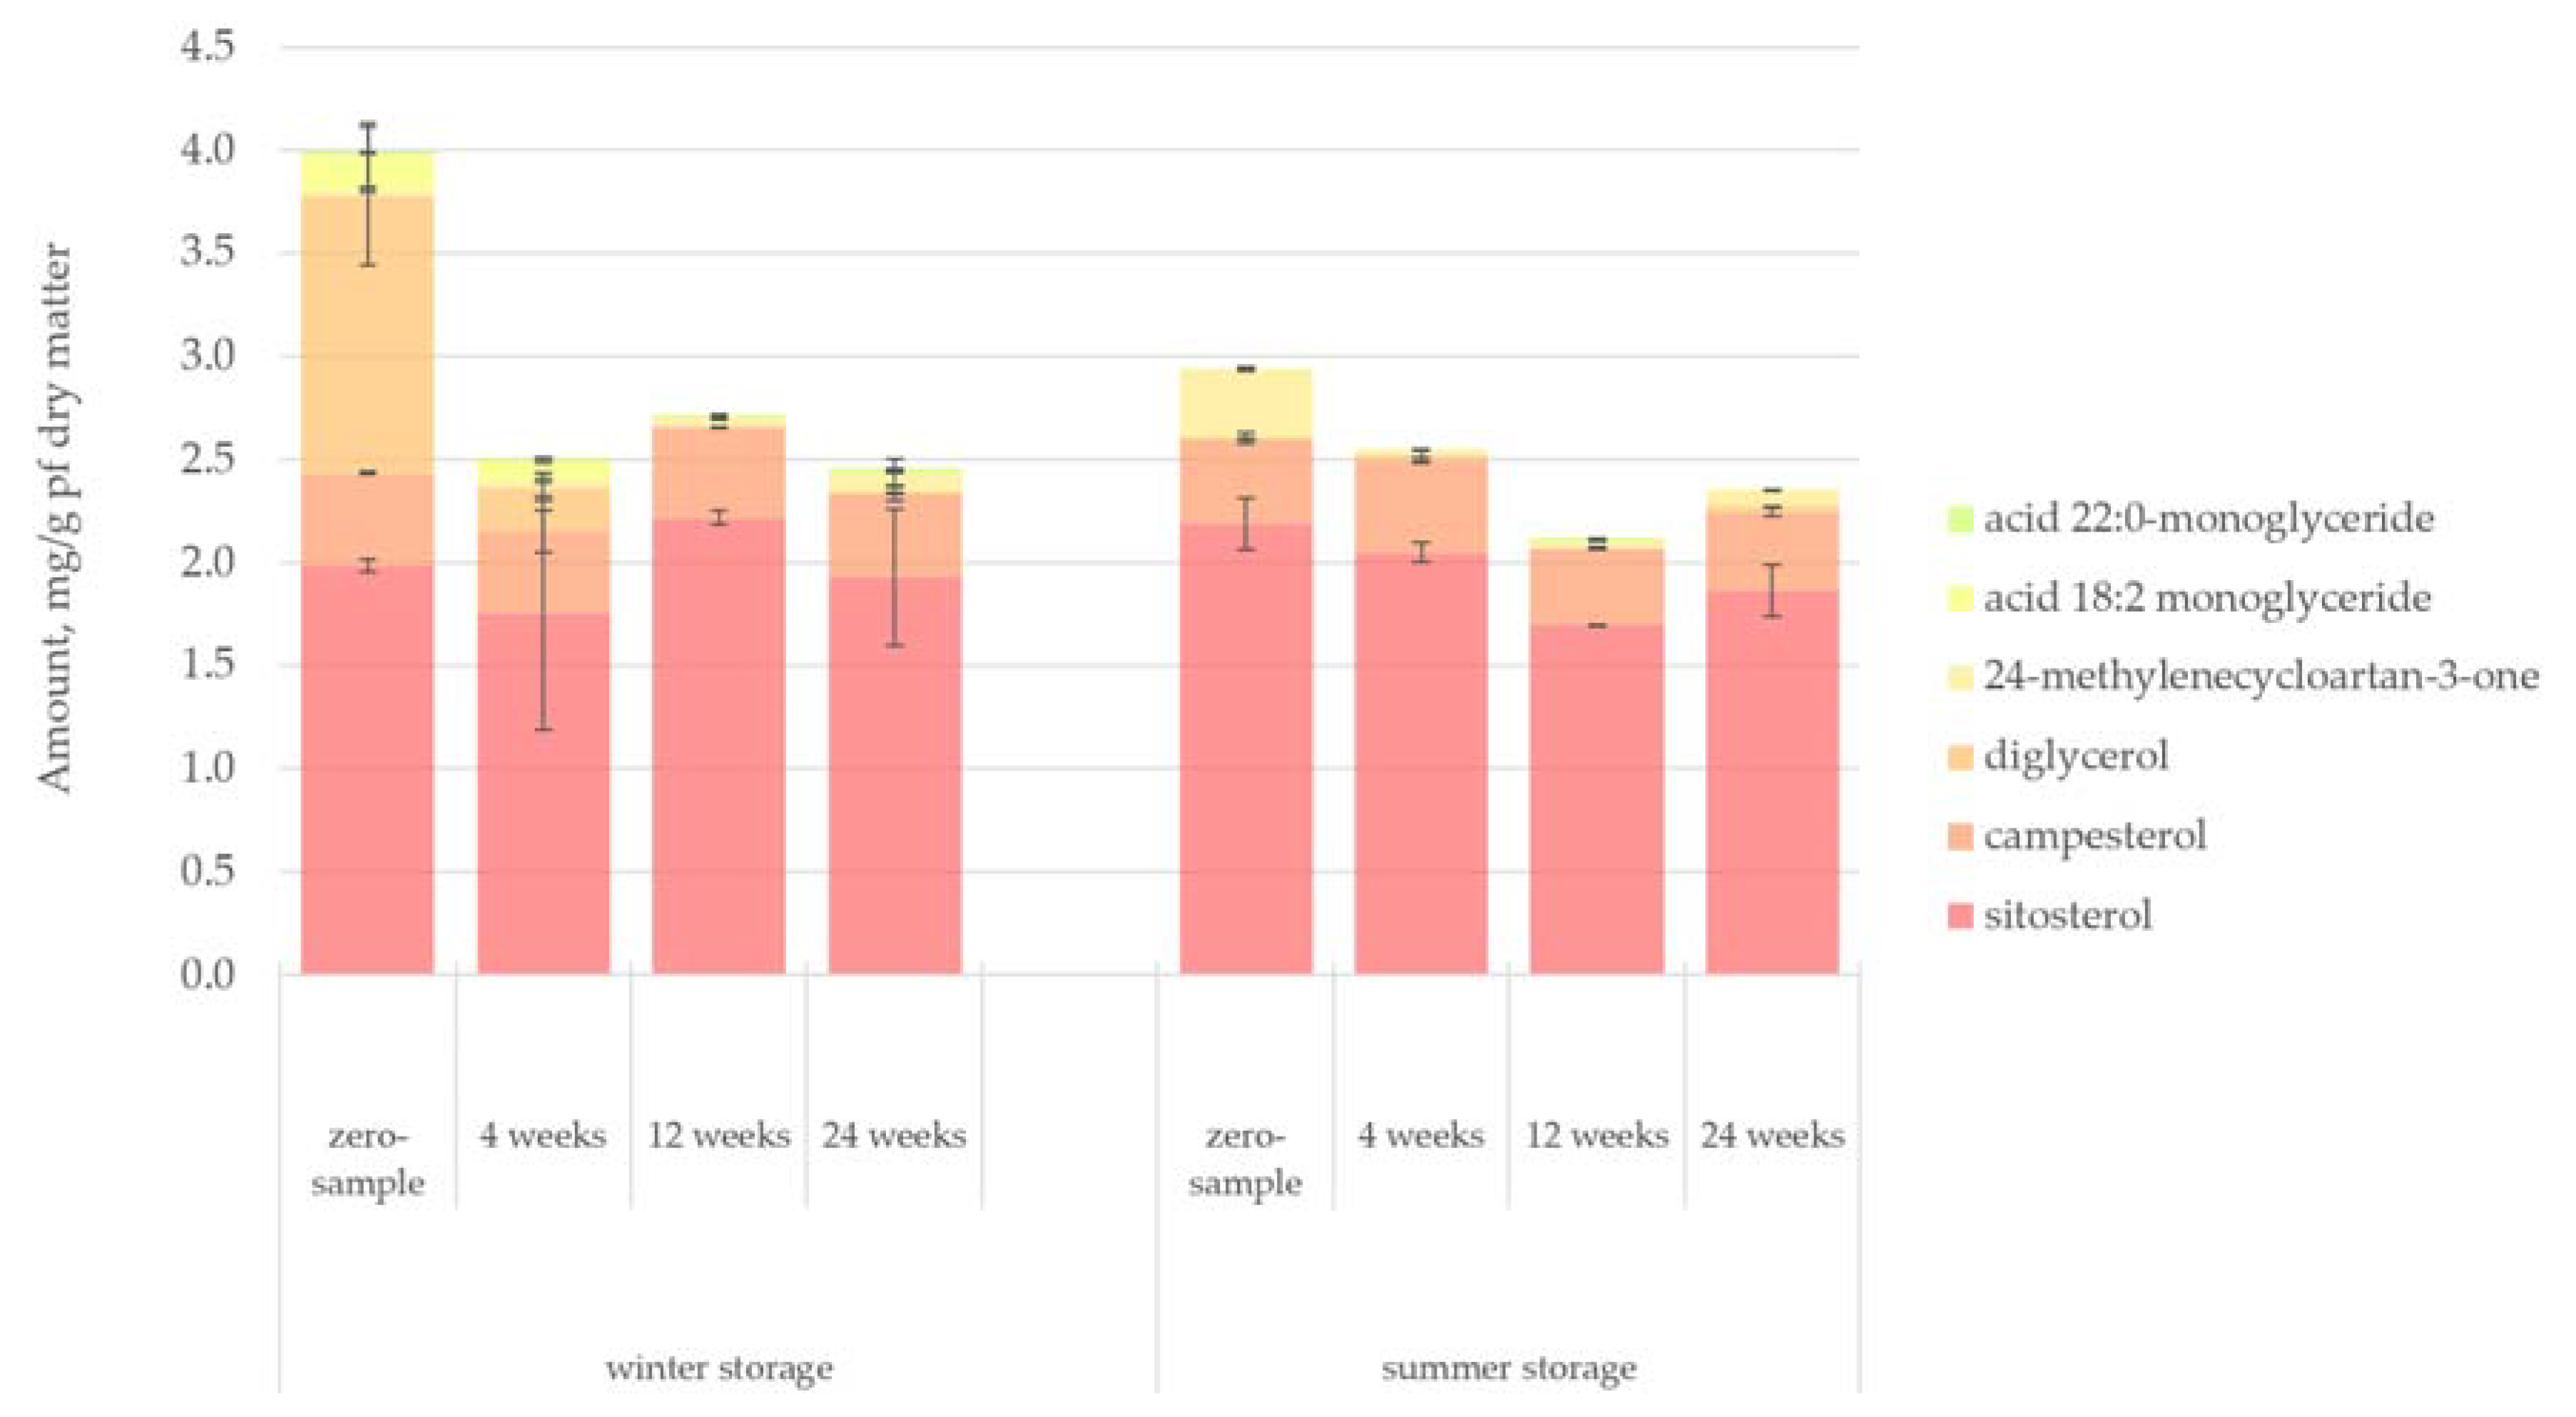
Figure 9 presents the quantified amount of sterols in the lipophilic bark extracts. Sitosterol was the most significant and abundant sterol in spruce bark, while campesterol was overall the second abundant, remaining relatively constant in all samples. Diglycerol appeared with a high concentration on the zero-samples of the winter-stored bark. However, its amount was quickly reduced as the storage period continued and the ambient temperature rose. During the summer storage period, diglycerol could not be detected even at the zero-sample.
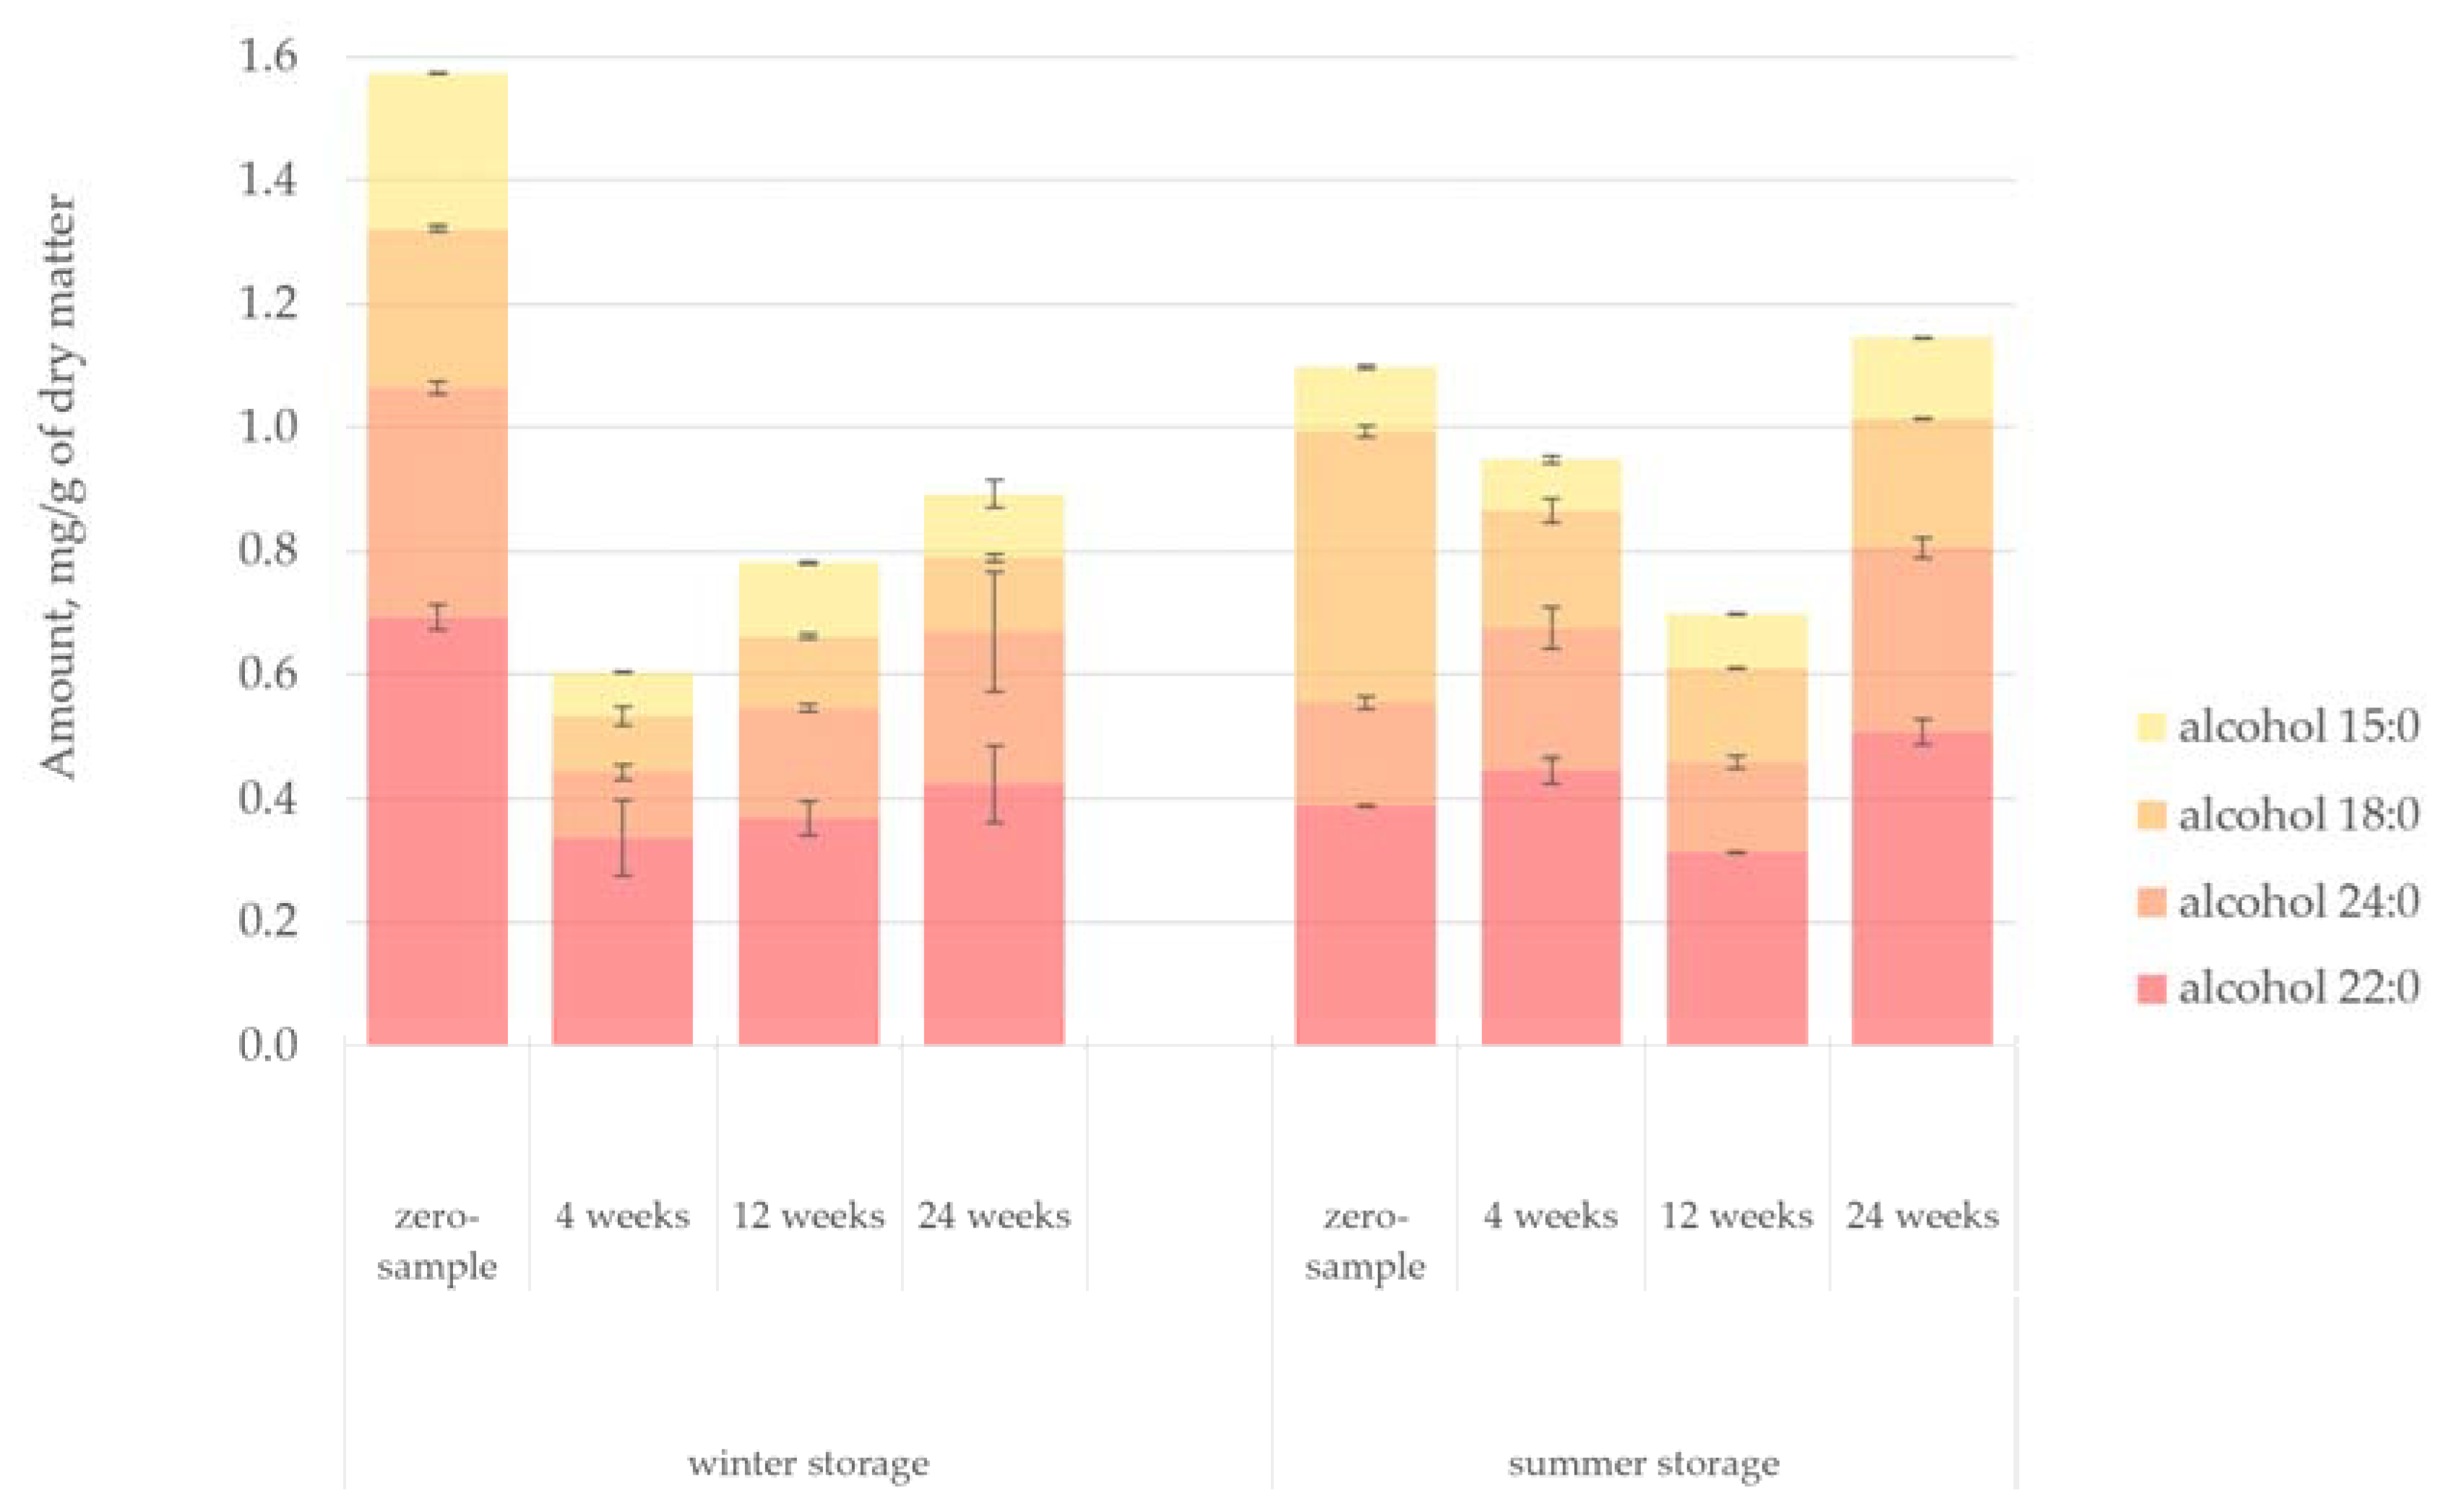
Figure 10 presents the quantified amount of fatty alcohols in the lipophilic bark extracts. The degradation pattern of fatty alcohols in the bark samples paralleled the degradation pattern of sterols, more or less. Particularly high concentration of fatty alcohols (especially alcohol 22:0) was observed at the beginning of the winter storage period. On the other hand, the zero-sample from the summer storage period had a notably high concentration of alcohol 18:0. Although the total amount of fatty alcohols remained stable, after the initial decrease in the amount of fatty alcohols, there appeared to be a slight increase until the end of the storage period. This increase could be explained by the gradual conversion of fatty acids or triglycerides into fatty alcohols.
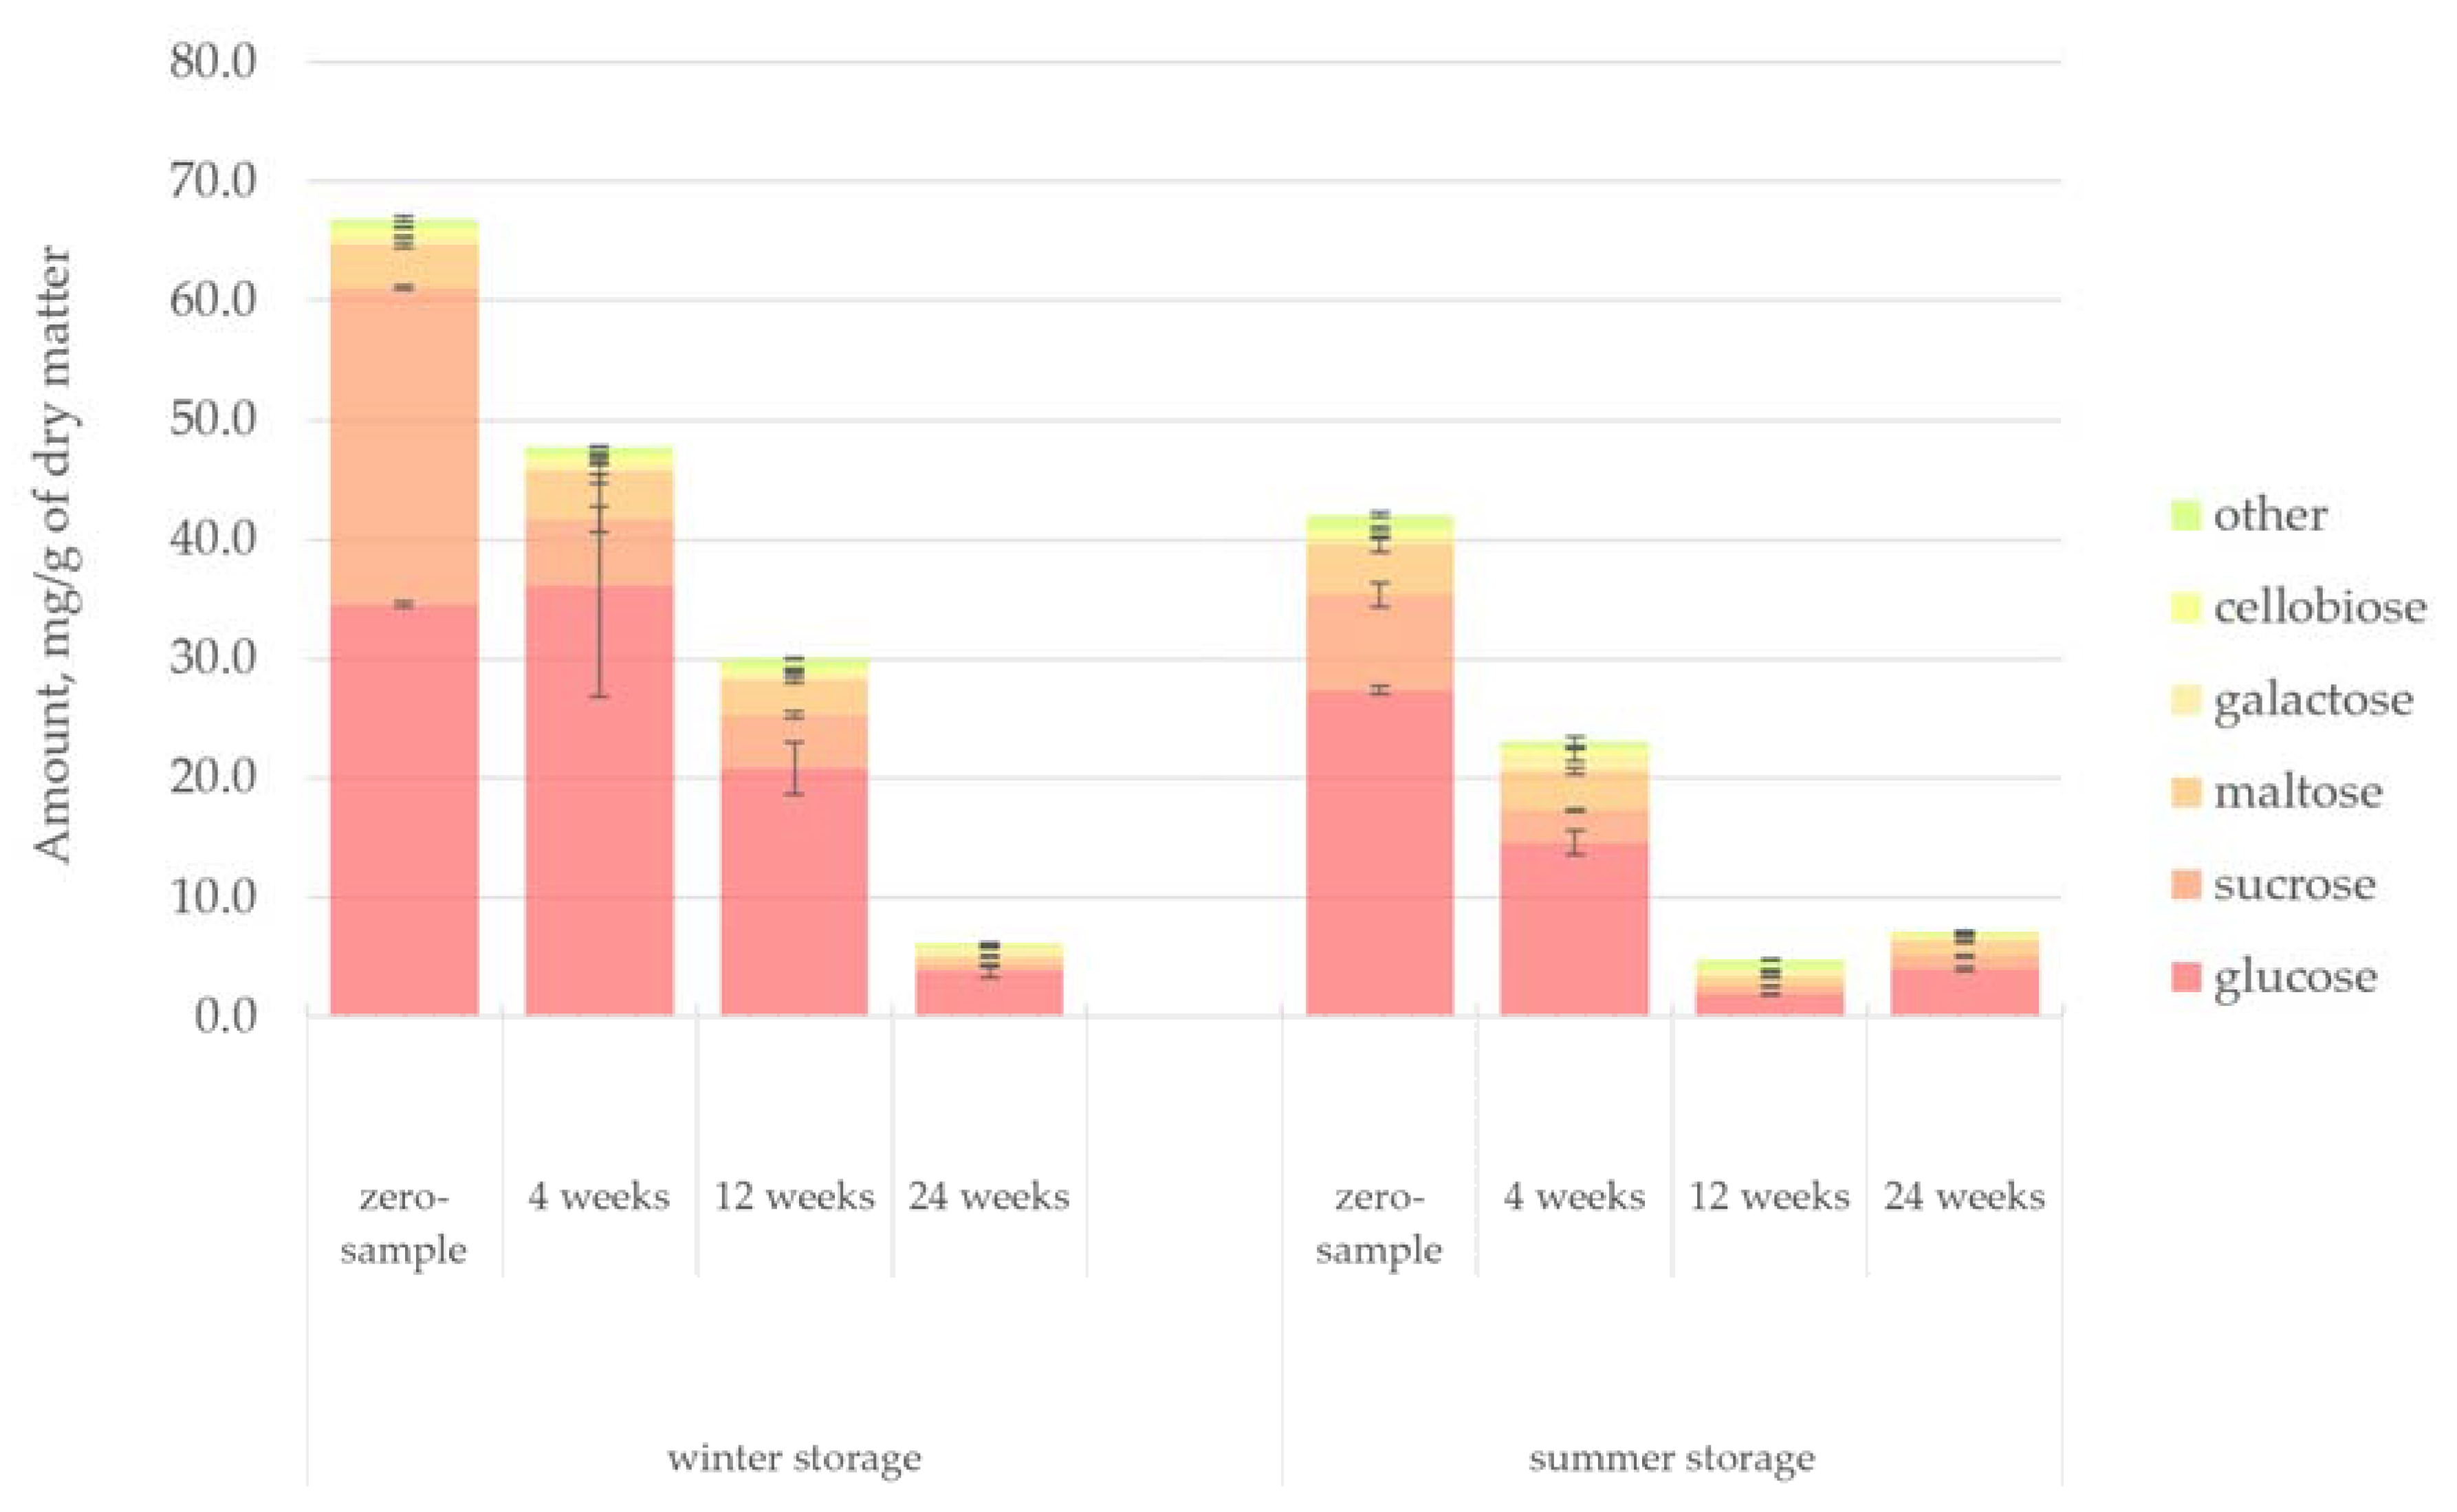
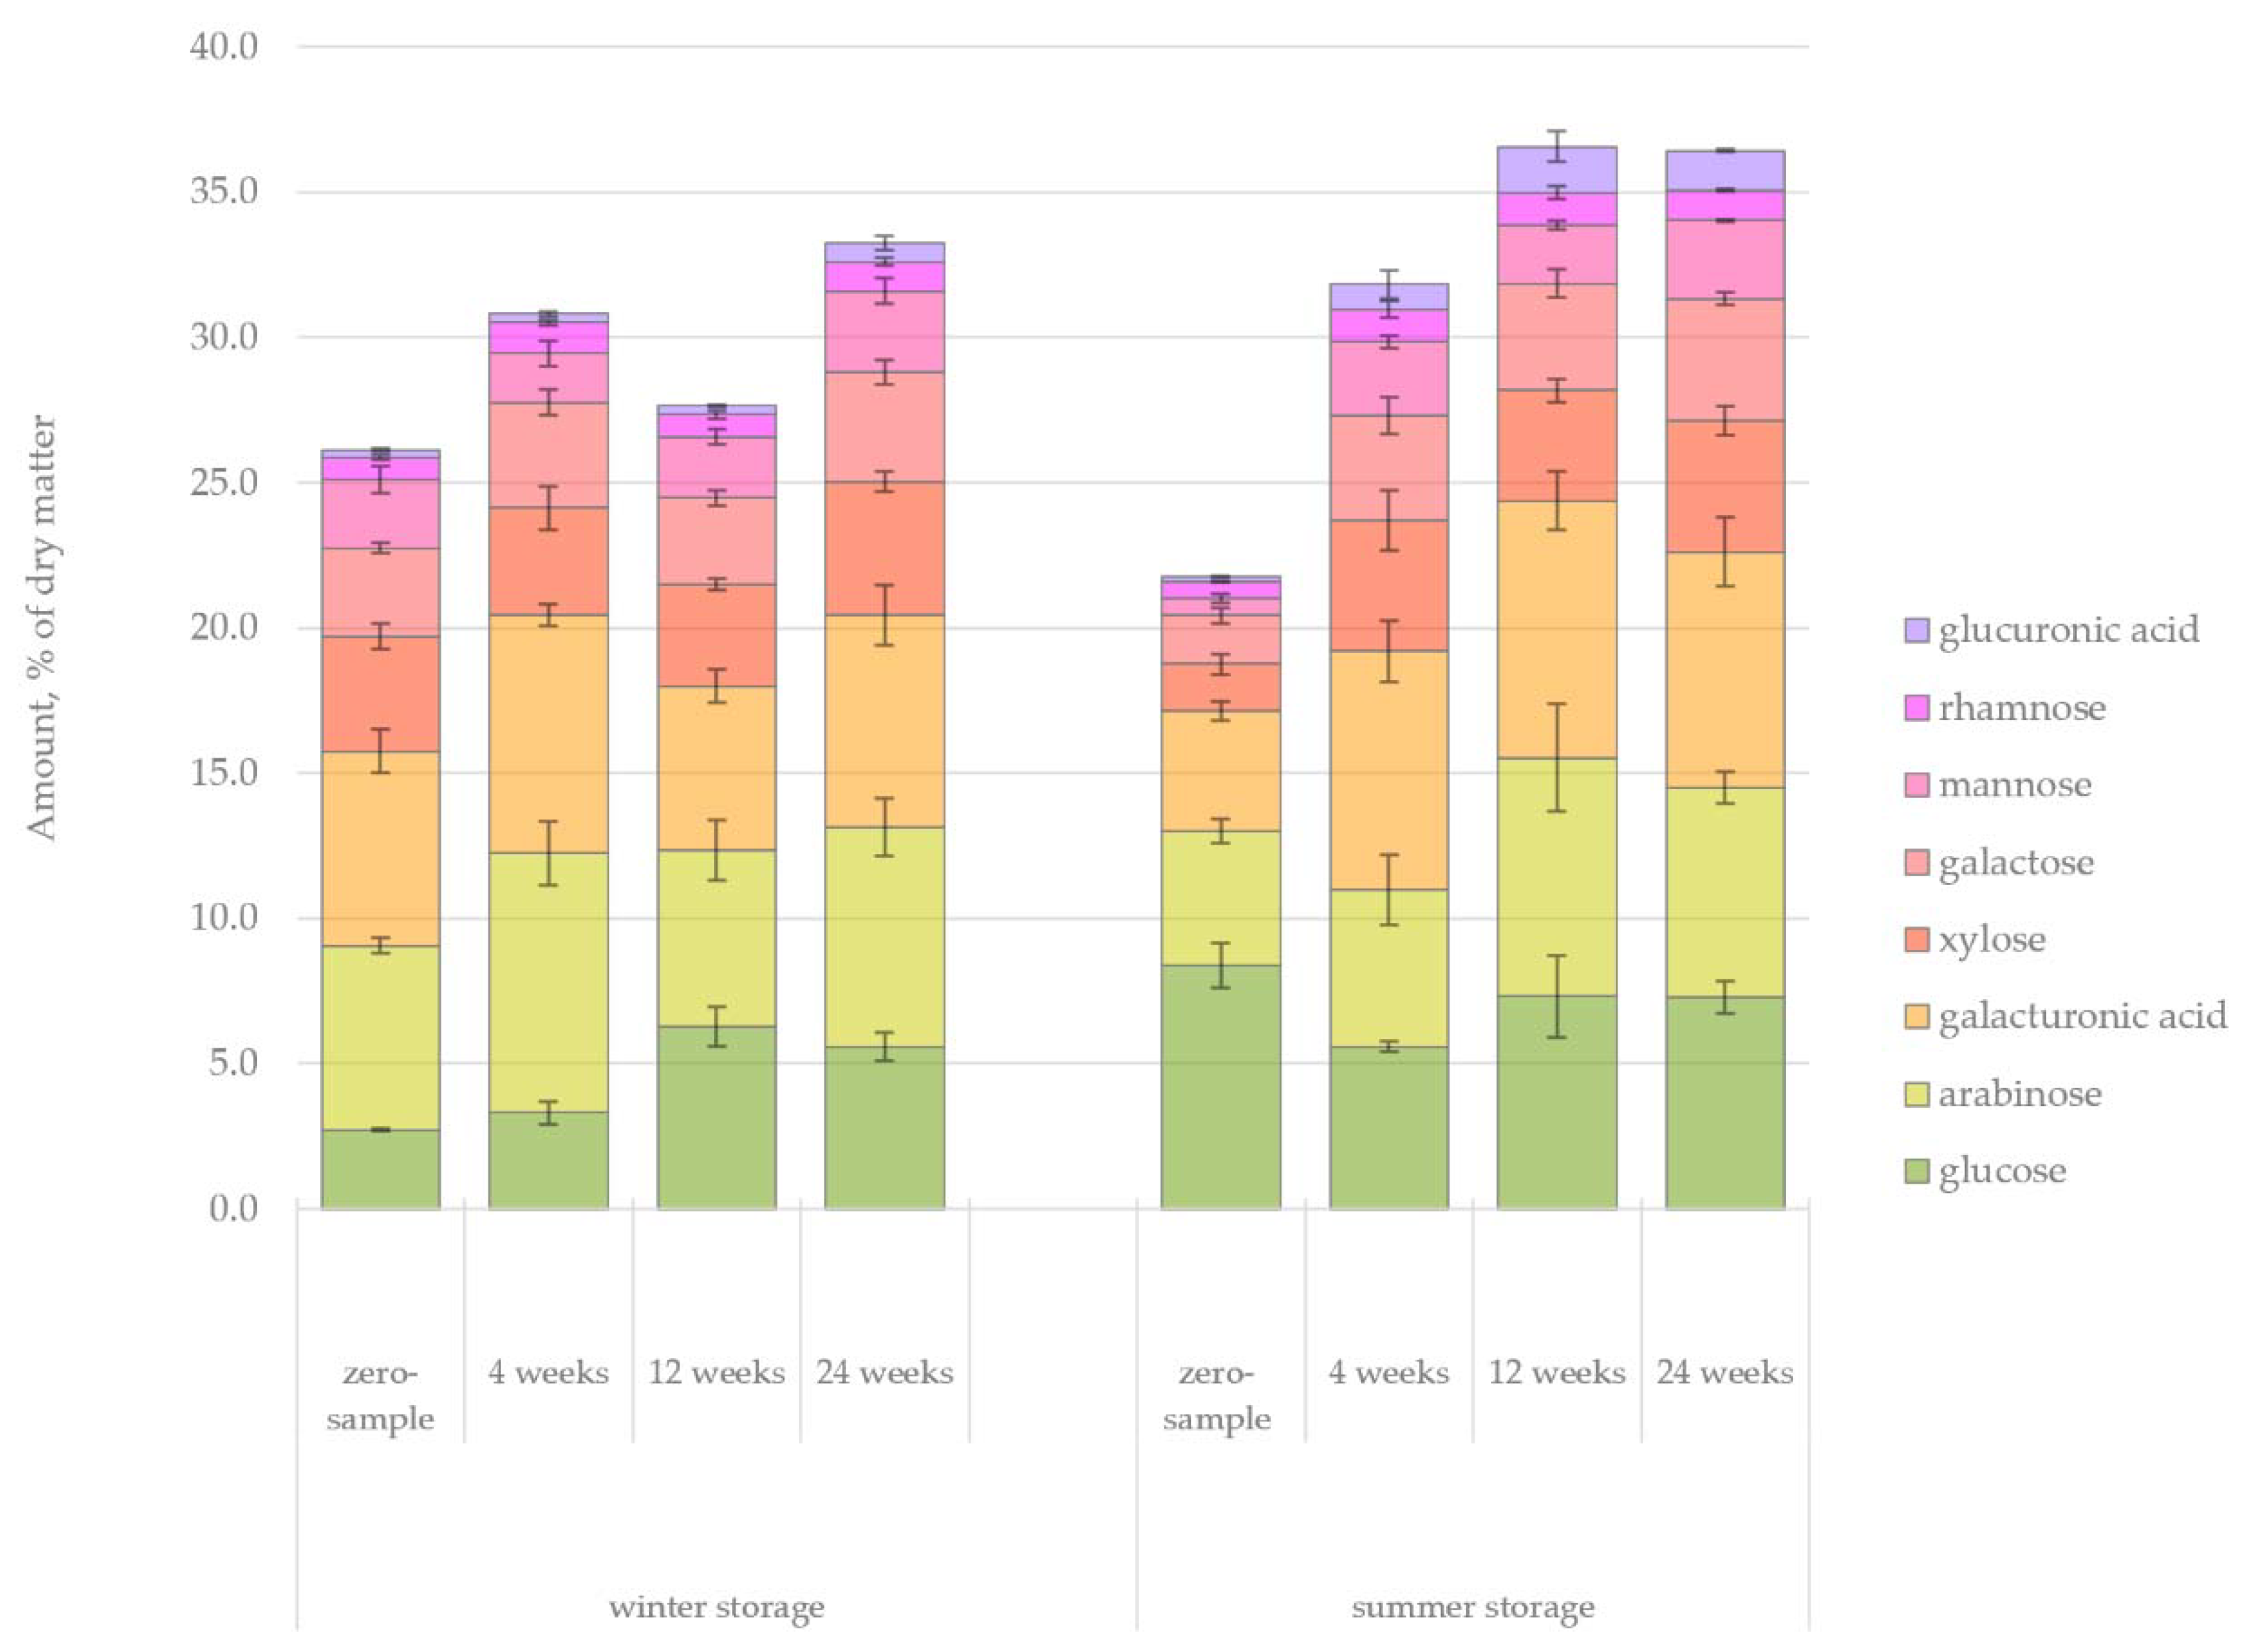
Figure 11 presents the quantified amount of sugars in the hydrophilic bark extracts. The results indicated that the concentration of simple sugars in the extracts decreased systematically and significantly. Similar results have been reported in storage studies of wood [
45]. Glucose and sucrose alone made up most of the detected sugars. A clear difference could be noticed in the initial sugar concentration between the winter- and summer-stored bark. The winter-stored bark had a 37% higher sugar concentration initially. Saccharides are especially prone to degradation since they could easily be leached out by rain and provide an excellent nutrient source for micro-organisms. The enhanced activity of micro-organisms during warm seasons also explains the more significant reduction of saccharides observed during the summer storage period.
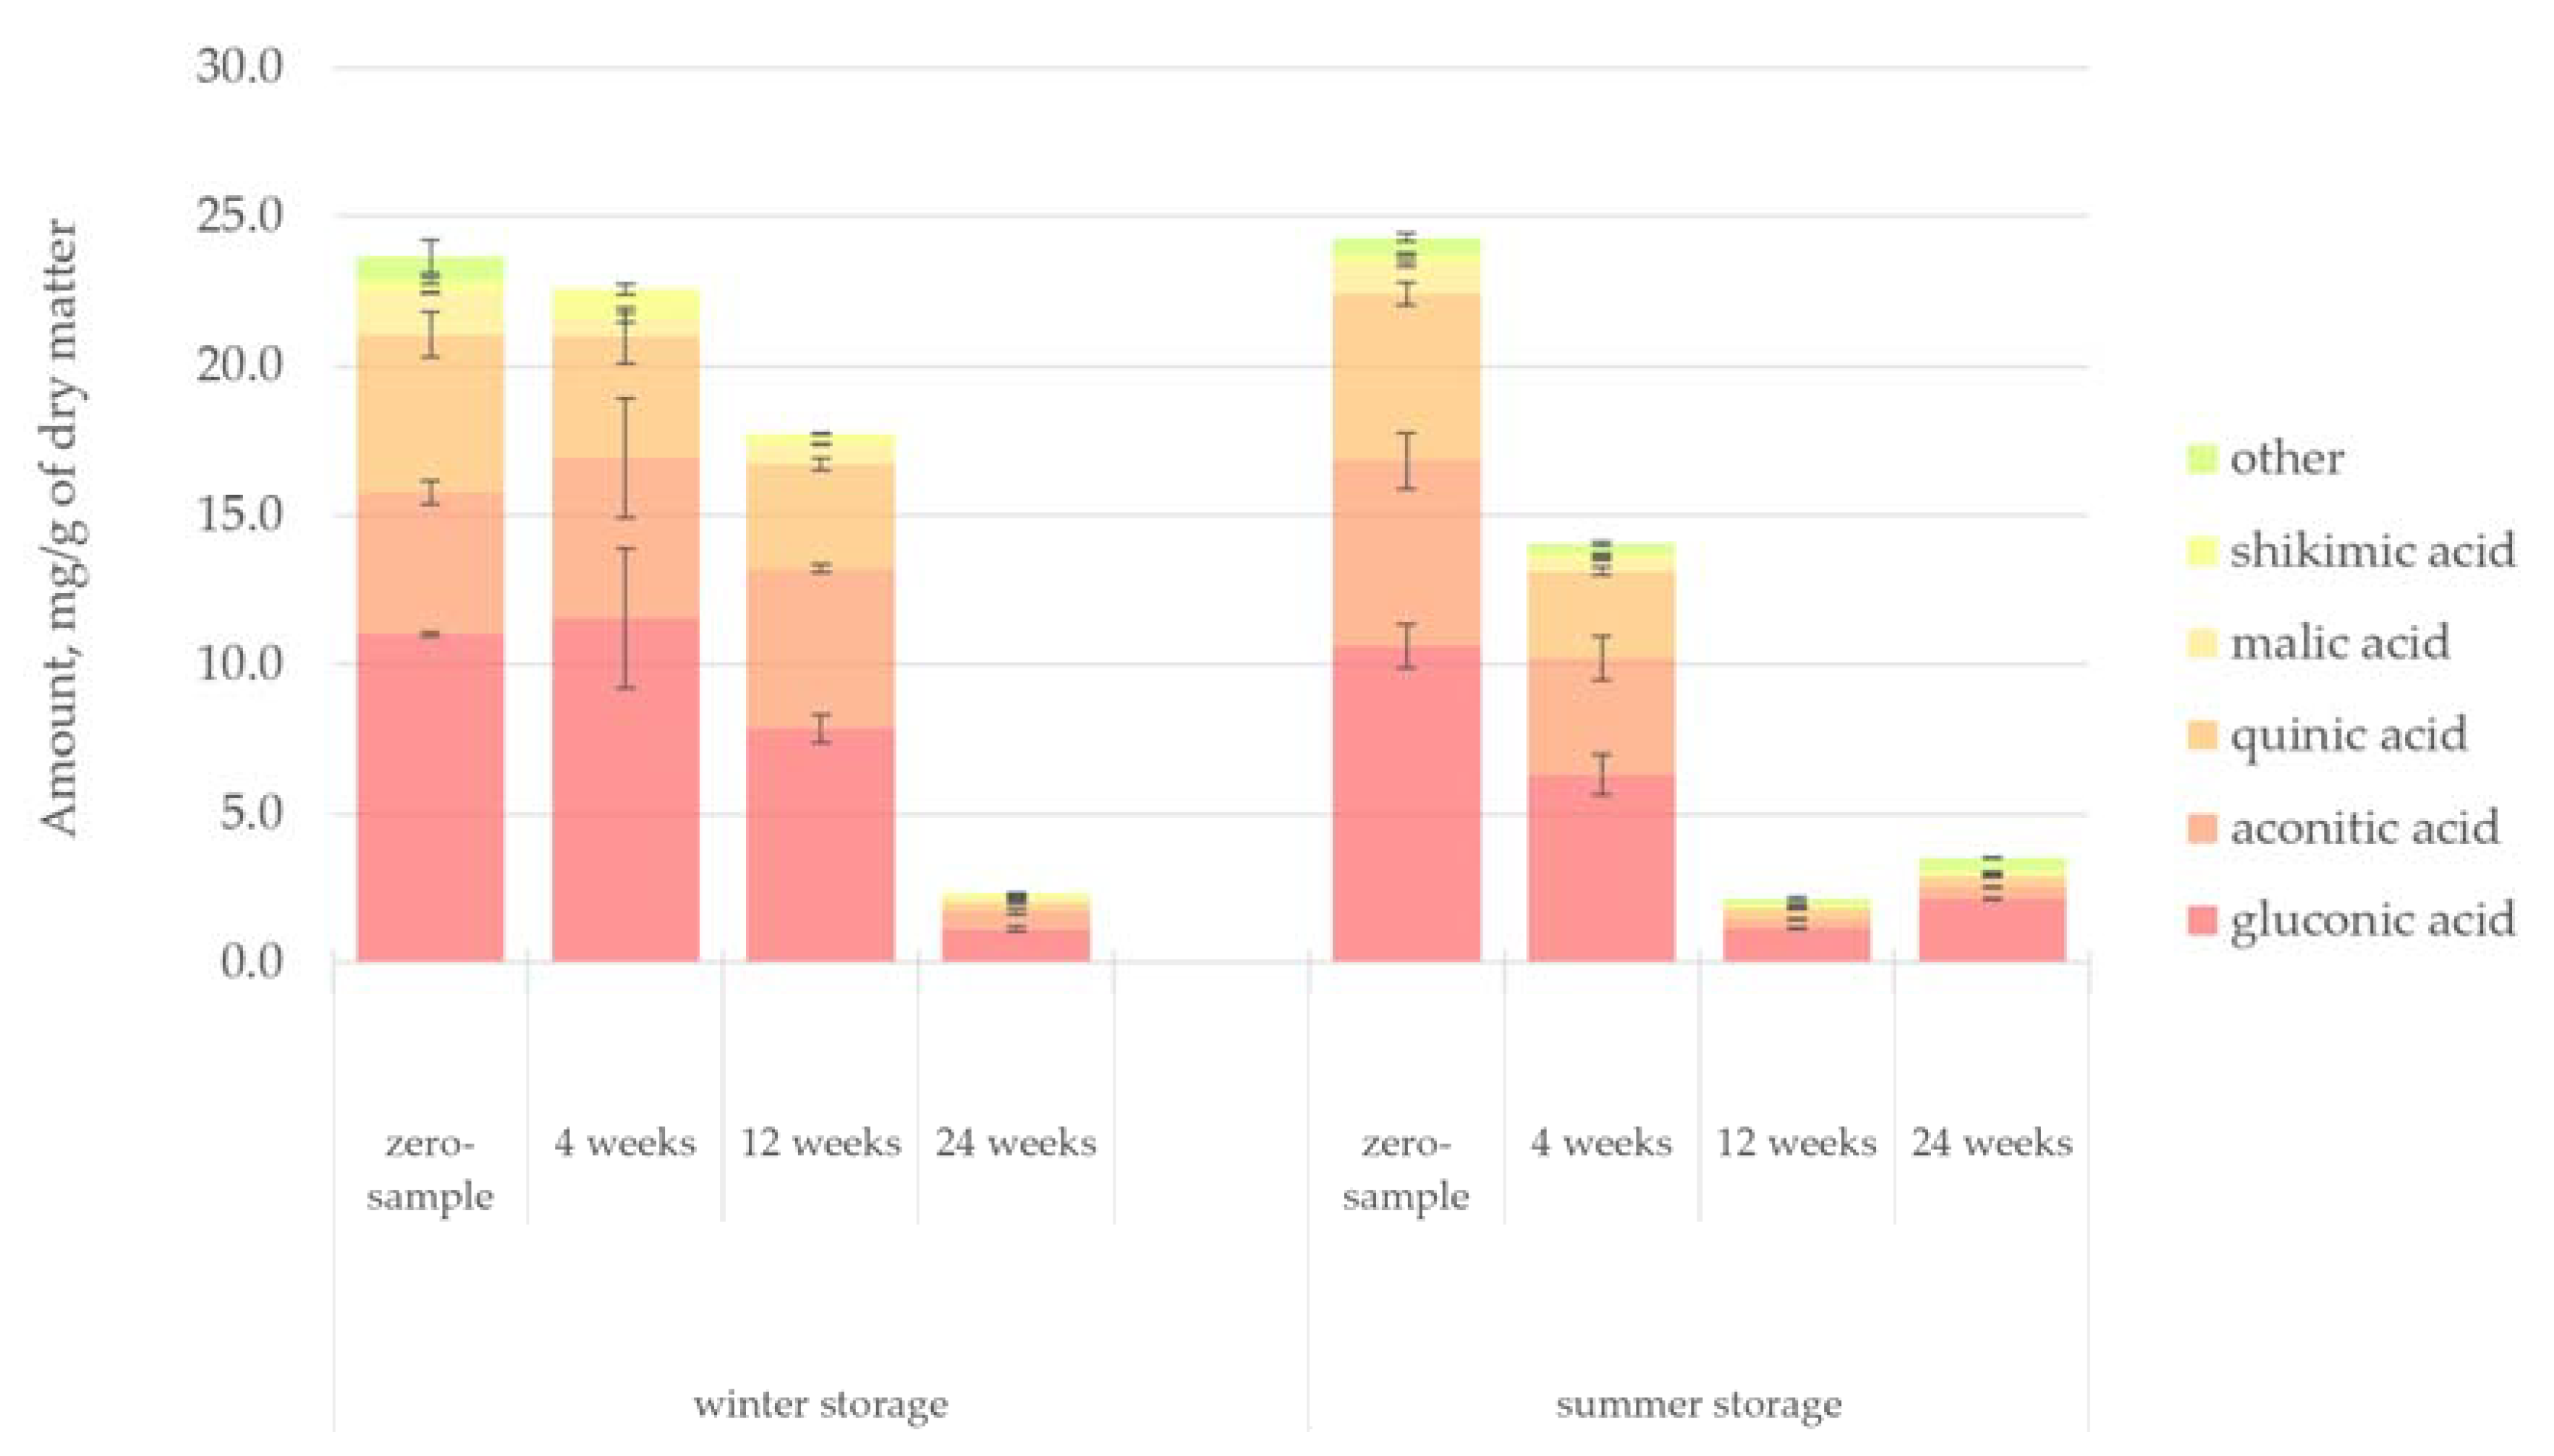
Figure 12 presents the quantified amount of organic acids in the hydrophilic bark extracts. Gluconic, aconitic and quinic acids accounted for most of the organic acids present in the hot-water extract of spruce bark. Gluconic acid was found to be the most abundant organic acid, probably related to the high glucose level in the bark samples. It has been shown that gluconic acid may be obtained by the oxidation of glucose catalysed by the glucose oxidase enzyme [
46]. The degradation pattern of organic acids followed that of the sugars, although the initial amount of organic acids in bark during storage was not affected by season. The degradation of organic acids was slower than that of sugars, but again a clear difference in degradation rate was observed between the winter and summer storage. The winter-stored bark retained 76% of the original amount of organic acids until 12 weeks of storage, while there was a 42% decrease in the concentration of the organic acids during the first 4 weeks of the summer storage period.
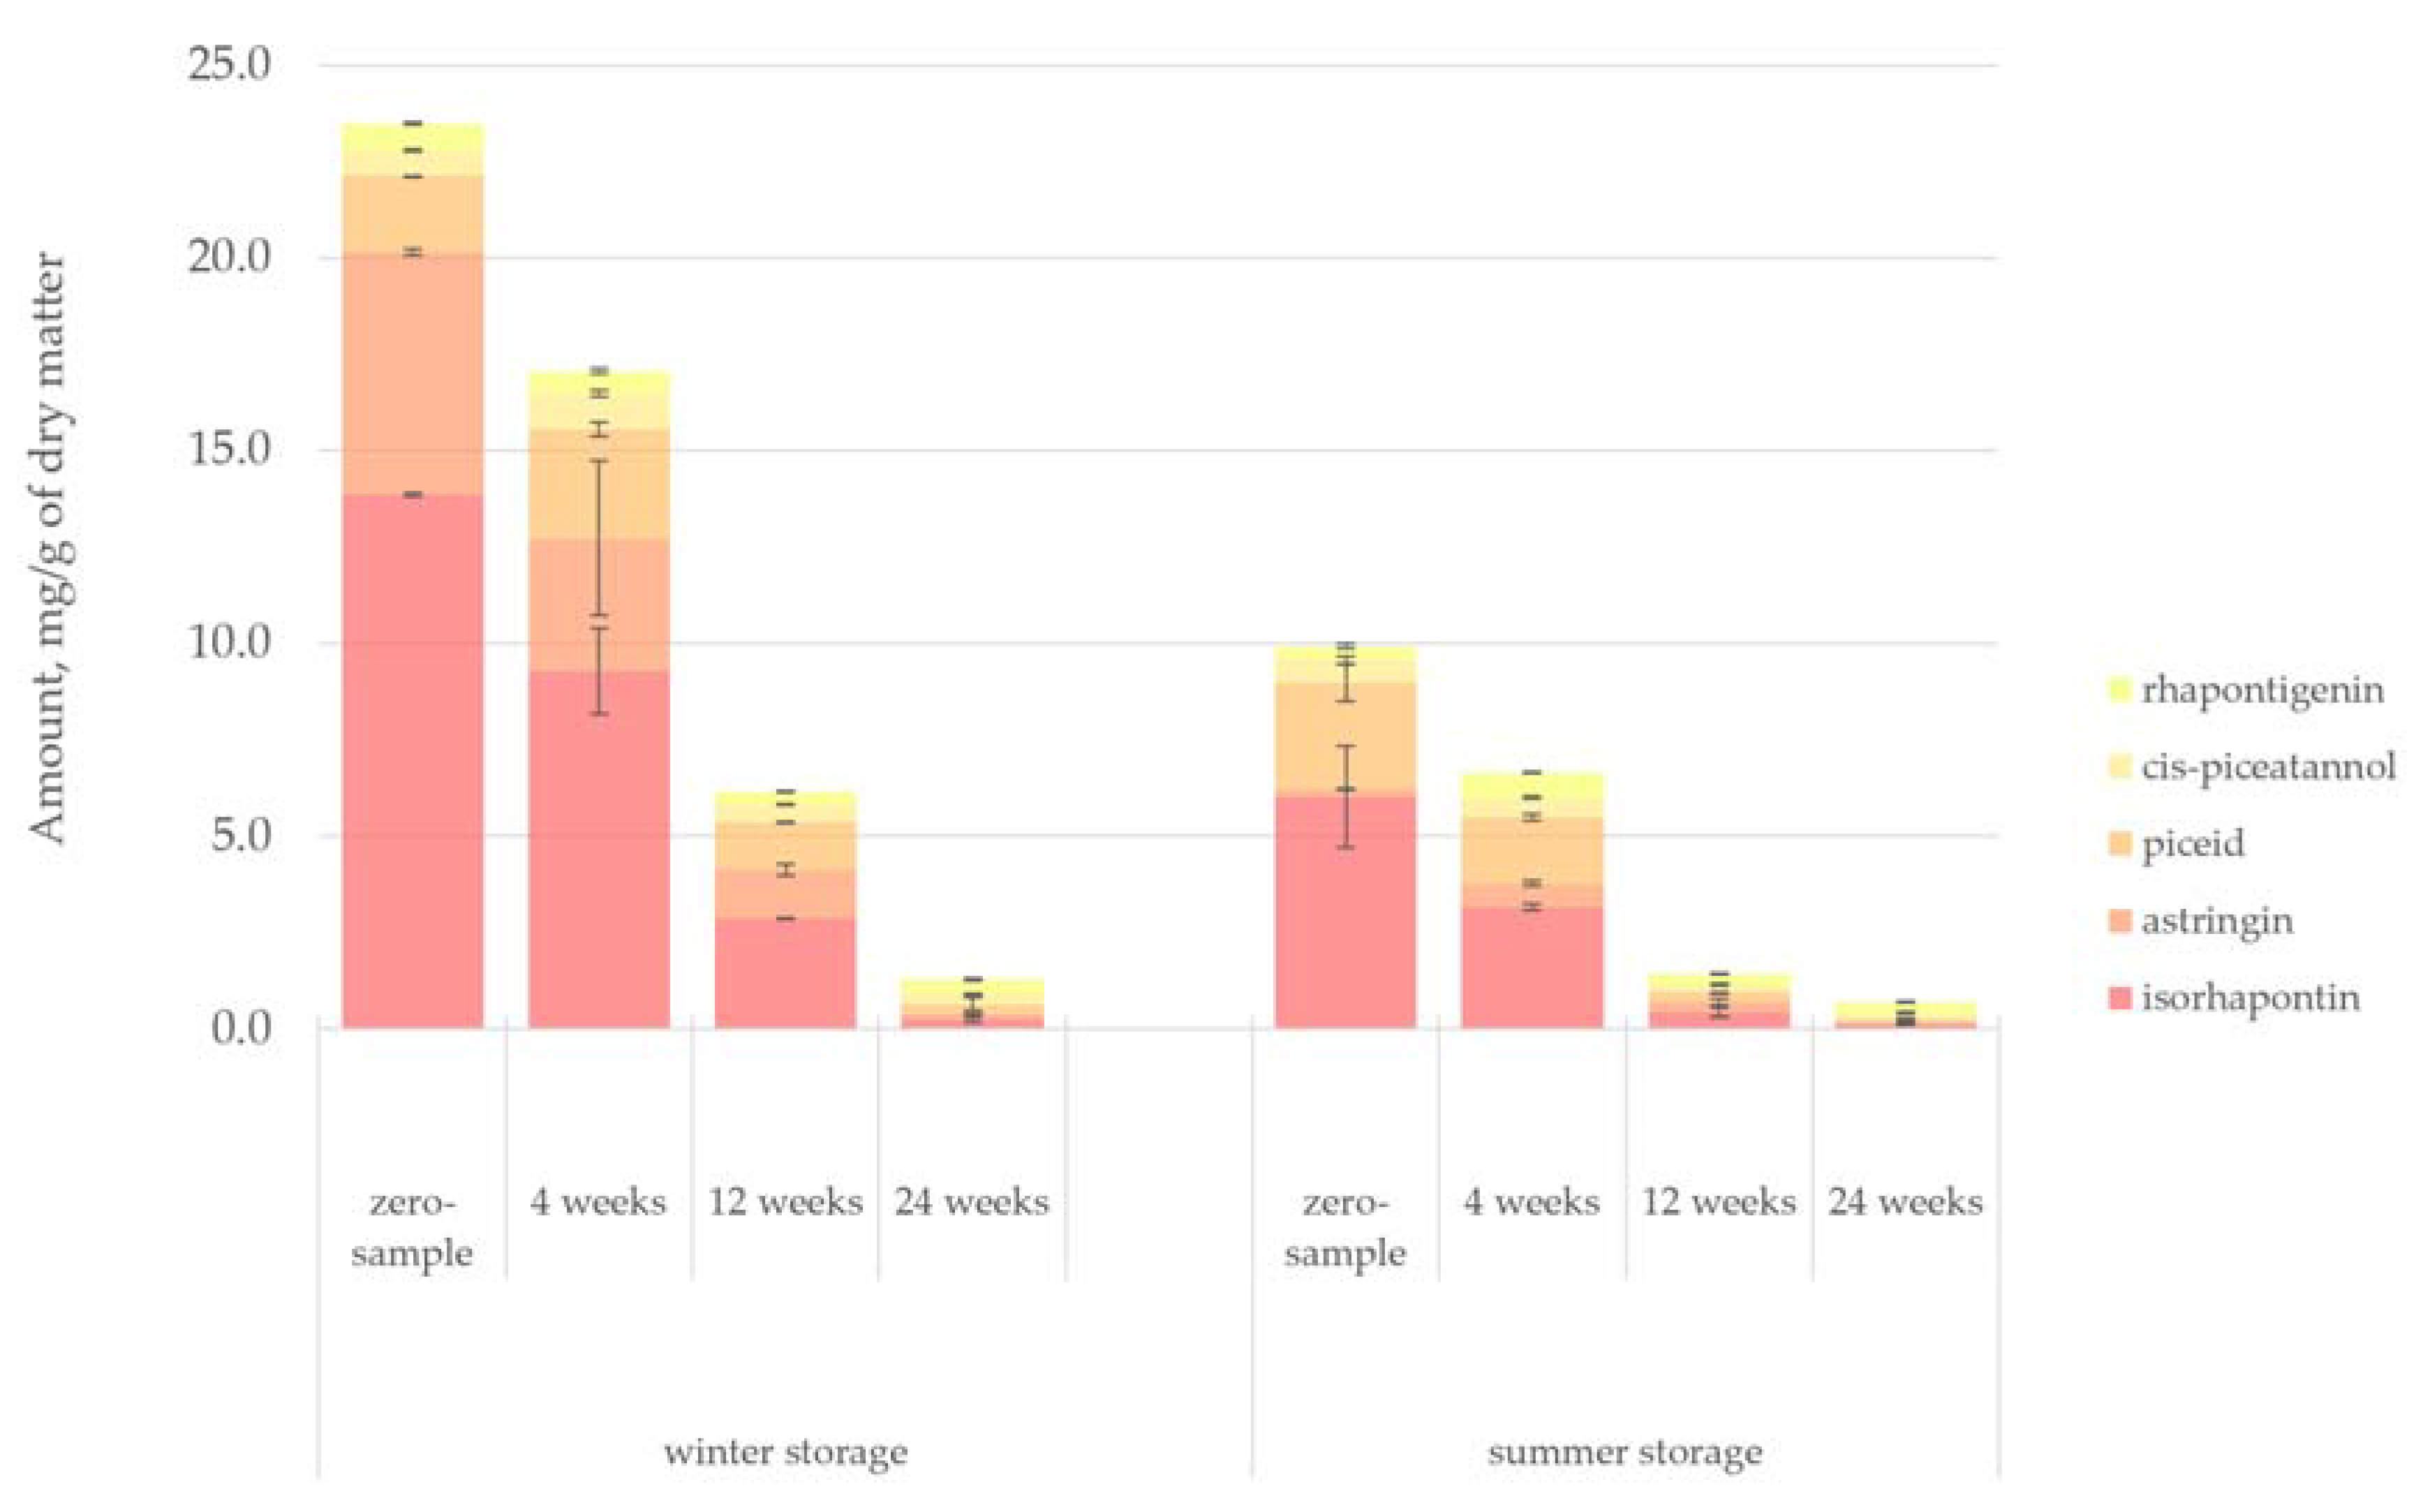
Figure 13 presents the quantified amount of stilbene glucosides (by long column GC-FID) in the hydrophilic bark extracts. Stilbenes from conifer bark have been the focus of many previous studies, giving them promise as platform chemicals and antifungal agents [
2,
25,
32,
47,
48,
49]. The three primary stilbene glucosides in spruce bark, isorhapontin, astringin and piceid, along with the stilbene aglycones
cis-piceatannol and rhapontigenin, were identified. The total amount of stilbenes was 23.5 mg/g of dry bark in the winter storage zero-sample and 9.9 mg/g of dry bark in the summer storage zero-sample. Gabaston et al. [
32] reported a similar concentration (18.5 mg/g of bark) in a sample stored for 1 month in the dark. On the other hand, much higher stilbene concentrations have been reported on the root bark of Norway spruce [
48].
The degradation of the stilbene glucosides and aglycones in the bark samples followed a similar pathway as seen for the sugars. The evident influence of the season was seen in that the zero-sample of the summer-stored bark contained 58% fewer stilbenoids than the zero-sample of the winter-stored bark. However, the degradation rate of stilbenoids was approximately the same during both winter and summer.
Stilbenes are known for being sensitive to UV light and may easily undergo photocatalysed
cis/trans isomerisation and rearrangement reactions to form phenanthrene structures [
17,
18,
50]. Because of exposure to an increased amount of UV light and higher temperatures during the summer storage period, the loss of stilbenes would be expected to be amplified. Lesions exposing the inner bark (e.g., those caused during harvesting) would be expected to increase stilbenes’ degradation because they are primarily located on the inner bark [
49]. Increased microbiological activity during summer also explains the reduction of stilbenes because, although stilbenoids are antimicrobial by nature, they are not inert to microbial or enzymatic degradation. The increased UV light appeared to have a particularly significant effect on the level of the stilbenoid astringin. Astringin had a substantially lower concentration during the summer, but during winter, it was the second most abundant stilbenoid after isorhapontin.
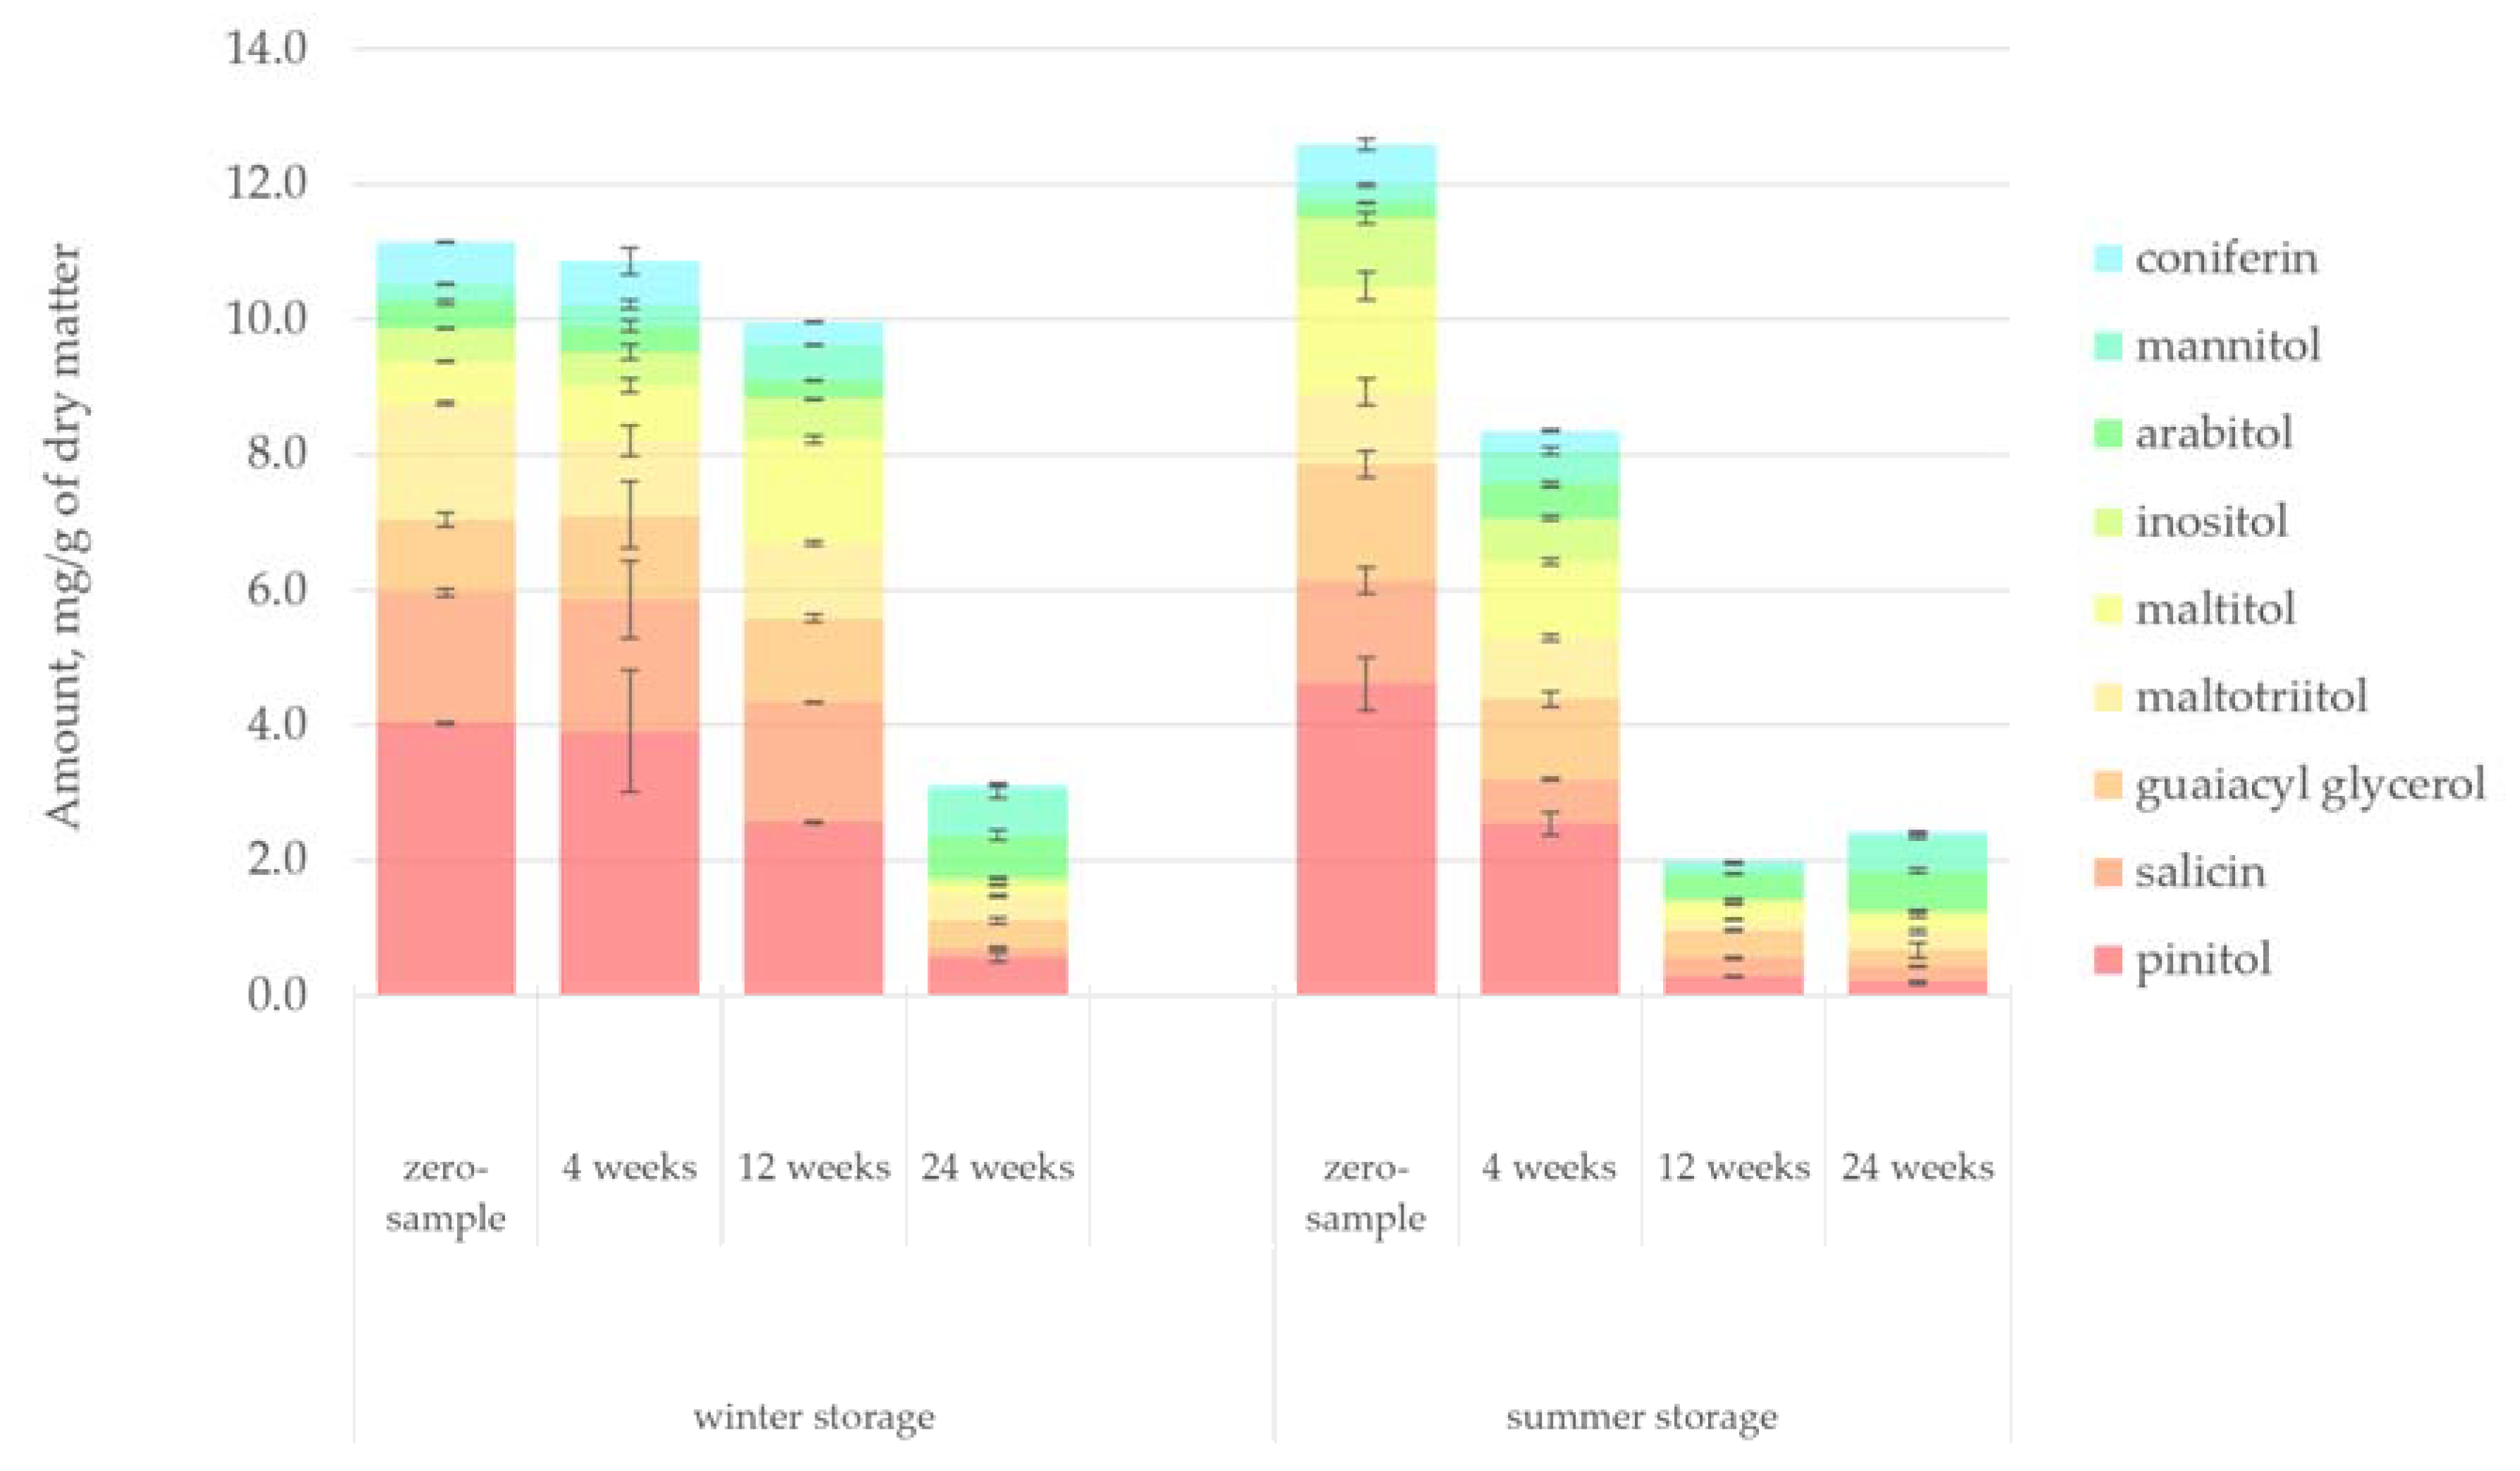
Figure 14 presents the quantified amount of alcohols in the hydrophilic bark extracts. The degradation pattern of alcohols in the saw log bark during storage closely resembled that of organic acids. Most of the alcohols found in the hot-water extract, including pinitol, maltotriitol, maltitol, inositol, arabitol and mannitol, were sugar alcohols. It was evident that temperature dramatically affected the reduction of alcohols. During the winter storage period, until week 12 (i.e., when the ambient temperature according to
Figure 2 was approximately 5 °C), the amount of alcohols remained relatively high. However, during the summer storage period, the amount of alcohols decreased by 34% immediately after 4 weeks of storage. The slight increase in the level of alcohols during the summer storage period from week 12 to 24 (a similar pattern as was seen for organic acids, sugars and flavonoids) could be explained by the natural variance between the saw logs (e.g., the age of the trees). However, the decrease in the summer storage ambient temperature from week 12 to 24 (from 13 °C to 0 °C according to
Figure 2) could also explain the results.
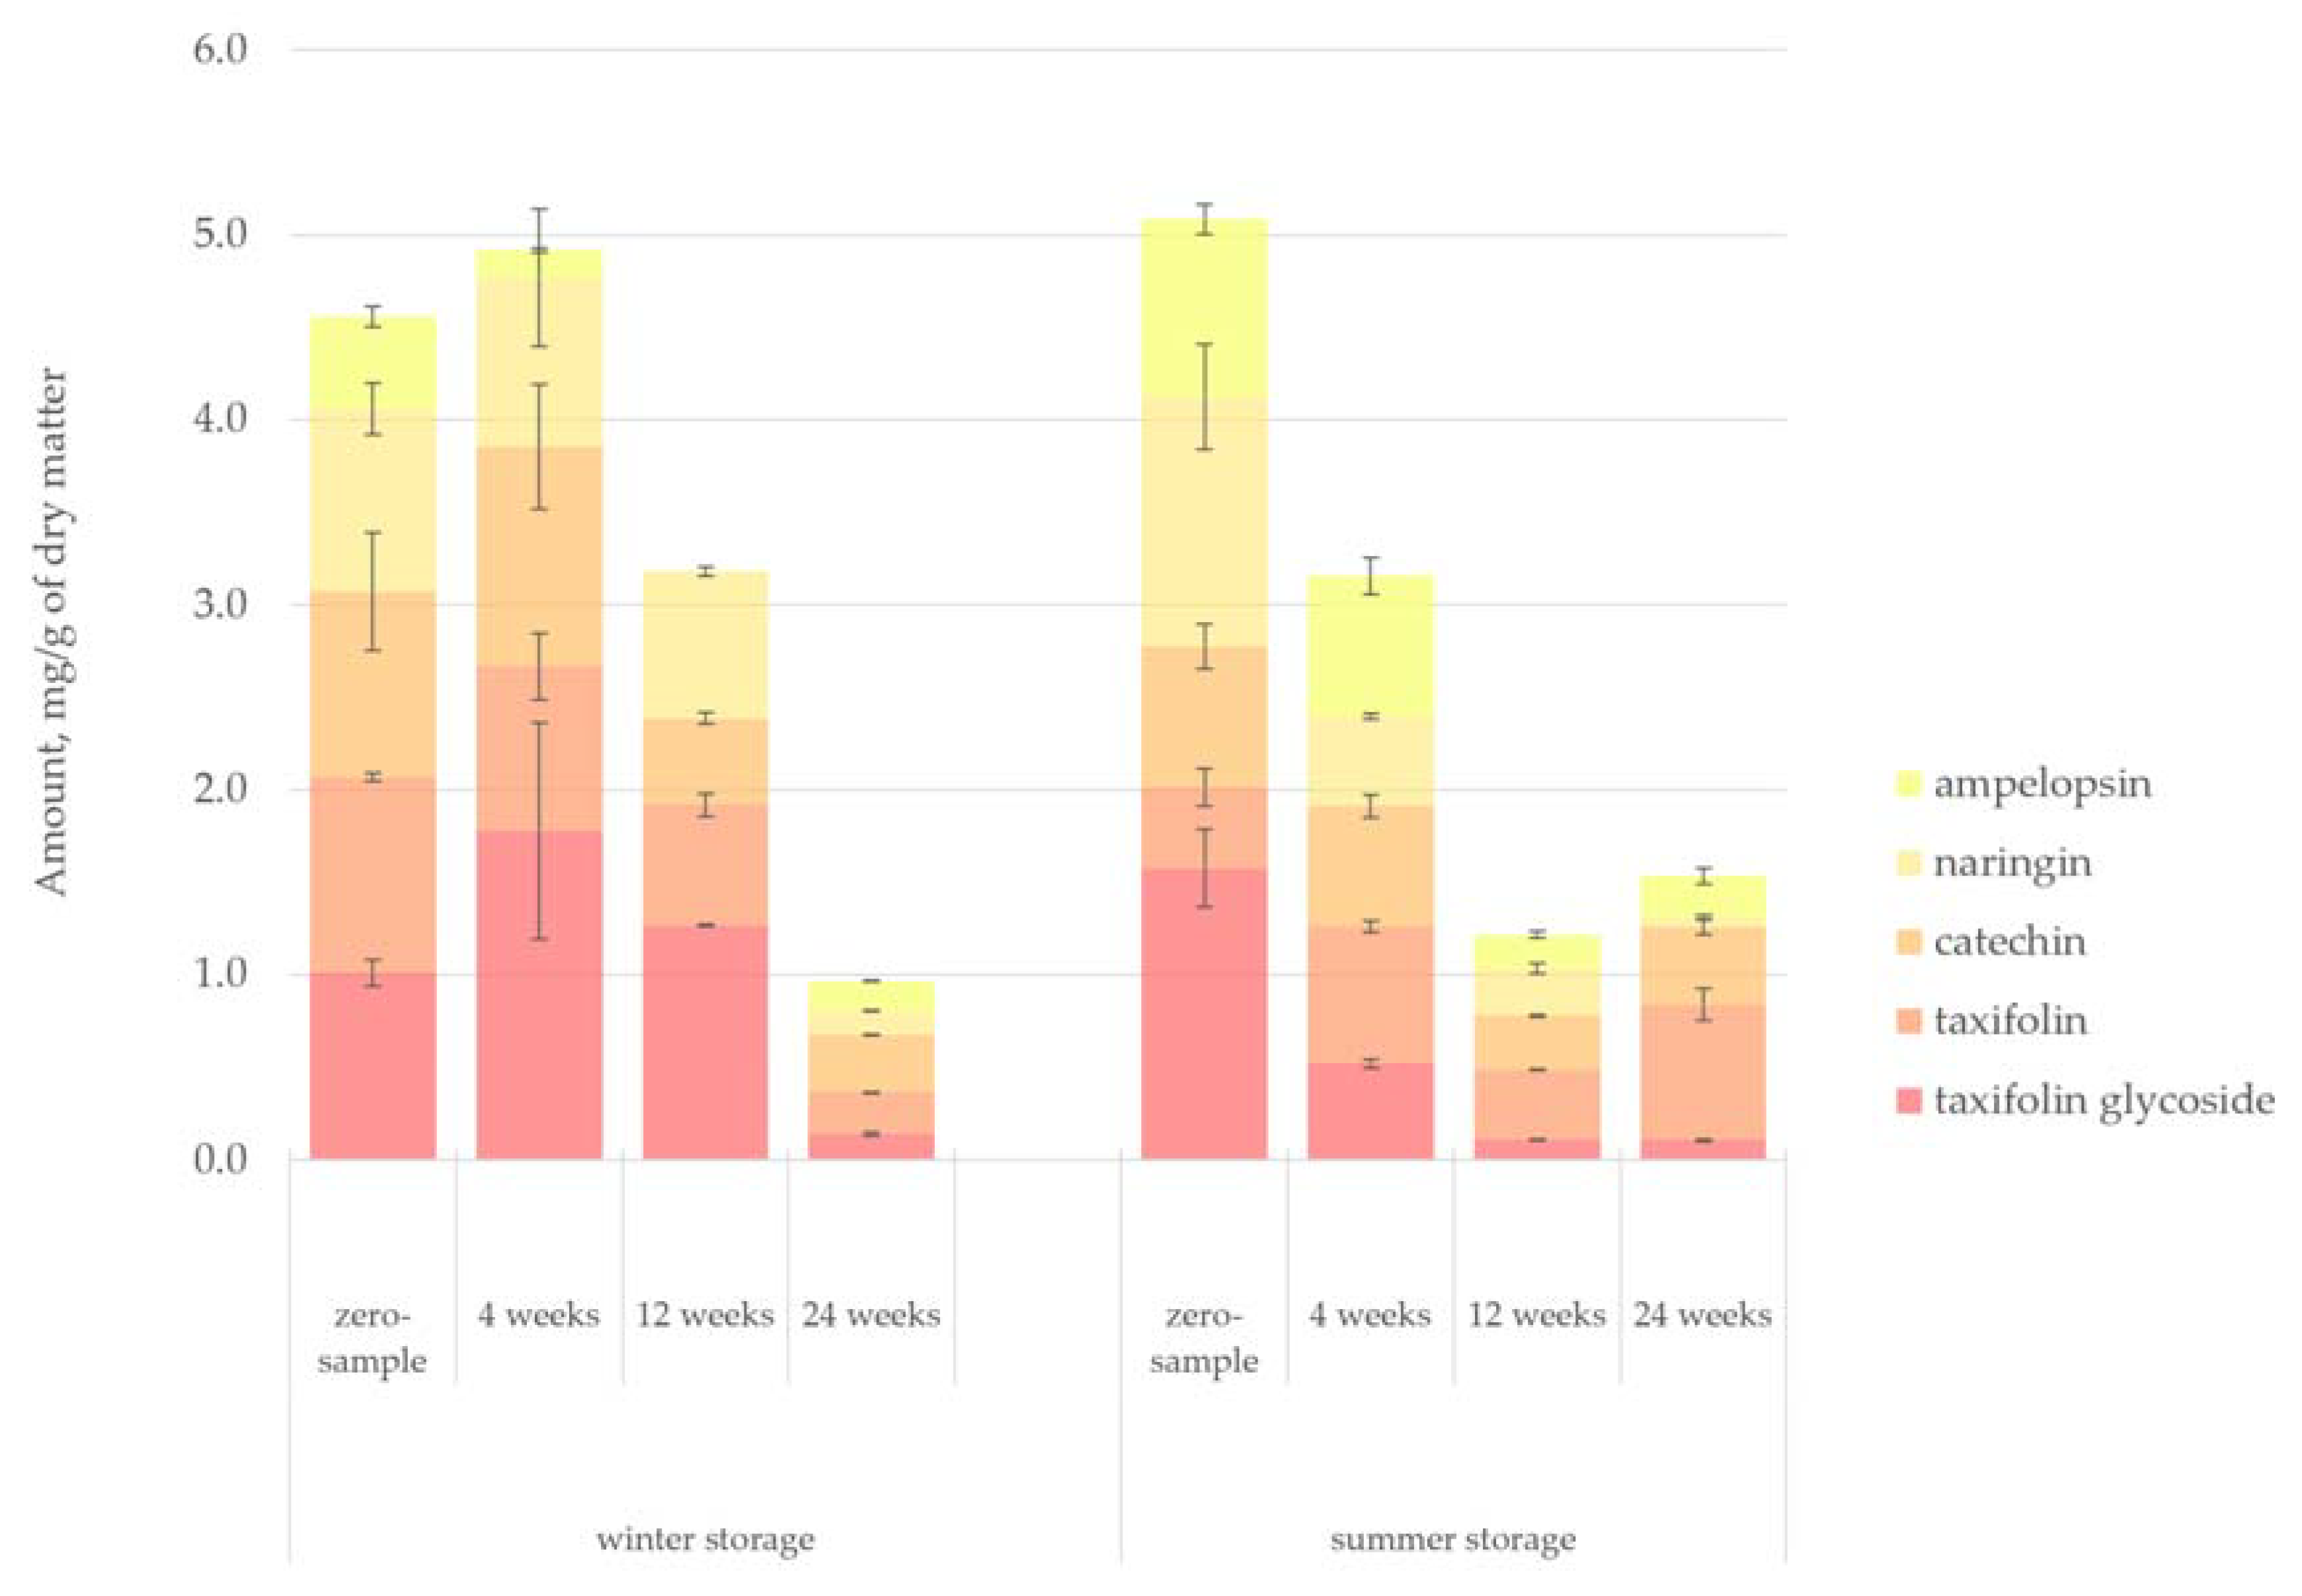
Figure 15 presents the quantified amount of simple flavonoids in the hydrophilic bark extracts. Among the identified flavonoids, a remarkably similar degradation pattern to alcohols was observed. However, flavonoids appeared to be more sensitive than alcohols to ambient temperature increase towards the end of the winter storage period. The amount of identified flavonoids was quite insignificant compared to other extractives groups, although it should be noted that the compound group designated as ‘others’ (in
Figure 5) most likely included several unidentified flavonoid derivatives. The identification of individual flavonoids from bark extracts was especially challenging because of the myriad of compounds that were eluted at the same time during the GC-MS analysis (
Figure A4). All of the identified flavonoids eluted approximately at the retention time of 40–50 min, containing many overlapping peaks.
3.3.3. Quantitative and Qualitative Analysis by HPLC
The used HPLC method was targeted specifically for the identification and quantification of stilbenes from the bark extract. A tentative identification and quantification of several stilbene monomers and dimers were achieved based on the compounds’ mass fragmentation. The qualitative and quantitative results are presented in
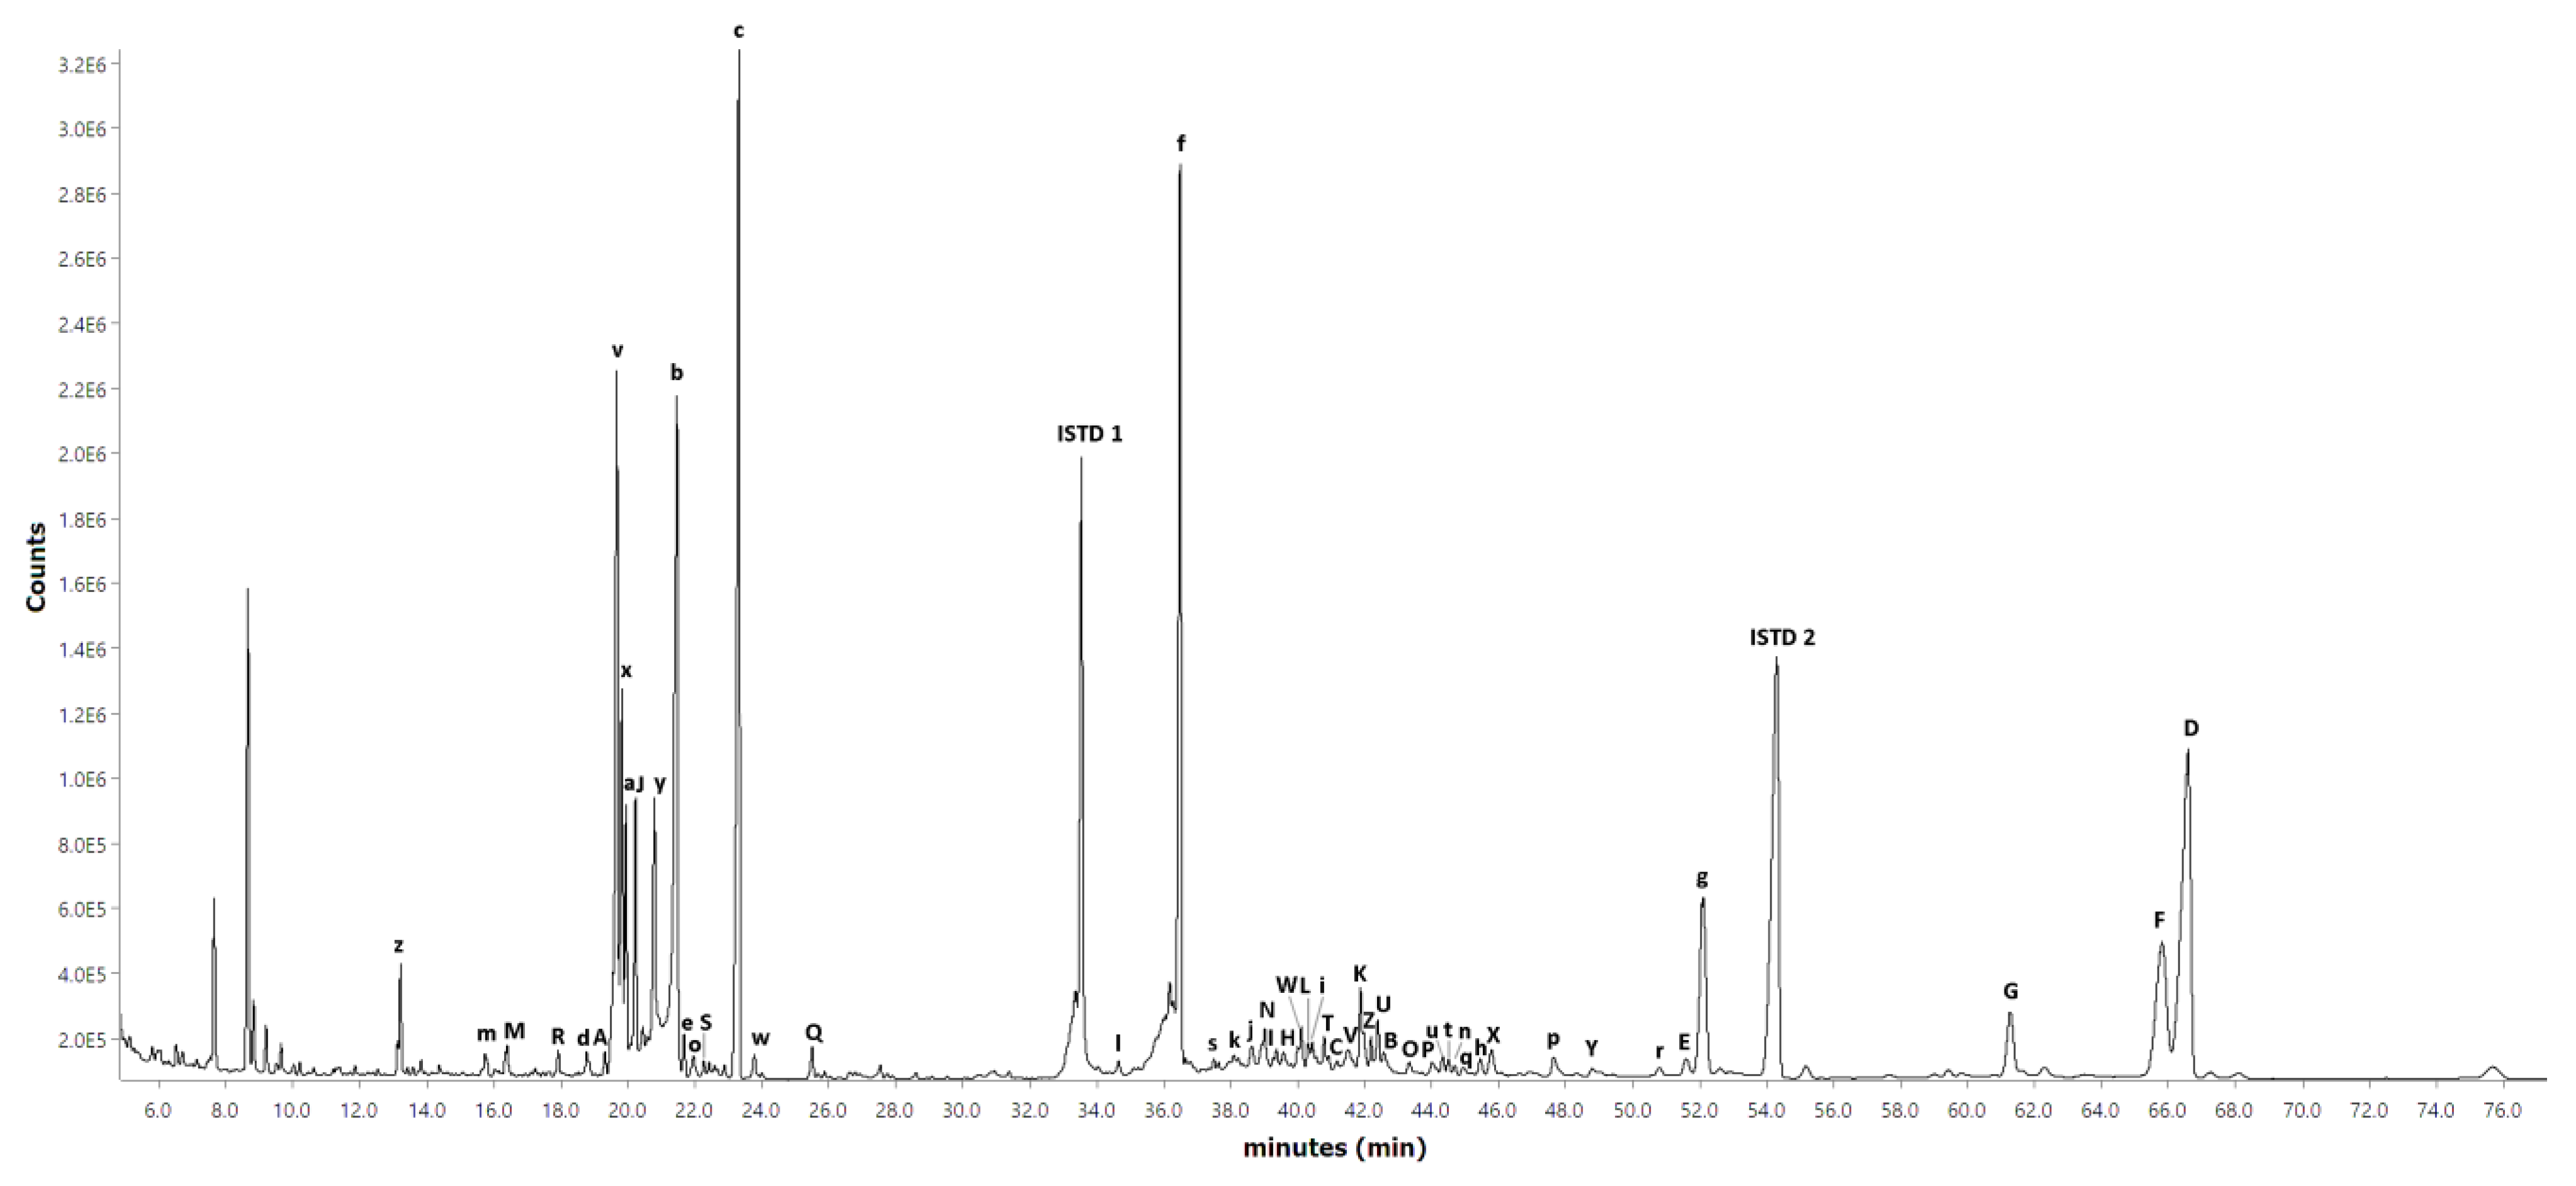
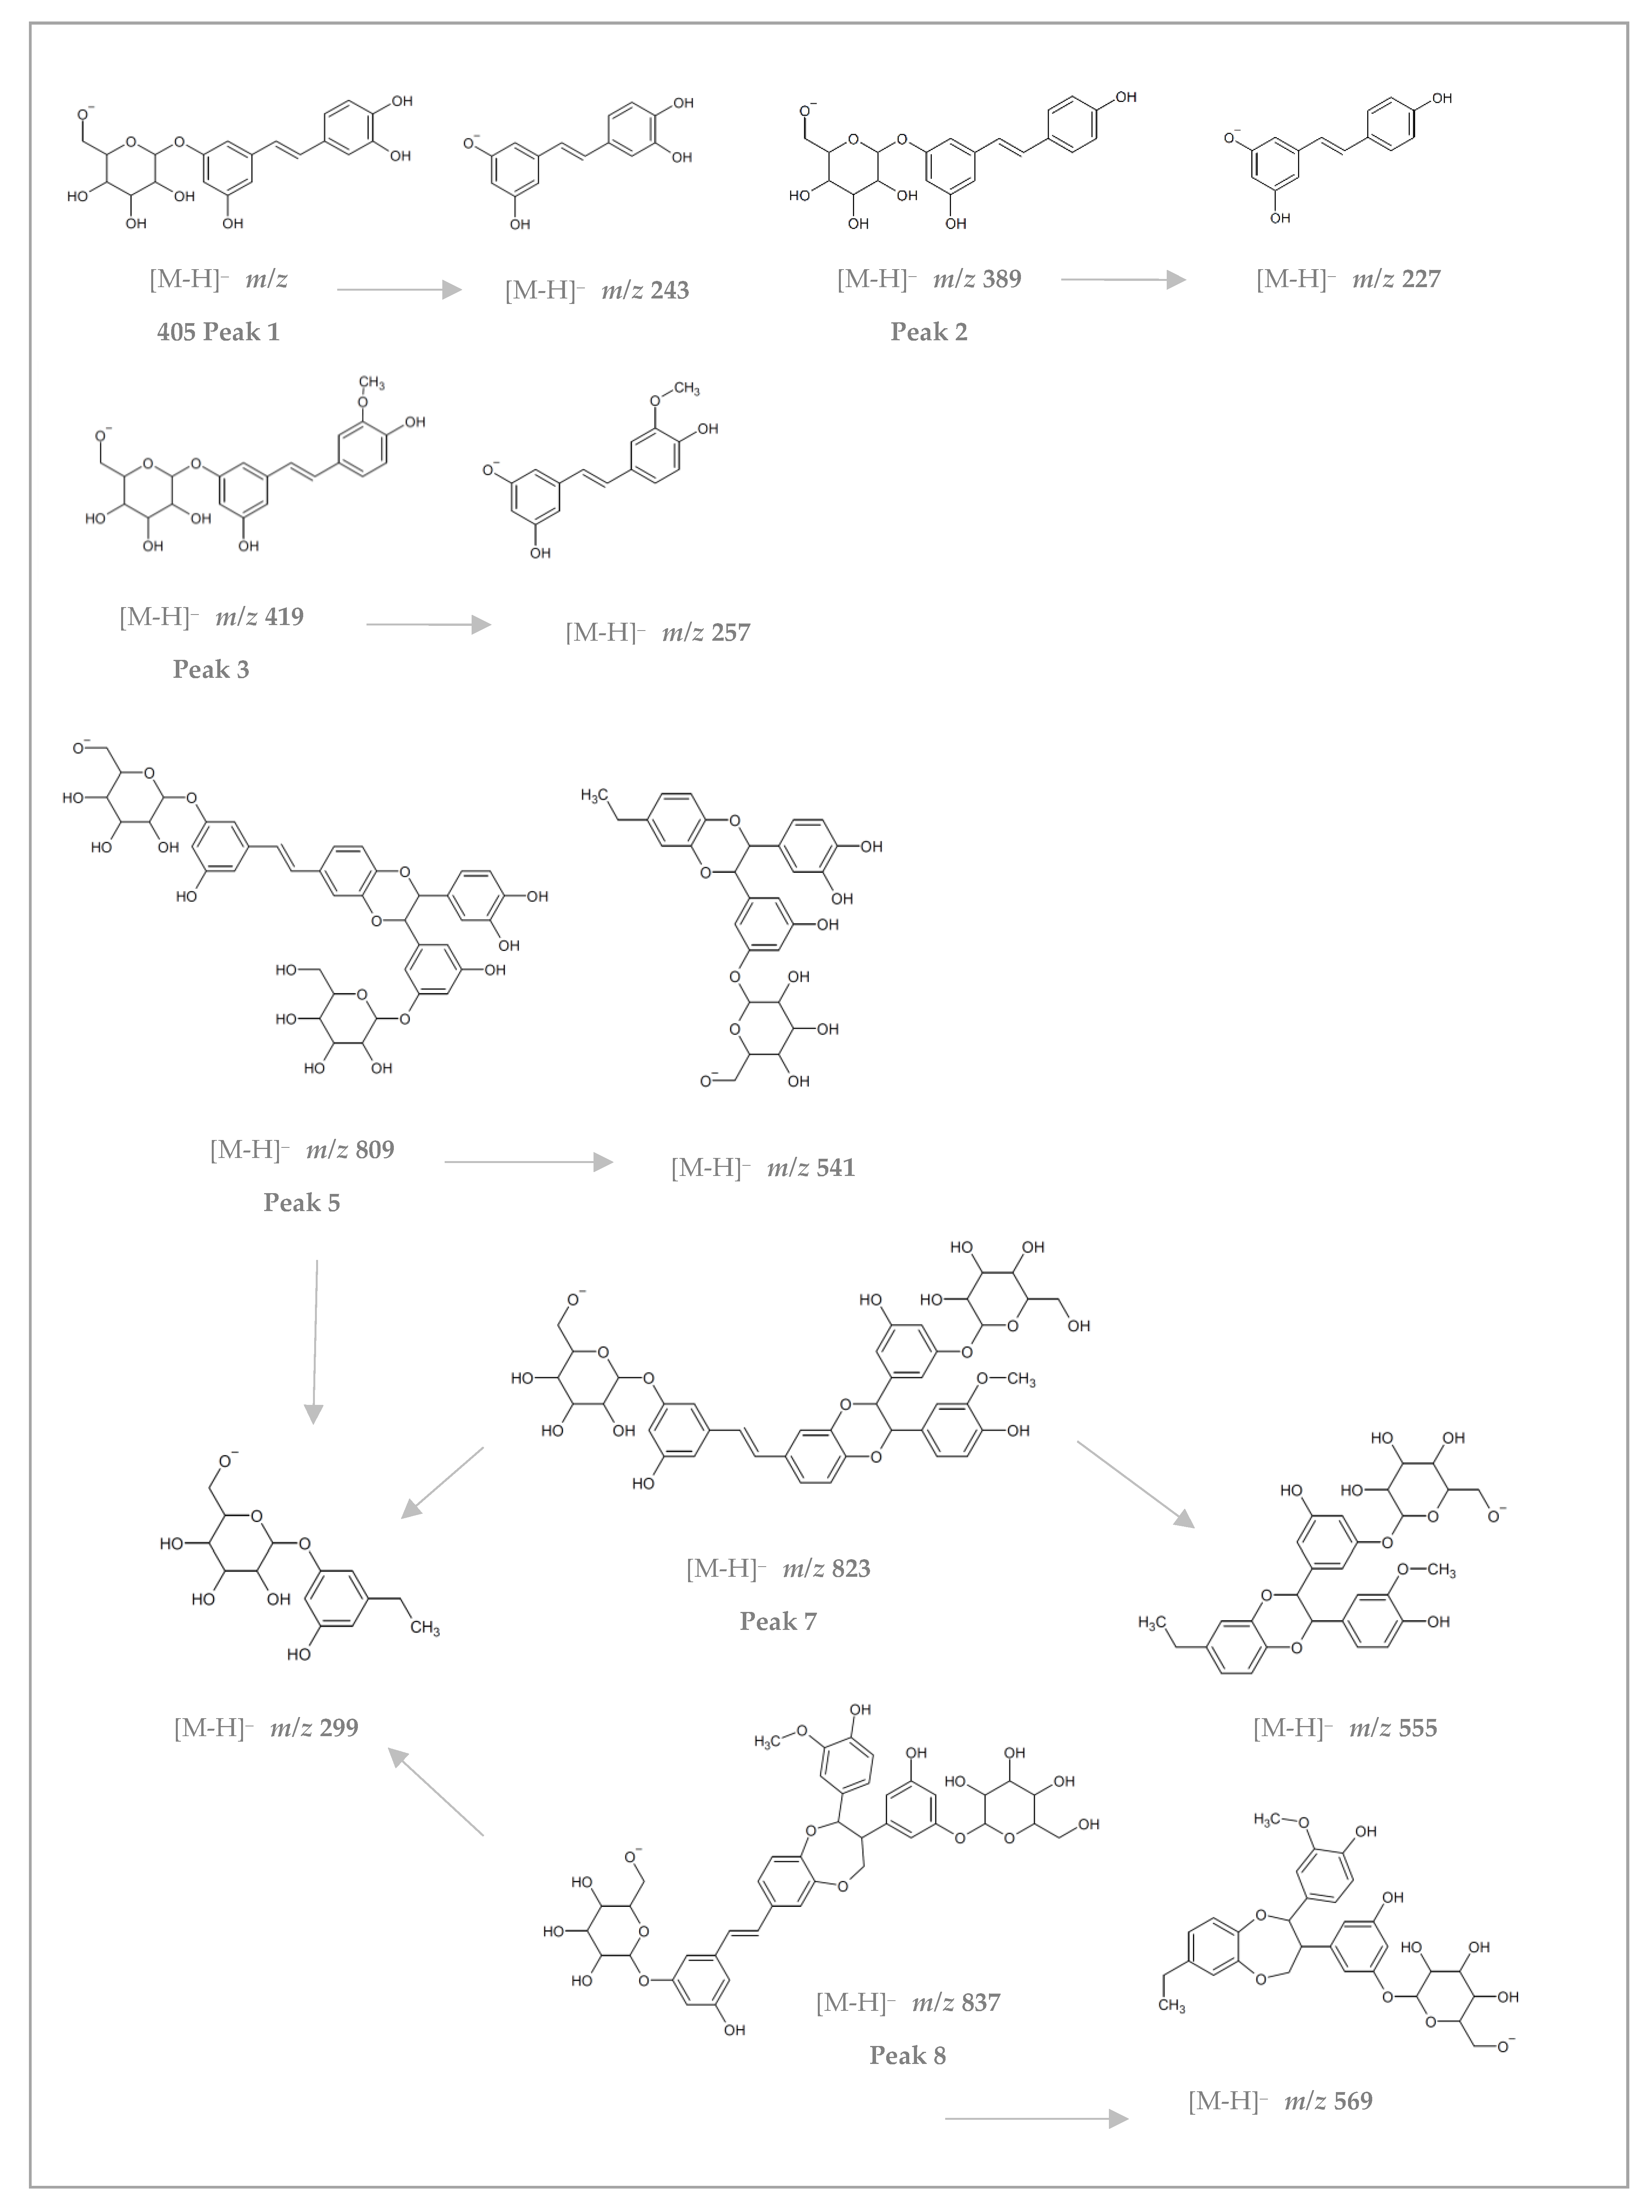
Table 5, and possible structures for some of the compounds are suggested in
Appendix B Figure A6. Similar molecular structures have also been suggested for stilbene dimers in earlier studies [
32,
47,
51]. The qualification and quantification of stilbenes were done for the zero-sample and the sample of the winter-stored saw logs stored for 24 weeks. The quantification was undertaken via external standard
trans-piceid. A standard calibration curve with concentrations ranging from 1 μg/mL to 40 μg/mL was prepared with a good linearity and correlation coefficient
R2 with the value of 0.9991.
The three stilbene glucosides,
trans-isorhapontin, astringin and
trans-piceid, were the most prominent of the identified stilbenoids. Small amounts of several dimeric stilbenoid species were also recognised, at least three of which were assumedly based on dimeric isorhapontin and two on dimeric astringin species. These results also facilitated identifying the compounds in
Figure A5 with the retention time range of 16–18 min as dimeric stilbenoids. In the zero-sample,
trans-isorhapontin was the most abundant of the identified monomeric stilbenoids (14.7 mg/g of dry matter), astringin came second (8.8 mg/g of dry matter) and
trans-piceid third (3.7 mg/g of dry matter). These results agreed with those obtained by GC-MS, although the HPLC samples’ reported amount was slightly higher. This difference could be explained by the fact that in comparison to GC, the HPLC method is more sensitive, the sample preparation for analysis is more straightforward and the delay between extraction and identification of the compounds is shorter. Hence, less degradation and error due to sample treatment occurred.
Among the identified stilbenoids, dimeric stilbenoids were the least abundant. The dimeric species with the main fragment of m/z 823 were identified as isorhapontin dimers 1 and 2, which were the most abundant in the zero-sample at 2.5 mg/g and 3.1 mg/g of dry matter, respectively. Other dominant dimeric species were those with the main fragment m/z 809, identified as astringin-based stilbene dimers, and one with the main fragment m/z 837, identified as isorhapontin dimer 3.
If the dimeric species were accurately identified, it would suggest that
trans-piceid does not form similar dimeric species as do astringin and
trans-isorhapontin. This would be understandable since, in the proposed structures for the dimeric species, the ether bonds connecting the monomeric species are formed via the two phenolic hydroxyl/methoxy groups of astringin and isorhapontin (at ring B; see
Appendix B Figure A6). Because
trans-piceid only has one phenolic hydroxyl group in ring B, it would only form single ether bonds, which are not as strong.
As shown in
Table 5, there was approximately a 60% decrease in the total amount of the identified stilbenoids. The degradation of stilbenoid monomers and that of dimers was not, however, equal. The monomers decreased by almost 80%, while the dimers decreased by only around 10%. It should be noted that some of the dimeric species were more abundant at the end of the storage period. The amount of isorhapontin dimer 2 increased by almost 60%. This result may indicate that polymerisation reactions play an essential role in the degradation of stilbenoids. However, evaluating the mechanisms of the polymerisation reactions (whether they be enzymatic in nature or something else) was not within the scope of this study.
When looking at both dimeric and monomeric species, it appears that overall astringin-related stilbenoids corresponded with the most significant losses during storage. This observation was also confirmed by the GC results (
Figure 13), especially during the summer storage period, where even the initial amount of astringin in the zero-sample was vanishingly small and reached undetectable levels by week 24 of the storage period. The loss of astringin might be explained by the fact that, of the stilbenoid monomers, astringin has the highest amount of the free phenolic hydroxyl groups, which is known to increase reactivity and antioxidant activity.


