Article

Genotype–Environment Interactions for Tree Growth and Leaf Phytochemical Content of Cyclocarya paliurus (Batal.) Iljinskaja

1
College of Forestry, Nanjing Forestry University, Nanjing 210037, China
2
Co-Innovation Center for Sustainable Forestry in Southern China, Nanjing Forestry University, Nanjing 210037, China
*
Author to whom correspondence should be addressed.
Forests 2021, 12(6), 735; https://doi.org/10.3390/f12060735
Submission received: 19 May 2021 / Revised: 31 May 2021 / Accepted: 1 June 2021 / Published: 4 June 2021
(This article belongs to the Special Issue Non-wood Forest Products)

Abstract

:
Cyclocarya paliurus (Batal.) Iljinskaja, as a woody tree species, has various health-promoting phytochemicals and is commonly used in tea production in China. A field trial for C. paliurus was conducted at two typical sites to evaluate genotype × environmental interaction (GEI) effects and identify the stability and adaptability of 13 families. The genotype main effects and genotype × environment interaction effects (GGE) were used to analyze the GEI effects for tree height, diameter at breast height (DBH), and leaf flavonoid and triterpenoid contents. Two-way analysis of variance indicated that the tree growth and leaf phytochemical contents were mainly affected by genotype and GEI. Based on the results of GGE, the JH1 family had high mean values and high stability in total flavonoid and total triterpenoid accumulations, while the KM4 family exhibited high means and high stability in tree height and DBH growth, as well as high means and medium stability in total triterpenoid content. Pearson’s correlation analysis indicated that the annual mean DBH was significantly and positively correlated with leaf phytochemical content in C. paliurus when all data for the 13 families at the two sites were used. Our results suggest that JH1 should be mainly extended as a superior genotype for the production of flavonoids and triterpenoids in the leaves, while KM4 could be spread for timber production or leaf triterpenoid production. This study provides useful information on the selection of C. paliurus genotypes in target sites and cultivation strategies for establishing oriented plantations.

1. Introduction

Wheel wingnut (Cyclocarya paliurus (Batal.) Iljinskaja) belongs to the Juglandaceae family and is a woody and indigenous tree species that is widely distributed in subtropical regions of China [1]. The leaves of this plant have long been consumed as a nutraceutical tea or used as an ingredient in traditional Chinese medicine. Since C. paliurus leaves are rich in health-promoting phytochemicals, they have received considerable attention in terms of their pharmacological activity in recent years, including their hypoglycemic, hypolipidemic, antioxidant, and antimicrobial effects [2,3,4,5]. Among these chemical constituents associated with health benefits, flavonoids and triterpenoids are two major classes of secondary metabolites in C. paliurus leaves.
Plant secondary metabolites are not essential to maintain the fundamental life processes in plant, but play vital roles in environmental adaptability and defense [6]. The synthesis and accumulation of plant secondary metabolites are determined by both internal genetic (e.g., species, genotype, physiology, and developmental stage) control and external environmental (e.g., light, temperature, water, and nutrients) factors [7,8]. Geographical studies on C. paliurus have indicated that the interpopulation and intrapopulation variations of leaf triterpenoid and flavonoid contents can likely be attributed to genetic and environmental factors [2,9]. In recent years, various strategies have been employed to improve the flavonoid and triterpenoid contents in C. paliurus leaves. These strategies mainly involve the selection of germplasm resources at the provenance and family levels, as well as the control of abiotic stress factors, i.e., light intensity, light quality, and nitrogen nutrient [10,11,12]. Apart from a high accumulation of phytochemicals, a desirable genotype should have high stability across environments or good performance over a specific environment [13]. The assessment of the stability and adaptability for C. paliurus genotypes is essential for cultivation in large areas to meet the increasing demands for tea production. However, there is less information available on C. paliurus genotypic stability and adaptability in relation to the accumulation of health-promoting phytochemicals across environments.
Genotype × environment interaction (GEI) effects are crucial in the selection of genotypes with wide or adequate adaption to environments in plant breeding [14]. Although various statistical approaches have been proposed, there is no consensus on the best method to evaluate GEI effects [15]. However, the genotype main effects and genotype × environment interaction effects (GGE) model is extensively used to analyze GEI effects [15]. GGE analysis captures linear and nonlinear variance components, meaning superior genotypes with high stability and high mean values can be efficiently identified [16]. According to multiple years and locations trials, variations in leaf flavonoid (i.e., quercetin, isoquercitrin, kaempferol, and total flavonoids) and triterpenoid (i.e., arjunolic acid, cyclocarioside I, cyclocaric acid B, and total triterpenoids) contents in C. paliurus have been found depending on the genotype, environment, and GEI effects [17,18]. In a previous study, the GEI effects for the tree height and leaf flavonoid content of C. paliurus were evaluated by Eberhart and Russell [17,19], whereas an analysis method for GEI effects based on regression analysis presented in a previous study only involved the assessment of stability rather than adaptability [20]. Currently, no information on C. paliurus has been reported using GGE to evaluate the GEI effects for growth and leaf phytochemical contents. Therefore, the variations in the growth (tree height and DBH) and leaf phytochemical (seven flavonoids and six triterpenoids) content of thirteen genotypes of C. paliurus at two typical sites were investigated in the present study. The main purpose was to identify the elite genotypes of C. paliurus with high phytochemical content and high stability through analyzing the GEI effects for growth and leaf phytochemical content using GGE models. The results from this study will offer insights into the selection of genotypes and cultivation strategies when establishing C. paliurus plantations.

2. Materials and Methods

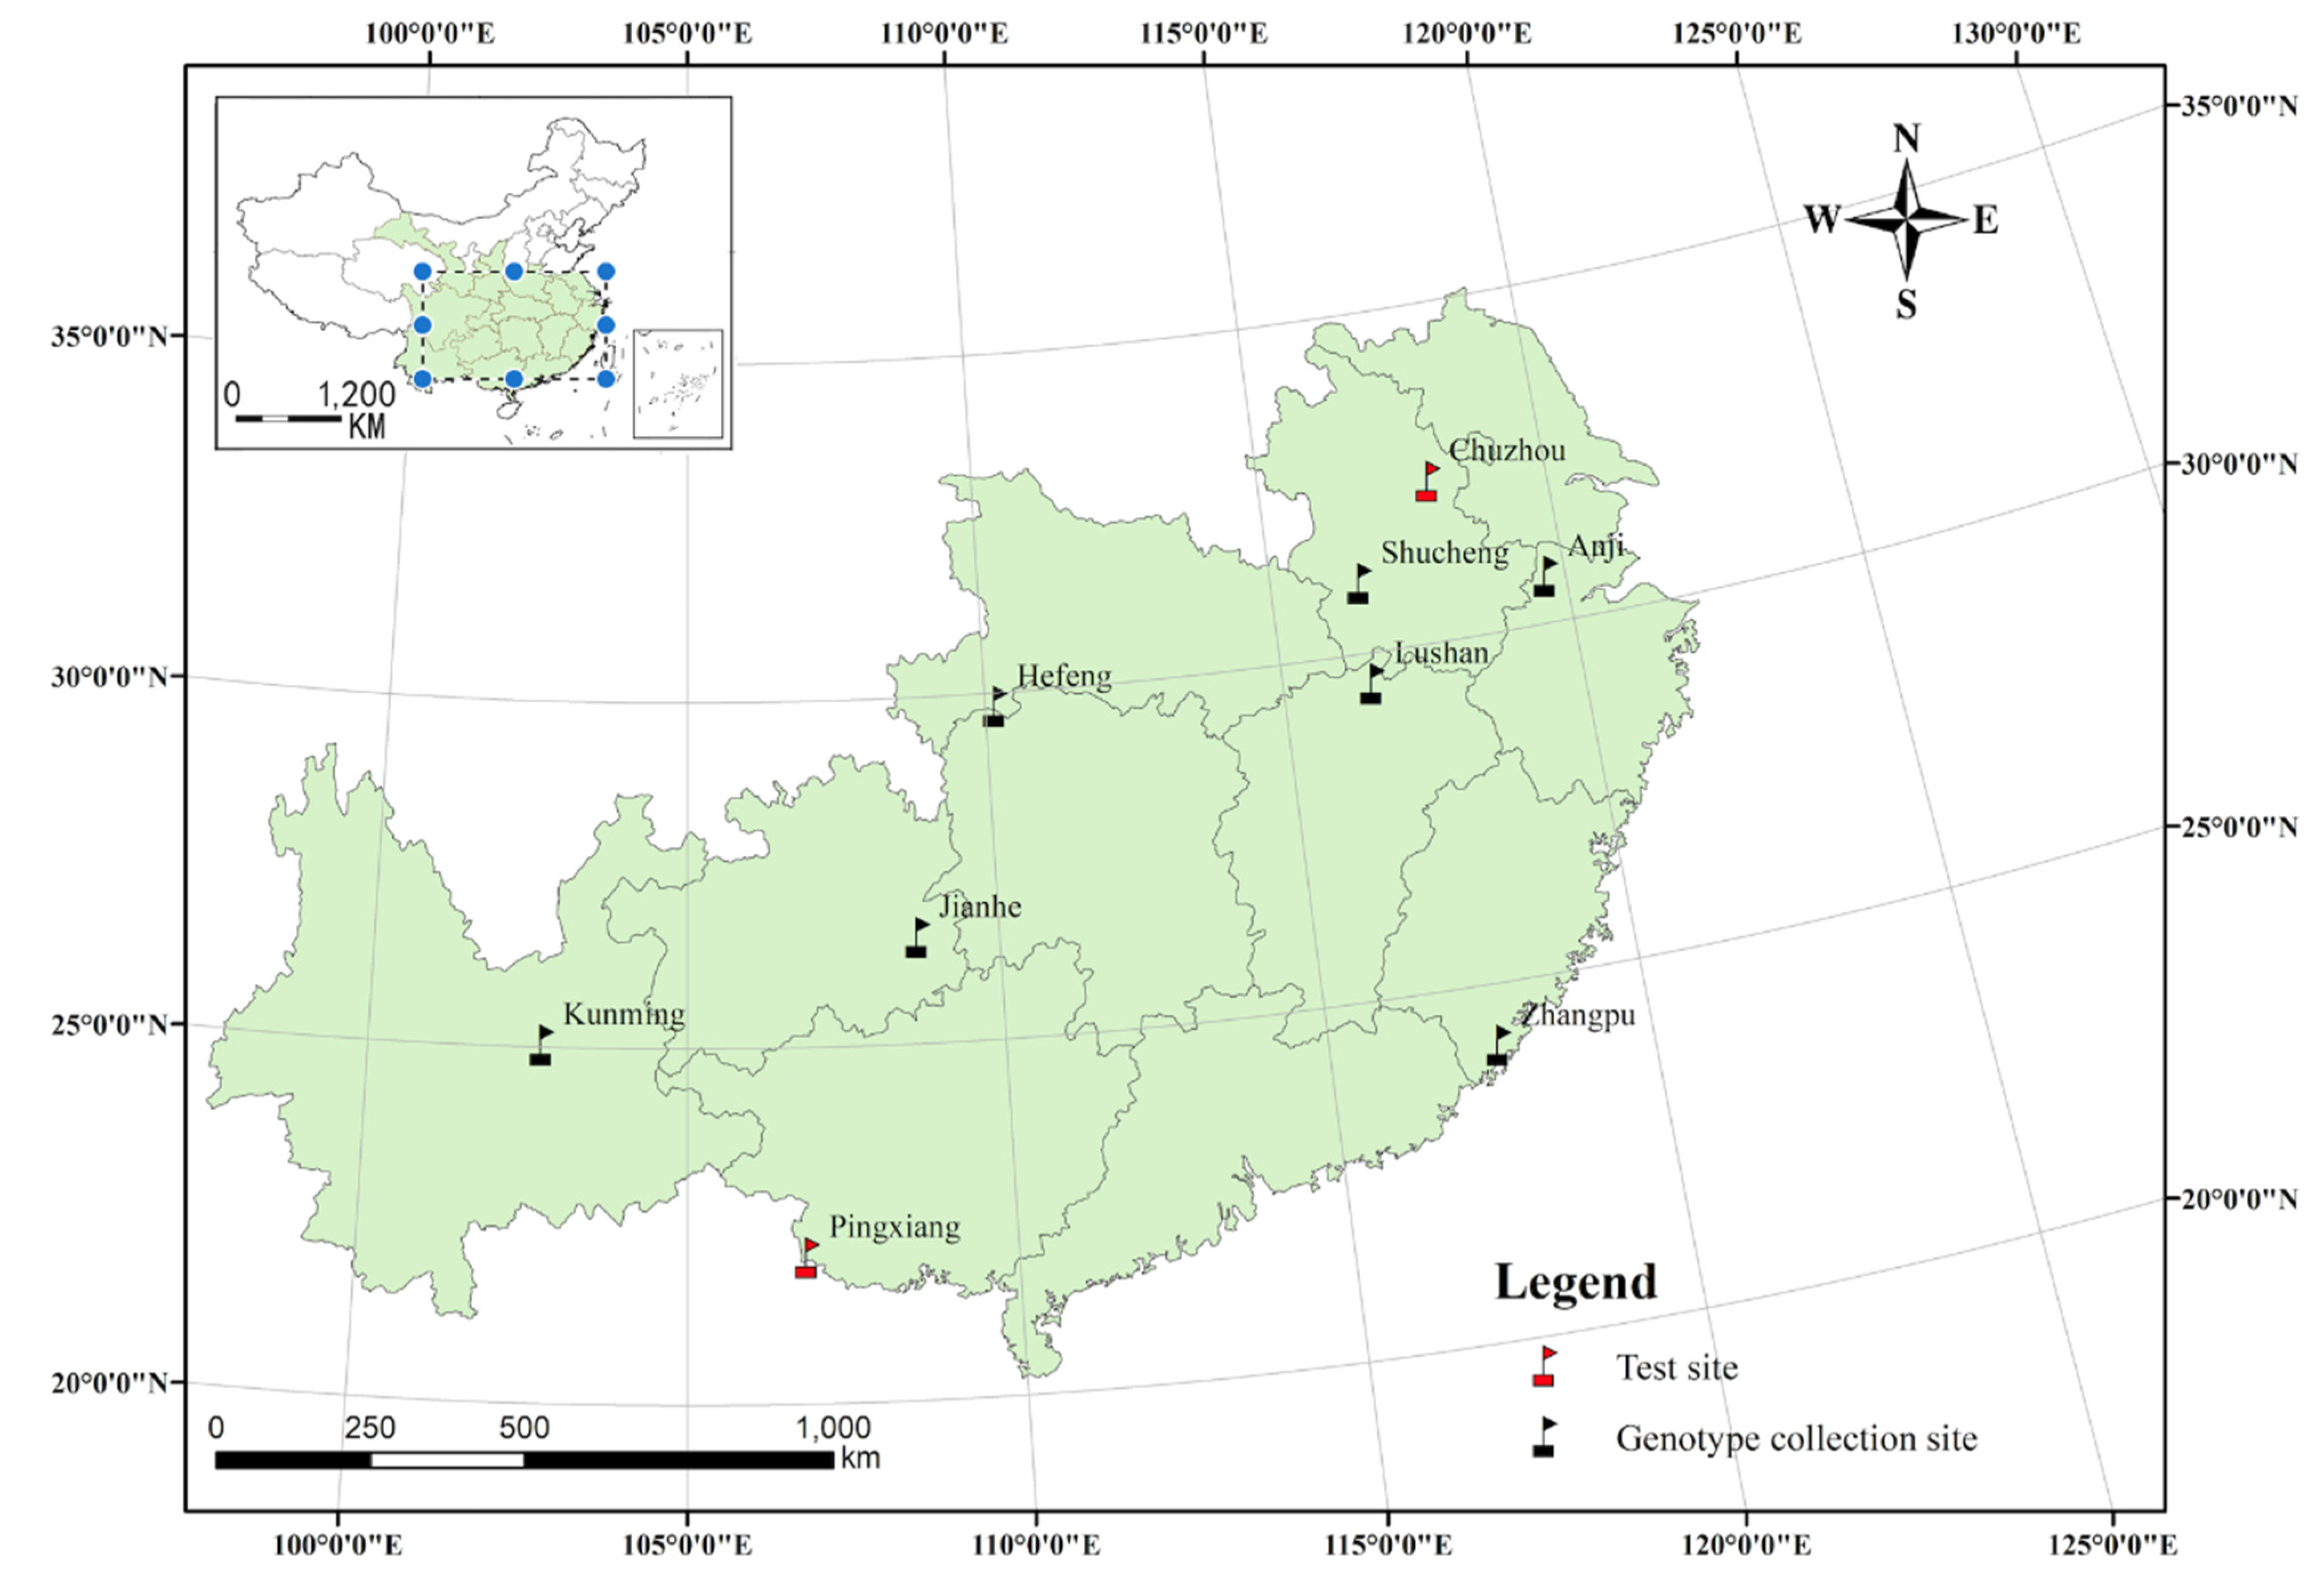
2.1. Plant Materials and Experimental Design

The natural distribution of C. paliurus is roughly from 23° N to 34° N latitude and from 103° E to 121° E longitude, whereas the seeds of half-sib families in this study were collected from natural forests in seven geographical locations in late October 2006 (Figure 1 and Table S1). After stratification and containerization of seedlings following the method described by Fang et al. [1], roughly 6 cm height of trees from each genotype were then transplanted into two typical experimental sites (Figure 1 and Table S1) at a spacing of 3 × 4 m in early March of 2008. The fields trials were carried out using a randomized complete block design experiment with three replications, with the replicates set up according to the slope position. At each experimental field, each block consisted of thirteen genotypes of C. paliurus and each replicate included 5–10 seedlings of each genotype.
In early October 2018, three sample trees for each genotype were randomly chosen per location to collect about 50 g fresh, fully developed leaves for each tree and to measure the tree height and diameter at breast height (DBH). The leaves were dried in an oven at 70 °C until constant weight and then powdered using a grinder (FW-100, Tianjin Taisite Instrument Co., Ltd., Tianjin, China). All specimens were stored at room temperature before analysis.

2.2. Determination of Phytochemicals

Leaf samples (0.8 g) for each genotype at each test site from three trees were extracted with 10 mL of 70% ethanol for 45 min by ultrasound-assisted extraction. After centrifugation for 10 min at 10,000 rpm, the supernatants were separated on a C18 solid-phase extraction column and then filtered using a 0.22 μm syringe filter for determination.
The total flavonoid content was determined using the aluminum chloride colorimetric method described by Li et al. [21]. Briefly, 0.1 mL of the sample solution was mixed with 1 mL of 1% (w/v) methanolic solution of aluminum trichloride (AlCl3) and then diluted with methanol to 10 mL. After incubation for 15 min at room temperature, the absorbance of the sample was measured at 415 nm. The total flavonoid content was calculated from the calibration curve of rutin as the standard and was expressed as the rutin equivalent in mg/g dry sample.
The total triterpenoid content was measured according to the colorimetric method used by Fan and He [22]. Briefly, 0.1 mL of the sample solution was mixed with 0.5 mL of 5% (w/v) glacial acetic acid of vanillin and 1.4 mL of perchloric acid solution. After incubation for 15 min at 60 °C, the mixture was cooled to room temperature and then diluted with ethyl acetate to 10 mL. The absorbance of the sample was measured at 550 nm. The total triterpenoid content was calculated based on a standard curve of oleanolic acid and expressed as the oleanolic acid equivalent in mg/g dry sample.
The individual flavonoid and triterpenoid contents were identified and quantified as reported by Cao et al. [23] (Figure S1). Liquid chromatography (LC)–mass spectrometry (MS) analysis was performed to confirm individual flavonoid and triterpenoid identities as described by Cao et al. [23]. They were identified by comparison of retention times and MS spectra with standards. The high-performance liquid chromatography (HPLC) (Agilent 1200 series HPLC system, Waldbronn, Germany) method was used to determine the flavonoid and triterpenoid contents. An X-Bridge C18 column (250 × 4.6 mm) was used for the chromatographic separation. The mobile phases were water containing 0.01% (v/v) formic acid (A) and acetonitrile (B) with a flow rate of 1.0 mL/min. The gradient elution condition was from 8% (B) to 19% (B) over 13 min (from 0 to 13 min); to 21% (B) over 15 min (from 13 to 28 min); to 50% (B) over 14 min (from 28 to 42 min); to 50% (B) over 4 min (from 42 to 46 min); to 55% (B) over 14 min (from 46 to 60 min); to 56% (B) over 4 min (from 60 to 64 min); to 66% (B) over 10 min (from 64 to 74 min); to 85% (B) over 16 min (from 74 to 90 min); to 100% (B) over 5 min (from 90 to 95 min); to 100% (B) over 5 min (from 95 to 100 min). The injection volume was 10 μL and the column temperature was 45 °C. The detection wavelength was set to 205 nm. The individual flavonoid and triterpenoid contents were measured by comparison with external standards.

2.3. Data Analysis

Tree growth (tree height and DBH) and leaf phytochemical content values for C. paliurus were expressed as means ± standard deviation (SD). Analysis of variance (ANOVA) was performed to compare the data among the genotypes from the two experimental fields followed by Tukey’s test with p < 0.05 using SPSS 21.0 software (IBM, Chicago, IL, USA). The analysis of the GGE model [24] was performed using GenStat 20th edition (VSN international, Hemel Hempstead, Hertfordshire, UK). The GGE biplots were used to visually evaluate the presence of an interaction and to rank the genotypes based on the mean and stability.

3. Results and Discussion

3.1. Variations in Growth and Leaf Phytochemical Contents

Two-way analysis of variance indicated that tree growth and leaf phytochemical content were significantly influenced by the genotype, environment, and their interactions (Table S2). As shown in Figure 2, the genotype and GEI accounted for greater amounts of the total variation for each measured index. For example, the variations in growth for tree height and DBH by genotype accounted for 52.3% and 62.1%, while the variations in leaf contents of quercetin-3-O-glucuronide, quercetin-3-O-galactoside, isoquercitrin, quercetin-3-O-rhamnoside, and oleanolic acid as explained by genotype were 71.9%, 50.7%, 65.0%, 70.1%, and 55.6% (Figure 2), respectively. However, the greatest variations in leaf contents of kaempferol-3-O-glucuronide, cyclocaric acid B, pterocaryoside B, pterocaryoside A, and total triterpenoid were explained by the GEI. For the leaf contents of kaempferol-3-O-glucoside, kaempferol-3-O-rhamnoside, total flavonoid, arjunolic acid, and hederagenin, the genotype and environment accounted for similar amounts of the total variation.
The highest tree height was observed in KM4 (8.65 m), which was nearly two times greater than the lowest tree height in LS9, while the BDH values varied from 4.38 to 11.32 cm, with the highest value being found in LS1 and the lowest value in LS9 (Table 1). The total flavonoid contents in the leaves ranged from 3.58 to 11.03 mg/g, while the contents of quercetin-3-O-glucuronide, quercetin-3-O-galactoside, isoquercitrin, kaempferol-3-O-glucuronide, kaempferol-3-O-glucoside, quercetin-3-O-rhamnoside, and kaempferol-3-O-rhamnoside varied from 0.17 to 2.20 mg/g, from 0.05 to 0.49 mg/g, from 0.01 to 0.24 mg/g, from 0.13 to 0.88 mg/g, from 0.04 to 0.13 mg/g, from 0.02 to 0.23 mg/g, and from 0.07 to 1.21 mg/g, respectively (Table 2). Obviously, JH1 had the highest contents of flavonoids, except for kaempferol-3-O-glucuronide, among the tested genotypes, whereas the ZP5 exhibited the highest values for arjunolic acid (5.06 mg/g), cyclocaric acid B (1.84 mg/g), and hederagenin (1.04 mg/g) for triterpenoids (Table 3). JH3 and JH1 showed the best performance in terms of the accumulation of pterocaryoside B (2.21 mg/g) and oleanolic acid (0.65 mg/g). Pterocaryoside A values ranged from 0.35 to 5.05 mg/g, with the greatest value being observed in KM4. Moreover, KM4 also had the highest content of total triterpenoid (22.42 mg/g), followed by ZP5 (21.40 mg/g) and JH1 (21.04 mg/g).
Our results indicated significant GEI effects for the height and DBH growth of C. paliurus, consistent with the results found by Klápště et al. [25], who reported that GEI effects were observed for the height and DBH of Picea koraiensis. However, these results were inconsistent with the result found by Ling et al. [26], who reported that no GEI was observed for the DBH growth of redwood. The leaf flavonoid and triterpenoid contents of C. paliurus were significantly affected by genotype, environment, and GEI, in agreement with the previous studies [17,18]. Compared with other tree species, the total flavonoid content in C. paliurus leaves was lower than that of olive leaves [27], but higher than or similar to that of ginkgo leaves [28]. The total triterpenoid content of C. paliurus leaves was lower than the previous study reported by Deng et al. [17], which may have been due to the difference in climate factors for that year and tree age.

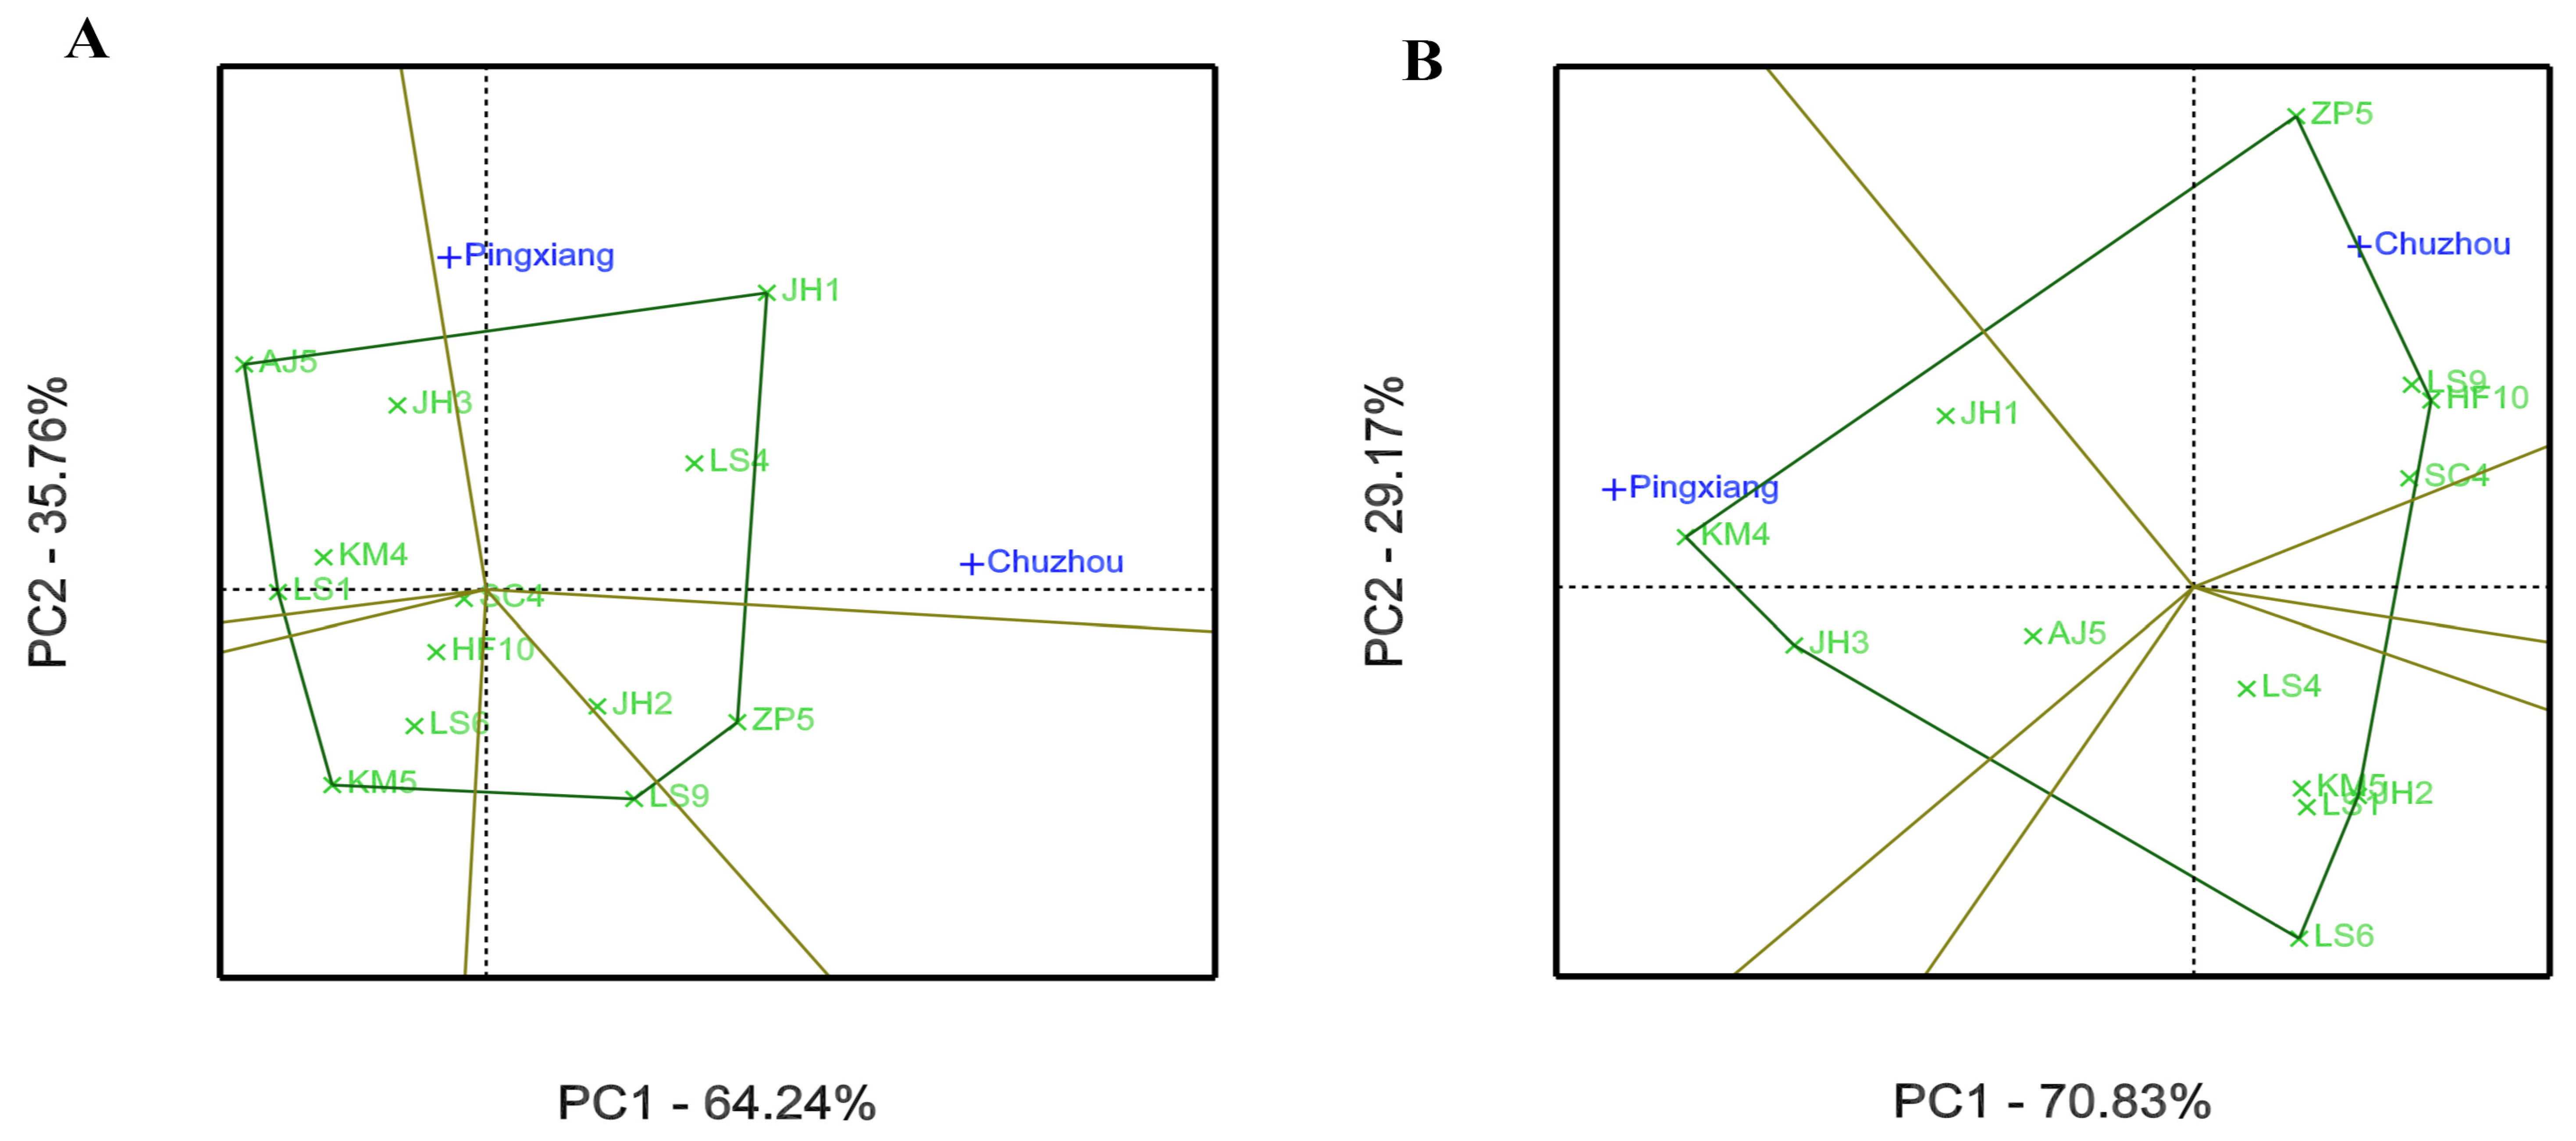
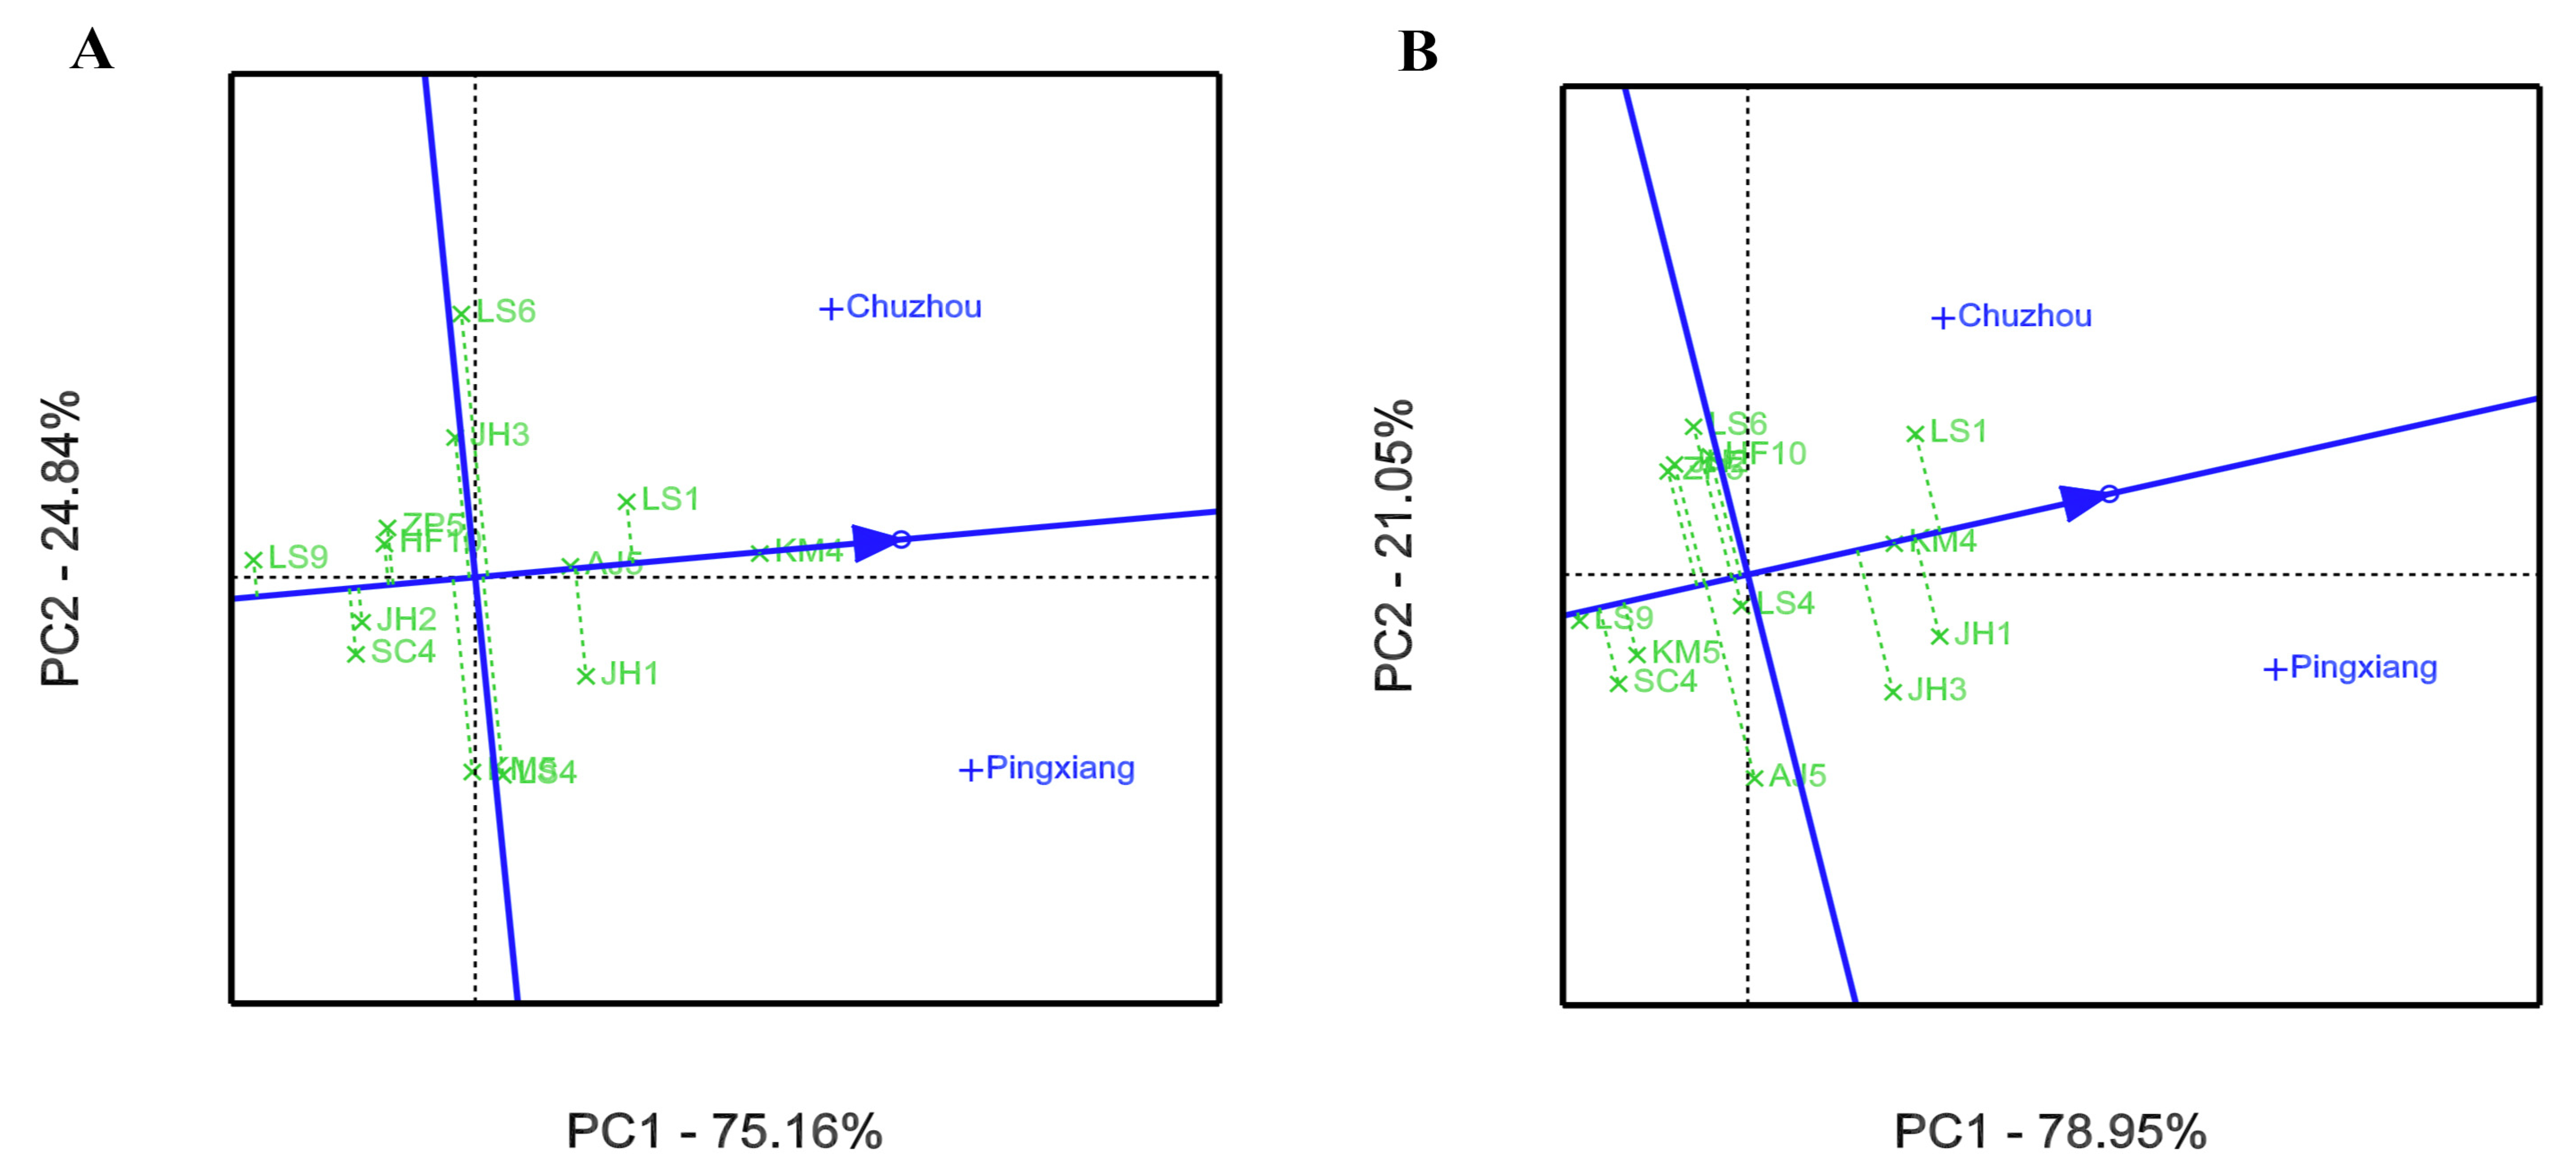
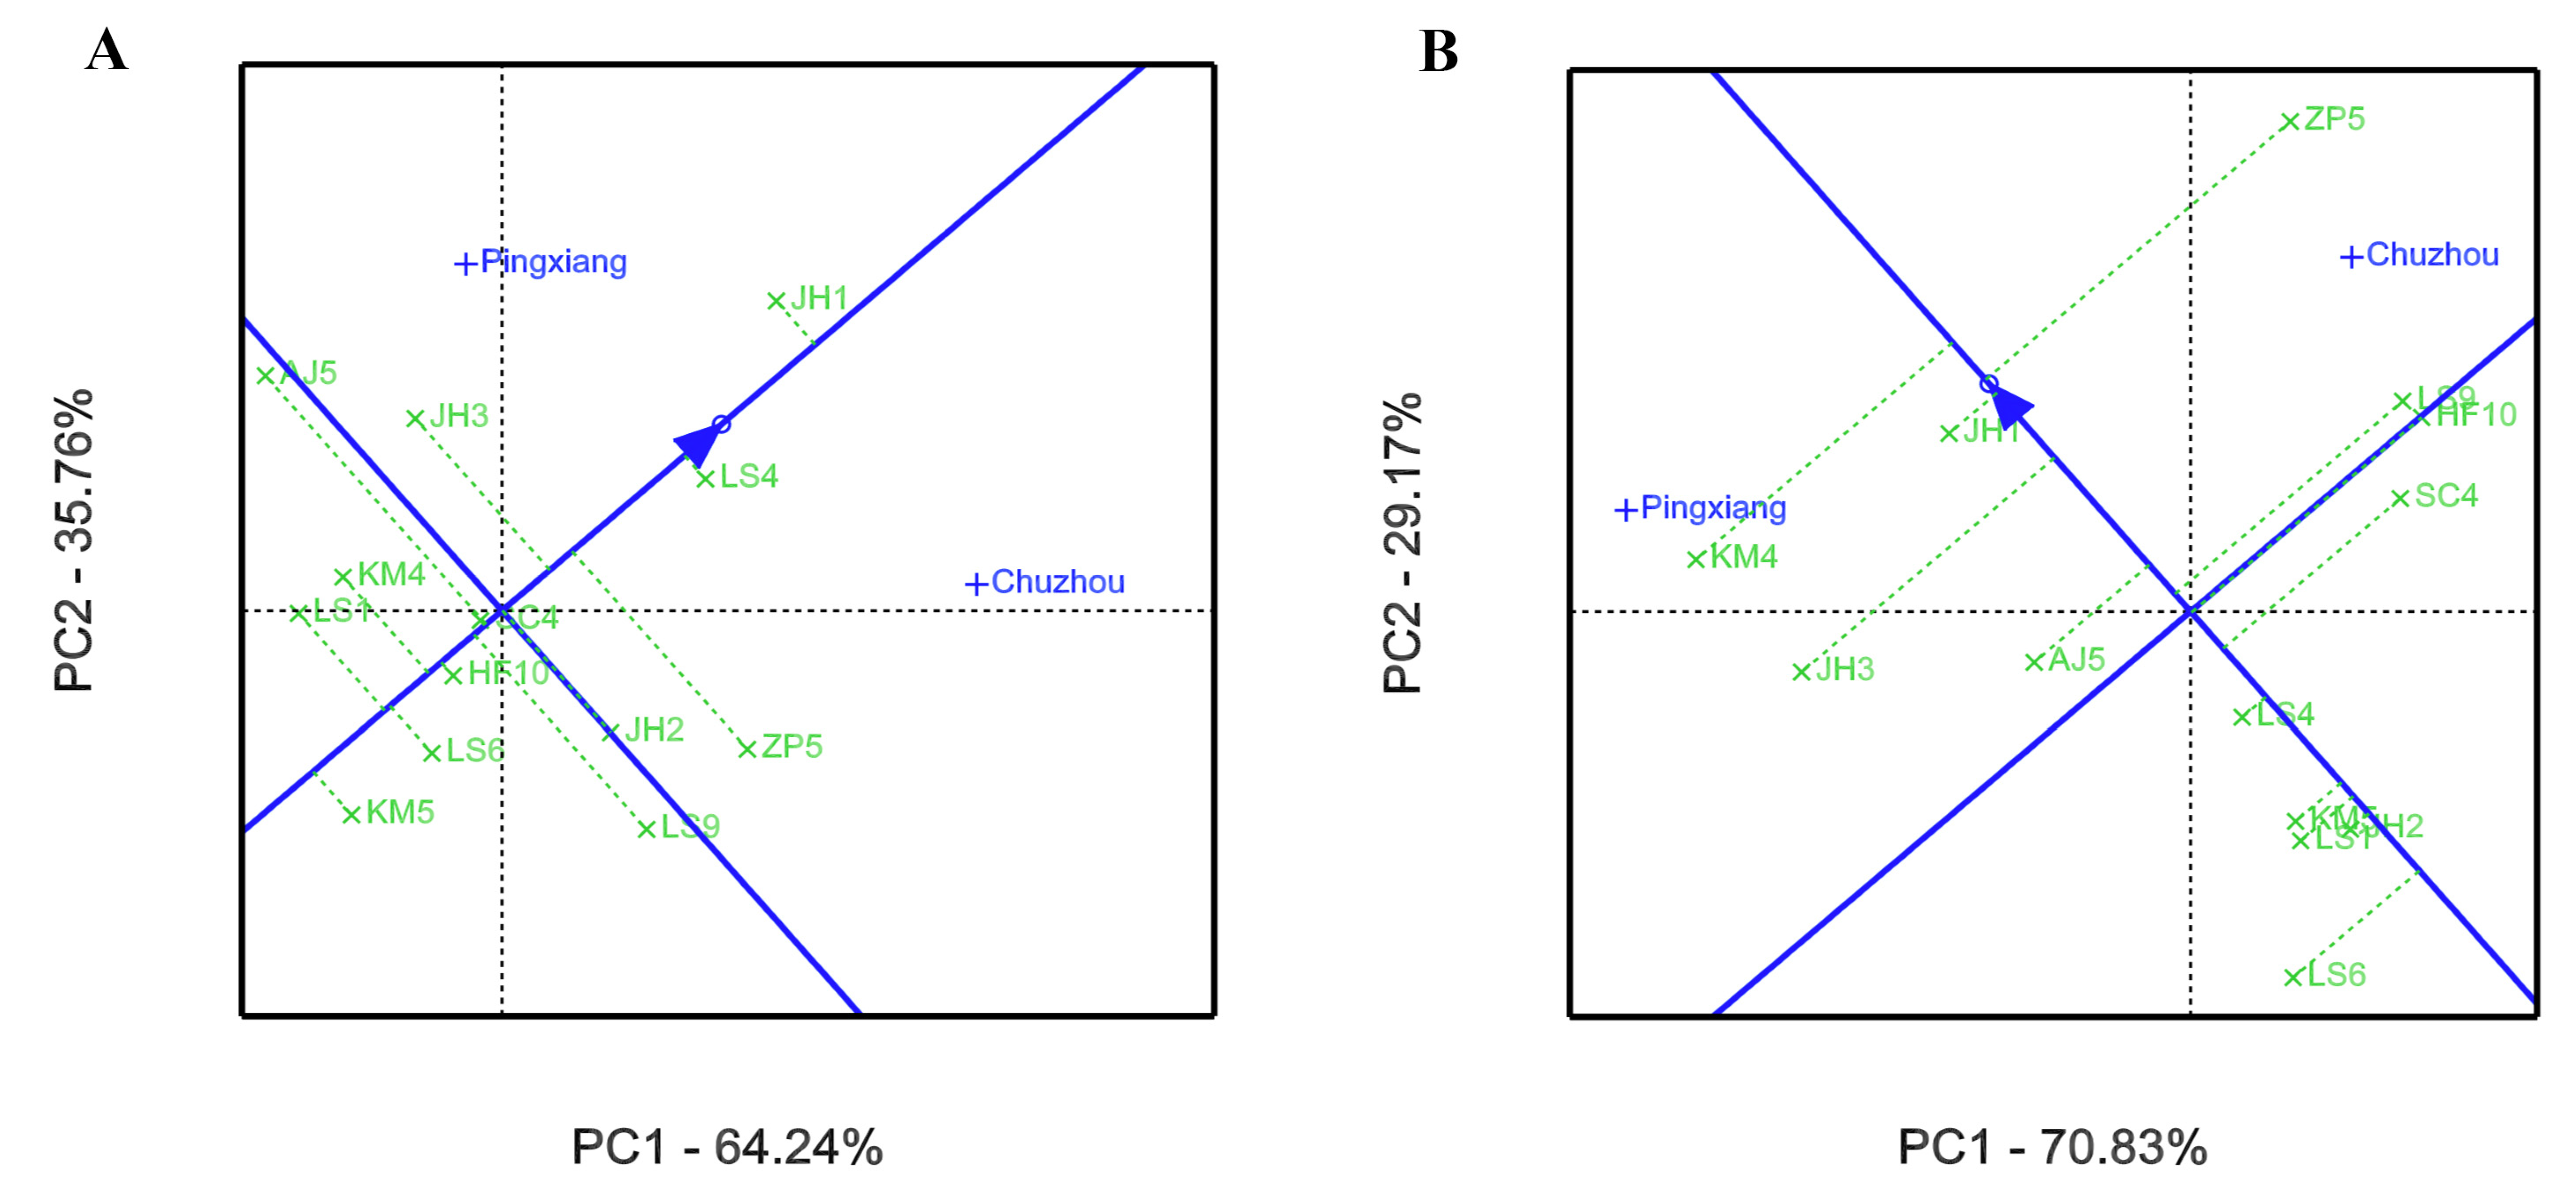
3.2. GEI Analysis for Growth and Leaf Phytochemical Content

The polygon views (indicating the which-won-where view) of the GGE biplot for the growth and leaf phytochemical content of C. paliurus are presented in Figure 3 and Figure 4, respectively, which were formed by connecting all genotypes that were furthest away from the biplot origin. Perpendicular lines from the origin point were used to divide the biplot into different sectors by passing through polygon sides. The genotypes at the vertices of each sector performed the best in the particular environment in the same sector. For the tree height growth, PC1 and PC2 accounted for 75.16% and 24.84% of the total variation (Figure 3A), respectively, while KM4, having the highest height (vertex genotype), was located in the sector including both sites, indicating its wide adaptability. For DBH, 78.95% and 21.05% of the total variation were explained by PC1 and PC2, respectively, in the polygon view of the GGE biplot (Figure 3B). LS1 performed the best for DBH growth at the Chuzhou site, while JH1 performed the best at the Pingxiang site. As depicted in Figure 5, PC1 explained a larger amount of the total variation for total flavonoid and total triterpenoid contents. JH1 had the highest content of total flavonoids and was the most adaptable genotype at both Pingxiang and Chuzhou sites (Figure 4A). The biplot for total triterpenoid content divided the two locations into two sectors with different wining genotypes. ZP5 exhibited the best performance for total triterpenoid content at the Chuzhou site, while KM4 was the most adaptable to the Pingxiang site (Figure 4B).
The average environment coordinate (AEC) views of the GGE biplot for the growth and leaf phytochemical content of C. paliurus genotype are presented in Figure 5 and Figure 6, respectively, on the basis of their mean and stability over the environments. The axis of the AEC abscissa (blue line), which passed through the biplot origin with an arrow, indicates the direction of the best genotype. The stability of the genotype was estimated via projection of the AEC ordinate axis (which passed through origin point and was perpendicular to the AEC abscissa), whereby the genotype was more stable when its projection was closer to the AEC abscissa [29]. For tree height growth, KM4 had the highest mean, with high stability across environments (Figure 5A). However, LS1 had moderate stability and showed the greatest DBH growth, whereas KM4 showed superior stability and a higher mean value (Figure 5B). For the total flavonoid content in the leaves, JH1 had the highest mean and had higher stability (Figure 6A), however the families of SC4, LS4, and HF10 were ranked in the top three in all tested genotypes in terms of the stability of the total flavonoid accumulation. For total triterpenoid content, KM4 had the highest mean but lower stability, while JH1 had a higher mean with higher stability (Figure 6B).
ANOVA is frequently used to identify whether the GEI was as a variation source but fails to analyze the GEI itself [30]. The traditional regression analysis is also limited when investigating GEI because it has a restraint condition, meaning that the independent variable (environmental mean) is not independent of the dependent variable (genotype mean) [20]. Additionally, in comparison to the additive main effects and multiplicative interaction (AMMI) model, which discardes genotypes as a main effect, GGE analysis can explain more of the variation sources [31]. The GGE biplot is a powerful tool that can be used to provide a visual evaluation of a genotype on the basis of its mean performance and stability across environments, along with the identification of mega-environments [32]. Therefore, GGE analysis is widely used to evaluate GEI effects for growth and yield traits in crops such as maize [33], wheat [34], and rice [30]. In recent years, the GGE biplot has also been applied in some tree species, such as Pongamia pinnata [16], Michelia chapensis [15], and olive trees [35]. This is the first time the stability and adaptability of C. paliurus genotypes have been analyzed using GGE models, as significant GEI effects were observed for all parameters. Displaying the which-won-where pattern as a polygon is helpful in identifying good performance and representative test locations [29]. In the present study, a vertex genotype may capture more than one particular environment in the polygon review. For instance, JH1 had the highest content of total flavonoids in the leaves and was highly recommended for planting at both Pingxing and Chuzhou sites. This was consistent with the viewpoint taken by Kumar et al. [36], who indicated that one genotype may suite several different mega-environments. The selection of ideal genotypes should not only rely on good mean performance but also high stability [37]. Based on the results of the which-won-where and AEC analyses, KM4 can be recommended as a superior genotype for growth (height and DBH), while JH1 can be suggested for phytochemical (total flavonoid and total triterpenoid contents) accumulation due to their high means and high stability levels. Moreover, KM4 and ZP5 could be candidate genotypes for total triterpenoid production in a specific environment due to their high means and low stability levels.

3.3. Correlation between Tree Growth and Leaf Phytochemical Content

Pearson’s correlation analysis indicated that the annual mean DBH was significantly and positively correlated with leaf phytochemical content in C. paliurus leaves when all data for the 13 families at the two sites were used (Table 4, p < 0.01), while no correlation between leaf phytochemical content and tree height growth was observed (p < 0.05), indicating that it is possible to select a genotype with both high diameter growth and leaf phytochemical content.
Understanding how different growth rates and environmental factors affect the production of secondary metabolites will be of great importance for the conservation of medicinal plants and the optimization of field growth conditions for the maximal recovery of phytomedicinal chemicals [38]. Several studies have proposed the idea of potential trade-offs between growth and the synthesis of secondary metabolites, whereas different tree species may result in both positive and negative correlations between growth rates and secondary metabolism [38,39,40,41]. Cao et al. [39] reported that the tree height and DBH of C. paliurus were negatively and significantly correlated with the contents of quercetin and kaempferol in the leaves, inconsistent with the results from the present study, showing significantly positive correlations between the annual mean DBH growth and the contents of quercetin-3-O-glucuronide and kaempferol-3-O-rhamnoside for flavonoids and cyclocaric acid B for triterpenoids in C. paliurus (Table 4, p < 0.001). However, Cao et al. [39] also reported no significant correlation between tree height growth and total flavonoid content, and furthermore Cai et al. [38] indicated that the reserpine concentration in coarse roots was positively correlated with the relative growth rate for two Rauvolfia species, even if not significantly, in agreement with our present results. It seems that potential trade-offs between plant growth and secondary metabolite synthesis are complicated, and our results do not fully support the resource availability theory, which predicts that rapidly growing plants in resource-rich habitats will contain low levels of highly mobile secondary metabolites [42,43].

4. Conclusions

The genotype, environment, and their interactions had significant effects on the growth and leaf phytochemical content of C. paliurus. Among them, the genotype and GEI showed lager contributions to the variation of most traits. Correlation analysis indicated that the annual mean DBH was significantly and positively correlated with the leaf phytochemical content of C. paliurus, indicating that it is possible to select a genotype with both high growth and a high leaf phytochemical content. Our results suggest that JH1 would be mainly extended as a superior genotype for the production of flavonoids and triterpenoids in the leaves, while KM4 could be spread for timber production or leaf triterpenoid production. However, further field trials with more genotypes and experimental locations are required to screen out superior C. paliurus genotypes with wide adaptation to environments or specific adaptation to target sites in the future.

Supplementary Materials

The following are available online at https://www.mdpi.com/article/10.3390/f12060735/s1, Figure S1: HPLC chromatograms of the representative sample solution (top) and the responding standard solution containing the flavonoid and triterpenoid compounds (bottom), Table S1: Coordinates and environmental factors for tested C. paliurus genotypes and test sites, Table S2: The significance level of factor (genotype, environment and their interaction) for tree growth and leaf phytochemical content of C. paliurus.

Author Contributions

M.Z. and S.F. conceived and designed the experiment. M.Z. and P.C. performed the experiment. M.Z. and P.C. analyzed the data. M.Z. and S.F. conceived the paper, wrote the first draft, and edited the manuscript. X.S. and W.Y. supervised the manuscript. All authors have read and agreed to the published version of the manuscript.

Funding

This work was financially supported by the National Natural Science Foundation of China (32071750), the Key Research and Development Program of Jiangsu Province (BE2019388), the Priority Academic Program Development of Jiangsu Higher Education Institutions (PAPD), and the Doctorate Fellowship Foundation of Nanjing Forestry University. The funders had no role in study design, data collection and analysis, decision to publish, or preparation of the manuscript.

Institutional Review Board Statement

Not applicable.

Informed Consent Statement

Not applicable.

Acknowledgments

We acknowledge Yuan Lin, Jian Qin, Xia Mao, and Peng Huang from Nanjing Forestry University for field and laboratory assistance. We would like to thank Senior Engineer Honghui Chen and Zhilong Liu from the Experimental Center of Tropical Forestry, Chinese Academy of Forestry, for their thoughtful help in the sampling.

Conflicts of Interest

The authors declare no conflict of interest.

References

  1. Fang, S.Z.; Wang, J.Y.; Wei, Z.Y.; Zhu, Z.X. Methods to break seed dormancy in Cyclocarya paliurus (Batal.) Iljinskaja. Sci. Horti-Amst. 2006, 110, 305–309. [Google Scholar] [CrossRef]
  2. Liu, Y.; Cao, Y.N.; Fang, S.Z.; Wang, T.L.; Yin, Z.Q.; Shang, X.L.; Yang, W.X.; Fu, X.X. Antidiabetic effects of Cyclocarya paliurus leaves depends on the contents of antihyperglycemic flavonoids and antihyperlipidemic triterpenoids. Molecules 2018, 23, 1042. [Google Scholar] [CrossRef] [PubMed] [Green Version]
  3. Wu, Z.F.; Gao, T.H.; Zhong, R.L.; Lin, Z.; Jiang, C.H.; Ouyang, S.; Zhao, M.; Che, C.T.; Zhang, J.; Yin, Z.Q. Antihyperlipidaemic effect of triterpenic acid-enriched fraction from Cyclocarya paliurus leaves in hyperlipidaemic rats. Pharm. Biol. 2017, 55, 712–721. [Google Scholar] [CrossRef] [Green Version]
  4. Xiong, L.; Hu, W.B.; Yang, Z.W.; Chen, H.; Ning, W.; Xin, L.; Wang, W.J. Enzymolysis-ultrasonic assisted extraction of flavonoid from Cyclocarya paliurus (Batal) Iljinskaja: HPLC profile, antimicrobial and antioxidant activity. Ind. Crop. Prod. 2019, 130, 615–626. [Google Scholar] [CrossRef]
  5. Xie, J.H.; Shen, M.Y.; Xie, M.Y.; Nie, S.P.; Chen, Y.; Li, C.; Huang, D.F.; Wang, Y.X. Ultrasonic-assisted extraction, antimicrobial and antioxidant activities of Cyclocarya paliurus (Batal.) Iljinskaja polysaccharides. Carbohyd. Polym. 2012, 89, 177–184. [Google Scholar] [CrossRef]
  6. Thakur, M.; Bhattacharya, S.; Khosla, P.K.; Puri, S. Improving production of plant secondary metabolites through biotic and abiotic elicitation. J. Appl. Res. Med. Aroma. 2019, 12, 1–12. [Google Scholar] [CrossRef]
  7. Li, Y.Q.; Kong, D.X.; Fu, Y.; Sussman, M.R.; Wu, H. The effect of developmental and environmental factors on secondary metabolites in medicinal plants. Plant Physiol. Bioch. 2020, 148, 80–89. [Google Scholar] [CrossRef] [PubMed]
  8. Isah, T. Stress and defense responses in plant secondary metabolites production. Biol. Res. 2019, 52, 39. [Google Scholar] [CrossRef] [PubMed] [Green Version]
  9. Sun, C.W.; Shang, X.L.; Ding, H.F.; Cao, Y.N.; Fang, S.Z. Natural variations in flavonoids and triterpenoids of Cyclocarya paliurus leaves. J. Forestry Res. 2020. [Google Scholar] [CrossRef]
  10. Deng, B.; Shang, X.L.; Fang, S.Z.; Li, Q.Q.; Fu, X.X.; Su, J. Integrated effects of light intensity and fertilization on growth and flavonoid accumulation in Cyclocarya paliurus. J. Agric. Food Chem. 2012, 60, 6286–6292. [Google Scholar] [CrossRef]
  11. Liu, Y.; Fang, S.Z.; Yang, W.X.; Shang, X.L.; Fu, X.X. Light quality affects flavonoid production and related gene expression in Cyclocarya paliurus. J. Photoch. Photobio. B 2018, 179, 66–73. [Google Scholar] [CrossRef] [PubMed]
  12. Qin, J.; Yue, X.L.; Shang, X.L.; Fang, S.Z. Nitrogen forms alter triterpenoid accumulation and related gene expression in Cyclocarya paliurus (Batalin) Iljinsk. Seedl. For. 2020, 11, 631. [Google Scholar] [CrossRef]
  13. Balakrishnan, D.; Subrahmanyam, D.; Badri, J.; Raju, A.K.; Rao, Y.V.; Beerelli, K.; Mesapogu, S.; Surapaneni, M.; Ponnuswamy, R.; Padmavathi, G.; et al. Genotype × Environment interactions of yield traits in backcross introgression lines derived from Oryza sativa cv. Swarna/Oryza nivara. Front. Plant. Sci. 2016, 7, 1530. [Google Scholar] [CrossRef] [Green Version]
  14. Chipeta, M.M.; Melis, R.; Shanahan, P.; Sibiya, J.; Benesi, I.R.M. Genotype × environment interaction and stability analysis of Cassava genotypes at different harvest times. J. Anim. Plant Sci. 2017, 27, 901–919. [Google Scholar]
  15. Wang, R.H.; Hu, D.H.; Zheng, H.Q.; Yan, S.; Wei, R.P. Genotype × environmental interaction by AMMI and GGE biplot analysis for the provenances of Michelia chapensis in South China. J. For. Res. 2015, 27, 659–664. [Google Scholar] [CrossRef]
  16. Rao, G.R.; Sarkar, B.; Raju, B.M.K.; Sathi-Reddy, P.; Subba-Rao, A.V.M.; Rebecca, J. Genotype × year interaction of pod and seed mass and stability of Pongamia pinnata families in a semi-arid region. J. For. Res. 2019, 31, 1333–1346. [Google Scholar] [CrossRef]
  17. Deng, B.; Cao, Y.N.; Fang, S.Z.; Shang, X.L.; Yang, W.X. Variation and stability of growth and leaf flavonoid content in Cyclocarya paliurus across environments. Ind. Crop. Prod. 2015, 76, 386–393. [Google Scholar] [CrossRef]
  18. Deng, B.; Fang, S.Z.; Shang, X.L.; Fu, X.X.; Yang, W.X. Influence of genotypes and environmental factors on leaf triterpenoid content and growth of Cyclocarya paliurus. J. For. Res. 2019, 30, 789–798. [Google Scholar] [CrossRef]
  19. Eberhart, S.A.; Russell, W.A. Stability parameters for comparing varieties. Crop. Sci. 1966, 6, 36–40. [Google Scholar] [CrossRef] [Green Version]
  20. Aarthi, S.; Suresh, J.; Leela, N.K.; Prasath, D. Multi environment testing reveals genotype-environment interaction for curcuminoids in turmeric (Curcuma longa L.). Ind. Crop. Prod. 2020, 145, 112090. [Google Scholar] [CrossRef]
  21. Li, F.M.; Tan, J.; Nie, S.P.; Dong, C.J.; Li, C. The study on determination methods of total flavonoids in Cyclocarya paliurus. Food Sci. Tec-Brazil. 2006, 4, 34–37. [Google Scholar] [CrossRef]
  22. Fan, J.P.; He, C.H. Simultaneous quantification of three major bioactive triterpene acids in the leaves of Diospyros kaki by high-performance liquid chromatography method. J. Pharmaceut. Biomed. 2006, 41, 950–956. [Google Scholar] [CrossRef] [PubMed]
  23. Cao, Y.N.; Fang, S.Z.; Yin, Z.Q.; Fu, X.X.; Shang, X.L.; Yang, W.X.; Yang, H.M. Chemical fingerprint and multicomponent quantitative analysis for the quality evaluation of Cyclocarya paliurus leaves by HPLC-Q-TOF-MS. Molecules 2017, 22, 1927. [Google Scholar] [CrossRef] [PubMed] [Green Version]
  24. Yan, W.; Kang, M.S. GGE Biplot Analysis: A Graphical Tool for Breeders, Geneticists, and Agronomists; CRC Press: Boca Raton, FL, USA, 2003. [Google Scholar] [CrossRef]
  25. Klápště, J.; Meason, D.; Dungey, H.S.; Telfer, E.J.; Silcock, P.; Rapley, S. Genotype-by-environment interaction in coast redwood outside natural distribution-search for environmental cues. BMC Genet. 2020, 21, 15. [Google Scholar] [CrossRef] [PubMed] [Green Version]
  26. Ling, J.J.; Xiao, Y.; Hu, J.W.; Wang, F.; Ouyang, F.Q.; Wang, J.H.; Weng, Y.H.; Zhang, H.G. Genotype by environment interaction analysis of growth of Picea koraiensis families at different sites using BLUP-GGE. New For. 2020. [Google Scholar] [CrossRef]
  27. Xie, P.J.; Huang, L.X.; Zhang, C.H.; Zhang, Y.L. Phenolic compositions, and antioxidant performance of olive leaf and fruit (Olea europaea L.) extracts and their structure-activity relationships. J. Funct. Foods 2015, 16, 460–471. [Google Scholar] [CrossRef]
  28. Sati, P.; Pandey, A.; Rawat, S.; Rani, A. Phytochemicals and antioxidants in leaf extracts of Ginkgo biloba with reference to location, seasonal variation and solvent system. J. Pharm. Res. 2013, 7, 804–809. [Google Scholar] [CrossRef]
  29. Yan, W. GGE Biplot-A Windows application for graphical analysis of multi-environment trial data and other types of two-way data. Agron. J. 2001, 93, 1111–1118. [Google Scholar] [CrossRef] [Green Version]
  30. Oladosu, Y.; Rafii, M.Y.; Abdullah, N.; Magaji, U.; Miah, G.; Hussin, G.; Ramli, A. Genotype × Environment interaction and stability analyses of yield and yield components of established and mutant rice genotypes tested in multiple locations in Malaysia. Acta Agric. Scand. Sect. B Siol Plant Sci. 2017, 67, 590–606. [Google Scholar] [CrossRef]
  31. Dia, M.; Wehner, T.C.; Hassell, R.; Price, D.S.; Boyhan, G.E.; Olson, S.; King, S.; Davis, A.R.; Tolla, G.E. Genotype environment interaction and stability analysis for watermelon fruit yield in the United States. Crop. Sci. 2016, 56, 1645–1661. [Google Scholar] [CrossRef]
  32. Yan, W.; Kang, M.S.; Ma, B.; Woods, S.; Cornelius, P.L. GGE Biplot vs. AMMI analysis of genotype-by-environment data. Crop. Sci. 2007, 47, 643–655. [Google Scholar] [CrossRef]
  33. Okoth, S.; Rose, L.J.; Ouko, A.; Netshifhefhe, N.E.I.; Sila, H.; Viljoen, A. Assessing genotype-by-environment interactions in Aspergillus ear rot and pre-harvest aflatoxin accumulation in maize inbred lines. Agronomy 2017, 7, 86. [Google Scholar] [CrossRef] [Green Version]
  34. Mohammadi, R.; Amri, A. Genotype × environment interaction and genetic improvement for yield and yield stability of rainfed durum wheat in Iran. Euphytica 2013, 192, 227–249. [Google Scholar] [CrossRef]
  35. Navas-Lopez, J.F.; León, L.; Rapoport, H.F.; Moreno-Alías, I.; Lorite, I.J.; Rosa, R.D.I. Genotype, environment and their interaction effects on olive tree flowering phenology and flower quality. Euphytica 2019, 215, 84. [Google Scholar] [CrossRef]
  36. Kumar, N.; Ajay, B.C.; Dagla, M.C.; Rathnakumar, A.L.; Radhakrishnan, T.; Lal, C.; Samdur, M.Y.; Mathur, R.K.; Manivel, P. Multi-environment evaluation of Spanish bunch groundnut genotypes for fresh seed dormancy. Indian J. Genet. 2019, 79, 572–582. [Google Scholar] [CrossRef]
  37. Farshadfar, E.; Mahmodi, N.; Yaghotipoor, A. AMMI stability value and simultaneous estimation of yield and yield stability in bread wheat (Triticum aestivum L.). Aust. J. Crop. Sci. 2011, 5, 1837–1844. [Google Scholar] [CrossRef]
  38. Cai, Z.Q.; Wang, W.H.; Yang, J.; Cai, C.T. Growth, photosynthesis and root reserpine concentrations of two Rauvolfia species in response to a light gradient. Ind. Crop. Prod. 2009, 30, 220–226. [Google Scholar] [CrossRef]
  39. Cao, Y.N.; Deng, B.; Fang, S.Z.; Shang, X.L.; Fu, X.X.; Yang, W.X. Genotypic variation in tree growth and selected flavonoids in leaves of Cyclocarya paliurus. South For. 2018, 80, 67–74. [Google Scholar] [CrossRef]
  40. Stowe, K.A.; Marquis, R.J.; Hochwebder, C.G.; Simms, E.L. The evolutionary ecology of tolerance to consumer damage. Ann. Rev. Ecol. Syst. 2000, 31, 565–595. [Google Scholar] [CrossRef]
  41. Weis, A.; Simms, E.; Hochberg, M.E. Will plants and tolerance be genetically correlated? Effects of intrinsic growth rate and self-limitation on regrowth. Evol. Ecol. 2000, 14, 331–352. [Google Scholar] [CrossRef]
  42. Coley, P.D. Herbivory and defensive characteristics of tree species in a lowland tropical forest. Ecol. Monogr. 1983, 53, 209–233. [Google Scholar] [CrossRef]
  43. Strauss, S.Y.; Agrawal, A.A. The ecology and evolution of plant tolerance to herbivory. Trends Ecol. Evol. 1999, 14, 179–185. [Google Scholar] [CrossRef]
Figure 1. A map of the natural distribution (a small map with a dotted blue line box), genotype origin, and test sites for Cyclocarya paliurus (Batal.) Iljinskaja.
Forests 12 00735 g001
Figure 2. The percentage contributions of the genotype, environment, and their interaction effects for each trait across environments. The contribution value of each factor was the ratio of the sum of the square (SS) for each factor to the SS of the total variation from ANOVA. Height: tree height; DBH: diameter at breast height; F1: quercetin-3-O-glucuronide; F2: quercetin-3-O-galactoside; F3: isoquercitrin; F4: kaempferol-3-O-glucuronide; F5: kaempferol-3-O-glucoside; F6: quercetin-3-O-rhamnoside; F7: kaempferol-3-O-rhamnoside; TF: total flavonoid; T1: arjunolic acid; T2: cyclocaric acid B; T3: pterocaryoside B; T4: pterocaryoside A; T5: hederagenin; T6: oleanolic acid; TT: total triterpenoid.
Forests 12 00735 g002
Figure 3. Polygon views of the GGE biplot based on symmetrical scaling for the which-won-where pattern for C. paliurus genotypes evaluated for tree height (A) and diameter at breast height (B).
Forests 12 00735 g003
Figure 4. Polygon views of the GGE biplot based on symmetrical scaling for the which-won-where pattern for the leaves of C. paliurus genotypes evaluated for total flavonoid content (A) and total triterpenoid content (B).
Forests 12 00735 g004
Figure 5. Average environment coordination (AEC) views of the GGE biplot based on environment-focused scaling of C. paliurus genotypes evaluated for tree height (A) and diameter at breast height (B).
Forests 12 00735 g005
Figure 6. Average environment coordination (AEC) views of the GGE biplot based on environment-focused scaling in the leaves of C. paliurus genotypes evaluated for total flavonoid content (A) and total triterpenoid content (B).
Forests 12 00735 g006
Table 1. Mean tree height and diameter at breast height (DBH) values for Cyclocarya paliurus (Batal.) Iljinskaja genotypes across two test sites.
FamilyTree Height (m) Diameter at Breast Height (cm)
AJ57.28 ± 0.55 adc 6.83 ± 1.95 bc
HF105.97 ± 1.08 cde 7.50 ± 2.24 b
JH17.32 ± 0.51 abc 10.83 ± 2.21 a
JH25.75 ± 0.73 de 6.82 ± 2.34 bc
JH36.55 ± 1.28 bcd 9.73± 2.45 a
KM48.65 ± 0.54 a10.43 ± 1.32 a
KM56.43 ± 0.88 b–e 5.27 ± 0.69 cde
LS17.73 ± 0.80 ab11.32 ± 1.30 a
LS46.65 ± 0.94 bcd 7.38 ± 0.66 b
LS66.68 ± 1.87 bcd 7.33 ± 2.57 b
LS95.02 ± 1.05 e 4.38 ± 1.58 e
SC45.68 ± 0.50 de 4.80 ± 0.75 de
ZP56.00 ± 1.02 cde 6.67 ± 2.58 bcd
Note: Values with different superscripts in the same column are significantly different at the 0.05 level. The highest value is marked using bold and the second highest value is marked using italics in each column.
Table 2. Mean flavonoid contents in the leaves of 13 C. paliurus genotypes across two test sites.
FamilyFlavonoid Content (mg/g)
F1F2F3F4F5F6F7TF
AJ50.17 ± 0.09 e0.05 ± 0.02 g0.09 ± 0.06 cd0.35 ± 0.27 e0.09 ± 0.02 c0.06 ± 0.02 e0.35 ± 0.38 f6.14 ± 4.77 def
HF100.48 ± 0.42 d0.18 ± 0.17 f0.06 ± 0.06 f0.49 ± 0.37 d0.08 ± 0.01 d0.05 ± 0.03 f0.34 ± 0.32 f5.48 ± 0.64 efg
JH12.20 ± 0.09 a0.49 ± 0.04 a0.23 ± 0.00 a0.74 ± 0.03 b0.13 ± 0.01 a0.23 ± 0.07 a1.21 ± 0.41 a11.03 ± 0.58 a
JH20.63 ± 0.40 c0.25 ± 0.04 e0.10 ± 0.02 c0.49 ± 0.12 d0.09 ± 0.01 bc0.07 ± 0.03d0.58 ± 0.40 d6.39 ± 1.61 de
JH30.93 ± 0.42 b0.31± 0.06 d0.13 ± 0.06 b0.80 ± 0.41 b0.10 ± 0.02 b0.16 ± 0.08 b1.02 ± 0.62 b7.09 ± 2.87 cd
KM40.66 ± 0.33 c0.19 ± 0.13 f0.08 ± 0.08 de0.47 ± 0.30 d0.06 ± 0.07 e0.06 ± 0.03 ef0.37 ± 0.20 f5.29 ± 2.60 fg
KM50.18 ± 0.12 e0.08 ± 0.06 g0.01 ± 0.01 g0.13 ± 0.05 f0.06 ± 0.00 e0.02 ± 0.03 g0.07 ± 0.07 h3.58 ± 0.76 h
LS10.22 ± 0.06 e0.06 ± 0.02 g0.02 ± 0.01 g0.16 ± 0.05 f0.06 ± 0.00 e0.03 ± 0.00 g0.15 ± 0.05 g4.64 ± 2.74 g
LS40.85 ± 0.26 b0.38 ± 0.17 c0.13 ± 0.10 b0.64 ± 0.26 c0.09 ± 0.02 bc0.12 ± 0.01 c0.53 ± 0.09 de9.09 ± 0.75 b
LS60.20 ± 0.14 e0.06 ± 0.02 g0.01 ± 0.01 g0.16 ± 0.05 f0.06 ± 0.00 e0.02 ± 0.03 g0.13 ± 0.12 g4.72 ± 0.49 g
LS90.44 ± 0.40 d0.24 ± 0.24 e0.06 ± 0.07 ef0.61 ± 0.57 c0.04 ± 0.05 f0.06 ± 0.04 e0.51 ± 0.54 e5.96 ± 2.55 ef
SC40.65 ± 0.64 c0.42 ± 0.19 bc0.24 ± 0.06 a0.48 ± 0.33 d0.12 ± 0.01 a0.17 ± 0.04 b0.48 ± 0.31 e6.12 ± 1.06 ef
ZP50.70 ± 0.54 c0.43 ± 0.40 b0.09 ± 0.09 cd0.88 ± 0.68 a0.08 ± 0.01 d0.13 ± 0.08 c0.80 ± 0.48 c7.42 ± 3.08 c
Note: F1: quercetin-3-O-glucuronide; F2: quercetin-3-O-galactoside; F3: isoquercitrin; F4: kaempferol-3-O-glucuronide; F5: kaempferol-3-O-glucoside; F6: quercetin-3-O-rhamnoside; F7: kaempferol-3-O-rhamnoside; TF: total flavonoid. Values with different superscripts in the same column are significantly different at the 0.05 level. The highest value is marked using bold and the second highest value is marked using italics in each column.
Table 3. Mean triterpenoid contents in the leaves of 13 C. paliurus genotypes across two test sites.
FamilyTriterpenoid Content (mg/g)
T1T2T3T4T5T6TT
AJ53.72 ± 2.82 d 1.47 ± 1.13 b 0.77 ± 0.03 d 2.02 ± 0.82 d 0.78 ± 0.40 c 0.40 ± 0.03 d 16.34 ± 6.92 d
HF101.63 ± 1.38 g 1.19 ± 0.99 cd 0.44 ± 0.48 f 1.00 ± 0.98 g 0.25 ± 0.28 f 0.24 ± 0.22 fg 15.04 ± 5.57 ef
JH14.59 ± 2.31 b1.81 ± 0.74 a0.54 ± 0.38 ef 2.58 ± 2.31 c 0.60 ± 0.60 d 0.65 ± 0.28 a21.04 ± 6.99 b
JH22.41 ± 0.32 f 1.28 ± 0.26 c 0.47 ± 0.07 f 1.25 ± 0.17 f 0.31 ± 0.03 f 0.29 ± 0.04 ef 9.55 ± 0.68 h
JH34.31 ± 3.16 c 1.60 ± 0.85 b 2.21 ± 1.93 a3.52 ± 3.07 b0.74 ± 0.49 c 0.28 ± 0.04 f 19.26 ± 13.09 c
KM44.56 ± 2.92 bc 1.84 ± 1.15 a1.56 ± 0.92 b 5.05 ± 3.95 a0.88 ± 0.79 b0.55 ± 0.36 b 22.42 ± 14.76 a
KM50.75 ± 0.42 h 0.55 ± 0.17 f 0.18 ± 0.15 g 0.69 ± 0.31 h 0.14 ± 0.02 g 0.10 ± 0.04 h 10.40 ± 1.62 h
LS10.62 ± 0.40 h 0.39 ± 0.15 g 0.19 ± 0.21 g 0.49 ± 0.39 hi 0.14 ± 0.13 g 0.13 ± 0.10 h 10.03 ± 1.69 h
LS42.16 ± 0.21 f 1.10 ± 0.32 d 1.00 ± 0.13 c 1.88 ± 0.52 d 0.15 ± 0.06 g 0.21 ± 0.04 g 12.73 ± 2.08 g
LS60.54 ± 0.13 h 0.35 ± 0.06 g 0.07 ± 0.08 g 0.35 ± 0.11 i 0.07 ± 0.02 h 0.09 ± 0.04 h 7.99 ± 3.15 i
LS91.78 ± 1.36 g 0.79 ± 0.51 e 1.74 ± 1.86 b1.95 ± 1.82 d 0.28 ± 0.25 f 0.33 ± 0.28 e 15.54 ± 5.22 de
SC42.74 ± 0.82 e 1.23 ± 0.64 cd 1.06 ± 0.96 c 1.50 ± 1.03 e 0.52 ± 0.02 e 0.49 ± 0.06 c 14.05 ± 4.22 f
ZP55.06 ± 1.37 a1.84 ± 1.66 a0.71 ± 0.35 de 2.72 ± 0.66 c 1.04 ± 0.23 a0.58 ± 0.21 b21.40 ± 4.93 ab
Note: T1: arjunolic acid; T2: cyclocaric acid B; T3: pterocaryoside B; T4: pterocaryoside A; T5: hederagenin; T6: oleanolic acid; TT: total triterpenoid. Values with different superscripts in the same column are significantly different at the 0.05 level. The highest value is marked using bold and the second highest value is marked using italics in each column.
Table 4. Pearson’s correlation coefficients between the annual mean growth (tree height and DBH) and leaf phytochemical content values of 13 C. paliurus genotypes across two test sites.
IndexF1F2F3F4F5F6F7TFT1T2T3T4T5T6TT
Height0.13−0.03−0.04−0.030.010.020.02−0.050.110.14−0.030.190.140.200.07
DBH0.50 **0.23 *0.24 *0.35 **0.26 *0.39 **0.50 **0.35 **0.45 **0.47 **0.25 *0.44 **0.37 **0.31 **0.41 **
Note: Height: tree height; DBH: diameter at the breast height; F1: quercetin-3-O-glucuronide; F2: quercetin-3-O-galactoside; F3: isoquercitrin; F4: kaempferol-3-O-glucuronide; F5: kaempferol-3-O-glucoside; F6: quercetin-3-O-rhamnoside; F7: kaempferol-3-O-rhamnoside; TF: total flavonoid; T1: arjunolic acid; T2: cyclocaric acid B; T3: pterocaryoside B; T4: pterocaryoside A; T5: hederagenin; T6: oleanolic acid; TT: total triterpenoid; * indicates significance at 0.05 level; ** indicates significance at 0.01 level.
Publisher’s Note: MDPI stays neutral with regard to jurisdictional claims in published maps and institutional affiliations.

