Article

Dissecting Taxonomic Variants within Ulmus spp. Complex in Natural Forests with the Aid of Microsatellite and Morphometric Markers

by
Sigitas Tamošaitis
1,
Girmantė Jurkšienė
1,*,
Raimundas Petrokas
1,
Jurata Buchovska
1,
Ilona Kavaliauskienė
2,
Darius Danusevičius
3 and
Virgilijus Baliuckas
1,3
1
Lithuanian Research Centre for Agriculture and Forestry, Liepu Str. 1 Girionys, LT-53101 Kaunas Distr., Lithuania
2
Independent Researcher, LT-44248 Kaunas, Lithuania
3
Agriculture Academy, Faculty of Forest Sciences and Ecology, Vytautas Magnus University, K. Donelaičio g. 58, LT-44248 Kaunas, Lithuania
*
Author to whom correspondence should be addressed.
Forests 2021, 12(6), 653; https://doi.org/10.3390/f12060653
Submission received: 20 April 2021 / Revised: 12 May 2021 / Accepted: 17 May 2021 / Published: 21 May 2021
(This article belongs to the Section Genetics and Molecular Biology)

Abstract

:
Spontaneous hybrids between the native elms (genus Ulmus L.) have been observed in the forests of Europe. Gene conservation raises questions regarding the genetic background for the complex morphology and taxonomy of elms. Our objective was to dissect morphological and genetic variation in the natural swamps of Ulmus species groups in Lithuanian forests with the aid of leaf morphology and microsatellite (SSR) markers. We sampled leaves from 189 elms at 26 locations to grasp the phenotypic diversity in variable natural habitats in Lithuanian forests. We assigned the elms into six taxonomic and genetics groups based on 31 leaf morphology parameters and tested the genetic differentiation between these six groups at six nuclear SSR loci by using Bayesian and genetic distance-based clustering. The genetic and leaf morphometric analyses of putative elm hybrid swamps indicated a low genetic exchange between U. laevis Pall. and the other Ulmus groups. The genetic and morphometric data supported the differentiation of U. glabra Huds. and U. glabra (female) × U. minor Mill. (male) spontaneous hybrids. In addition, the results of the genetic analysis also confirmed the high level of genome sharing among U. minor and U. minor subsp. minor Richens., where leaf morphology failed to differentiate genetically discrete groups. For gene conservation, we would suggest considering separate gene conservation units selected based on leaf and stem morphology for U. laevis, U. glabra, U. glabra × minor, and the U. minor species complex.

1. Introduction

Interspecific hybridization is a common feature in plants with vital evolutionary consequences [1,2,3]. There are variable opinions on the role of hybridization in plants. First of all, interspecific hybridization has often been considered a source for genetic and phenotypic novelties and a force for evolution, but hybridization can also cause genetic erosion, threaten species integrity, and lead to species extinction [2,4,5]. Hybridization can lead to “evolutionary innovation” through the generation of new genotypes, an increase in heterosis, a pool of constant genetic variation, and a decrease in genetic load [6,7,8,9,10]. Hybrid zones often represent regions with high genetic variation and unique combinations of alleles, where selection can be intense and evolution can be rapid [6,11]. Morphological data can provide information about evolutionary and environmental phenomena associated with hybridization, since hybrids are not always intermediate between parental species, but they often exhibit extremes and new traits [12]. The percentage of plants with distinctive or new traits increases with subsequent generations of hybrids, as does the percentage of traits that show extremes. Hybrids often exhibit characteristics that parent species do not have [13]. Intraspecific hybridization enhances genetic diversity [9,14,15,16]. This hybridization takes place when gene flow occurs between genetically different populations or species. In interspecific hybridization, new genotypes can arise as a result of crossing trees from different populations that were previously geographically separated or by mixing different varieties [9,17]. Intraspecific hybridization can cause plant invasion [18]. More than 700 species of trees are considered invasive, with serious economic and environmental consequences worldwide [19].
Natural hybrids of wych elm (Ulmus glabra Huds.) and smooth-leaved elm (U. minor subsp. minor Richens) are common in Europe, since these two species were most widely planted in rural areas, first in the northern regions (Scandinavia and northern Great Britain) and then in the south. Usually, controlled mating helps to morphologically differentiate pure species from their hybrids. However, the genus Ulmus L. is atypical in this regard, and the classification of species should be limited to species-specific characters [20]. The approach used here was consistent with the Richens approach [21], which adhered to a strategy according to which there are only two elm species in the British Isles: U. glabra and U. minor, and both species intersect, resulting in hybrid species of natural origin. U. × hollandica Mill. Unfortunately, each individual of the group U. minor, U. × hollandica, and U. glabra can again interbreed with one of its paternal species. This process can be repeated from generation to generation, and it is called introgressive hybridization. Such hybridization can lead to the degradation of parent species and a loss of biodiversity [22]. A decrease in landscape heterogeneity is likely to increase the overall likelihood of crossbreeding by weakening the ecological selection of different species and/or removing environmental barriers to increase the gene flow between species. Introgression can lead to the fact that species will acquire new adaptive traits that allow them to colonize new habitats or increase their suitability in an existing niche. The phenomenon of hybrids superior to parental species in growth and adaptation is known as hybrid heterosis [23,24].
Richens and Jaffers [20,25,26,27,28] studied the morphological leaf characteristics of elm species and their hybrids in England and France in detail with different methods. They analyzed eight leaf traits on European elm species: leaf length and width, petiole length, base asymmetry, and four tooth characteristics. Several authors [29,30,31,32,33,34] have used these above-mentioned and additional parameters, e.g., Elowsky et al. [29] used the leaf tooth parameters to determine U. rubra and U. pumila hybrids; Myking and Yakovlev [30] studied the length-to-width ratio, the presence of lateral lobes, and the method of leaf tapering to assess the leaf variability in U. glabra; Vander Mijnsbrugge et al. [31] used leaf morphological traits to detect the diversity of isolated and declined relict populations of U. laevis in a field trial with a single-tree-plot design; and Zebec et al. [32,33,34] studied inter-population and intra-population morphological variability of foliar traits in natural populations of U. glabra [32] and U. minor [33,34]. In Lithuania, elm species and hybrids were studied based on 14 leaf morphology traits by Petrokas and Baliuckas [35]. The later study did not find significant differences in leaf morphology between U. glabra and U. minor, but the putative hybrids between U. minor subsp. minor and U. glabra accounted for less than two percent of all individuals in the group of U. minor, U. × hollandica, and U. glabra. The exceptional variability in the morphological characteristics of this taxa in the contact zones and the presence of extreme morphological variants or new (hybrid) properties suggest introgressive hybridization. Nevertheless, the morphological characteristics were not able to fully assess the degree of hybridization. Melville [36] found that truly intermediate forms are rare in the F1 generation after controlled matings. The most common observation was that one parent was partially dominant at the base of the leaf and the other partially dominated at the top of the leaf. These studies on the leaf morphological variation in elms left no doubt that the hybridization process is ongoing and provides additional morphology markers to discriminate among the species contributing to the hybridization. In our study, we verified morphological variation with the aid of microsatellite markers.
Microsatellite markers (simple sequence repeats—SSRs) are short, tandemly repeated DNA sequences that are valuable molecular tools for various eco-genetic studies due to the high degree of polymorphism, abundance, co-dominance, and easy transferability among the species and laboratories [37,38,39,40]. SSRs are very often in use for studying related trees species and their hybrids, but the development of new SSRs is an expensive and time-consuming procedure. Thus, the transferability of nuclear microsatellite loci across species is important and depends on various factors, e.g., the level of hybridization, genome size, different breeding systems, and evolution history. [38,39]. The successful transferability of SSRs among species enables us to use them for related species [39]. There have been a number of studies of Ulmus species where the same microsatellite markers are in use, e.g., Zalapa et al. [41] developed 15 microsatellite loci in U. rubra and tested their cross-amplification in U. pumila, which was successful—all 15 primers were amplified in both species; Zalapa et al. [42] used 13 nSSRs to study hybridization among U. rubra and an invasive tree—U. pumila; Nielsen and Kjaer [43] tested 22 nSSRs and selected seven to study U. laevis from Denmark, southern Sweden, and Finland; Venturas et al. [44] tested 19 nSSRs and selected nine to study U. laevis in Spain; Bertolasi et al. [45] studied gene flow between local U. minor and introduced U. pumila populations based on six microsatellite markers and found that species could hybridize when in sympatry; Buiteveld et al. [46] tested 23 nSSRs and selected ten to study U. minor in the Netherlands; and Martin del Puerto et al. [47] tested 22 nSSRs and selected 11 to study U. glabra in the Iberian Peninsula. Thus, a high number of studies have proven the successful transferability of SSRs among several Ulmus species.
There have been several studies [46,48,49,50] on hybridization among Ulmus spp., e.g., Mittempergher and Porta [51] presented data on the cross-ability and rate of selfing derived from crossing trials among 11 elm species. Studies showed that barriers to hybridization among species were weak, with the success of several combinations dependent on male–female interaction and the parental individual. An exceptional cross-ability barrier was found between U. laevis and the other Ulmus species. Zalapa et al. [42] identified a surprisingly large number of hybrids among an invasive U. pumila and local U. rubra hybrid individuals in the United States based on genetic analyses. Brunet et al. [52] studied the hybridization of Siberian elm (U. pumila) with native field elm (U. minor) in Italy. They used genetic markers to examine the extent of hybridization between these two species and to determine the pattern of introgression, and they found that hybrids between U. pumila and U. minor are quite common. Buiteveld et al. [46] used microsatellite markers to describe clonal diversity and structure, as well as to calculate genetic diversity parameters, in Dutch U. minor populations. At four locations, they found some individuals that might have been hybrids or at least not pure U. minor specimens based on STRUCTURE clustering analysis including parental species. Recently, Hirsch et al. [3] studied interspecific hybridization between the Siberian elm (U. pumila) and native elm species in the Midwestern United States, Italy, and Spain. They used a set of nuclear microsatellite markers and the program STRUCTURE to detect interspecific hybridization and determine the populations’ genetic structure. DNA marker-based findings proved the presence of intraspecific hybridization. Hirsch et al. [3] supplemented evidence from previous studies and reported on intraspecific hybridization within Ulmus genus.
The aims of this work were (i) to elucidate the morphological differences between the critical groups of native elms, indicative for their taxonomic identity; (ii) to determine the morphological boundaries of taxa; and (iii) use the latter findings as the basis for the further study of species determination, hybrid identification, and genetic diversity based on nuclear microsatellite markers.

2. Materials and Methods

2.1. Objects and Material

Putative natural hybrids between smooth-leaved elm (U. minor subsp. minor), field elm (U. minor), wych elm (U. glabra), and European white elm (U. laevis), along with the individuals of pure species, were sampled for the laboratory examination of leaf morphology and DNA microsatellite analysis in natural mixed forests of Lithuania. This choice was based on our experience in exploring local elms [35,53]. The smooth-leaved elm (U. minor ssp. minor) is the most common type of field elm in continental Europe today [54,55]. In Europe, this subspecies has a more southerly distribution than U. glabra, and it is unknown in Denmark, Sweden, and Norway as a wild tree, though it is said to occur in the Baltic [56]. The smooth-leaved elm is identified by mature leaves that are smooth, glossy, bright green from above, and very unequal at the base [53] The two groups of hybrid elm trees were identified based on the visual examination of leaf morphology traits and stem morphotypes on site: (a) U. glabra × U. minor and (b) U. minor subsp. minor × U. glabra. The study sites were selected all over the country based on the presence of elm species and the elm hybrid swarms (Figure 1). At each site, study plots of 40 m radius were established, usually on moist fertile soils suitable for elm species. During the summers of 2018–2020 in each sample plot, 5–10 leaves were collected from long shoots at a height of 5–8 m of randomly selected mature elm trees (diameter > 15 cm) with aim of sampling approximately 30 trees for each of the four elm species and each of the two hybrid groups. Jeffers [27] suggested that the leaves on long shoots show far less sharp differentiation (in leaf length and width, petiole length, leaf base asymmetry, teeth number, teeth width, length, and depth) between different kinds of elm than those on short shoots. A minimum distance of 20 m was maintained among the sampled trees to avoid clones or close relatives.

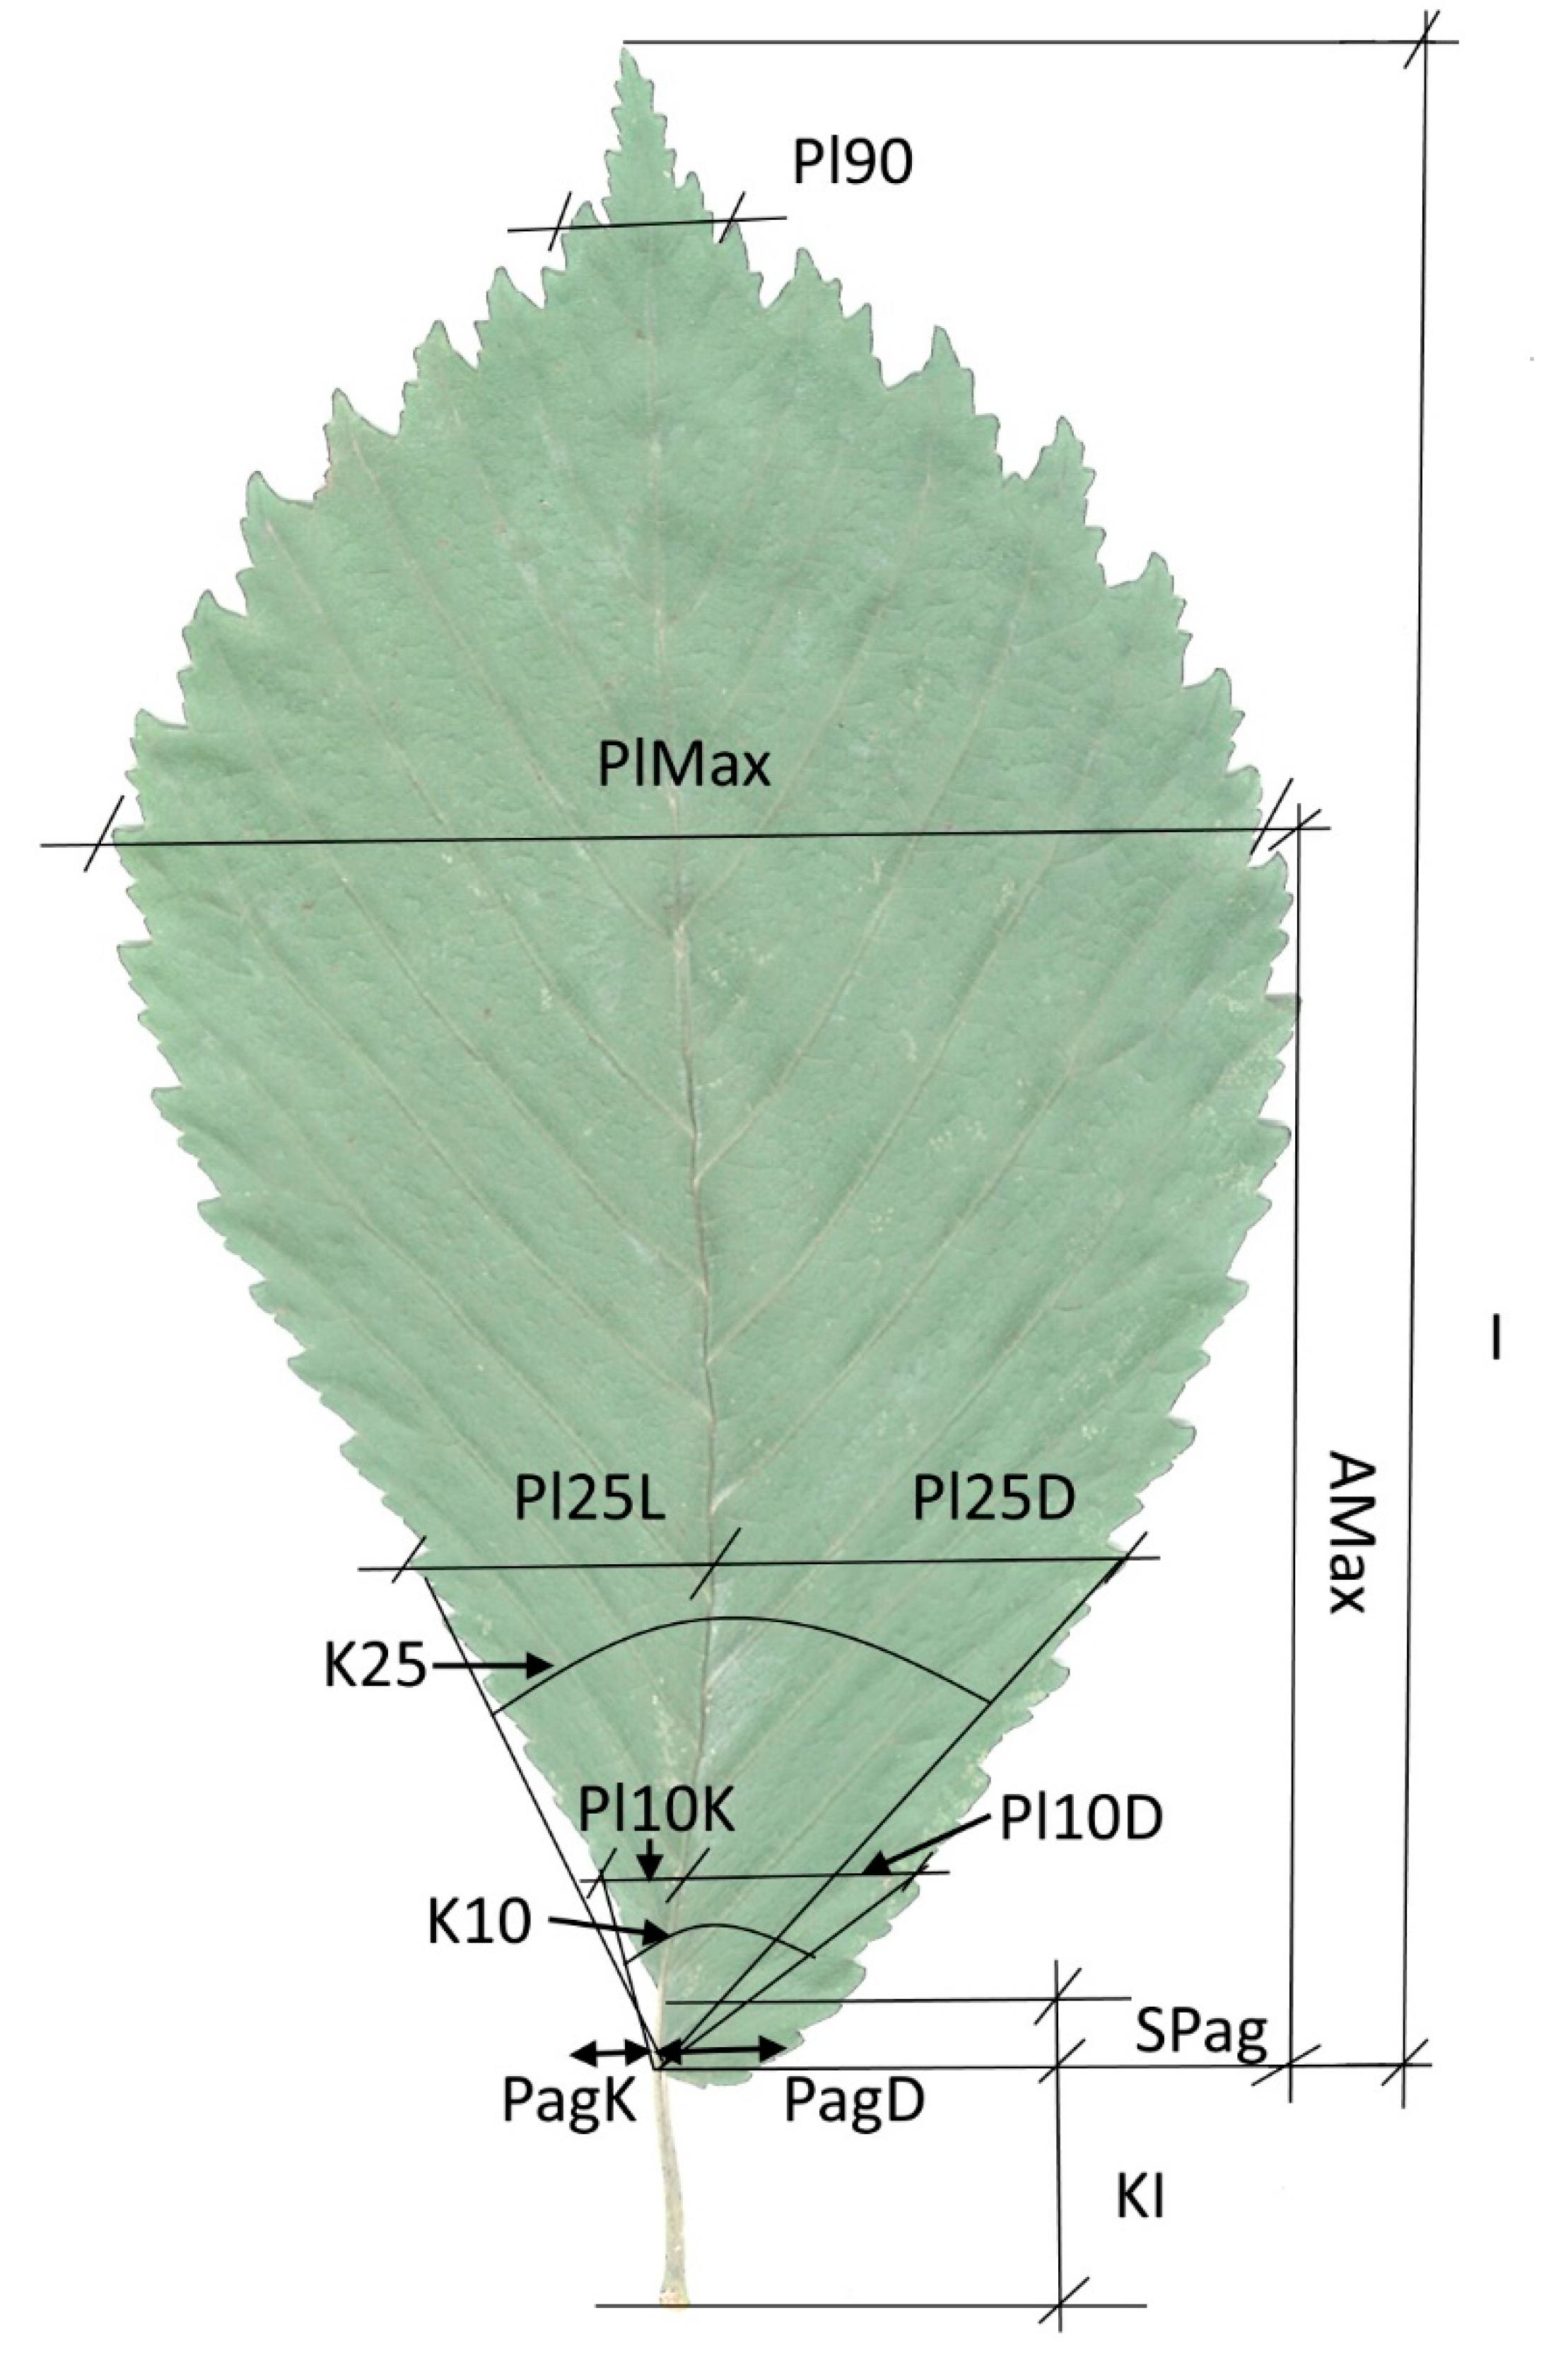
2.2. Leaf Characters Studied

In total, the leaf morphology traits of 189 elm trees with 5–10 leaves per tree were scanned and measured with the WinFolia 2016 Leaf analysis program [57]: U. glabra (59 trees), U. minor (22 trees), U. glabra × U. minor (30 trees), U. minor subsp. minor (31 trees), U. minor subsp. minor × U. glabra (20 trees), and U. laevis (27 trees) (Figure 2). The tree mean values of the leaf traits were used in the data analysis. The WinFolia program was used to score 16 leaf traits; additionally, four leaf traits were derived (No. 17–20; Table 1), one trait was assessed visually (IS, No. 21; Table 1), and nine traits for pubescens character were scored on microscope (4× digital zoom, No. 22–31; Table 1).

2.3. Microsatelite Analysis

The total genomic DNA was extracted from frozen leaf material according to an adjusted ATMAB DNA extraction method [58]. In total, 175 samples were used for DNA analysis with eight microsatellite markers (nSSR). Four nSSRs were developed for U. laevis (Ulm2, Ulm3, Ulm6, and Ulm19) [59], three were developed for U. minor (Ulmi1-21, Ulmi1-98, and Ulmi1-165) [60], and one was developed for U. rubra (UR158) [41] (Table S1).
Polymerase chain reactions were performed in two multiplexes (A and B) and one singleplex (C) in a final volume of 15 μL containing 2.5 μL of genomic DNA (about 25 ng), 5 μL H2O RNase-free water, 7.5 μL of Qiagen Multiplex PCR Master Mix 2×, and 1.5 μL of 10× primer mix (thermal cycler from GeneAmp® PCR System 9700, Applied Biosystems). Multiplex A used loci Ulm 2, Ulm 3, Ulmi 1–21, Ulmi 1–98, and Ulmi 1–16, and it comprised an initial denaturalization step of 4 min at 94 °C, followed by 35 cycles of 45 s at 94 °C, 1 min at 50 °C, 1 min 30 s at 72 °C, and a final extension step of 72 °C for 10 min. Multiplex B used loci Ulm 6 and Ulm 19, and it comprised an initial denaturalization step of 15 min at 95 °C, followed by 29 cycles of 30 s at 94 °C, 1 min 30 s at 58 °C, 30 s at 72 °C, and a final extension step of 60 °C for 30 min. Singleplex C used locus UR158, and it comprised an initial denaturalization step of 15 min at 95 °C, followed by 32 cycles of 30 s at 94 °C, 1 min 30 s at 52 °C, 30 s at 72 °C, and a final extension step of 60 °C for 30 min. Amplified PCR products were separated by capillary electrophoresis using an ABI PRISMTM 310 Genetic Analyzer (Applied Biosystems, Foster City, California, USA). GeneScan-500 LIZ (Applied Biosystems) was used as an internal size standard. Allele sizing was performed on a binset by using the GeneMapper ver. 4.0 soft. (Applied Biosystems, Foster City, CA, USA)).

2.4. Statistical Analysis of Leaf Characteristics

One-way ANOVA was used to test the effect of species on leaf morphology traits with the XLSTAT2020 program. The traits with the highest F values from the ANOVA were used for multivariate principal component analysis (PCA) analysis with PC-ORD5 soft. Based on the performed statistical analysis, we identified the key leaf morphology traits for the discrimination among and identification of hybrids of elm species.

2.5. Molecular Data Analysis

Genetic diversity parameters were calculated for the six Ulmus spp. species groups (number of different alleles (Na), number of effective alleles (Ne), observed/expected/unbiased expected heterozygosity, and fixation index (F)) based on six microsatellite loci using the GenAlEx 6.5 software [61]. Two loci were rejected from the genetic diversity analysis because they were found to be amplified in only one of the species (species-identification-suitable loci). An analysis of molecular variance (AMOVA) was performed using GenAlEx 6.5 [61] (for the significance test, we used 9999 random permutations). The estimation and visualization of private alleles were performed in the Poppr R package [62]. Allelic richness (Ar) was estimated with the FSTAT 2.9.3. software [63]. The software estimates allelic richness per locus, sample, and samples overall. Allelic richness is a measure of the number of alleles independent of sample size, thus allowing for comparison between different sample sizes among populations. The lowest number of samples (12) was used for rarefaction. Missing data estimation among the loci and target groups of Ulmus spp. performed and visualized by the R package poppr [62]. In addition, we used DAPC to examine the clustering of individuals: first with all six groups and later with five species groups (R package adegent 2.0.0 [64,65]). To test the associations among the species groups based on traditional Nei’s 1978 genetic distances, we ran UPGMA cluster analysis with the R package poppr with 10,000 bootstrap replicates [66].
We used eight microsatellite loci for species differentiation and hybrid identification. First, the clustering algorithm in STRUCTURE 2.3.4 [67] was run to assess the genetic structure of the dataset of six Ulmus spp. groups for each K ranging from 1 to 12 using 100,000 Markov chain Monte Carlo iterations with a burn-in of 100,000 and 20 replicates per run. The admixture model was used and allowed for the correlation of allele frequencies among clusters. The approach by Evanno et al. [68] in STRUCTURE HARVESTER v0.6.94 [69] was used for selecting the most appropriate K clusters. The STRUCTURE analysis was performed for all samples from studied six groups (the group of U. laevis, the group of U. glabra and U. minor, and the groups of potential hybrids—133 individuals in total). After the clear identification of U. laevis form the other Ulmus spp. groups, European white elm was removed from further analysis. To improve the quality and accuracy of hybrid identification, we applied data filtering, and all individuals containing missing data in three or more loci were removed from further analysis. In total, 106 individuals remained for possible hybrid identification. Then, a second round of the clustering in STRUCTURE 2.3.4 was run [67] with the same parameters as above, only with K ranging from 1 to 10, including 106 individuals from five groups: UG—U. glabra; UM—U. minor; UMm—U. minor subsp. Minor; UMm × UG—U. minor subsp. Minor × U. glabra; and UG × UM—U. glabra × U. minor.
To facilitate the detection of putative interspecific hybrids in the populations, genetically pure individuals of the two respective parental species as reference populations were used. This method has been used in several studies [3,52] to identify intra- and interspecific hybridization in invasive Siberian elm and other Ulmus spp. Thus, sampled individuals were sorted according to leaf characteristics and sample locations into the most probably pure individuals of each species. Then, we used the program STRUCTURE, which uses the Bayesian clustering approach as the model-based clustering algorithm (version 2.3.4; [67]), to assign individuals to pure species or identify possible hybrids when pools were mixed. When two pure parental species were sampled as references, it was expected that the optimal value of K would consist of two genetic clusters (K = 2). This could be confirmed by testing values of K from one up to the number of populations in the respective groups using the STRUCTURE HARVESTER software [69], and we selected the optimum K following the method of Evanno et al. [68]. The program STRUCTURE generates an admixture coefficient (q) that represents the proportion of an individual’s genotype that originates from each of the K genetic clusters. STRUCTURE can be run with the option ANCESTDIST, which computes the 95% posterior probability for each q value, equivalent to a 95% confidence interval. Following Blair and Hufbauer [10], individuals were classified as hybrids if their q value was <0.90. If an individual’s proportion did not include one, introgression likely occurred [10]. In addition, species-specific alleles identified in the reference datasets could help to confirm the identification of hybrid individuals. Because we had two parental species (U. glabra and U. minor), we expected the optimal value of K to consist of two genetic clusters (K = 2). For each STRUCTURE analysis, we used an admixture model with 100,000 burn-in iterations, 100,000 Markov chain Monte Carlo repetitions, and 20 replicates at each level, and we allowed for the correlation of allele frequencies among clusters. The online software CLUMPAK was used to identify clustering modes and packaging population structure inferences across K, as well as to visualize the clustering [70].
Finally, we used the Bayesian algorithms provided in NewHybrids v.1.1 beta [71], which performed the independent classification of individuals as U. minor, U. glabra, or a hybrid based on their genotypic profiles, and it helped to further classify the hybrids into specific categories. We considered the following hybrid classes: first- (F1) and second-generation (F2) hybrids and first- (0_Bx) and second-generation (1_Bx) backcrosses. The NewHybrids algorithm was run with Jeffreys-like priors with 500,000 iterations following a 500,000-iteration burning. At the end, we combined the information obtained from Structure and NewHybrids to determine the specific hybrid class to which an individual tree was most likely to belong.

3. Results

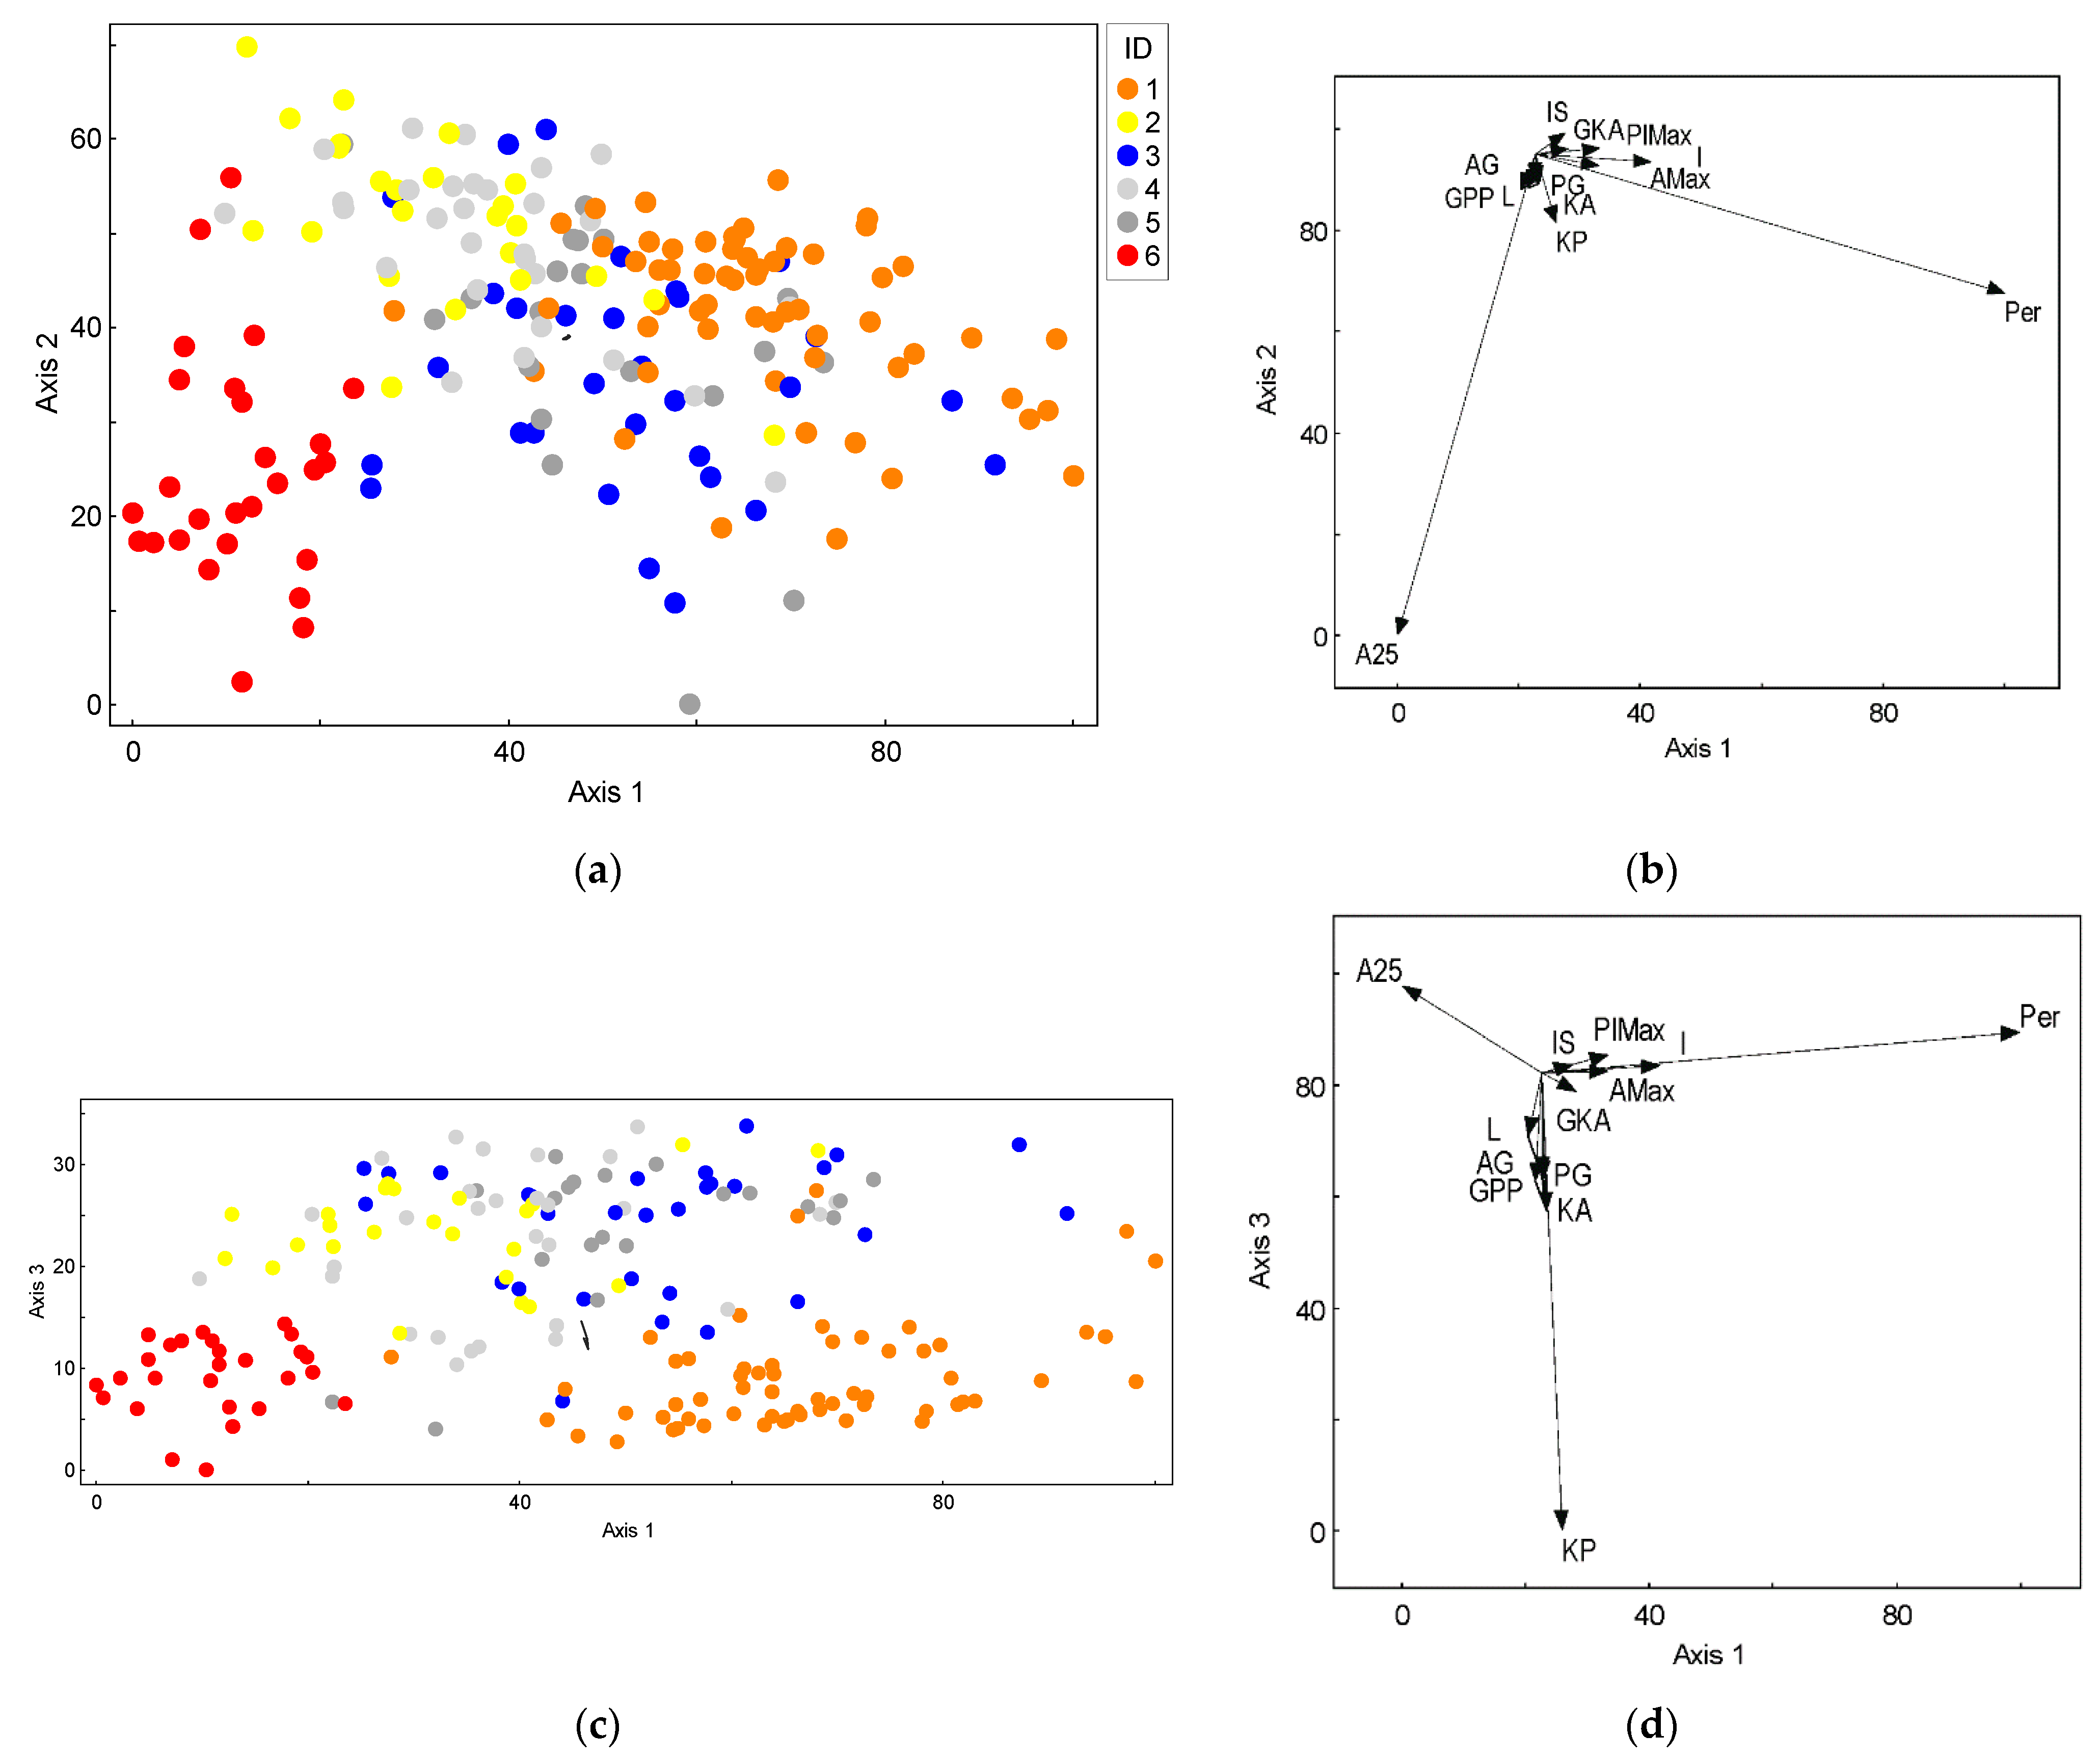
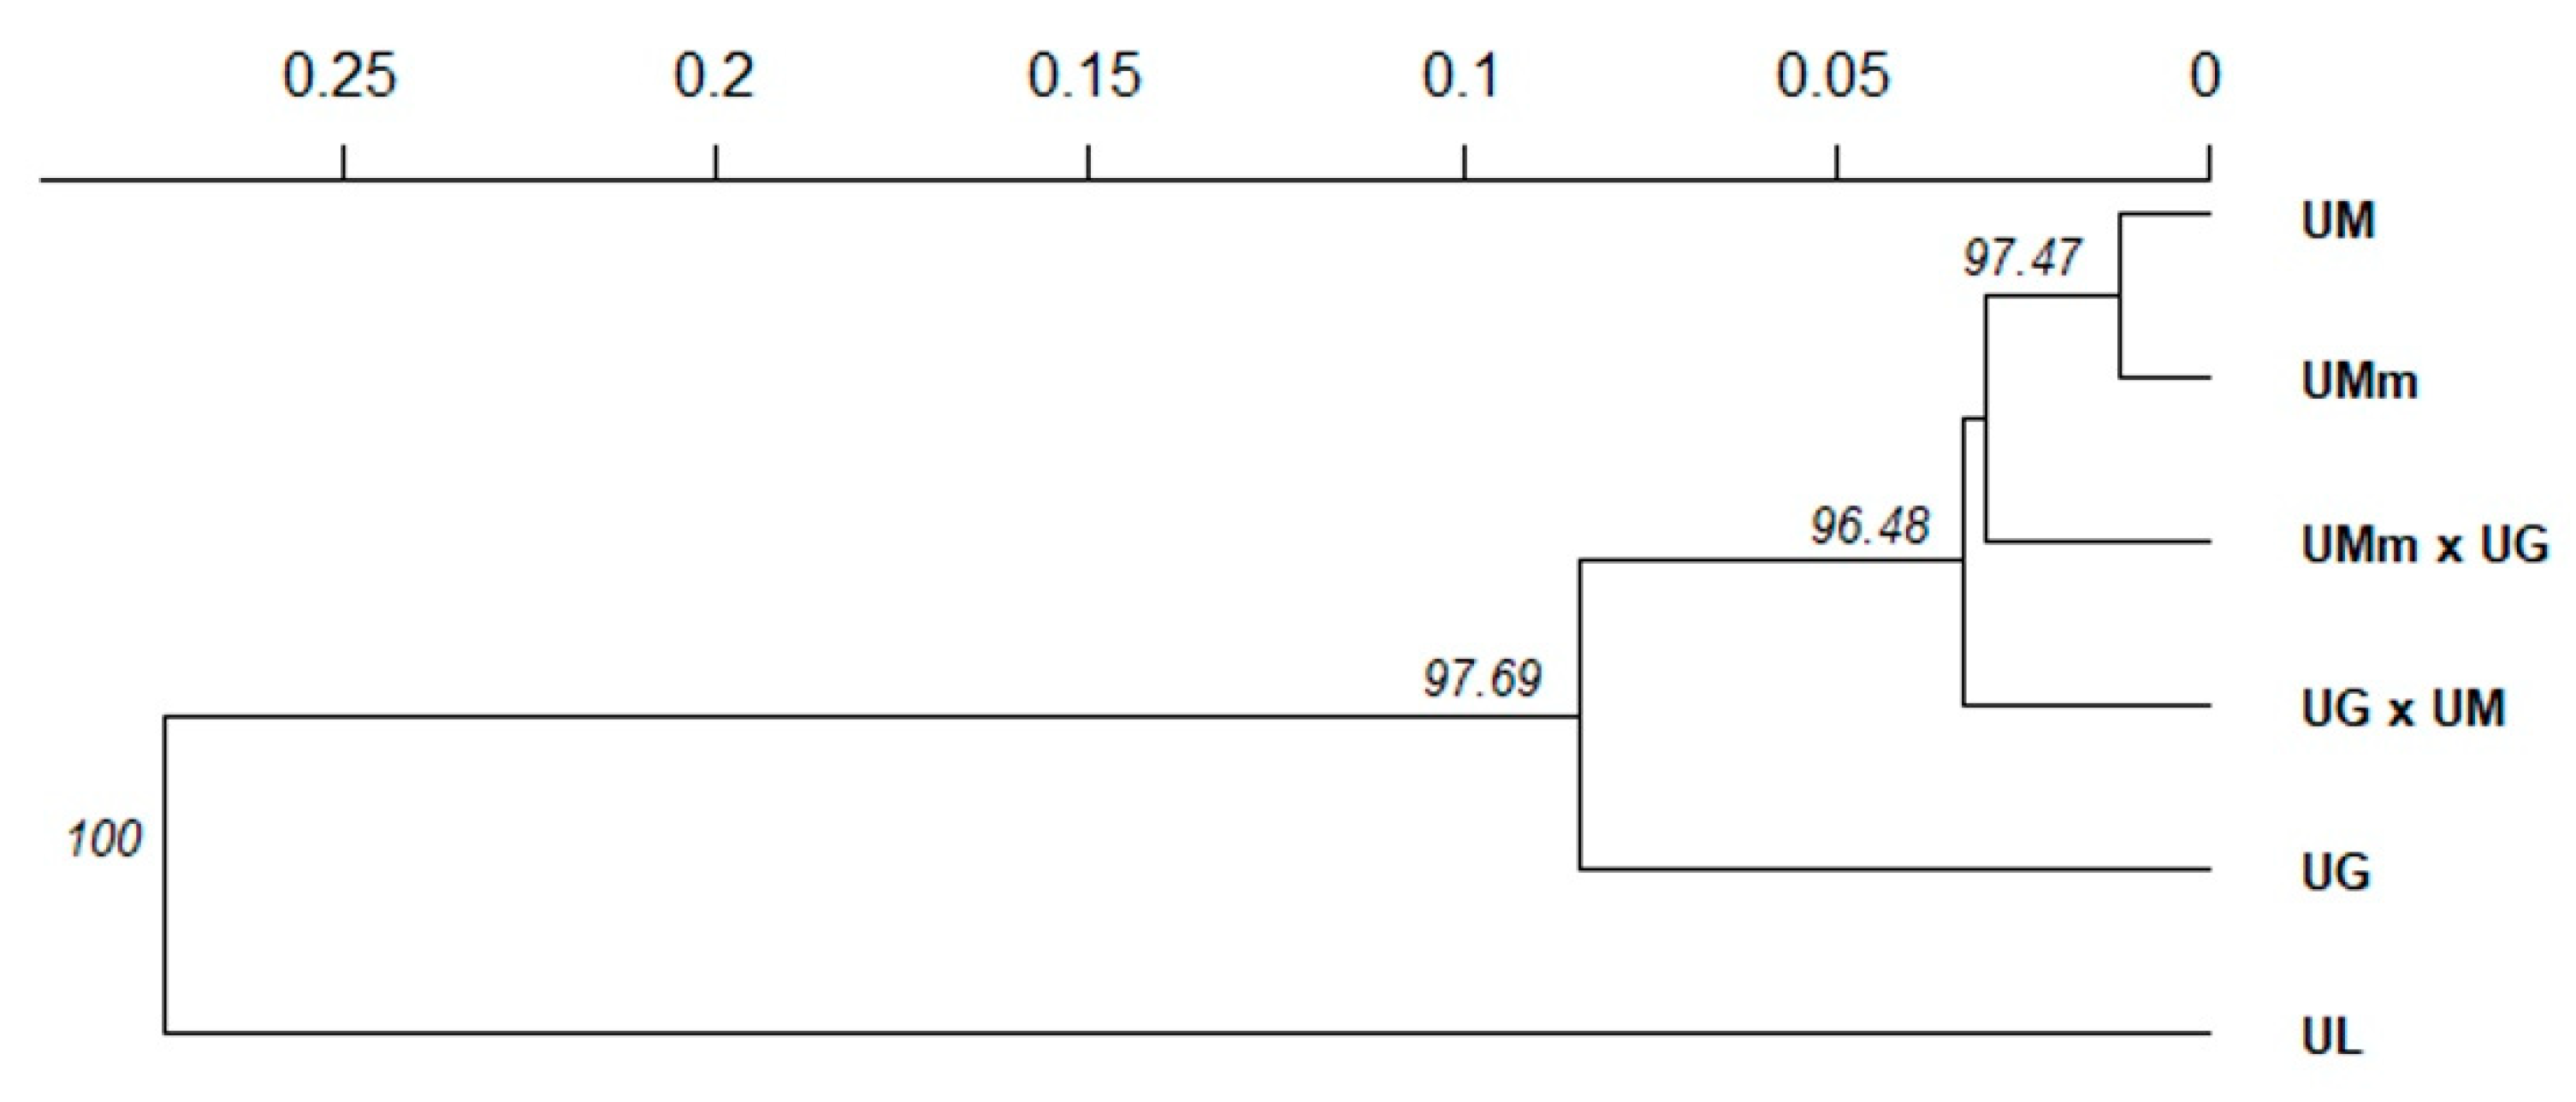
3.1. Leaf Morphology Variation

The ANOVA revealed significant species effects on all the leaf morphology traits except for two traits of Pl/I and GKPP (pubescens character of the corners of the main vein; Table 2). The highest three F values were obtained for the leaf blade pubescens score (L), the secondary leaf vein branching score (L), and the leaf petiole lower half pubescens (KA).
The PCA analysis was performed for the morphology traits with the highest values of R2 and F (Table 2, rows 1–13). The results showed high correlation coefficients for the above-mentioned characteristics (Table 3).
The PCA plot individual tree values against two major PCs accounted for 66.32%, 21.82%, and 9.66% of the total variance in the first, second, and third PC axes, respectively. Based on leaf morphology traits, pure elm species were divided into three groups: U. glabra, U. laevis, and U. minor subsp. minor with U. minor. The putative spontaneous hybrids between these elm species were located throughout the sampling sites (Figure 3a,c). A25 showed a strong statistical significance with Per and KP in the first, second, and third axes (Figure 3b,d).
For wych elm, the values of all investigated leaf morphology traits were high, except for the asymmetry at 25% blade (25K) length and the pubescens of the underside of the leaf blade (L) (Figure S1). Though the field elm and smooth-leaved elm were found to occupy intermediate positions between wych elm and European white elm. Their L and underside of the petiole (KA) were found to usually be without pubescens. Smooth-leaved elm differed from field elm by a larger blade maximum width (PlMax) and secondary vein stretch (IS). The numerals of all characteristics of hybrids of wych elm and field elm (and smooth-leaved elm) varied from very small to very big. European white elm leaves were found to have no branches on the secondary veins, and they were the most asymmetrical.

3.2. Genetic Diversity

In total, 133 trees from six target tree groups were sampled and analyzed using six microsatellite loci. All six nuclear microsatellites were polymorphic and amplified 72 alleles in total. The number of alleles per locus varied from 7 at locus UR158 to 21 at locus Ulmi1165. Loci UR158 and Ulm6 were least polymorphic with the lowest expected heterozygosity (He), allelic richness (Ar), and number of effective alleles (Ne) (results not shown).
The mean number of alleles (Na) varied from 4.33 in U. laevis to 8.0 in U. glabra, with an overall average of Na = 6.89. The mean number of effective alleles (Ne) varied from 2.53 in U. laevis to 4.55 in U. glabra, with an overall average of Ne = 4.01. Allelic richness (Ar) varied from 3.6 in U. laevis to 6.68 in U. minor, with an overall average of Ar = 6.0. Expected heterozygosity (He) was high for all investigated species, except for U. laevis with He = 0.567. Most of the allelic diversity parameters were markedly lower in U. laevis in comparison with the other elm species (Table 4 and Figure S2). The deviation from random mating was markedly stronger in the putative hybrid groups than in the pure elm species (Fis from 0.21–0.18 for hybrids vs. Fis from −0.06 to 0.13 pure species; Table 4). In total, 19 private alleles were present and differently distributed over six elm species, with the highest number of private alleles observed in the U. laevis and U. glabra tree groups (Figures S2 and S3).

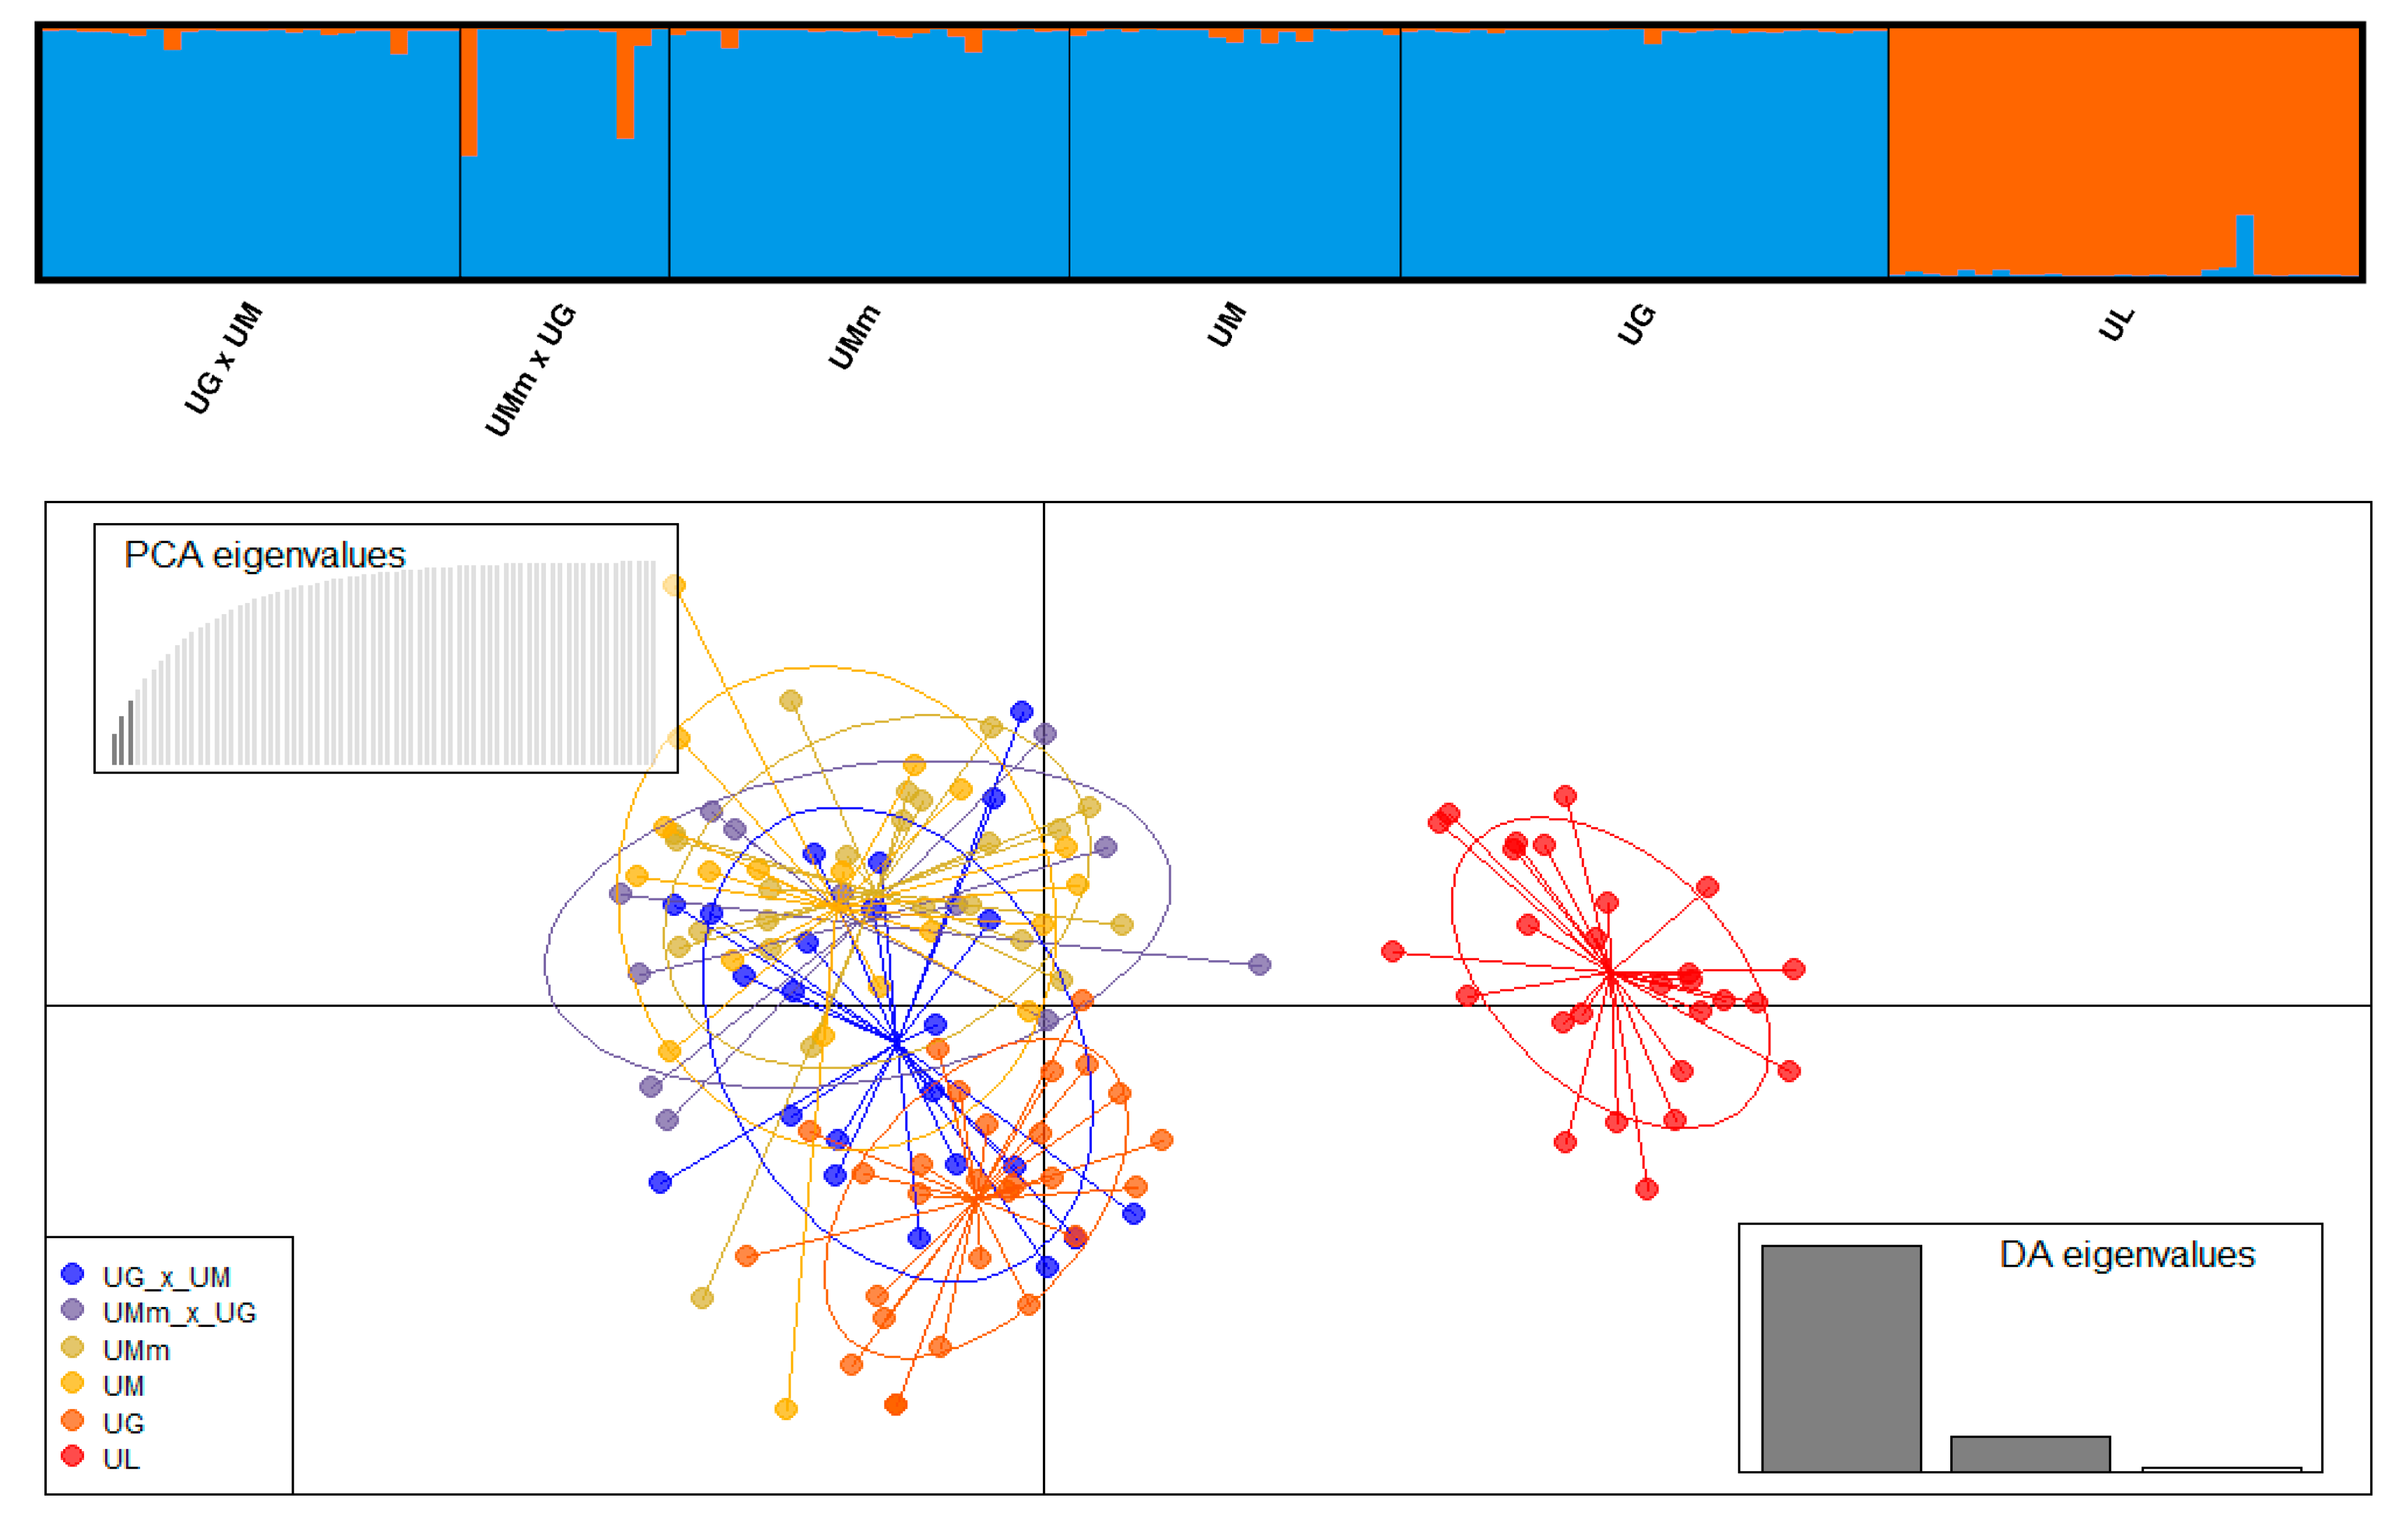
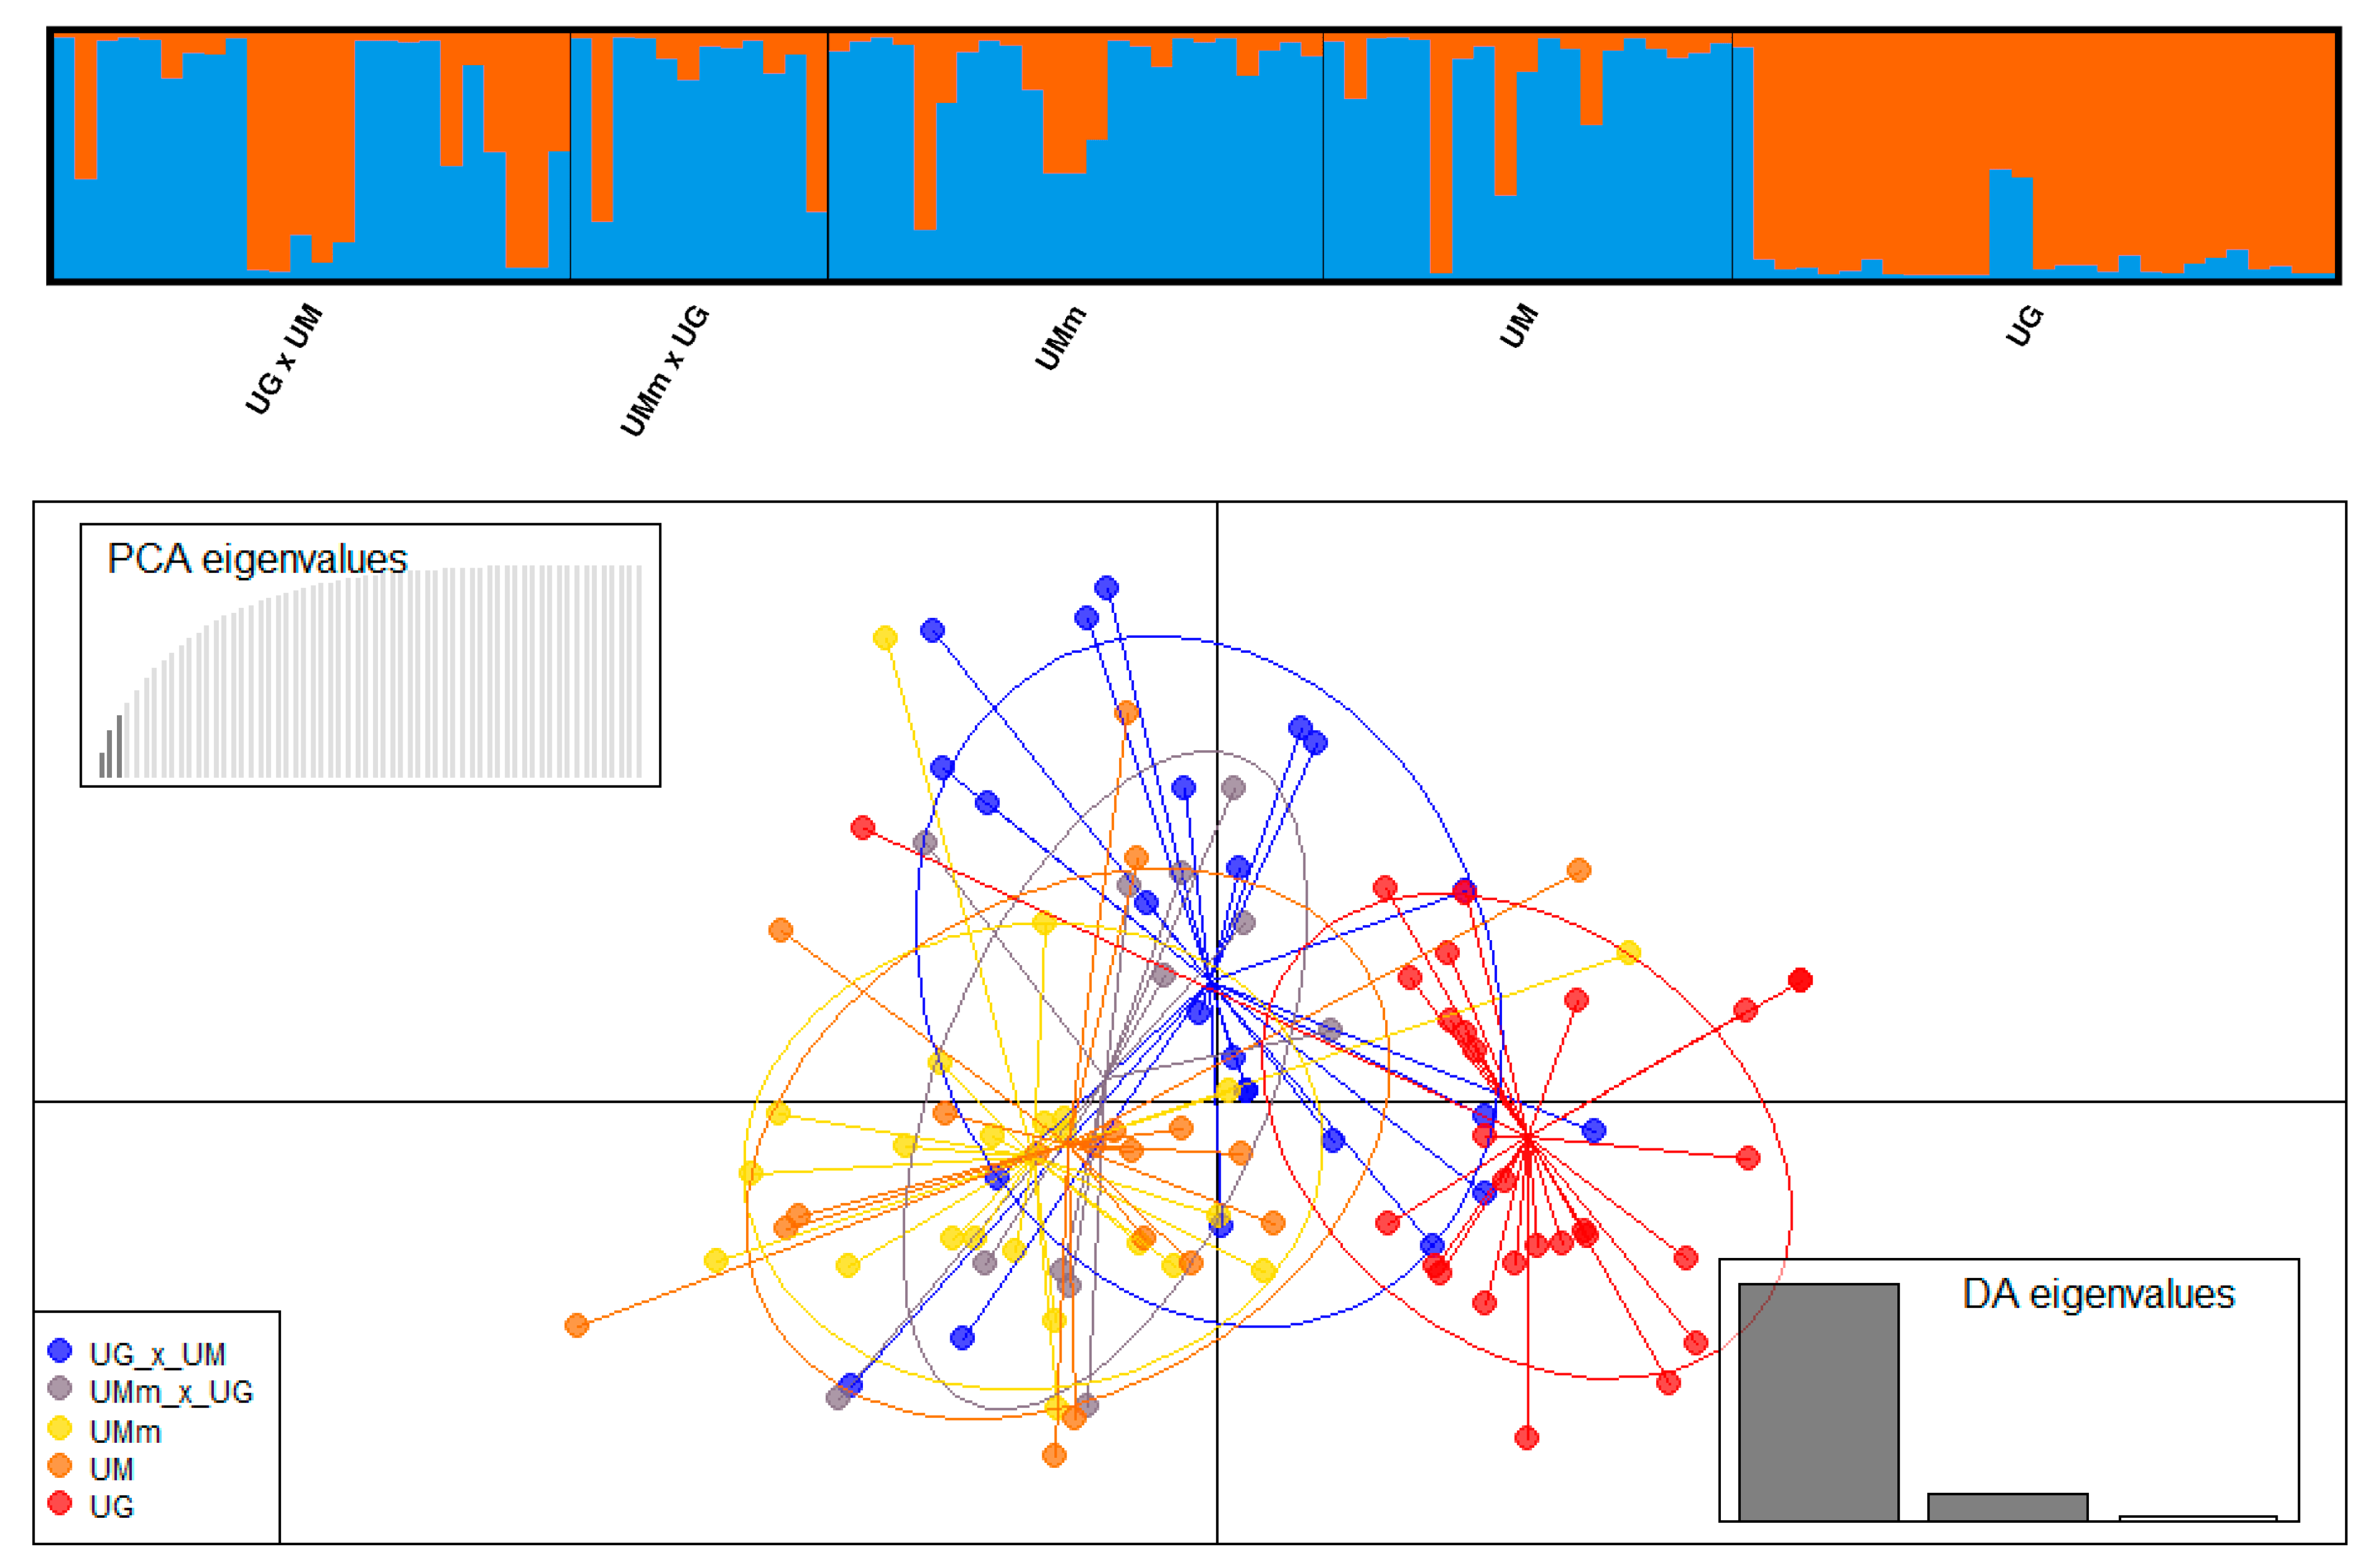
3.3. Species Genetic Differentiation

We identified two microsatellite loci discriminating between U. laevis and the remaining Ulmus species: locus Ulm198 did not amplify in U. laevis, and locus Ulm19 amplified only in U. laevis, with some exception in U. minor (Figure S4).
In agreement with the leaf morphology traits, the Bayesian clustering results based on the molecular data revealed a clear separation of U. laevis from the remaining elm species (Figure 4, upper plot). K = 2 was defined as the most likely number of genetic clusters (deltaK = 261.6; Figure S5 and Table S2). The discriminant analysis of principal components (DAPC) supported clear U. laevis genetic differentiation from the remaining elm species when plotted on the ordination axes (Figure 4, lower plot).

3.4. Hybrid Identification

After excluding U. laevis and data filtering, we obtained a subset of 106 individuals for the identification of the parental species of U. minor and U. glabra, as well as their hybrids. Based on the leaf morphology, 28 of these trees were classified as U. glabra (UG), 19 were classified as U. minor (UM), 21 were classified as U. minor subsp. minor (UMm), 25 were classified as the U. glabra × U. minor (UG × UM) hybrid group, and 13 were classified as the U. minor subsp. minor × U. glabra (UMm × UG) hybrid group. The STRUCTURE clustering revealed two genetic clusters that best-explained the molecular genetic variation in this subset of 106 samples (delta K = 64.9; Figure S6 and Table S3). For two genetic clusters, STRUCTURE clustering clearly separated the group of U. glabra from U. minor and the putative hybrid groups (Figure 5, upper plot). Furthermore, the putative UG × UM hybrids (UG as the female parent) contained stronger genetic associations with U. glabra than the UMm × UG hybrid group (UG as the male parent; Figure 5, upper plot). Based on this method, only a few individuals were assigned as hybrids, with equal membership to the UG and UM genetic clusters. These results indicated that leaf morphological traits may reliably distinguish the species of U. glabra and U. minor but fail to discriminate further within U. minor sensu lato. The leaf traits may be sensitive to the maternal–paternal identity of the hybrids.
The DAPC analysis of the subset of five elm species groups separated three major genetic groups (Figure 5, lower plot): (1) the U. glabra group (UG, rightmost group in the plot), (2) putative hybrids U. glabra × U. minor (intermediate group in the plot), and (3) a U. minor group containing the UM, Umm, and UMm × UG species groups (the leftmost group in the plot). These results suggested (a) genetic separation between U. glabra and U. minor groups and (b) confirmed the leaf traits as reliable indicators for putative hybridization between U. glabra and U. minor, with the latter species as the mother tree. However, DAPC could not confirm reliable leaf marker traits for identifying the hybrids with U. minor as the mother tree species.
The UPGMA clustering well-reflected the results of the Bayesian clustering and DAPC via the highly reliable separation of the pure species of U. laevis, U. glabra, the UG × UM hybrid complex, and the UM species complex (Figure 6). However, it is worth noting the separation of the UMm × UG hybrid cluster from the UM × UMm cluster with a 97% bootstrap significance (Figure 6).
Finally, the NewHybrids program identified nine F2 hybrids between UG × UM (with p ≥ 0.90) and an additional 22 individuals as putative F2 hybrids with a lower p value (p ≥ 0.50). In total, 11 hybrids were identified among 36 morphology-based putative hybrids. In addition, 20 individuals were identified as F2 hybrids among U. minor, U. minor subsp. minor, and U. glabra groups. In contrast to STRUCTURE clustering, where three hybrids were identified within the U. glabra (UG) group, the NewHybrids identified markedly more hybrids (10 hybrids). All the hybrids identified by the NewHybrids software were classified as second (F2) generation hybrids (with p ≥ 0.50).

4. Discussion

Three species of the Ulmus complex sensu lato naturally occur in Lithuania: U. glabra, U. minor, and U. laevis. Our country is at the northern margin of the natural range of these species. For U. minor, the northern boundary of the natural range coincides with 55° latitude and runs along the southern edge of the Baltic Sea through Lithuania towards the Urals. During field research, we did not find spontaneous hybrids between U. laevis and other Ulmus species based on morphology traits, thus agreeing with other studies on U. laevis hybridization. U. laevis belongs to the Blepharocarpus section of the genus, but the other two European elm species, U. glabra and U. minor, belong to the subgenus Ulmus. U. laevis does not easily hybridize with the other European elm species and is self-incompatible [51]. Townsend [72] determined that U. laevis is a diploid that exhibits reproductive isolation. The results of interspecific pollinations of U. americana with U. laevis have indicated that fertilization is prevented by a reproductive barrier that inhibits pollen tube growth at a stigmatic surface, regardless of belonging to the same Blepharocarpus section [73]. Meanwhile, we identified many hybrid individuals between U. minor and U. glabra. Hybrids of these species have also been found in many European countries, such as Spain, Belgium, England, France, and Slovenia [27,60,74]. The taxonomy of European elm trees has given rise to much debate, especially regarding the U. minor species complex and the nature and frequency of the hybridization of U. minor and U. glabra [75].
In our previous study [35], we used 14 leaf morphological parameters, and we found out that natural hybrids between field elm and wych elm (U. × hollandica) do occur in mixed forests of Central Lithuania. This study covered more elm species (we additionally studied field elm and European white elm) and more leaf morphological characteristics (we added pubescens of leaves). In this study, we confirmed that elms can easily be distinguished by leaf morphometric characteristics. The inclusion of leaf pubescence strength in morphological studies helps to better characterize individual elm species. According to our results, the U. laevis has a lot of pubescens on the main and secondary veins, as well as on the underside of the leaf. The upper half of the petiole is not always rich with pubescens, and the lower half is less frequent. Secondary veins are not branched. This elm is the most asymmetrical of elms. U. glabra secondary veins are usually all-branched, both the primary and secondary veins usually have a lot of pubescens, and the petiole has extremely many pubescens. U. minor and U. minor subsp. minor are closer to U. glabra because the leaf petioles and veins have much less pubescens than U. glabra. U. glabra and U. minor (and U. minor subsp. minor) hybrids have similar leaf traits to U. minor (or U. minor subsp. minor), but, in contrast to the pure species, the pubescens is absent along the edges of the main veins in their hybrids.
Examples of hybrid elm showed that their morphological and genetic boundaries do not fit, their genetic boundaries are much wider than the phenotypic, or vice versa. Morphological investigations were carried out to help to distinguish the species of elm from one another and to evaluate the abundance of hybrids, but morphological studies were not sufficient to investigate the degree of hybridization of the elm species.
We identified a set of eight nuclear microsatellite markers for the efficient study of genetic diversity and hybrid identification in the Ulmus species complex. Our findings were in good agreement with a number of studies where microsatellites or other DNA markers were used to study the hybridization in Ulmus species [3,42,45,46,52,76]. The results presented by L. Mittempergher and N. la Porta [51] on the cross-ability and rate of selfing from artificial mating trials among 11 elm species showed that hybridization barriers among Ulmus species were weak, with the success of several combinations dependent on male–female interactions and the parental individual. However, these studies reported that an exceptional cross-ability barrier was found between U. laevis and other Ulmus species. This finding may explain the significant genetic differentiation of U. laevis from other Ulmus species obtained in our study. In addition, this low interspecific crossing rate may have led to relatively lower genetic diversity and high frequency of private alleles in U. laevis in our study (Table 4 and Figure S2). A similar genetic diversity with a low mean number of alleles and a low heterozygosity (He) in U. laevis was observed at its northern distribution range in Denmark by Nielsen and Kjær [43]. A significantly higher genetic diversity among other two parental Ulmus species and their possible hybrids was observed in our study. However, Martín del Puerto et al. [47] found a much lower genetic diversity (He) among the U. glabra populations in the Iberian Peninsula. The lower genetic diversity results of U. glabra in the Iberian Peninsula can be explained by small populations size and isolation. Overall, estimates of expected heterozygosity (He) in our Ulmus species groups (U. minor, U. minor subsp. minor, U. glabra, and their hybrids) were the same or slightly higher in comparison to other European field elm populations, e.g., Brunet et al. [52] found He = 0.59 in Italy, Fuentes-Utrilla et al. [77] found He = 0.333–0.592 in Balearic Islands, Bertolasi et al. [45] found He = 0.671 in Italy, Zebec et al. [48] found He = 0.418–0.642 in five natural field elm populations in Croatia, Buiteveld et al. [46] revealed a moderate genetic diversity (He = 0.483–0.628) in the Netherlands, and Collada et al. [60] found He = 0.49–0.73 in six Spanish populations. In addition, Venturas et al. [44] found He = 0.43–0.45 in two U. laevis populations in the Iberian Peninsula, and Whiteley et al. [59] found He = 0.08–0.74 in a group of U. laevis from Sweden (Öland). However, when comparing the results, we should consider the variation in sample size, geography, and number of loci used.
In our study, evidence for hybridization between U. glabra and U. minor was found from morphological and genetic backgrounds. Similarly, hybridization events have been reported in other studies on U. glabra and U. minor [35,74] and between U. minor and U. pumila, e.g., [3,42,45,46,52,76]. The lack of reproductive barriers between U. glabra and U. minor, their overlapping distribution, and their genetic proximity promote spontaneous hybridization [27,47,51,77]. Based on Bayesian clustering results, putative hybrids constituted 28.3% (30 out of 106 individuals), which was comparable with results of wych elm in Belgium, where Cox et al. [74] identified significant introgression (46%) in natural populations. In contrast, Martin del Puerto et al. [47] identified significantly less (13%) putative hybrids among elms in the Iberian Peninsula. The differences in the higher percentage of putative hybrids in Belgium may be explained by the higher abundance of both species U. glabra and U. minor at the same altitude [74]. In contrast, U. glabra and U. minor distributions are partly overlapping, partly divided, and limited to a certain altitude in the Iberian Peninsula, so hybridization is relatively weaker [47]. Thus, our results showing 28.3% of putative hybrids were more in line with the study of elms in Belgium [74].
Finally, based on results from NewHybrids, 31 individuals out of 106 in total were identified as possible F2 hybrids (with p ≥ 0.5). However, the threshold to consider individuals as putative hybrids in our study was lowered to p ≥ 0.5 in contrast to other studies, e.g., [74,78]. Additionally, in contrast to other studies e.g., [42,47], we did not identify a significant increase of genetic diversity due to hybridization between U. glabra and U. minor (data not shown).
The initial number of pure reference samples per parental species was not high in our study (e.g., 28 of U. glabra and 40 of U. minor and U. minor subsp. minor), which may have an effect on the genetic assignment into hybrid groups. However, a combination of molecular data and morphological characteristics showed high potential and could help the classification of the genus Ulmus, especially in hybrid individuals, e.g., [42,45,46,47,52,76]. Our study showed the differentiation of U. laevis from other Ulmus species, as well as U. minor and U. glabra hybrid groups, based on both leaf morphology and genetic characteristics. In contrast, the classification of trees within the U. minor groups based on leaf morphology did not correspond well to the clustering based on eight microsatellite markers using genetic clustering. Thus, in our study, the morphological leaf characteristics typically used to identify elms in the field did not reliably distinguish taxonomy within the U. minor complex. Similar conclusions that leaf morphology-based clustering is not always congruent with clustering based on genetic markers in Ulmus spp.were reported by several authors, e.g., [45,46,52,74] Therefore, further autochthonous Ulmus species conservation measures should take a more detailed genetic examination within the U. minor complex into account to enable better species differentiation, which is the basis for in situ and ex situ conservation.
Our genetic diversity analysis showed markedly stronger deviation from random mating in the putative hybrid than in the pure species groups. This indicated differentially mating groups identifiable by a divergent leaf morphology in natural elm forests. As leaf morphology suggests, these groups could be the spontaneous hybrid formations within a mixture of elm taxonomic groups, especially with the U. glabra × U. minor hybrid group being separated by genetic clustering. There could be multiple generations of reciprocal hybrid mating that could obscure the leaf morphology-based taxonomic identification, especially within the U. minor species complex where the genetic data indicating stronger mating among the Ulumus spp. with no marked deviation from random mating.

5. Conclusions

In conclusion, the genetic and leaf morphology analyses of putative elm hybrid swamps indicate a low genetic exchange between U. laevis and the other species groups in the Ulmus species complex sensu lato. This also indicates a low probability of the contribution of U. laevis in forming spontaneous hybrids among the Ulmus species. However, the genetic data do support leaf morphology-based identification of U. glabra (female) × U. minor (male) spontaneous hybrids. There is a strong genome sharing among U. minor and U. minor spp. minor species. This supports a unified taxonomic reference for U. minor and U. minor spp. minor. For gene conservation, we suggest considering separate gene conservation units selected based on leaf and stem morphology for U. laevis, U. glabra, U. glabra × U. minor, and the U. minor species complex.

Supplementary Materials

The following are available online at https://www.mdpi.com/article/10.3390/f12060653/s1. Figure S1: The PCA ordination plots of elm trees given separately for species-specific leaf morphology traits. The symbol size indicates the relative size of the morphology traits in the entity. The minimum value (zero) is shown on an overlay as the smallest size for that symbol. Abbreviations and color of the triangles are shown in Figure 3; Figure S2: Distribution of genetic diversity among six sampled Ulmus spp. groups (Na—Mean no. of Different Alleles; Ne—Mean no. of Effective Alleles; Ar—Mean allelic richness (based on min. sample size of 12 diploid individuals.), Npriv—No. of Private Alleles; He—Expected Heterozygosity) (GenAlEx 6.5 [61]); Populations abbreviations in Table 4; Figure S3: Private alleles distribution among the studied six Ulmus spp. groups (133 individuals) (R package poppr [62]; Figure S4: Missing data among six target Ulmus spp. groups and among eight nSSR loci (R package poppr [62]); Figure S5: The results of Bayesian clustering (soft. STRUCTURE2.3.4 [67]) on the most likely number of genetic clusters within the studied six Ulmus spp. groups, indicated by the highest delta K value at K = 2 (STRUCTURE HARVESTER soft. [69]); Figure S6: The results of Bayesian clustering (soft. STRUCTURE2.3.4 [67]) on the most likely number of genetic clusters within the studied five Ulmus spp. groups (106 individuals), indicated by the highest delta K value at K = 2 (STRUCTURE HARVESTER soft. [69]); Table S1: List of nuclear microsatellite markers (nSSR’s) used in our study; Table S2: The Evanno table output results of Bayesian clustering (soft. STRUCTURE 2.3.4 [67]) on the most likely number of genetic clusters within the studied populations, indicated by the highest delta K value (STRUCTURE HARVESTER soft. [69]); Table S3: The Evanno table output results of Bayesian clustering (soft. STRUCTURE2.3.4 [67]) on the most likely number of genetic clusters within the studied populations, indicated by the highest delta K value (STRUCTURE HARVESTER soft. [69]).

Author Contributions

Conceptualization, V.B., S.T. and R.P.; methodology, S.T., V.B., G.J. and J.B.; validation, D.D. and V.B.; formal analysis, S.T., G.J. and I.K.; investigation, G.J., R.P. and S.T.; resources, S.T., J.B.; data curation, I.K.; writing—original draft preparation, G.J.; writing—review and editing, G.J. and D.D.; visualization, G.J.; supervision, V.B. and D.D. All authors have read and agreed to the published version of the manuscript.

Funding

The material presented in the article was collected during the long-term LAMMC research program “Sustainable Forestry and Global Change”.

Data Availability Statement

The data is available upon request by e-mail to the corresponding author.

Conflicts of Interest

The authors declare no conflict of interest. The funders had no role in the design of the study; in the collection, analyses, or interpretation of data; in the writing of the manuscript, or in the decision to publish the results.

References

  1. Khan, T.N.; Croser, J.S. PEA|Overview. In Encyclopedia of Grain Science; Wrigley, C., Ed.; Elsevier: Oxford, UK, 2004. [Google Scholar]
  2. Soltis, P.S.; Soltis, D.E. The role of hybridization in plant speciation. Annu. Rev. Plant Biol. 2009, 60, 561–588. [Google Scholar] [CrossRef] [PubMed] [Green Version]
  3. Hirsch, H.; Brunet, J.; Zalapa, J.E.; von Wehrden, H.; Hartmann, M.; Kleindienst, C.; Schlautman, B.; Kosman, E.; Wesche, K.; Renison, D.; et al. Intra- and interspecific hybridization in invasive siberian elm. Biol. Invasions 2017, 19, 1889–1904. [Google Scholar] [CrossRef]
  4. Vít, P.; Wolfová, K.; Urfus, T.; Tájek, P.; Suda, J. Interspecific hybridization between rare and common plant congeners inferred from genome size data: Assessing the threat to the Czech serpentine endemic Cerastium alsinifolium. Preslia 2014, 86, 95–117. [Google Scholar]
  5. Neale, D.B.; Wheeler, N.C. Hybridization and introgression. In The Conifers: Genomes, Variation and Evolution; Neale, D.B., Wheeler, N.C., Eds.; Springer International Publishing: Cham, Switzerland, 2019; pp. 387–429. [Google Scholar] [CrossRef]
  6. Abbott, R.J. Plant invasions, interspecific hybridization and the evolution of new plant taxa. Trends Ecol. Evol. 1992, 7, 401–405. [Google Scholar] [CrossRef]
  7. Futuyma, D.J. Evolutionary biology today and the call for an extended synthesis. Interface Focus 2017, 7, 20160145. [Google Scholar] [CrossRef]
  8. Whitney, K.D.; Gabler, C.A. Rapid evolution in introduced species, ‘invasive traits’ and recipient communities: Challenges for predicting invasive potential. Divers. Distrib. 2008, 14, 569–580. [Google Scholar] [CrossRef]
  9. Schierenbeck, K.A.; Ellstrand, N.C. Hybridization and the evolution of invasiveness in plants and other organisms. Biol. Invasions 2008, 11, 1093. [Google Scholar] [CrossRef]
  10. Blair, A.C.; Hufbauer, R.A. Hybridization and invasion: One of North America’s most devastating invasive plants shows evidence for a history of interspecific hybridization. Evol. Appl. 2010, 3, 40–51. [Google Scholar] [CrossRef]
  11. Keim, P.; Paige, K.N.; Whitham, T.G.; Lark, K.G. Genetic analysis of an interspecific hybrid swarm of populus: Occurrence of unidirectional introgression. Genetics 1989, 123, 557–565. [Google Scholar] [CrossRef] [PubMed]
  12. Rieseberg, L.H.; Ellstrand, N.C.; Arnold, D.M. What can molecular and morphological markers tell us about plant hybridization? Crit. Rev. Plant Sci. 1993, 12, 213–241. [Google Scholar] [CrossRef]
  13. Rieseberg, L.H. The role of hybridization in evolution: Old wine in new skins. Am. J. Bot. 1995, 82, 944–953. [Google Scholar] [CrossRef]
  14. Kolbe, J.J.; Glor, R.E.; Rodríguez Schettino, L.; Lara, A.C.; Larson, A.; Losos, J.B. Genetic variation increases during biological invasion by a cuban lizard. Nature 2004, 431, 177–181. [Google Scholar] [CrossRef] [PubMed]
  15. Williams, D.A.; Overholt, W.A.; Cuda, J.P.; Hughes, C.R. Chloroplast and microsatellite DNA diversities reveal the introduction history of Brazilian Peppertree (Schinus terebinthifolius) in Florida. Mol. Ecol. 2005, 14, 3643–3656. [Google Scholar] [CrossRef]
  16. Culley, T.M.; Hardiman, N.A. The role of intraspecific hybridization in the evolution of invasiveness: A case study of the ornamental pear tree Pyrus calleryana. Biol. Invasions 2009, 11, 1107–1119. [Google Scholar] [CrossRef]
  17. Rius, M.; Darling, J.A. How Important is intraspecific genetic admixture to the success of colonising populations? Trends Ecol. Evol. 2014, 29, 233–242. [Google Scholar] [CrossRef]
  18. Rosenthal, D.M.; Ramakrishnan, A.P.; Cruzan, M.B. Evidence for multiple sources of invasion and intraspecific hybridization in Brachypodium sylvaticum (Hudson) Beauv. in North America. Mol. Ecol. 2008, 17, 4657–4669. [Google Scholar] [CrossRef]
  19. Richardson, D.M.; Rejmánek, M. Trees and shrubs as invasive alien species—A global review. Divers. Distrib. 2011, 17, 788–809. [Google Scholar] [CrossRef]
  20. Richens, R.H. Studies on Ulmus: III. The Village Elms of Hertfordshire. For. Int. J. For. Res. 1959, 32, 138–154. [Google Scholar] [CrossRef]
  21. Bell, M. Elm. By R. H. Richens. 25 × 19.5 cm. Pp. 347, 152 Ills. Cambridge: Cambridge University Press, 1983. ISBN 0–521–24916–3. £35.00. Antiqu. J. 1984, 64, 427–428. [Google Scholar] [CrossRef]
  22. Seehausen, O.; Takimoto, G.; Roy, D.; Jokela, J. Speciation reversal and biodiversity dynamics with hybridization in changing environments. Mol. Ecol. 2008, 17, 30–44. [Google Scholar] [CrossRef]
  23. Li, B.; Wu, R. Genetic causes of heterosis in juvenile aspen: A quantitative comparison across intra-and inter-specific hybrids. Theor. Appl. Genet. 1996, 93, 380–391. [Google Scholar] [CrossRef]
  24. Mejnartowicz, L. Evidence for long-term heterosis phenomenon in the Alnus incana × glutinosa F-1 hybrids. Silvae Genet. Ger. 1999, 48, 100–103. [Google Scholar]
  25. Richens, R.H.; Jeffers, J.N.R. Multivariate analysis of the elms of northern france. Silvae Genet. 1975, 25, 141–150. [Google Scholar]
  26. Richens, R.H.; Jeffers, J.N.R. Multivariate analysis of the elms of northern France. II. Pooled analysis of the elm populations of northern France and England. Silvae Genet. 1978, 27, 85–95. [Google Scholar]
  27. Jeffers, J. Leaf variation in the genus Ulmus. For. Int. J. For. Res. 1999, 72, 183–190. [Google Scholar] [CrossRef] [Green Version]
  28. Jeffers, J.N.R.; Richens, R.H. Multivariate Analysis of the English elm population. Silvae Genet. 1970, 19, 31–38. [Google Scholar]
  29. Elowsky, C.; Jordon-Thaden, I.; Kaul, R. A Morphological Analysis of a hybrid swarm of native Ulmus rubra and introduced U. Pumila (Ulmaceae) in Southeastern Nebraska. Phytoneuron 2013, 44, 1–23. [Google Scholar]
  30. Myking, T.; Yakovlev, I. Variation in leaf morphology and chloroplast DNA in Ulmus glabra in the Northern Suture zone: Effects of distinct glacial refugia. Scand. J. For. Res. 2006, 21, 99–107. [Google Scholar] [CrossRef]
  31. Vander Mijnsbrugge, K.; Le Clercq, R.; Michiels, B. Dissection of leaf morphological traits from isolated and declined relict populations of Ulmus laevis reveals putative random ecotype evolution. Plant Syst. Evol. 2016, 302, 219–229. [Google Scholar] [CrossRef] [Green Version]
  32. Zebec, M.; Idžojtić, M.; Poljak, I.; Modrić, I. Population variability of wych elm (Ulmus glabra Huds.) in the mountainous region of Croatia according to the leaf morphology. Šumar. List 2015, 139, 429–438. [Google Scholar]
  33. Zebec, M.; Idžojtić, M.; Poljak, I. Morphological variability of the field elm (Ulmus minor Mill. sensu latissimo) in continental Croatia. Šumar. List 2014, 138, 563–571. [Google Scholar]
  34. Zebec, M.; Idžojtić, M.; Poljak, I.; Mihaldinec, I. The variability of field elm (Ulmus minor Mill. sensu latissimo) in Croatian Drava river valley according to the leaf morphology. Šumar. List 2010, 134, 569–579. [Google Scholar]
  35. Petrokas, R.; Baliuckas, V. Natural hybridisation within elms (Ulmus L.) in Lithuania. Balt. For. 2012, 18, 10. [Google Scholar]
  36. Melville, R. On the Discrimination of species in hybrid swarms with special reference to Ulmus and the nomenclature of U. minor Mill. and U. carpinifolia Gled. Taxon 1978, 27, 345–351. [Google Scholar] [CrossRef]
  37. Oliveira, E.J.; Pádua, J.G.; Zucchi, M.I.; Vencovsky, R.; Vieira, M.L.C. Origin, evolution and genome distribution of microsatellites. Genet. Mol. Biol. 2006, 29, 294–307. [Google Scholar] [CrossRef]
  38. Barbará, T.; Palma-Silva, C.; Paggi, G.M.; Bered, F.; Fay, M.F.; Lexer, C. Cross-species transfer of nuclear microsatellite markers: Potential and limitations. Mol. Ecol. 2007, 16, 3759–3767. [Google Scholar] [CrossRef] [PubMed]
  39. Ellis, J.R.; Burke, J.M. EST-SSRs as a Resource for population genetic analyses. Heredity 2007, 99, 125–132. [Google Scholar] [CrossRef] [Green Version]
  40. Wang, M.L.; Barkley, N.A.; Jenkins, T.M. Microsatellite markers in plants and insects. Part I: Applications of Biotechnology. Genes Genomes Genom. 2009, 3, 54–67. [Google Scholar]
  41. Zalapa, J.E.; Brunet, J.; Guries, R.P. Isolation and characterization of microsatellite markers for red elm (Ulmus rubra Muhl.) and cross-species amplification with siberian elm (Ulmus pumila L.). Mol. Ecol. Resour. 2008, 8, 109–112. [Google Scholar] [CrossRef]
  42. Zalapa, J.E.; Brunet, J.; Guries, R.P. Original article: The extent of hybridization and its impact on the genetic diversity and population structure of an invasive tree, Ulmus pumila (Ulmaceae). Evol. Appl. 2010, 3, 157–168. [Google Scholar] [CrossRef]
  43. Nielsen, L.R.; Kjær, E.D. Fine-scale gene flow and genetic structure in a relic Ulmus laevis population at its northern range. Tree Genet. Genomes 2010, 6, 643–649. [Google Scholar] [CrossRef]
  44. Venturas, M.; Fuentes-Utrilla, P.; Ennos, R.; Collada, C.; Gil, L. Human-induced changes on fine-scale genetic structure in Ulmus laevis pallas wetland forests at its sw distribution limit. Plant Ecol. 2013, 214, 317–327. [Google Scholar] [CrossRef]
  45. Bertolasi, B.; Leonarduzzi, C.; Piotti, A.; Leonardi, S.; Zago, L.; Gui, L.; Gorian, F.; Vanetti, I.; Binelli, G. A last stand in the po valley: Genetic structure and gene flow patterns in Ulmus minor and U. pumila. Ann. Bot. 2015, 115, 683–692. [Google Scholar] [CrossRef] [PubMed] [Green Version]
  46. Buiteveld, J.; Vanden Broeck, A.; Cox, K.; Collin, E. Human impact on the genetic diversity of Dutch field elm (Ulmus minor) populations in the Netherlands: Implications for conservation. Plant Ecol. Evol. 2016, 149, 165–176. [Google Scholar] [CrossRef]
  47. Martín del Puerto, M.; Martínez García, F.; Mohanty, A.; Martín, J.P. Genetic diversity in relict and fragmented populations of Ulmus glabra Hudson in the central system of the Iberian Peninsula. Forests 2017, 8, 143. [Google Scholar] [CrossRef] [Green Version]
  48. Zebec, M.; Idžojtić, M.; Šatović, Z.; Poljak, I.; Liber, Z. Alive and kicking, or, living on borrowed time?–microsatellite diversity in natural populations of the endangered Ulmus minor Mill. sensu latissimo from Croatia. Acta Bot. Croat. 2016, 75, 53–59. [Google Scholar] [CrossRef] [Green Version]
  49. Chudzinska, M.; Litkowiec, M.; Palucka, M.; Paslawska, A.; Lewandowski, A.; Koziol, C. Clonal structure of field elm (Ulmus minor Mill.) in Poland. Sylwan 2019, 163, 839–845. [Google Scholar]
  50. Chudzińska, M.; Pałucka, M.; Pasławska, A.; Litkowiec, M.; Lewandowski, A.; Kozioł, C. Results of preliminary research on genetic variation and genetic differentiation between wych elm populations (Ulmus glabra Huds.) in Poland. Sylwan 2018, 162, 727–736. [Google Scholar]
  51. Mittempergher, L.; Porta, N.L. Hybridization studies in the Eurasian species of elm (Ulmus spp.). Silvae Genet. 1991, 40, 237–243. [Google Scholar]
  52. Brunet, J.; Zalapa, J.E.; Pecori, F.; Santini, A. Hybridization and introgression between the exotic siberian elm, Ulmus pumila, and the native field elm, U. minor, in Italy. Biol. Invasions 2013, 15, 2717–2730. [Google Scholar] [CrossRef]
  53. Petrokas, R.; Baliuckas, V. Morphological intergradation of native elm species is shown by site-specific parameters. Balt. For. 2014, 20, 238–247. [Google Scholar]
  54. Richens, R.H. Elm; Cambridge University Press: Cambridge, UK, 1983; 347p. [Google Scholar]
  55. Mackenthun, G.L. The elms of Co. Cork-a survey of species, varieties and forms. Ir. For. 2007, 64, 44–60. [Google Scholar]
  56. Elwes, H.J.; Henry, A. The Trees of Great Britain & Ireland; R. & R. Clark, Limited: Edinburgh, UK, 1913; 2022p. [Google Scholar]
  57. WinFOLIA Image Analysis Software. Leaf Area and Morphology. 2016. Available online: https://regent.qc.ca/assets/winfolia_software.html (accessed on 15 March 2016).
  58. Dumolin, S.; Demesure, B.; Petit, R.J. Inheritance of chloroplast and mitochondrial genomes in pedunculate oak investigated with an efficient PCR method. Theor. Appl. Genet. 1995, 91, 1253–1256. [Google Scholar] [CrossRef] [PubMed]
  59. Whiteley, R.E.; Black-Samuelsson, S.; Clapham, D. Development of microsatellite markers for the European white elm (Ulmus laevis Pall.) and cross-species amplification within the genus Ulmus. Mol. Ecol. Notes 2003, 3, 598–600. [Google Scholar] [CrossRef]
  60. Collada, C.; Fuentes-Utrilla, P.; Gil, L.; Cervera, M.T. Characterization of microsatellite loci in Ulmus minor Miller and cross-amplification in U. glabra Hudson and U. laevis Pall. Mol. Ecol. Notes 2004, 4, 731–732. [Google Scholar] [CrossRef]
  61. Peakall, R.; Smouse, P.E. Genalex 6.5: Genetic analysis in Excel. Population genetic software for teaching and research—An update. Bioinformatics 2012, 28, 2537–2539. [Google Scholar] [CrossRef] [PubMed] [Green Version]
  62. Kamvar, Z.N.; Tabima, J.F.; Grünwald, N.J. Poppr: An R package for genetic analysis of populations with clonal, partially clonal, and/or sexual reproduction. PeerJ 2014, 2, e281. [Google Scholar] [CrossRef] [Green Version]
  63. Goudet, J. FSTAT, a Program to Estimate and Test Gene Diversities and Fixation Indices, Version 2.9.3. 2001. Available online: http://www2.unil.ch/popgen/softwares/fstat.htm (accessed on 5 February 2014).
  64. Jombart, T.; Collins, C. A Tutorial for discriminant analysis of principal components (DAPC) using adegenet 2.0.0. Lond. Imp. Coll. Lond. MRC Centre Outbreak Anal. Model. 2015, 43p. Available online: http://adegenet.r-forge.r-project.org/files/tutorial-dapc.pdf (accessed on 20 April 2021).
  65. Jombart, T. An Introduction to Adegent 2.0. 0. R-Tutorial. Lond. Imp. Coll. Lond. MRC Cent. Outbreak Anal. Model. 2015, 79p. Available online: https://adegenet.r-forge.r-project.org/files/tutorial-basics.pdf (accessed on 20 April 2021).
  66. Nei, M. Estimation of average heterozygosity and genetic distance from a small number of individuals. Genetics 1978, 89, 583–590. [Google Scholar] [CrossRef] [PubMed]
  67. Pritchard, J.K.; Stephens, M.; Donnelly, P. Inference of population structure using multilocus genotype data. Genetics 2000, 155, 945–959. [Google Scholar] [CrossRef] [PubMed]
  68. Evanno, G.; Regnaut, S.; Goudet, J. Detecting the number of clusters of individuals using the software Structure: A simulation study. Mol. Ecol. 2005, 14, 2611–2620. [Google Scholar] [CrossRef] [Green Version]
  69. Earl, D.A.; vonHoldt, B.M. Structure harvester: A website and program for visualizing STRUCTURE output and implementing the evanno method. Conserv. Genet. Resour. 2012, 4, 359–361. [Google Scholar] [CrossRef]
  70. Kopelman, N.M.; Mayzel, J.; Jakobsson, M.; Rosenberg, N.A.; Mayrose, I. Clumpak: A Program for identifying clustering modes and packaging population structure inferences across K. Mol. Ecol. Resour. 2015, 15, 1179–1191. [Google Scholar] [CrossRef] [Green Version]
  71. Anderson, E.C.; Thompson, E.A. A Model-based method for identifying species hybrids using multilocus genetic data. Genetics 2002, 160, 1217–1229. [Google Scholar] [CrossRef]
  72. Townsend, A.M. Crossability patterns and morphological variation among elm species and hybrids. Silvae Genet. 1975, 24, 18–23. [Google Scholar]
  73. Ager, A.A.; Guries, R.P. Barriers to interspecific hybridization in Ulmus americana. Euphytica 1982, 31, 909–920. [Google Scholar] [CrossRef]
  74. Cox, K.; Broeck, A.V.; Vander Mijnsbrugge, K.; Buiteveld, J.; Collin, E.; Heybroek, H.M.; Mergeay, J. Interspecific hybridisation and interaction with cultivars affect the genetic variation of Ulmus minor and Ulmus glabra in Flanders. Tree Genet. Genomes 2014, 10, 813–826. [Google Scholar] [CrossRef]
  75. Hollingsworth, P.M.; Hollingsworth, M.L.; Coleman, M. The European elms: Molecular markers, population genetics, and biosystematics. In The Elms: Breeding, Conservation, and Disease Management; Dunn, C.P., Ed.; Springer: Boston, MA, USA, 2000; pp. 3–20. [Google Scholar] [CrossRef]
  76. Cogolludo-Agustín, M.Á.; Agúndez, D.; Gil, L. Identification of native and hybrid elms in Spain using isozyme gene markers. Heredity 2000, 85, 157–166. [Google Scholar] [CrossRef] [Green Version]
  77. Fuentes-Utrilla, P.; Valbuena-Carabaña, M.; Ennos, R.; Gil, L. Population clustering and clonal structure evidence the relict state of Ulmus minor Mill. in the Balearic Islands. Heredity 2014, 113, 21–31. [Google Scholar] [CrossRef] [Green Version]
  78. Vähä, J.-P.; Primmer, C.R. Efficiency of model-based Bayesian methods for detecting hybrid individuals under different hybridization scenarios and with different numbers of loci. Mol. Ecol. 2006, 15, 63–72. [Google Scholar] [CrossRef] [PubMed]
Figure 1. The sample collection sites of studied elm species and hybrids in Lithuania. The color in the pie charts refers to the elm species: 1—U. glabra; 2—U. minor; 3—U. glabra × U. minor; 4—U. minor subsp. Minor; 5—U. minor subsp. minor × U. glabra; and 6—U. laevis.
Forests 12 00653 g001
Figure 2. The leaf blade measured traits. The abbreviations are explained in Table 2 (No. 3–16).
Forests 12 00653 g002
Figure 3. Ordination plots (PCAs) of 13 leaf morphology traits of elm species. (a) Distribution of trees on axes 1 and 2; (b) vectors of tree leaf morphological characteristics on axes 1 and 2. (c) Distribution of trees on axes 1 and 3; (d) vectors of tree leaf morphological characteristics on axes 1 and 3. Dashes indicate the spatial arrangement of vectors. Species ID: 1: U. glabra; 2; U. minor; 3: U. glabra × U. minor; 4: U. minor subsp. minor Richens; 5: U. minor subsp. minor × U. glabra; and 6: U. laevis. Morphological leaf characteristics: Per—perimeter; I—the blade length; PlMax—the blade maximum width; AMax—the distance from the base to the point of maximum blade width; A25—the asymmetry at 25% blade length; PG—the main vein pubescence; AG—the pubescence of secondary veins; L—the blade pubescens; IS—the secondary vein stretch; GKA—the secondary vein angle pubescence; KA—the upper petiole half pubescence; KP—the petiole upper half pubescens; and GPP—the main vein pubescens type.
Forests 12 00653 g003
Figure 4. The upper plot: differentiation of elm species based on Bayesian admixture clustering with K = 2 (highest delta K value of 261.6 was for K = 2; Table S2 and Figure S5). In the plot, everything is represented by a thin vertical line divided into K = 2 colored segments that represent the individual’s estimated membership fractions. The black vertical lines separate the species groups. The lower plot: discriminant analysis of principal components (DAPC) of six Ulmus spp. groups based on eight microsatellite markers. The graph shows the individuals as dots and the groups as inertia ellipses. Eigenvalues of the PCs are displayed in the upper left bar chart (R package adegent 2.0.0) [64,65].
Forests 12 00653 g004
Figure 5. The upper plot shows the inferred structure clusters (K = 2) (soft. STRUCTURE2.3.4) [67]. In the CLUMPAK plot, everything is represented by a thin vertical line divided into K = 2 colored segments that represent the individual’s estimated membership fractions in these two clusters. Black lines separate individuals from different species groups. The first cluster (orange) displays the clear separation of the U. glabra (UG) group, and the second cluster (blue) indicates groups of U. minor (UM) and U. minor subsp. minor (UMm). The lower plot illustrates the genetic structure of five Ulmus species groups based on two major principal components from the DAPC analysis (R package adegent 2.0.0) [64,65].
Forests 12 00653 g005
Figure 6. Results of UPGMA clustering based on Nei’s 1978 genetic distances [66]. The significance of branch nodes was tested with 10,000 bootstraps among loci (indicated by% of bootstraps separating a given branch).
Forests 12 00653 g006
Table 1. The leaf morphology traits of elm species. No. is a trait ID for referencing in the text.
No.Leaf Morphology TraitsAbbreviation
Measured with Win Folia 2016
1Perimeter, cmPer
2Form coefficient (=4πA/Per2); A—leaf area; Per—perimeter)Fk
3Blade length, cmI
4Maximum blade width, cmPlMax
5Distance from the base to the point of maximum blade width, cmAMax
6Blade width measured at 90% blade length, cmPl90
7The blade lobe angle at 10% blade lengthK10
8The blade lobe angle at 25% blade lengthK25
9The petiole length, cmKI
10The blade base difference, cmSPag
11The base left width, cmPagK
12The base right width, cmPagD
13The blade width at 10% blade length left side, cmPl10K
14The blade width at 10% blade length right side, cmPl10D
15The blade width at 25% blade length left side, cmPl25K
16The blade width at 25% blade length right side, cmPl25D
Calculated characteristics
17Ratio (the blade maximum width and length ratio) (4/3)Pl/I
18The base asymmetry (|11–12|·100)/(11 + 12)Apag
19The asymmetry at 10% blade length (|13–14|·100)/(13 + 14)A10
20The asymmetry at 25% blade length (|15–16|·100)/(15 + 16)A25
The visual characteristics set
21The secondary vein branching (0—not branching; 1—1–4 branching veins; 2—5–10 branching veins; 3—>10 veins)IS
22The main vein angles pubescens (0—no pubescens; 3—a lot of pubescens)GK
23The main vein pubescens (0—no pubescens; 3—a lot of pubescens)PG
24The second veins pubescens (0—no pubescens; 3—a lot of pubescens)AG
25The Blade pubescens (0—no pubescens; 3—a lot of pubescens)L
26The Second veins angles pubescens (0—no pubescens; 3—a lot of pubescens)GKA
27The petiole lower half pubescens (0—no pubescens; 4—a lot of pubescens)KA
28The petiole upper half pubescens (0—no pubescens; 4—a lot of pubescens)KP
29The upper blade half pubescens length (1—short; 2—long)VP
30The main vein pubescens type (0—no pubescens; 1—rare; 2—more; 3—much; 4—overgrown on the sides of vein)GPP
31Pubescens character of corners of main vein (1—closed; 2—of veins sides; 3—from sides and angle)GKPP
Table 2. Results of ANOVA on the effect of species on the leaf morphology traits of elms and their hybrids. No. is a numeric ID of a trait. The model R2, F value, and Pr > F from ANOVA are given for n = 189 individuals.
No.Morphology TraitR2FPr > F
1IS0.814159.745<0.0001
2L0.768121.395<0.0001
3KA0.761116.689<0.0001
4AG0.68780.502<0.0001
5PG0.68680.082<0.0001
6GKA0.66171.328<0.0001
7KP0.65469.197<0.0001
8AMax0.63463.525<0.0001
9I0.62460.786<0.0001
10Per0.59052.613<0.0001
11PlMax0.57048.548<0.0001
12GPP0.56246.934<0.0001
13A250.53341.765<0.0001
14Kilg0.46231.453<0.0001
15A100.41025.466<0.0001
16GK0.29915.635<0.0001
17Pl900.29215.078<0.0001
18Apag0.27814.123<0.0001
19K100.25312.416<0.0001
20Spag0.24611.969<0.0001
21VP0.21910.262<0.0001
22Fk0.1878.444<0.0001
23K250.0883.5350.004
24Pl/I0.0421.5990.163
25GKPP0.0160.5890.708
Table 3. Description of three main principal components (PCs) from the PCA on leaf traits with the highest R2 from the ANOVA. Pearson’s (R) and Kendall’s correlations (tau) with the PCA ordination axes; n = 189.
Morphologic CharacteristicsPC 1 PC 2 PC 3
RR2tauRR2tauRR2tau
Per0.985 *0.9700.903−0.1680.028−0.1740.0310.0010.022
I0.9450.8930.7910.0330.001−0.1040.0230.0010.017
PlMax0.8830.7800.6990.0480.002−0.0170.0910.0080.068
AMax0.9400.8830.779−0.1020.010−0.1460.0040.0000.009
A25−0.4420.196−0.245−0.8910.793−0.6670.1040.0110.167
PG0.0310.0010.049−0.3230.104−0.233−0.8500.723−0.637
G−0.0030.0000.040−0.3420.117−0.253−0.8370.701−0.606
L−0.3350.112−0.022−0.4880.238−0.307−0.5680.323−0.445
IS0.7040.4960.4830.2900.0840.0750.0680.005−0.073
GKA0.7210.5200.5510.0710.005−0.002−0.1500.022−0.125
KA0.0760.0060.085−0.2850.081−0.199−0.8810.776−0.674
2KP0.1130.0130.105−0.2250.050−0.145−0.9620.925−0.810
GPP−0.1160.013−0.047−0.3320.110−0.207−0.6920.479−0.501
* In bold—strong correlation.
Table 4. The within-population genetic diversity parameters estimated based on six nSSR loci.
Species Based on Leaf MorphologyAbbreviationsN *NaNeArHouHeFis
U. glabra × U. minorUG × UM247.674.066.510.5540.7250.209
U. minor subsp. minor × U. glabraUMm × UG126.504.356.500.5830.7680.183
U. minor subsp. minorUMm237.334.146.280.6480.7260.063
U. minorUM197.504.436.680.6320.7710.136
U. glabraUG288.004.556.490.7300.7540.006
U. laevisUL274.332.533.600.5950.577−0.061
Mean 6.894.016.000.6240.7200.089
* N—sample size; Na—mean no. of different alleles; Ne—mean no. of effective alleles; Ar—allelic richness (based on min. sample size of 12 individuals); Ho—observed heterozygosity; uHe—unbiased expected heterozygosity; F—fixation index.
Publisher’s Note: MDPI stays neutral with regard to jurisdictional claims in published maps and institutional affiliations.

