Article

Short-Term N-Fertilization Differently Affects the Leaf and Leaf Litter Chemistry of the Dominant Species in a Mediterranean Forest under Drought Conditions

1
CSIC, Global Ecology Unit CREAF-CSIC-UAB, 08913 Bellaterra, Catalonia, Spain
2
CREAF, 08913 Cerdanyola del Vallès, Catalonia, Spain
*
Author to whom correspondence should be addressed.
Forests 2021, 12(5), 605; https://doi.org/10.3390/f12050605
Submission received: 6 April 2021 / Revised: 5 May 2021 / Accepted: 7 May 2021 / Published: 12 May 2021
(This article belongs to the Section Forest Ecology and Management)

Abstract

:
Nitrogen (N) deposition is a key driver of global change with significant effects on carbon (C) cycling, species fitness, and diversity; however, its effects on Mediterranean ecosystems are unclear. Here, we simulated N deposition in an N-fertilization experiment with 15N-labeled fertilizer in a montane evergreen Mediterranean holm oak forest, in central Catalonia, to quantify short-term impacts on leaf, leaf litter elemental composition, and resorption efficiency in three dominant species (Quercus ilex, Phillyrea latifolia, and Arbutus unedo). We found that even under drought conditions, 15N isotope analysis of leaf and leaf litter showed a rapid uptake of the added N, suggesting an N deficient ecosystem. Species responses to N fertilization varied, where A. unedo was unaffected and the responses in P. latifolia and Q. ilex were similar, albeit with contrasting magnitude. P. latifolia benefited the most from N fertilization under drought conditions of the experimental year. These differences in species response could indicate impacts on species fitness, competition, and abundance under increased N loads in Mediterranean forest ecosystems. Further research is needed to disentangle interactions between long-term N deposition and the drought predicted under future climate scenarios in Mediterranean ecosystems.

1. Introduction

Nitrogen (N), which is an essential element for plant nutrition, is involved in complex cycling in terrestrial ecosystems that involves biotic and abiotic processes, such as N2-fixation, mineralization, nitrification, ammonification, and denitrification [1,2,3]. Anthropogenic activities since the industrial and agricultural revolutions, particularly those associated with fossil fuel combustion, cultivation of N2-fixing crops, and production of N fertilizer using the Haber-Bosch process, increasingly influence the global N-cycle as they are often key sources of N in terrestrial ecosystems, driving fluxes of similar magnitudes to natural fluxes [4,5,6]. Inorganic N deposition in European forests increased on average from about 2.8 kg ha−1a−1 in 1900 to a peak of 10.3 Kg N ha−1a−1 in 1990, followed by a decline to 6.6 Kg N ha−1a−1 by 2018 [7,8]. However, 62% of Europe continues to remain at risk of eutrophication [9] through rises in organic N deposition due to increasing levels of N-fertilization of cropland [8].
In general, N addition to ecosystems alters the first N cycle, increasing N mineralization, nitrification, and nitrate leaching rates, and thereafter other ecosystem variables such as P-cycle [5], and finally is associated with a long-term plant community diversity decrease [10]. Also, in some Mediterranean regions in California with elevated N deposition, native plant species have been replaced by invasive species with higher N performance [11,12,13]. Vegetation responses to increases in N supply are complex and include increased inter-plant competition, modified plant-soil feedbacks, and changes to plant-herbivore and plant-fungus relationships [14,15,16]. Typically, increases in N availability under N deposition are associated with greater plant growth [17,18], C-fixation [19], increased plant N concentrations [20,21], and reduced plant P concentrations [22,23] that contribute to increased plant N:P ratios [24,25,26,27]. While critical N loads have been described for a range of ecosystems and species, including 3–33 kg N ha−1 yr−1 for herbaceous species and shrublands and 4–39 kg N ha−1 yr−1 in forests in the US [10], there is a knowledge gap for Mediterranean Basin ecosystems.
Along with water availability, nutrient supply is a frequent limiting factor for Mediterranean ecosystems [28,29] and is an important factor in the growth, structure, and distribution of plant communities [30,31,32]. Consequently, Mediterranean forest communities tend to be dominated by woody plant species characterized by conservative traits related to tolerance of low water and nutrient conditions, such as slow growth and high levels of sclerophylly, high levels of investment in root biomass, and greater metabolic flexibility [28]. Responses of plant species to long-term N-fertilization under high levels of N deposition vary with life history strategy, where ruderal species are likely to be favored over stress-tolerators [33]. The resulting changes in competitive relationships within plant communities lead to long-term changes in species community composition [10,12,34], which could culminate in the extinction of endemic species and reduce overall levels of species diversity [16].
High levels of N deposition are known to constitute a threat for global plant diversity; as long as Mediterranean ecosystem is considered a diversity hotspot, an increase of N deposition could endanger its species diversity [35,36,37]. Deposition of N has been related to reduced levels of resilience in Mediterranean plant communities to disturbing climatic conditions [28]. However, few field studies have assessed the relationships between increases in N-availability and responses of dominant woody species and shifts in nutrient cycling in Mediterranean plant communities. In particular, even less field studies assessed the impacts of a sudden rise in N deposition on a semi-pristine Mediterranean ecosystem, in which current loads of N deposition are low and especially interacting with drought. Therefore, we aimed to study the short-term effects of N-fertilization to simulate rapid N deposition and availability on: (i) foliar and litter nutrient composition; (ii) foliar nutrient reabsorption; and (iii) foliar and litter carbon (C) and N isotope ratios in three dominant tree species of a semi-pristine, low-nutrient Mediterranean holm-oak forest to increase the understanding of species community composition and dynamics under increased N deposition in the increasingly dry Mediterranean environment.

2. Materials and Methods

2.1. Study Site

The study was carried out on a south-facing slope (25% incline) of a semi-pristine (Quercus ilex L.) forest, where N deposition was 3.5 kg N ha−1 yr−1 between 1981 and 1994 [38], in the Prades Mountains, Catalonia, NE Spain (41°21′ N, 1°02′ E). The forest has not been disturbed for the last 70 years and the maximum height of the dominant species is about 6–10 m. Mean annual temperature and precipitation are 12 °C and 658 mm, respectively, with the warmest months occurring between June and August and the rainiest period between September and November (Figure 1). These conditions correspond to a mesic-Mediterranean climate, with a pronounced summer drought period that usually lasts for 3 months. During the study period, mean annual temperature and annual precipitation in 2014 were 12.65 °C and 661.38 mm respectively, and 13.25 °C and 355.44 mm respectively in 2015 (Figure 1). Air temperature and rainfall were recorded by an automatic meteorological station in the studied area. The soil is a stony Dystric Cambisol, on a bedrock of metamorphic sandstone, and ranges between 35 and 100 cm in depth. The dense forest vegetation is dominated by Q. Ilex, with abundant Phillyrea latifolia L., Arbutus unedo L. among other evergreen species that are well-adapted to drought conditions (Erica arborea L., Juniperus oxycedrus L., and Cistus albidus L.) and the occasional occurrence of deciduous species (Sorbus torminalis L. Crantz and Acer monspessulanum L.). The three tree species (Q. ilex, P. latifolia, and A. unedo) represent 97% of the total aboveground biomass of the forest [39] and they frequently co-occur in Mediterranean maquis shrubland and evergreen Q. ilex forests. Q. ilex is widely distributed across the subhumid areas of the Mediterranean Basin, while P. latifolia occurs in warmer and drier Mediterranean areas [40,41] and A. unedo exploits forest gaps in which conditions are limiting for Q. ilex [42].

2.2. Experimental Design

We established eight 15 m × 10 m plots at the same altitude (950 m) [43]; four plots received N-fertilizer and the remainder were untreated controls. In 2015, a total fertilization of 60 kg of N ha−1 a−1 (at a rate of 15 kg N ha−1 in each annual season) was applied as a solution of ammonium nitrate (NH4NO3) with a sprayer. This fertilization was sprayed in 3 different days per season (5 kg N ha−1 each application), with at least 1 week between different applications. This solution was sprayed over the canopy level after climbing to the top of the uppermost tree in each plot. This solution was enriched with 15N as follows: 90% of “normal” ammonium nitrate, and 10% of ammonium nitrate enriched with 15N (the 10% of this enriched ammonium nitrate was 15N) (Sigma-Aldrich, Co., St. Louis, MO, USA).

2.3. Sampling

We sampled leaves of Q. ilex, P. latifolia, and A. unedo and foliar litter in mid-May (spring), end of July (summer), and mid-November (autumn) 2014, prior to treatment, and in 2015 during fertilization, sampling the same tree before and after treatment. On each sampling occasion, we randomly selected five trees of each species per plot and collected mature and healthy leaves at a height of 2–3 m from plants with a diameter of 2–12 cm at 5 cm above ground level; these plants represent about the 70% of the community biomass [44,45]. To reduce effects of tissue age and orientation to sunlight, we sampled leaves that were sun-lit and oriented southwards. Mean leaf life span is approximately 18 months [45], so most leaves sampled during 2015 under fertilization were also present during 2014 prior to treatment. Litterfall at the soil surface was collected in 20 circular baskets (27 cm in diameter, with 1.5-mm diameter mesh) that were randomly distributed in each plot. Even though the baskets were permanently placed over the ground, the dense canopy cover almost totally avoided N fertilization reaching the soil or the baskets. The collected litter was not in direct contact with the soil so its conservation state was good and the decomposition process had hardly begun. Once collected, the leaf and litter samples were taken to the laboratory and stored at 4 °C prior to analysis.
Foliar nutrient resorption was calculated as the difference in elemental compound concentration of leaves collected in 2014 and litter collected in 2015, using the equation 100 − (Xl × 100)/Xf, where Xl is litter element concentration in 2015 and Xf foliar element concentration in 2014. The result is an inference of proportional (%) element resorption efficiency prior to leaf fall.

2.4. Chemical Analyses

The leaf and foliar litter samples were washed with distilled water, as described by Porter (1986) [46], dried in an oven at 60 °C to a constant weight, and then ground using a mill (CYCLOTEC 1093, Foss Tecator, Höganäs, Sweden) for measurement of biomass. Leaf and litter concentrations of carbon (C) and N were quantified by combustion coupled to gas chromatography, by placing 1.4 mg of the milled samples in a tin microcapsule in an elemental analyzer (CHNS-O EuroVector, Milan, Italy), while concentrations of phosphorus (P), potassium (K), and micro-elements were determined by digesting samples of leaf and litter in acid in a microwave (MARSXpress, CEM, Matthews, NC, USA) at high pressure and temperature. Then 250 mg of each ground sample, 5 mL of nitric acid, and 2 mL of H2O2 were placed into Teflon tubes; digestate was placed in 50-mL flasks and diluted with Milli-Q water to a volume of 50 mL. Concentrations of P, K, and micro-elements were determined using optic emission spectrometry with inductively coupled plasma and the accuracy of the digestions and analytical biomass procedures was assessed using a certified standard biomass (NIST 1573a, tomato leaf; NIST, Gaitherburg, MD, USA) as a reference. Isotopic analyses of δ13C (13C/12C) and δ15N (15N/14N) of the leaf and litter samples were conducted at the Stable Isotope Facility at the University of California, Davis using a PDZ Europa ANCA-GSL elemental analyzer connected to a PDZ Europa 20−20 isotope ratio mass spectrometer (Sercon Ltd., Cheshire, UK).

2.5. Statistical Analyses

Between year treatment differences in plot, species, and season values were calculated based on proportional change in values between 2014 and 2015, and then linear mixed models were used to test for treatment differences in leaf and litter macro- (C, N, P, K) and micro-element concentrations (calcium, Ca; magnesium, Mg; chrome, Cr; iron, Fe; manganese, Mn; copper, Cu; zinc, Zn, strontium, Sr; nickel, Ni; and, lead, Pb) and reabsorption, and in foliar N and C isotopes by species, with plot and season as random factors. Models were defined using lme4 [47] and lmerTest [48] and r2 was calculated in MuMIn [49] R packages. Treatment differences in leaf and litter isotope content by species was tested using Student’s t-test.
Overall treatment differences in leaf and litter macro- (N, P, K) and micro-element (Ca, Mg, Fe, Mn, Cu, Zn) composition and isotope content (δ13C and δ15N) by species were tested using general discriminant analysis (GDA) in Statistica 8.0 (StatSoft, Inc., Tulsa, OK, USA) that identifies variables most responsible for group differences, while controlling variance due to other categorical variables (here, season).
In order to detect the effect of 2015’s exceptional arid conditions, we calculated a t-test between 2015 and 2014 for leaves and litter from only control plots (which have no treatment applied in 2015).

3. Results

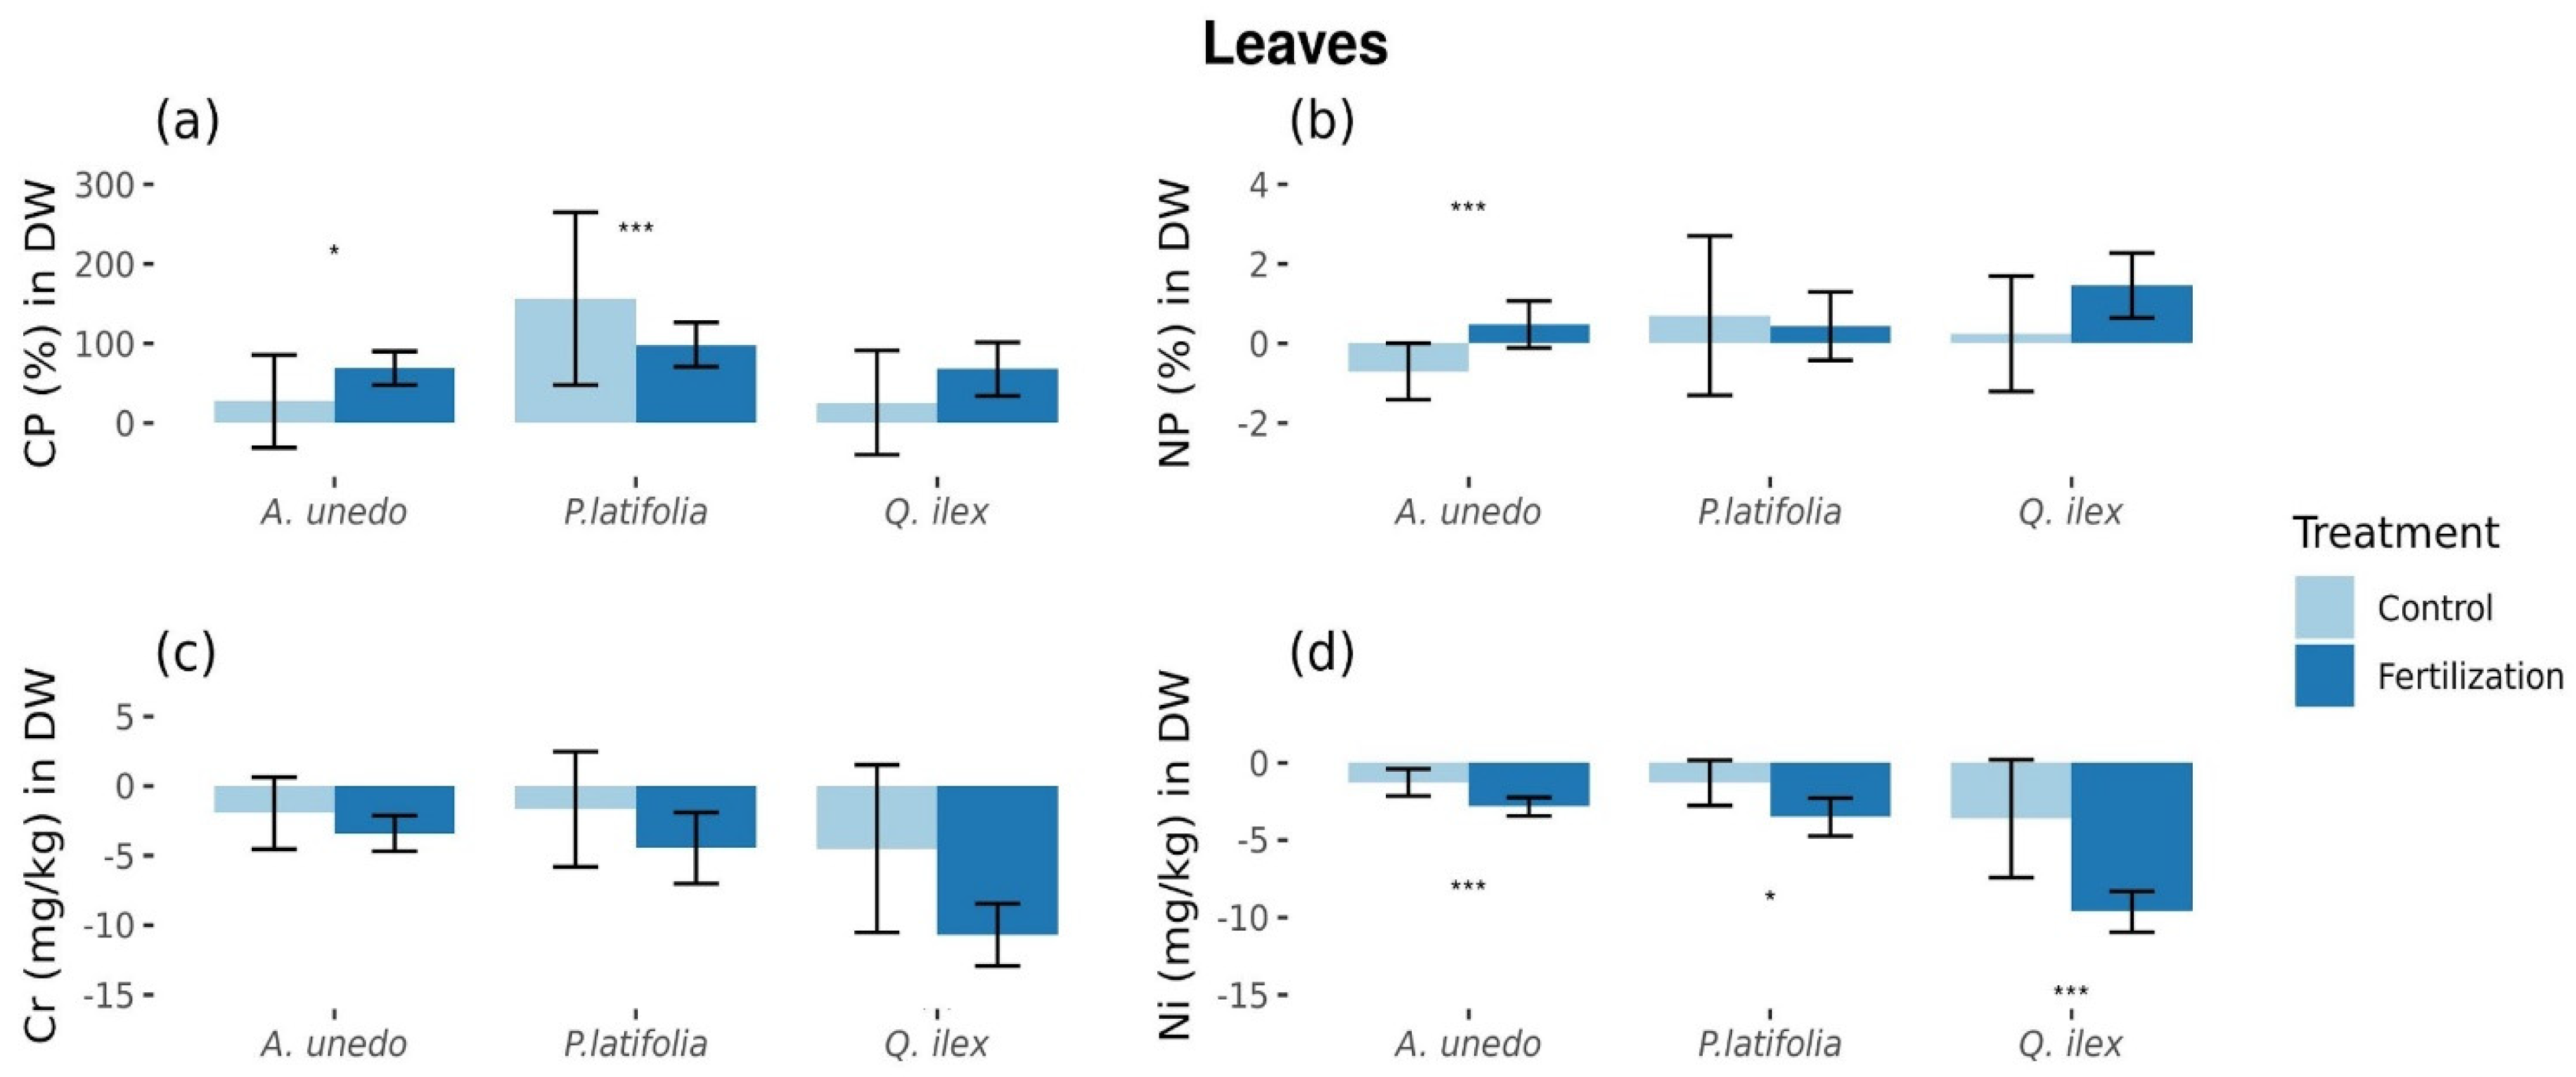
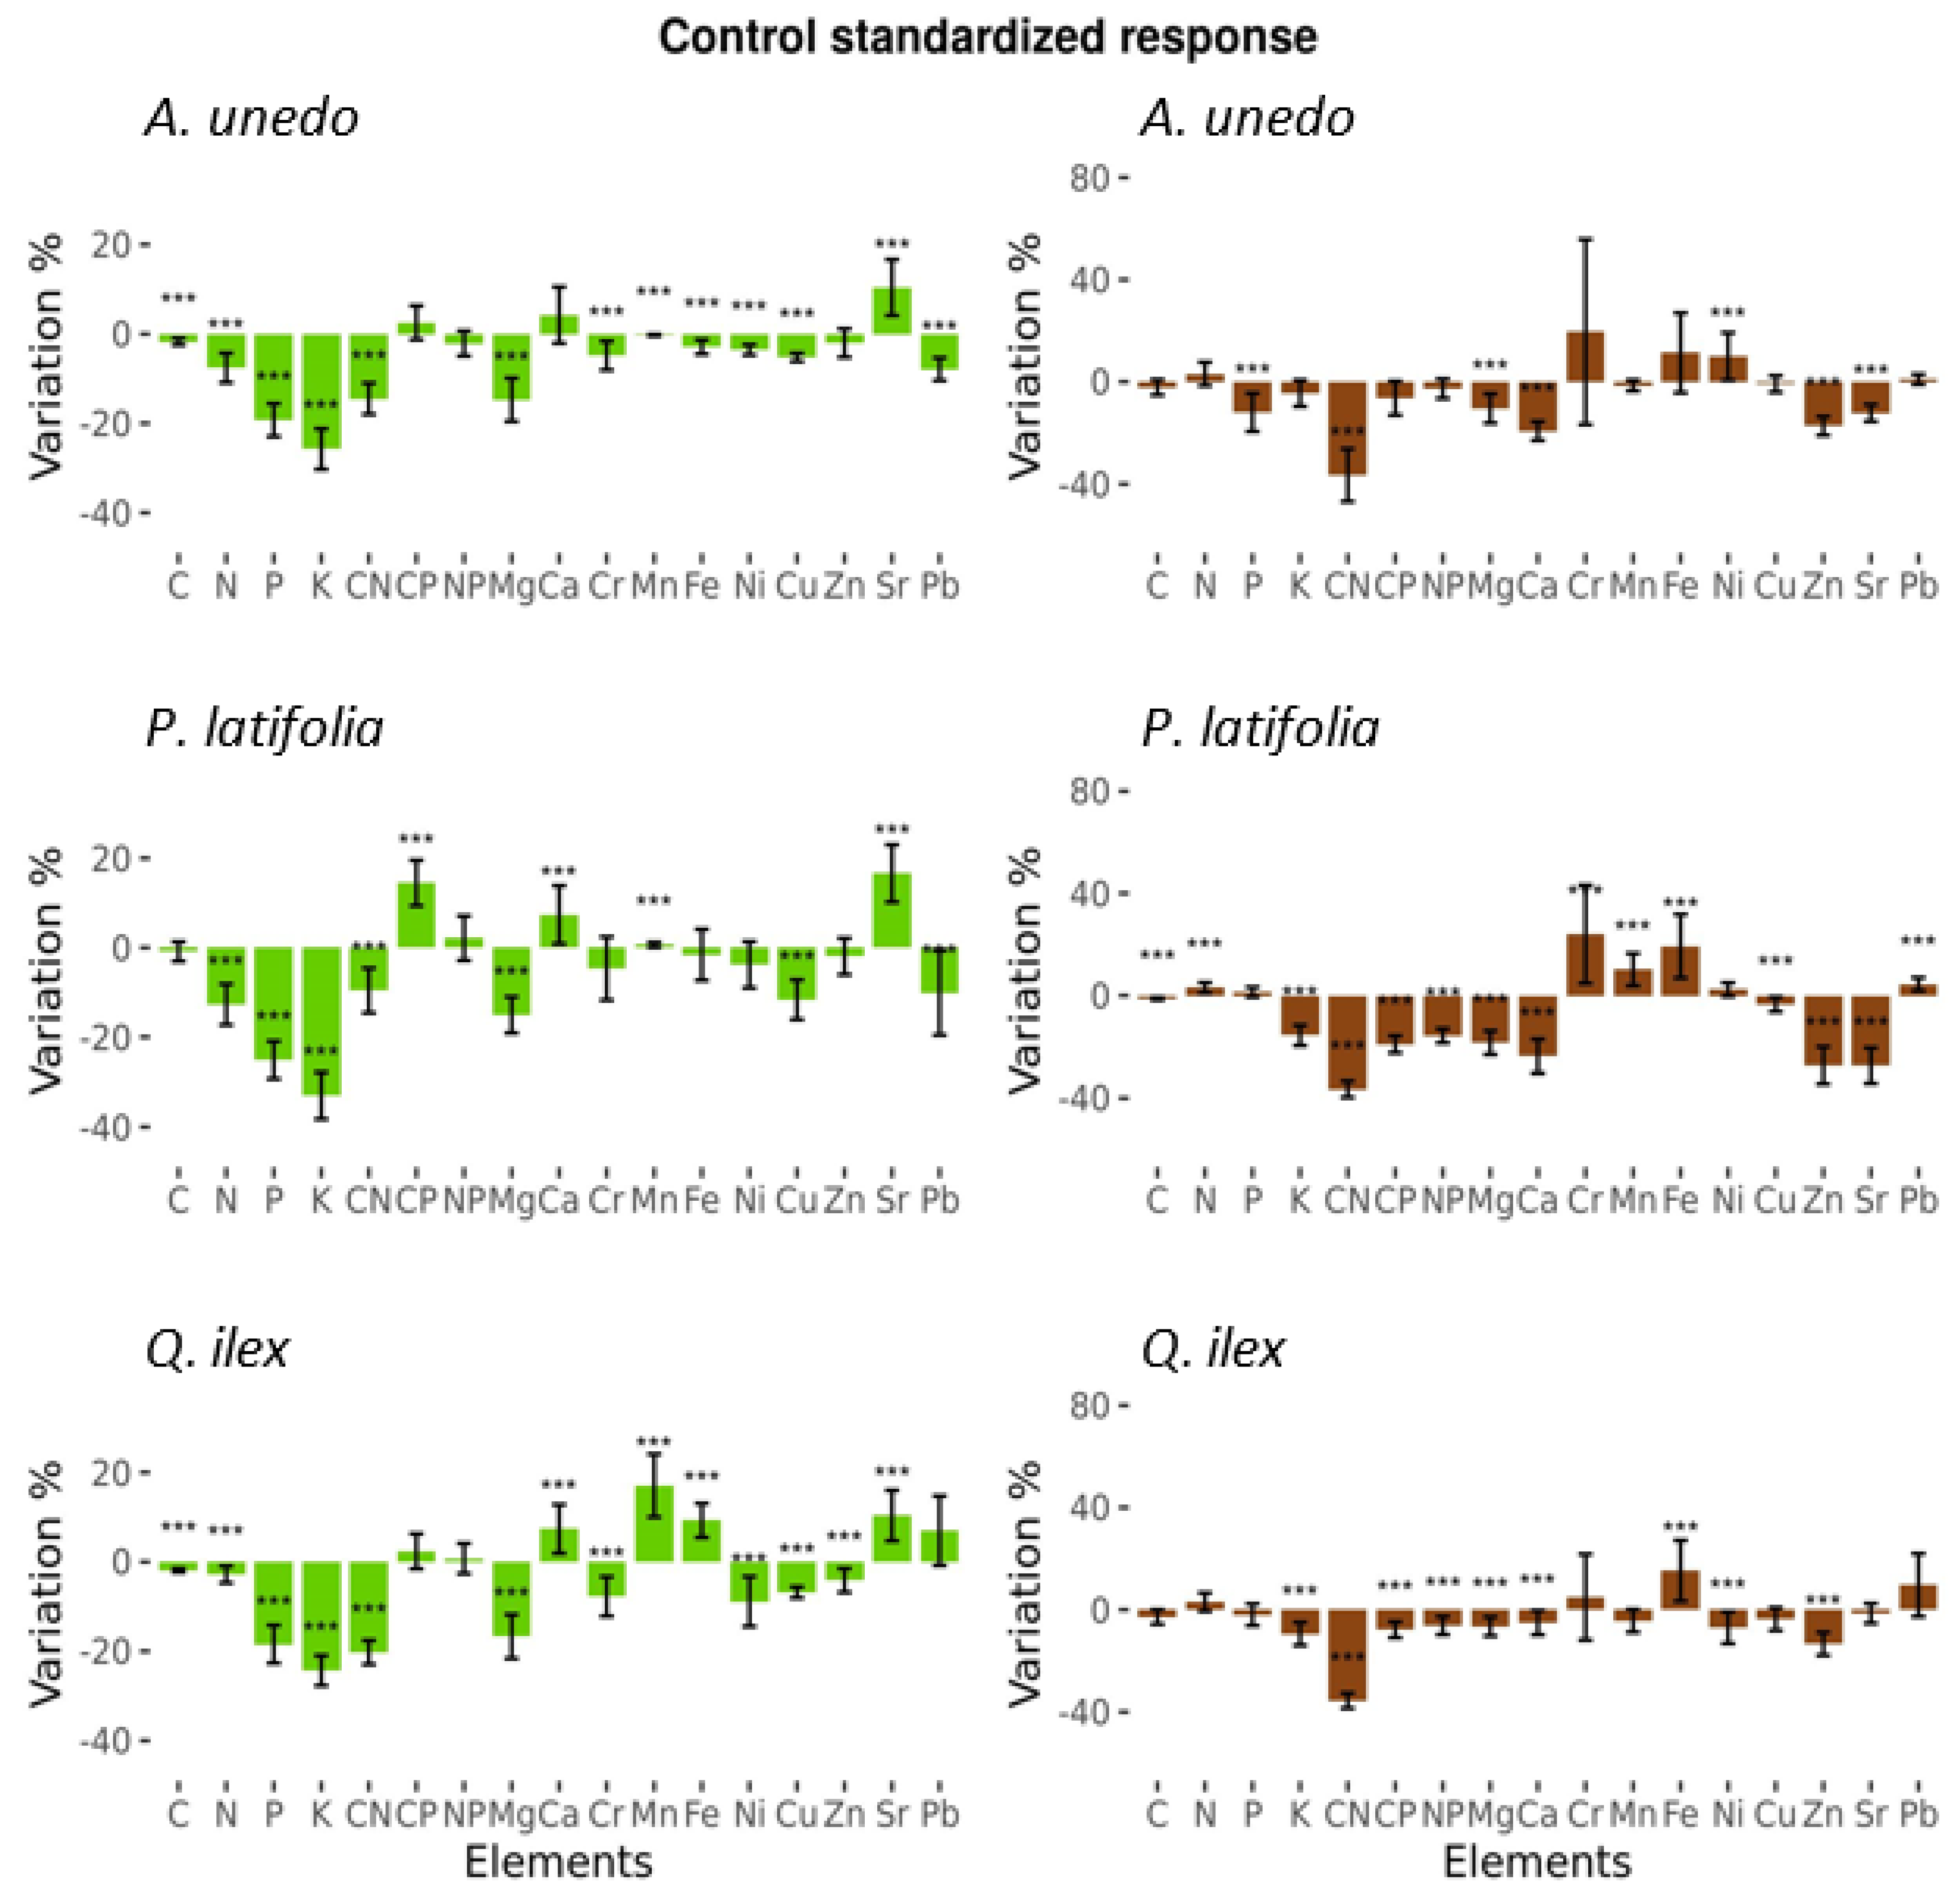
3.1. Fertilization Effects on Foliar Element Concentrations

There were between-year differences in C:P ratios in P. latifolia, where there were increases of 4.83 ± 3.36% and 3.05 ± 0.86% in untreated control and fertilized plots, respectively (difference between treatments: p < 0.05; ±standard error (SE) showed; Figure 2a, Table S1), and ratios of N:P differed for A. unedo, where there were 1.64 ± 1.65% decreases and 1.12 ± 1.38% increases in the untreated and treated plots from 2014 (pretreatment) to 2015 (post-treatment), respectively, (difference between treatments: p < 0.05; ±standard error (SE) showed; Figure 1b, Table S1). There were no treatment differences in leaf concentration of N, P, or K or in C:N ratios of the three species.
Among the micro-elements, there were differences in leaf concentrations of chromium (Cr) in Q. ilex, where there were decreases of 1.68 ± 1.83% and 3.56 ± 0.68% in the untreated and treated plots, respectively (difference between treatments: p < 0.05; ±standard error (SE) showed; Figure 1c), while leaf concentration of nickel (Ni) in A. unedo decreased by 0.76 ± 0.41% and 1.49 ± 0.28%, respectively (difference between treatments: p < 0.05; ±standard error (SE) showed), and decreased in Q. ilex by 1.86 ± 1.79% and 4.67 ± 0.62% (difference between treatments: p < 0.05; ±standard error (SE) showed; Figure 2d) (Table S1). There were no treatment differences in leaf concentrations of Ca, Mn, Fe, Cu, Zn, Sr, or Pb in the three species.

3.2. Fertilization Effects on Leaf Litter Element Concentrations

Treatment affected leaf litter concentration of macro-elements only in P. latifolia (p < 0.05; ±standard error (SE) showed), where P concentration increased by 0.49 ± 0.59% in untreated plots and decreased by 1.80 ± 0.72% in fertilized plots (Figure 3a), while C:P ratios were decreased by 18.44 ± 3.21% and 7.12 ± 3.22% in untreated and fertilized plots, respectively (Figure 3b), and N:P ratios were 15.52 ± 3.85% and 4.11 ± 3.04% lower, respectively (Figure 3c) (Table S2). There were no differences in leaf litter concentration of the remaining macro-elements in the three species.
There were differences in litter concentration of micro-elements among the species (Figure 3d–i, Table S2). A. unedo leaf litter of Mn, Zn, and Sr increased from −1.29 ± 0.82%, −12.25 ± 3.57%, and −9.44 ± 2.7% in the untreated plots to 1.44 ± 1.22%, −4.16 ± 2.33%, and −1.86 ± 2.33%, respectively, in the N fertilized plots (difference between treatments: p < 0.05; ±standard error (SE) showed), while P. latifolia leaf litter concentration of Ca, Zn, and Sr increased from −19.88 ± 5.35%, −18.73 ± 6.35%, and −21.44 ± 7.58% in untreated plots to −3.39 ± 4.53%, −6.64 ± 4.44%, and 3.19 ± 6.27%, respectively, in N fertilized plots and concentration of Mn and Pb decreased from 4.33 ± 10.88% and 4.04 ± 2.52% to −10.01 ± 6.04% and −3.24 ± 2.83%, in the untreated and treated plots, respectively (differences between treatments: p < 0.05; ±standard error (SE) showed). Q. ilex leaf litter concentration of Ca, Fe, and Sr decreased from −2.89 ± 7.32%, 16.58 ± 5.21%, and 1.02 ± 6.15% in control plots, respectively, to −15.77 ± 2.70%, −2.17 ± 6.95%, and −9.32 ± 2.91% in N fertilized plots, respectively (differences between treatments: p < 0.05; ±standard error (SE) showed).

3.3. Foliar Nutrient Resorption

There were no effects of treatment on resorption of N, P, or K. While there were no differences in micro-element resorption in A. unedo, resorption of Mg and Ca in P. latifolia decreased from −2.91 ± 5.28%, and −90.2 ± 50.17% in untreated plots, respectively, to −19.71 ± 8.12% and −171.1 ± 20.99%, respectively, in fertilized plots (differences between treatments: p < 0.05; ±standard error (SE) showed; Figure 4, Table S3).

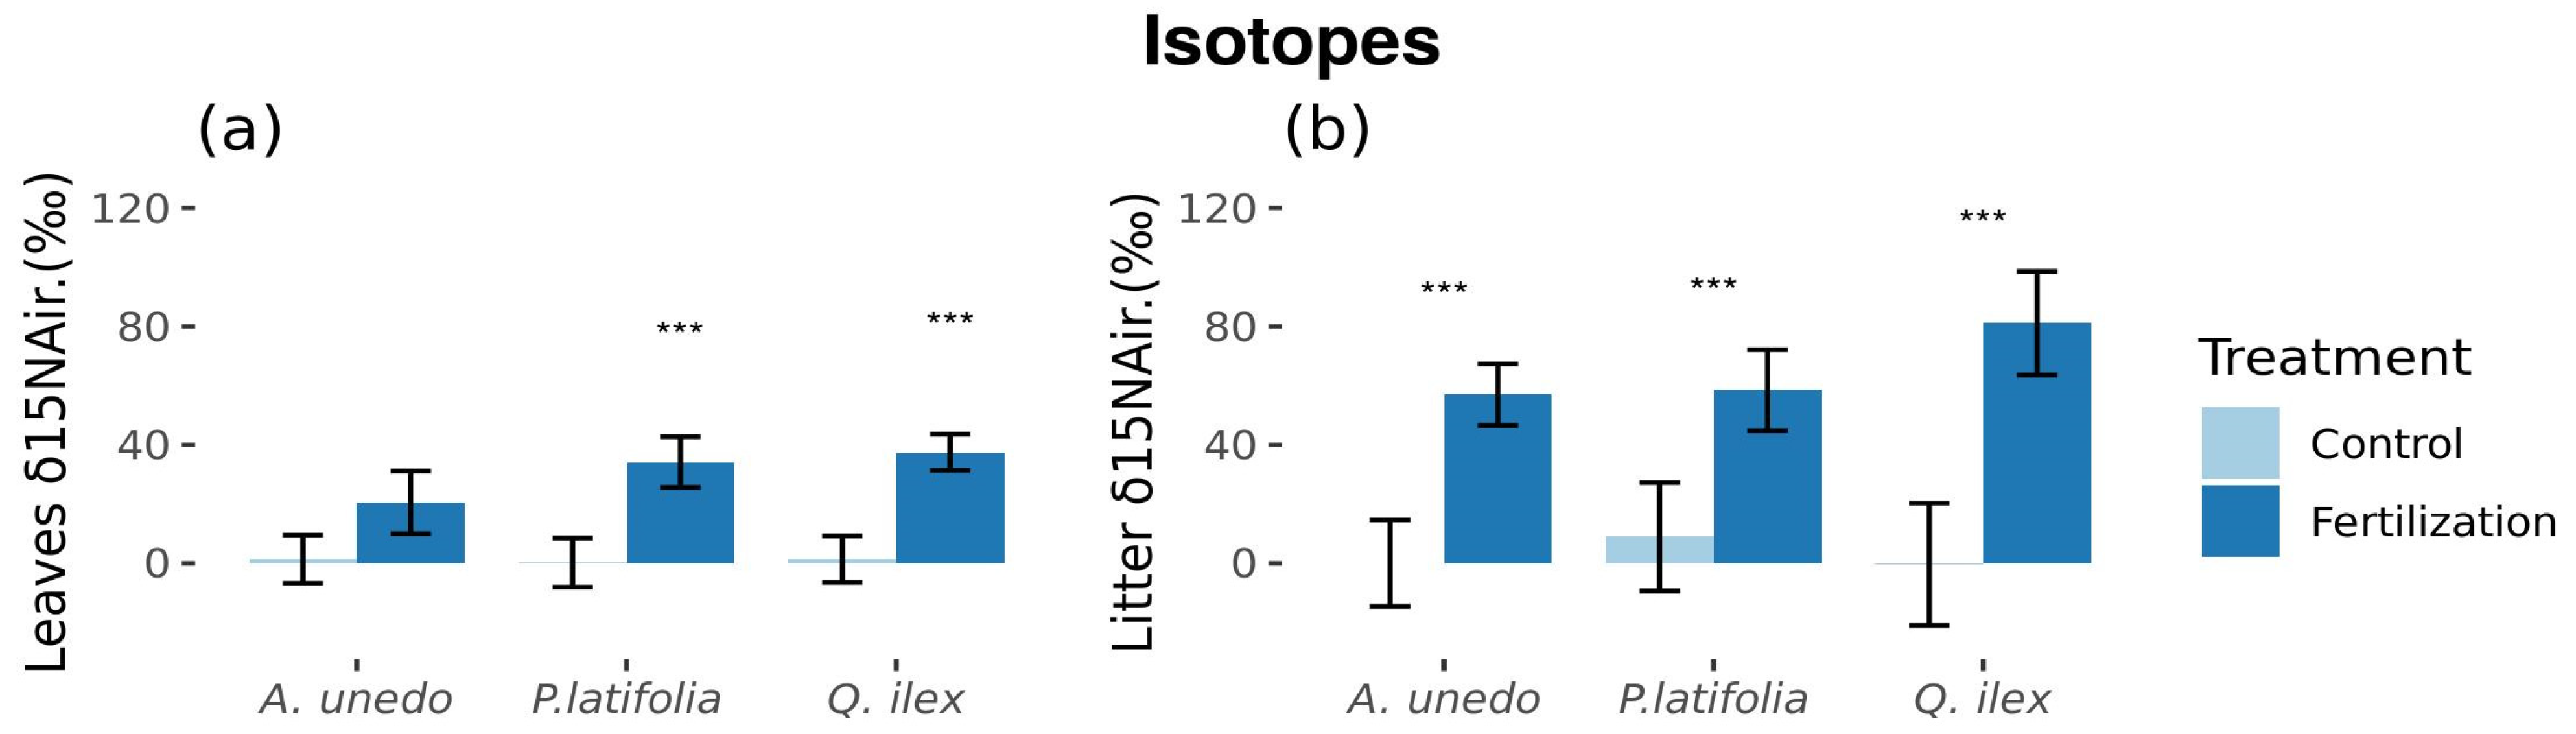
3.4. Fertilizer N-Uptake

While there were no differences between year treatment differences in leaf and litter δ13C in the three species, we found that leaf δ15N varied between the untreated and treated plots in P. latifolia (0.25 ± 8.28‰ and 34.2 ± 8.52‰, respectively) and Q. ilex (1.42 ± 7.78‰ and 37.49 ± 6.11‰, respectively) (differences between treatments: p < 0.05; ±standard error (SE) showed; Figure 5a). No leaf differences in foliar δ15N in A. unedo. Fertilization with 15N-enriched fertilizer increased leaf litter δ15N in A. unedo (from 0.072 ± 14.57‰ to 57.0 ± 10.42‰), P. latifolia (from 9.01 ± 18.30‰ to 58.5 ± 13.68‰), and Q. ilex (from −0.34 ± 20.68‰ to 81.1 ± 17.47‰) (differences between treatments: p < 0.05; ±standard error (SE) showed; Figure 5b) (Table S4). Content of δ15N in A. unedo and Q. ilex was greater in leaf litter than in leaf material.

3.5. Species Differences in Leaf and Leaf Litter Element Concentrations

The GDA driven by variation in δ13C, δ15N, K, Ca, Mn, Fe, Cu, and Zn concentrations (Table 1a) clearly separated the foliar elemental concentrations by species within and between treatments (Table 1b, Figure 6a). Similarly, there was clear separation of species in foliar litter within and between treatments (Table 2b, Figure 6b), driven by variation in δ13C, δ15N, N, P, K, Ca, Mn, and Fe concentrations (Table 2a). The variable loading most strongly in fertilized plots, separating them from control plots in leaves, is clearly δ15N and with lower intensity δ13C, while Cu, Mg, and Ca load to control plots. In litter, δ15N is the strongest variable loading in fertilized plots with N in lower intensity. Contrarily, Fe and Mn load to control plots.

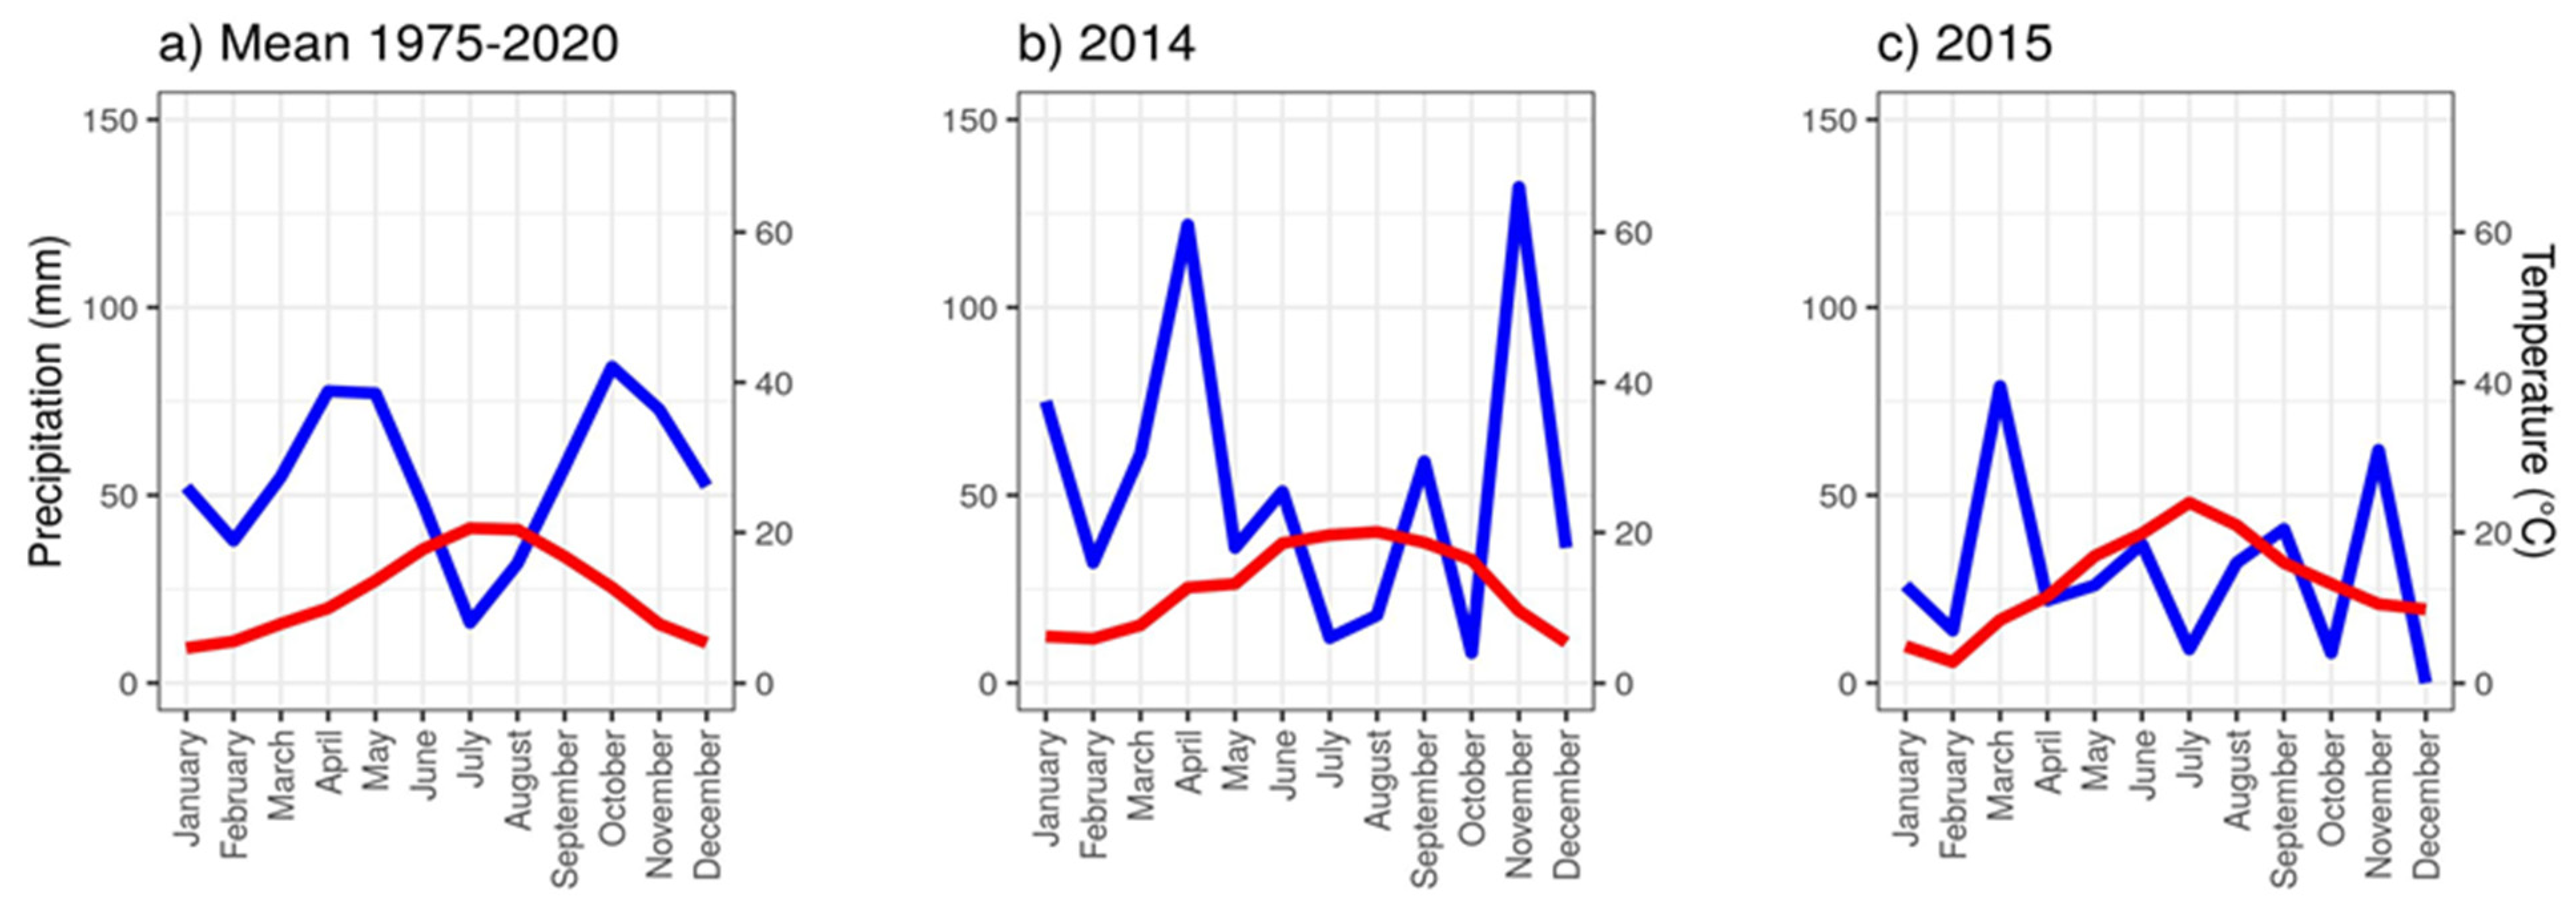
3.6. Drought Effects

All species have differences in control plots elemental composition between 2014 and 2015 in foliar tissue and respond similarly to drought. In foliar tissue, all macro-nutrients decrease significantly in 2015 in all three studied species except C in P. latifolia, which have no significant differences. In foliar micro-nutrients, Mg and Cu decrease significantly in 2015 in all three species, Ca increases significantly in P. latifolia and Q. ilex; Cr and Ni decreases in A. unedo and Q. ilex; Mn and Sr increase significantly in all three species; Fe decreases in A. unedo, increases in Q. ilex and has no differences in P. latifolia; Zn decreases in Q. ilex; and Pb decreases in A. unedo and P. latifolia and has no differences in Q. ilex (Figure 7).
In foliar litter elemental composition, the differences between 2014 and 2015 likely due to drought vary more between species than in foliar elemental composition. A. unedo has significant decreases in P, C:N, Mg, Ca, Zn, and Sr, and significant increase in Ni. P. latifolia has significant increases in N, Cr, Mn, Fe, and Pb, and significant decreases in C, K, C:N, C:P, N:P, Mg, Ca, Cu, Zn and Sr. In Q. ilex, there is a significant increase only in Fe and significant decreases in K, C:N, C:P, N:P, Mg, Ca, Ni, and Zn (Figure 7).

4. Discussion

4.1. Interannual Differences

The overall macro-elements reduction and micro-elements variation in control plots between 2014 and 2015, as seen in Figure 7, are inherent effects of the exceptional drought in 2015. These year to year effects of drought are consistent with the drought experiments carried out in the same studied Mediterranean forest, where reduction of foliar N [50,51], P [52,53,54], and micro nutrients variation [55,56] were described to be associated to the drought treatment. This decrease of nutrient uptake associated to a decrease of soil water content gives evidence of the potential negative effects of drought by decreasing nutrient uptake capacity as well as the reinforced negative feedback of low nutrient concentration in leaves lowering the plant capacity to maintain an adequate water use efficiency [57]. Therefore, to correctly assess the effects of addition of N in this study, the exceptional 2015 arid conditions needs to be considered.

4.2. Macro-Elements

In contrast to our results, fertilization with N would be expected to increase total concentration of foliar N; however, we found evidence of an increase in foliar 15N that indicates rapid plant uptake of the applied fertilizer. The contrasting effects of added N on total foliar N concentration and foliar 15N may be explained by two hypotheses. First, added N is highly available, so although plants in the fertilized plots may have taken up similar amounts of total N from soil, there may have been greater uptake of the more easily available rich 15N, and secondly, plants may have taken up greater amounts of N that was rapidly allocated to tissue other than leaf material, such as roots, to stimulate growth. Our results support these hypotheses, because we observed higher foliar concentrations of other elements following fertilization and higher leaf litter 15N concentrations that indicate decreases in leaf N resorption under increased N-availability.

4.3. Micro-Elements

In previous studies, N addition was related with a massive incorporation of NO3 into the system, causing cation losses by leaching and soil acidification [58,59,60]. In our study, leaching could have been generated by direct NO3 contact to the leaves, as described for acid rain impacts [61]. The decrease of foliar Cr in Q. ilex (Figure 2d) and Ni in A.unedo and Q. ilex (Figure 2e) is consistent with foliar leaching theory. In contrast, litter micro-elemental concentrations were not conclusively responding to N addition. The most remarkable response of micro-elements to N addition was the decrease of foliar Cr and Ni, which do not have a known biological benefit to plants and are considered pollutants. In this case, the short-term effects of N addition may be considered beneficial for species fitness, even though the size of effect varied among the three species (greatest in Q. ilex, moderate in A. unedo, and null in P. latifolia).

4.4. Nutrient Uptake

The isotope analysis showed rapid incorporation of N to the ecosystem following fertilization, where there were differences in foliar δ15N, but not of δ13C. Foliar uptake of N by A. unedo was unaffected by treatment, whereas fertilization led to greater uptake in P. latifolia and Q. ilex (Figure 6), indicating possible interspecific imbalances in nutrient uptake under drought conditions.
In contrast, leaf litter 15N was consistently greater among the three species under N-fertilization, where the greater concentration in A. unedo and Q. ilex leaf litter than in leaf material highlights differences in resorption and indicates that, prior to the release of senescent leaves, A. unedo and Q. ilex reabsorbed smaller or negligible amounts of the applied N enriched with 15N. There were no differences between δ15N of P. latifolia leaf material and leaf litter, indicating unchanged levels of N resorption under N addition; this maintenance of greater nutrient use efficiency, even under drought conditions, than in A. unedo and Q. ilex, is consistent with previous studies that report its greater capacity for the maintenance of optimal function and growth under increasing drought than the other two species [44,62].

4.5. N limited Ecosystem

Our analyses showed rapid leaf and leaf litter elemental composition responses to N addition, through the increases in leaf and leaf litter δ15N, allowing us to conclude that this Mediterranean forest ecosystem is N limited, which is consistent with previous studies that showed decreases in foliar N in Mediterranean ecosystems during the 20th century, and associated them to increases in photosynthetic rates and C fixation, as well as growth capacity because of increasing atmospheric CO2 concentrations [63] and with N limitation reported in the forests we studied [64]. Furthermore, the drought in 2015 also contributed to decreasing foliar N and increased even more the original plant N deficiency phenomenon already described in other studies [65].
These three dominant species of the holm oak forest ecosystem were characterized by smaller decreases in leaf and leaf litter concentrations of several elements under N-fertilization during the extreme high drought conditions of 2015. This rapid response of the mature ecosystem was remarkable and indicates that addition of N to an N-limited ecosystem improves nutrient retention and increases resilience of ecosystem function to drought stress.
Such drought recovery under N fertilization conditions could drive forest managers to consider generalized application of N-fertilization to stimulate C-uptake after droughts. However, N fertilization would be logistically complicated and would cause important N-cycle alterations, nutrient imbalances, decrease of diversity, and also can favor highly competitive invasive species replacing endemic ones. However, these impacts could be improved adding other nutrients such as P and K or even Fe, Mg, and sulfur. In this way, the fertilization probably would not generate important nutrient imbalances, and plants with better nutritional status could improve their water use efficiency. Our results can thus be useful for developing management strategies for Mediterranean forests under increasingly dry conditions projected for coming decades.
Long-term continuous N-fertilization experiments are needed to confirm the wider effects of increased availability of N on growth and stocks and changes in plant-soil cycling of nutrient elements of this Mediterranean ecosystem, including its dominant species. It is likely that sustained N deposition would decrease N limitation and its associated effects, but elements that derive from the bedrock, such as P or K, will increasingly become leached and limiting [5,6].

4.6. Biogeochemical Niche Differentiation

The GDA analysis showed a clear differentiation in element concentration among the three studied species and with treatment. This differentiation suggests a particular chemical identity per species as well as a particular species response to the same drivers. This chemical differentiation among species is supported by biogeochemical niche hypothesis [33,66,67]. Biogeochemical niche hypothesis is a derivation of the classic niche theory, which assigns to each species a specific position into a multidimensional space of traits, environmental requirements, and “needs”. Biogeochemical niche hypothesis aims to synthesize all these variables into an easily quantifiable multidimensional space of the elemental composition with the “n-dimensional” axes being the concentrations of the different bioelements. This chemical divergence responds to the necessity of avoiding niche overlap that has been driven through evolutive genetic selection and the environmental conditions where the species has been developed.

4.7. Species Differences in Response to N Fertilization

A. unedo, P. latifolia, and Q. ilex coexist at the same stage of ecological succession in the Mediterranean forest ecosystem [42,68], presenting different intraspecific tolerance to different extreme conditions. Despite P. latifolia and Q. ilex sharing the same strategy to avoid water loss during drought, P. latifolia has a higher tolerance, a more efficient recovery to drought [69], and high temperatures than Q. ilex [44]. At the same time, P. latifolia has lower tolerance to low winter temperatures than Q. ilex [69]. Also, previous studies of impacts of long-term drought have shown that Q. ilex and A. unedo are mostly affected through changes in C and nutrient storage, whereas P. latifolia tends to remain unaffected [44,62]. Despite all three species sharing a dimorphic root system, enabling them to access different water level sources [70], these differences seem to be explained through xylem vessels width. Q. ilex and A. unedo have wider xylem vessels, which allow them to transport greater amounts of sap under well-watered conditions, but makes them more susceptible to embolism under drought conditions [71]. Also, Q. ilex has higher capacity to exclude potential toxic ions than A. unedo [72].
The intraspecific different responses to N-fertilization observed in this study are consequent with the different species tolerance to drought conditions, where P. latifolia is the most drought-resistant species and also the one best at assimilating better N addition. As long as the fertilizer is sprayed to the leaves, its absorption is directly related to stomatal opening. Thus, better watered species can afford longer stomatal apertures and consequently, higher N absorption [73]. This different N absorption among species may lead to changes in species composition in a drier and N fertilized environment as projected for these Mediterranean ecosystems for the next decades [9,28,74]. Under extreme drought conditions, P. latifolia could overtake Q. ilex dominance [65].

5. Conclusions

We found that added N was rapidly utilized in the three studied species, consistent with previous observations of N limitation in this area; this effect was remarkable, given the exceptional arid conditions during the study. Species responses to sudden increases in N availability varied, where A. unedo was unaffected and direction of responses in P. latifolia and Q. ilex were similar, albeit with contrasting magnitude. The macro-element concentrations were more sensitive in P. latifolia than in the other two species. P. latifolia was the species that took best advantage of the N fertilization and the species less affected by drought. The chemical composition of the three study species before and after N-fertilization follows the biogeochemical niche hypothesis, where differences in response may trigger changes in species coexistence and community composition.

Supplementary Materials

The following are available online at https://www.mdpi.com/article/10.3390/f12050605/s1, Table S1: Results of the foliar mixed models. Table S2: Results of the litter mixed models. Table S3: Results of the reabsorption mixed models. Table S4: Results of the isotopes mixed models.

Author Contributions

Conceptualization, J.S. and J.P.; Data curation, H.V., R.O. and P.R.F.; Formal analysis, H.V. and J.S.; Methodology, H.V., R.O. and P.R.F.; Project administration, J.P.; Resources, J.P.; Supervision, J.S., J.P.; Visualization, H.V. and J.S.; Writing–original draft, H.V.; Writing–review & editing, H.V., J.S., R.O., J.P. All authors have read and agreed to the published version of the manuscript.

Funding

The authors would like to acknowledge the financial support from the Spanish government grant PID2019-110521GB-I00, the Fundación Areces grant ELEMENTAL-CLIMATE-2021, the Catalan Government grant SGR-2017-1005 and the European Research Council Synergy grant ERC-SyG-2013-610028 IMBALANCE-P.

Data Availability Statement

The data presented in this study are available on request from the corresponding author. The data are not publicly available due to the project is not finished yet.

Conflicts of Interest

The authors declare no conflict of interest.

References

  1. Peoples:, M.B.; Herridge, D.F.; Ladha, J.K. Biological nitrogen fixation: An efficient source of nitrogen for sustainable agricultural production? Plant Soil 1995, 174, 3–28. [Google Scholar] [CrossRef]
  2. Foth, H. Chapter 12: Plant-Soil Macronutrient Relations. In Fundamentals of Soil Science, 8th ed.; John Wiley Company: New York, NY, USA, 1990; pp. 186–209. [Google Scholar]
  3. Brady, N.; Weil, R. Nutrient cycles and soil fertility. In Elements of the Nature and Properties of Soils, 3rd ed.; Anthony, V.R., Ed.; Pearson Education Inc.: Upper Saddle River, NJ, USA, 2010; pp. 396–420. [Google Scholar]
  4. Galloway, J.N.; ATownsend, A.R.; Erisman, J.W.; Bekunda, M.; Cai, Z.; Freney, J.R.; Martinelli, L.A.; Seitzinger, S.P.; Sutton, M.A. Transformation of the Nitrogen Cycle: Recent Trends, Questions, and Potential Solutions. Science 2008, 320, 889–892. [Google Scholar] [CrossRef] [PubMed] [Green Version]
  5. Peñuelas, J.; Poulter, B.; Sardans, J.; Ciais, P.; Van Der Velde, M.; Bopp, L.; Boucher, O.; Godderis, Y.; Hisinger, P.; Llusia, J.; et al. Human-induced nitrogen–phosphorus imbalances alter natural and managed ecosystems across the globe. Nat. Commun. 2013, 4, 2934. [Google Scholar] [CrossRef] [PubMed] [Green Version]
  6. Penuelas, J.; Janssens, I.; Ciais, P.; Obersteiner, M.; Sardans, J. Anthropogenic global shifts in biospheric N and P concentrations and ratios and their impacts on biodiversity, ecosystem productivity, food security, and human health. Glob. Chang. Biol. 2020, 26, 1962–1985. [Google Scholar] [CrossRef] [PubMed] [Green Version]
  7. Engardt, M.; Simpson, D.; Schwikowski, M.; Granat, L. Deposition of sulphur and nitrogen in Europe 1900–2050. Model calculations and comparison to historical observations. Tellus B Chem. Phys. Meteorol. 2017, 69, 1328945. [Google Scholar] [CrossRef] [Green Version]
  8. Schmitz, A.; Sanders, T.G.M.; Bolte, A.; Bussotti, F.; Dirnböck, T.; Johnson, J.; Peñuelas, J.; Pollastrini, M.; Prescher, A.-K.; Sardans, J.; et al. Responses of forest ecosystems in Europe to decreasing nitrogen deposition. Environ. Pollut. 2019, 244, 980–994. [Google Scholar] [CrossRef] [PubMed]
  9. Slootweg, J.; Posch, M.; Hettelingh, J.P. Modelling and Mapping the Impacts of Atmospheric Deposition of Nitrogen and Sulphur: CCE Status Report 2015; Coordination Centre for Effects, National Institute for Public Health and the Environment: Bilthoven, The Netherlands, 2015. [Google Scholar]
  10. Pardo, L.H.; Fenn, M.E.; Goodale, C.L.; Geiser, L.H.; Driscoll, C.T.; Allen, E.B.; Baron, J.S.; Bobbink, R.; Bowman, W.D.; Clark, C.M.; et al. Effects of nitrogen deposition and empirical nitrogen critical loads for ecoregions of the United States. Ecol. Appl. 2011, 21, 3049–3082. [Google Scholar] [CrossRef] [Green Version]
  11. Fenn, M.E.; Allen, E.B.; Weiss, S.B.; Jovan, S.; Geiser, L.H.; Tonnesen, G.S.; Johnson, R.F.; Rao, L.E.; Gimeno, B.S.; Yuan, F.; et al. Nitrogen critical loads and management alternatives for N-impacted ecosystems in California. J. Environ. Manag. 2010, 91, 2404–2423. [Google Scholar] [CrossRef]
  12. Rao, L.E.; Allen, E.B. Combined effects of precipitation and nitrogen deposition on native and invasive winter annual production in California deserts. Oecologia 2010, 162, 1035–1046. [Google Scholar] [CrossRef] [Green Version]
  13. Rao, L.E.; Allen, E.B.; Meixner, T. Risk-based determination of critical nitrogen deposition loads for fire spread in southern California deserts. Ecol. Appl. 2010, 20, 1320–1335. [Google Scholar] [CrossRef]
  14. Gilliam, F.S. Response of the herbaceous layer of forest ecosystems to excess nitrogen deposition. J. Ecol. 2006, 94, 1176–1191. [Google Scholar] [CrossRef] [Green Version]
  15. Friedrich, U.; Von Oheimb, G.; Kriebitzsch, W.U.; Schleßelmann, K.; Weber, M.S.; Härdtle, W. Nitrogen deposition increases susceptibility to drought—Experimental evidence with the perennial grass Molinia caerulea (L.) Moench. Plant Soil 2012, 353, 59–71. [Google Scholar] [CrossRef]
  16. Ochoa-Hueso, R.; Allen, E.B.; Branquinho, C.; Cruz, C.; Dias, T.; Fenn, M.E.; Manrique, E.; Pérez-Corona, M.E.; Sheppard, L.J.; Stock, W.D. Nitrogen deposition effects on Mediterranean-type ecosystems: An ecological assessment. Environ. Pollut. 2011, 159, 2265–2279. [Google Scholar] [CrossRef] [PubMed]
  17. Eisenlord, S.; Zak, D. Simulated Atmospheric Nitrogen Deposition Alters Actinobacterial Community Composition in Forest Soils. Soil Biol. Biochem. 2009, 74, 1157–1166. [Google Scholar] [CrossRef] [Green Version]
  18. Bontemps, J.D.; Hervé, J.C.; Leban, J.M.; Dhôte, J.F. Nitrogen footprint in a long-term observation of forest growth over the twentieth century. Trees 2011, 25, 237–251. [Google Scholar] [CrossRef] [Green Version]
  19. Schulte-Uebbing, L.; De Vries, W. Global-scale impacts of nitrogen deposition on tree carbon sequestration in tropical, temperate, and boreal forests: A meta-analysis. Glob. Chang. Biol. 2018, 24, e416–e431. [Google Scholar] [CrossRef]
  20. Fenn, M.E.; Poth, M.A.; Aber, J.D.; Baron, J.S.; Bormann, B.T.; Johnson, D.W.; Lemly, A.D.; McNulty, S.G.; Ryan, D.F.; Stottlemyer, R. Nitrogen Excess in North American Ecosystems: Predisposing Factors, Ecosystem Responses, and Management Strategies. Ecol. Appl. 1998, 8, 706–733. [Google Scholar] [CrossRef]
  21. Baron, J.; Rueth, H.; Wolfe, A.; Nydick, K.R.; Allstott, E.J.; Minear, J.T.; Moraska, B. Ecosystem Responses to Nitrogen Deposition in the Colorado Front Range. Ecosystems 2000, 3, 352–368. [Google Scholar] [CrossRef]
  22. Duquesnay, A.; Dupouey, J.L.; Clement, A.; Ulrich, E.; Le Tacon, F. Spatial and temporal variability of foliar mineral concentration in beech (Fagus sylvatica) stands in northeastern France. Tree Physiol. 2000, 20, 13–22. [Google Scholar] [CrossRef] [Green Version]
  23. Kowalenko, C.G. The effect of nitrogen and boron fertilizer applications on Willamette red raspberry growth, and on applied and other nutrients in the plant and soil over two growing seasons. Can. J. Plant Sci. 2005, 86, 213–225. [Google Scholar] [CrossRef]
  24. Huang, Z.; Liu, B.; Davis, M.; Sardans, J.; Peñuelas, J.; Billings, S. Long-term nitrogen deposition linked to reduced water use efficiency in forests with low phosphorus availability. New Phytol. 2016, 210, 431–442. [Google Scholar] [CrossRef] [PubMed] [Green Version]
  25. Ferretti, M.; Marchetto, A.; Arisci, S.; Bussotti, F.; Calderisi, M.; Carnicelli, S.; Cecchini, G.; Fabbio, G.; Bertini, G.; Matteucci, G.; et al. On the tracks of Nitrogen deposition effects on temperate forests at their southern European range—An observational study from Italy. Glob. Chang. Biol. 2014, 20, 3423–3438. [Google Scholar] [CrossRef] [Green Version]
  26. Veresoglou, S.D.; Peñuelas, J.; Fischer, R.; Rautio, P.; Sardans, J.; Merilä, P.; Tabakovic-Tosic, M.; Rillig, M.C. Exploring continental-scale stand health e N: P ratio relationships for European forests. New Phytol. 2014, 202, 422–430. [Google Scholar] [CrossRef] [PubMed]
  27. Zhang, X.; Chen, Q.; Han, X. Soil Bacterial Communities Respond to Mowing and Nutrient Addition in a Steppe Ecosystem. PLoS ONE 2013, 8, e84210. [Google Scholar] [CrossRef]
  28. Sardans, J.; Penuelas, J. Plant-soil interactions in Mediterranean forest and shrublands: Impacts of climatic change. Plant Soil 2013, 365, 1–33. [Google Scholar] [CrossRef] [Green Version]
  29. Peñuelas, J.; Sardans, J.; Filella, I.; Estiarte, M.; Llusià, J.; Ogaya, R.; Carnicer, J.; Bartrons, M.; Rivas-Ubach, A.; Grau, O.; et al. Assessment of the impacts of climate change on Mediterranean terrestrial ecosystems based on data from field experiments and long-term monitored field gradients in Catalonia. Environ. Exp. Bot. 2018, 152, 49–59. [Google Scholar] [CrossRef]
  30. Carreira, J.A.; Sánchez-Vázquez, F.; Niell, F.X. Short-termand small-scale patterns of post-fire regeneration in a semi-ariddolomitic basin of Southern Spain. Acta Oecol. 1992, 13, 241–253. [Google Scholar]
  31. Henkin, Z.; Seligman, N.G.; Kafkafi, U.; Noy-Meir, I. Effective growing days: A simple predictive model of re-sponse of herbaceous plant growth in a Mediterranean ecosystem to variation in rainfall and phosphorus availability. J. Ecol. 1998, 86, 137–148. [Google Scholar] [CrossRef]
  32. Sardans, J.; Peñuelas, J. Tree stoichiometry and growth. Glob. Ecol. Biogeogr. 2013, 22, 494–507. [Google Scholar] [CrossRef]
  33. Peñuelas, J.; Fernández-Martínez, M.; Ciais, P.; Jou, D.; Piao, S.; Obersteiner, M.; Vicca, S.; Janssens, I.A.; Sardans, J. The bioelements, the elementome, and the biogeochemical niche. Ecology 2019, 100, e02652. [Google Scholar] [CrossRef]
  34. Hu, M.; Peñuelas, J.; Sardans, J.; Sun, Z.; Wilson, B.J.; Huang, J.; Zhu, Q.; Tong, C. Stoichiometry patterns of plant organ N and P in coastal herbaceous wetlands along the East China Sea: Implications for biogeochemical niche. Plant Soil 2018, 431, 273–288. [Google Scholar] [CrossRef]
  35. Bobbink, B.; Hicks, K.; Galloway, J.; Spranger, T.; Alkemade, R.; Ashmore, M.; Bustamante, M.; Cinderby, S.; Davidson, E.; Dentener, F.; et al. Global assessment of nitrogen deposition effects on terrestrial plant diversity: A synthesis. Ecol. Appl. 2010, 20, 30–59. [Google Scholar] [CrossRef] [PubMed] [Green Version]
  36. Clark, C.M.; Morefield, P.E.; Gilliam, F.S.; Pardo, L.H. Estimated losses of plant biodiversity in the United States from historical N deposition (1985–2010). Ecology 2013, 94, 1441–1448. [Google Scholar] [CrossRef] [PubMed] [Green Version]
  37. Soons, M.B.; Hefting, M.M.; Dorland, E.; Lamers, L.P.M.; Versteeg, C.; Bobbink, R. Nitrogen effects on plant species richness in herbaceous communities are more widespread and stronger than those of phosphorus. Biol. Conserv. 2017, 212, 390–397. [Google Scholar] [CrossRef]
  38. Escarre, J.; Lepart, J.; Sans, X.; Sentuc, J.; Gorse, V. Effects of herbivory on the growth and reproduction of Picris hieracioides in the Mediterranean region. J. Veg. Sci. 1999, 10, 101–110. [Google Scholar] [CrossRef]
  39. Ogaya, R.; Peñuelas, J. Tree growth, mortality, and above-ground biomass accumulation in a holm oak forest under a five-year experimental field drought. Plant Ecol. 2007, 189, 291–299. [Google Scholar] [CrossRef]
  40. Tretiach, M. Photosynthesis and transpiration of evergreen Mediterranean and deciduous trees in an ecotone during a growing season. Acta Oecol. Int. J. Ecol. 1993, 14, 341–360. [Google Scholar]
  41. Lloret, F.; Siscart, D. Demographic drought effects on holm oak populations. Cuad. Soc. Esp. Cien. Forest. 1995, 2, 77–81. [Google Scholar]
  42. Panaiotis, C.; Loiser, R.; Paradis, G. Dating natural gaps in the holm oak forest (Quercus ilex L.) in Fango MAB Reserve (Corsica) by reading rings of maquis components datation des trouées naturelles en forêt de chênes verts (Quercus ilex L.) dans la réserve MAB du Fango (Corse) par la lecture des cernes des essences du maquis. Ann. Sci. For. 1995, 52, 477–487. [Google Scholar] [CrossRef]
  43. Ogaya, R.; Liu, D.; Barbeta, A.; Peñuelas, J. Stem Mortality and Forest Dieback in a 20-Years Experimental Drought in a Mediterranean Holm Oak Forest. Front. For. Glob. Chang. 2020, 2, 89. [Google Scholar] [CrossRef]
  44. Ogaya, R.; Peñuelas, J.; Martínez-Vilalta, J.; Mangirón, M. Effect of drought on diameter increment of Quercus ilex, Phillyrea latifolia, and Arbutus unedo in a holm oak forest of NE Spain. For. Ecol. Manag. 2003, 180, 175–184. [Google Scholar] [CrossRef]
  45. Ogaya, R.; Penuelas, J. Contrasting foliar responses to drought in Quercus ilex and Phillyrea latifolia. Biol. Plant. 2006, 50, 373–382. [Google Scholar] [CrossRef]
  46. Porter, J. Evaluation of washing procedures for pollution analysis of Ailanthus altissima leaves. Environ. Pollut. Ser. B Chem. Phys. 1986, 12, 195–202. [Google Scholar] [CrossRef]
  47. Bates, D.; Maechler, M.; Bolker, B.; Walker, S. Fitting Linear Mixed-Effects Models Using lme4. J. Stat. Softw. 2015, 67, 1–48. [Google Scholar] [CrossRef]
  48. Kuznetsova, A.; Brockhoff, P.B.; Christensen, R.H.B. lmerTest Package: Tests in Linear Mixed Effects Models. J. Stat. Softw. 2017, 82, 1–26. [Google Scholar] [CrossRef] [Green Version]
  49. Bartoń, K. MuMIn: Multi-Model Inference. R Package Version 1.43.17. 2020. Available online: https://CRAN.R-project.org/package=MuMIn (accessed on 6 March 2021).
  50. Sardans, J.; Peñuelas, J.; Estiarte, M.; Prieto, P. Warming and drought alter C and N concentration, allocation and accumulation in a Mediterranean shrubland. Glob. Chang. Biol. 2008, 14, 2304–2316. [Google Scholar] [CrossRef] [Green Version]
  51. Sardans, J.; Peñuelas, J.; Ogaya, R. Drought-induced changes in C and N stoichiometry in a Quercus ilex Mediterranean forest. For. Sci. 2008, 54, 513–522. [Google Scholar]
  52. Sardans, J.; Peñuelas, J. Increasing drought decreases phosphorus availability in an evergreen Mediterranean forest. Plant Soil 2004, 267, 367–377. [Google Scholar] [CrossRef]
  53. Sardans, J.; Peñuelas, J. Drought changes phosphorus and potassium accumulation patterns in an evergreen Mediterranean forest. Funct. Ecol. 2007, 21, 191–201. [Google Scholar] [CrossRef]
  54. Sardans, J.; Peñuelas, J.; Prieto, P.; Estiarte, M. Drought and warming induced changes in P and K concentration and accumulation in plant biomass and soil in a Mediterranean shrubland. Plant Soil. 2008, 306, 261–271. [Google Scholar] [CrossRef]
  55. Sardans, J.; Peñuelas, J.; Ogaya, R. Drough’s impact on Ca, Fe, Mg, Mo and S concentration and accumulation patterns in the plants and soil of a Mediterranean evergreen Quercus ilex forest. Biogeochemistry 2008, 87, 49–69. [Google Scholar] [CrossRef]
  56. Sardans, J.; Peñuelas, J.; Prieto, P.; Estiarte, M. Changes in Ca, Fe, Mg, Mo, Na, and S content under warming and drought. J. Geophys. Res. 2008, 113, G03039. [Google Scholar] [CrossRef] [Green Version]
  57. Plett, D.C.; Ranathunge, K.; Melino, V.J.; Kuya, N.; Uga, Y.; Kronzucker, H.J. The intersection of nitrogen nutrition and water use in plants: New paths toward improved crop productivity. J. Exp. Bot. 2020, 71, 4452–4468. [Google Scholar] [CrossRef]
  58. Barak, P.; Jobe, B.O.; Krueger, A.R.; Peterson, L.A.; Laird, D.A. Effects of long-term soil acidification due to nitrogen fertilizer inputs in Wisconsin. Plant Soil 1997, 197, 61–69. [Google Scholar] [CrossRef]
  59. Lu, X.K.; Mao, Q.G.; Gilliam, F.S.; Luo, Y.Q.; Mo, J.M. Nitrogen deposition contributes to soil acidification in tropical ecosystems. Glob. Chang. Biol. 2014, 20, 3790–3801. [Google Scholar] [CrossRef] [PubMed]
  60. Lu, X.K.; Vitousek, P.M.; Mao, Q.G.; Gilliam, F.S.; Luo, Y.Q.; Zhou, G.Y.; Zou, X.; Bai, E.; Scanlon, T.M.; Hou, E.; et al. Plant acclimation to long-term high nitrogen deposition in an N-rich tropical forest. Proc. Natl. Acad. Sci. USA 2018, 115, 5187–5192. [Google Scholar] [CrossRef] [PubMed] [Green Version]
  61. Fairfax, J.; Lepp, N. Effect of simulated ‘acid rain’ on cation loss from leaves. Nature 1975, 255, 324–325. [Google Scholar] [CrossRef]
  62. Sardans, J.; Urbina, I.; Grau, O.; Asensio, L.; Ogaya, R.; Peñuelas, J. Long-term drought decreases ecosystem C and nutrient storage in a Mediterranean holm oak forest. Environ. Exp. Bot. 2020, 177, 104135. [Google Scholar] [CrossRef]
  63. Peñuelas, J.; Matamala, R. Changes in N and S Leaf Content, Stomatal Density and Specific Leaf Area of 14 Plant Species during the Last Three Centuries of CO2 Increase. J. Exp. Bot. 1990, 41, 1119–1124. [Google Scholar] [CrossRef]
  64. Mayor, X.; Rodà, F. Effects of irrigation and fertilization on stem diameter growth in a Mediterranean holm oak forest. For. Ecol. Manag. 1994, 68, 119–126. [Google Scholar] [CrossRef]
  65. Ogaya, R.; Peñuelas, J. Climate Change Effects in a Mediterranean Forest Following 21 Consecutive Years of Experimental Drought. Forests 2021, 12, 306. [Google Scholar] [CrossRef]
  66. Sardans, J.; Janssens, I.A.; Alonso, R.; Veresoglou, S.D.; Rillig, M.C.; Sanders, T.G.; Carnicer, J.; Filella, I.; Farré-Armengol, G.; Peñuelas, J. Biogeochemical niche of European forest trees. Glob. Ecol. Biogeogr. 2015, 24, 240–255. [Google Scholar] [CrossRef] [Green Version]
  67. Sardans, J.; Vallicrosa, H.; Zuccarini, P.; Farré-Armengol, G.; Fernández-Martínez, M.; Peguero, G.; Gargallo-Garriga, A.; Ciais, P.; Janssens, I.A.; Obersteiner, M.; et al. Empirical support for the biogeochemical niche hypothesis in forest trees. Nat. Ecol. Evol. 2021, 5, 184–194. [Google Scholar] [CrossRef] [PubMed]
  68. Capitanio, R.; Carcaillet, C. Post-fire Mediterranean vegetation dynamics and diversity: A discussion of succession models. For. Ecol. Manag. 2008, 255, 431–439. [Google Scholar] [CrossRef]
  69. Gratani, L.; Catoni, R.; Varone, L. Morphological, anatomical and physiological leaf traits of Q. ilex, P. latifolia, P. lentiscus, and M. communis and their response to Mediterranean climate stress factors. Bot. Stud. 2013, 54, 35. [Google Scholar] [CrossRef] [PubMed] [Green Version]
  70. Barbeta, A.; Mejía-Chang, M.; Ogaya, R.; Voltas, J.; Dawson, T.E.; Peñuelas, J. The combined effects of a long-term experimental drought and an extreme drought on the use of plant-water sources in a Mediterranean forest. Glob. Chang. Biol. 2015, 21, 1213–1225. [Google Scholar] [CrossRef] [PubMed] [Green Version]
  71. Martínez-Vilalta, J.; Prat, E.; Oliveras, I.; Piñol, J. Hydraulic properties of roots and stems of nine woody species from a Holm oak forest in NE Spain. Oecologia 2002, 133, 19–29. [Google Scholar] [CrossRef] [PubMed]
  72. Fusaro, L.; Mereu, S.; Brunetti, C.; Ferdinando, M.D.; Ferrini, F.; Manes, F.; Salvatori, E.; Marzuoli, R.; Gerosa, G.; Tattini, M. Photosynthetic performance and biochemical adjustments in two co-occurring Mediterranean evergreens, Quercus ilex and Arbutus unedo, differing in salt-exclusion ability. Funct. Plant Biol. 2014, 41, 391–400. [Google Scholar] [CrossRef] [PubMed] [Green Version]
  73. Hu, Y.; Burucs, Z.; Schmidhalter, U. Effects of foliar fertilization application on the growth and mineral nutrient content of maize seedlings under drought and salinity. Soil Sci. Plant Nutr. 2008, 54, 133–141. [Google Scholar] [CrossRef] [Green Version]
  74. Tramblay, Y.; Koutroulis, A.; Samaniego, L.; Vicente-Serrano, S.M.; Volaire, F.; Boone, A.; Le Page, M.; Llasat, M.C.; Albergel, C.; Burak, S.; et al. Challenges for drought assessment in the Mediterranean region under future climate scenarios. Earth-Sci. Rev. 2020, 210, 103348. [Google Scholar] [CrossRef]
Figure 1. Bagnouls-Gaussen ombrotermic diagram of mean climatic temperature (in red) and precipitation (in blue) by month in the study site. (a) Mean monthly data from 1975 to 2020. (b) Mean monthly data for 2014. (c) Mean monthly data for 2015.
Forests 12 00605 g001
Figure 2. Foliar elemental ratios and microelements statistically different between control and fertilized plots. (a) C:P % in dry weight in leaves. (b) N:P % in dry weight in leaves. (c) Cr mg/kg in dry weight in leaves. (d) Ni mg/kg in dry weight in leaves. Values are relatives to original values in 2014 expressed in % of change. * = Marginal significance (p = [0.05, 0.1]). *** = Significant differences (p < 0.05). Figures with standard errors.
Forests 12 00605 g002
Figure 3. Litter elemental composition, ratios, and microelements statistically different between control and fertilized plots. The showed elements are: (a) P % in litter. (b) C:P in litter. (c) N:P in litter (d) Ca mg/kg in litter. (e) Mn mg/kg in litter. (f) Fe mg/kg in litter. (g) Zn mg/kg in litter. (h) Sr mg/kg in litter. (i) Pb mg/kg in litter. Values are relatives to original values in 2014 and are expressed in % of change. * = Marginal significance (p = [0.05, 0.1]). *** = Significant differences (p < 0.05). Figures with standard error.
Forests 12 00605 g003
Figure 4. Microelements resorption efficiency % statistically different between control and fertilized plots. (a) Mg resorption efficiency. (b) Ca resorption efficiency. * = Marginal significance (p = [0.05, 0.1]). *** = Significant differences (p < 0.05). Figures with standard error.
Forests 12 00605 g004
Figure 5. Isotopes statistically different between control and fertilized plots. (a) Foliar tissue (b) Foliar-litter tissue. *** = Significant differences (p < 0.05). Figures with standard error. A. unedo and Q. ilex foliar δ15N are significantly different from litter δ15N.
Forests 12 00605 g005
Figure 6. GDA results representation of root 1 and 2. Vectors representing variables, and ellipses representing control and N-fertilized plots measurements. (a) Leaves data. (b) Litter data.
Forests 12 00605 g006
Figure 7. Foliar elemental composition; ratios and microelements (green); and litter elemental composition, ratios, and microelements (brown) by specie control plots data. Bars show the effect of drought through the values difference between 2015 and 2014. Values are relative to original values in 2014 so are expressed in % of change. *** = Significant differences from 0 according to t-test (p < 0.05). Figures with standard deviation.
Forests 12 00605 g007
Table 1. (a) Foliar variables effect in GDA analysis in leaves. (b) Foliar variables effect in GDA analysis in litter. Significant effects (p < 0.05) are highlighted in bold type.
(a) Leaves
TestWilks LambdaFp-Value
13C0.9532.670.023
15N0.74818.1<0.0001
N0.9890.6150.69
P0.9622.130.062
K0.9592.240.049
Mg0.9622.140.061
Ca0.9383.570.0038
Mn0.74218.7<0.0001
Fe0.9065.6<0.0001
Cu0.9463.10.0098
Zn0.9413.360.0058
season0.9411.660.087
(b) Litter
VariablesWilks LambdaFp-Value
13C0.9174.360.00081
15N0.65525.3<0.00001
N0.9482.650.023
P0.82710.1<0.00001
K0.8697.26<0.00001
Mg0.9592.070.07
Ca0.858.51<0.00001
Mn0.8429.04<0.00001
Fe0.9472.680.022
Cu0.9552.280.048
Zn0.9323.520.0043
season0.92.60.0045
Table 2. (a) Squared Mahalanobis distances between species-treatment in leaves. (b) Squared Mahalanobis distances between species-treatment in litter. AC = A. unedo control plot. PC = P. latifolia control plot. QC = Q. ilex control plot. AN = A. unedo N-fertilized plot. PN = P. latifolia N-fertilized plot. QN = Q. ilex N-fertilized plot.
(a) Leaves
PCACANQNPN
QCM = 3.83M = 3.08M = 4.40M = 2.96M = 4.21
F = 6.77F = 5.44F = 7.69F = 5.24F = 7.44
p < 0.0001p < 0.0001p < 0.0001p < 0.0001p < 0.0001
PC M = 1.03M = 1.37M = 6.27M = 1.76
F = 1.82F = 2.39F = 11.09F = 3.10
p = 0.041p = 0.0046p < 0.0001p = 0.0002
AC M = 1.29M = 6.28M = 2.31
F = 2.26F = 11.1F = 4.08
p = 0.0077p < 0.0001p < 0.0001
AN M = 5.28M = 1.75
F = 0.23F = 3.07
p < 0.0001p = 0.0003
QN M = 3.64
F = 6.43
p < 0.0001
(b) Litter
ACPCANQNPN
QCM = 2.62M = 3.41M = 4.09M = 5.9M = 4.03
F = 4.61F = 5.21F = 7.12F = 10.2F = 5.77
p < 0.000001p < 0.000001p < 0.000001p < 0.000001p < 0.000001
AC M = 3.63M = 3.57M = 6.50M = 7.25
F = 5.56F = 6.21F = 11.2F = 10.38
p < 0.000001p < 0.000001p < 0.000001p < 0.000001
PC M = 5.23M = 7.29M = 5.39
F = 7.93F = 10.9F = 6.89
p < 0.000001p < 0.000001p < 0.000001
AN M = 3.19M = 3.24
F = 5.44104F = 4.60059
p < 0.000001p < 0.000001
QN M = 2.551809
F = 3.60
p < 0.000001
Publisher’s Note: MDPI stays neutral with regard to jurisdictional claims in published maps and institutional affiliations.

