Article

30-Year Changes in Oak-Hornbeam Forest after Windthrow

by
Karolina Anna Gabrysiak
1,*,
Rafał Paluch
1 and
Radosław Gawryś
2
1
Department of Natural Forests, Forest Research Institute, Park Dyrekcyjny 6, 17-230 Białowieża, Poland
2
Department of Forest Ecology, Forest Research Institute, Sękocin Stary, Braci Leśnej 3, 05-090 Raszyn, Poland
*
Author to whom correspondence should be addressed.
Forests 2021, 12(5), 600; https://doi.org/10.3390/f12050600
Submission received: 21 March 2021 / Revised: 28 April 2021 / Accepted: 7 May 2021 / Published: 11 May 2021
(This article belongs to the Special Issue Long-Term Vegetation Dynamics and Forest Landscape Change)

Abstract

:
Hurricane winds are one of the most important abiotic factors in shaping the structure of the forest and the processes that occur in it. The aim of research was to determine regeneration processes and changes in the structure of forest stands caused by the windstorm in 1983. The research, based on stand tables from the years 1982, 1984, 1989 and 2014, was carried out on nine permanent research plots in the Białowieża Forest. The mean number of trees (MNT) taller than 1.30 m decreased by 13.7% after the windstorm. In 2014, MNT increased compared to 1984 (142%) and 1989 (53%). A significant decrease in the share of Picea abies (L.) H. Karst., thicker than 7 cm DBH and a significant increase in the share of Carpinus betulus L. was observed. Species richness for trees thicker than 7 cm DBH indicated a significantly lower species richness in 1982 and 1984 (12 species) compared to 1989 (14) and 2014 (16). The windstorm did not have a direct effect on the species richness, species composition of stands or the distinguished tree layers, except for trees thicker than 55 cm DBH. The observed changes in tree density in the lower layers of the stand prove that the regeneration process does not start immediately and continues even 30 years after the windstorm. Intermediate-severity windthrow accelerated natural changes in the stand structure.

1. Introduction

Strong winds breaking or uprooting trees are one of the most important abiotic factors with a huge impact on the initiation of changes in vegetation [1,2]. They are the main cause of live biomass loss in northern European forests [3]. Forests damaged by wind become susceptible to outbreaks of bark beetle (Ips typographus L.) and other engravers [3,4,5,6,7]. Strong winds also contribute to the formation of small and large gaps, semi-open and open areas [8,9]. Windthrow is all too often regarded as an exceptional, catastrophic phenomenon rather than a recurrent natural disturbance shaping the structure of forests [10].
Wind disturbance has been studied in temperate forest ecosystems, especially in North America [11,12,13,14]. Studies in Eastern Europe investigating this problem have focused mainly on mountain forests and poor habitats that cover the largest areas [2,7,15,16,17,18,19,20]. Studies investigating long-term transformations caused by windstorms are gaining a new meaning in the light of climate change. Moreover, information on the long-term impact of various disturbances can help in understanding changes in tree abundance and the development of understory vegetation after disturbance [2].
The Białowieża Forest is a specific natural forest unique in Europe and the world [21,22,23]. It is one of the very few lowland forest complexes on European Plain, where substantial fragments of close-to-primeval forest have been preserved until our times [24]. The BF forests show many features typical of natural forests, with a high ecosystem integrity, and large parts of it are still shaped by natural disturbances [23]. The presence of many species of insects, for whom the BF is one of a few or even the only site in Central Europe [21], has been observed. The whole of the Białowieża Forest (Polish and Belarusian parts) is listed as a UNESCO cross-border World Heritage Site. The most important reason for recognizing the exceptional character of this area was the very good preservation of natural processes, including previous disturbances such as windstorms and insect outbreaks and their natural effects. The processes and factors shaping this unique ecosystem have been widely discussed in the literature [25,26,27,28,29,30]. Due to unique degree of naturalness, this forest is used as a benchmark by conservation science and modern forestry, and plays a role of a living laboratory for ecological, forestry and evolutionary sciences [24].
The first information about windstorms in the Białowieża Forest in 1924 and 1928 was reported by Paczoski [31]. Other destructive storms took place in 1983 [32] and 2016. The aim of the present study was to determine changes in the structure of forest stands caused by the windstorm in winter 1983 and further regeneration processes.

2. Materials and Methods

The Białowieża Forest is a woodland area covering a total of 1250 km2 (within its historical boundaries). It is situated on both sides of the state border between Poland and Belarus (52.74 N; 23.87 E). In March 1983 the Białowieża Forest was hit by an exceptionally strong windstorm. It was impossible to determine the wind velocity because the Wilda anemometer installed at the weather station in Białowieża was designed only for the measurement of wind up to 20 m/s [32]. However, the power of the windstorm can be inferred from the fact that between March 1983 and December 1984, about 420,000 m3 of timber was harvested from windsnaps and windthrows in Białowieża Forest [33].
Permanent study plots in the Białowieża Forest were established in 1983 in patches of over 100 years old, mature stands damaged by the windstorm of 1983 [32]. All study plots were located in protected areas, excluded from forest management (Białowieża National Park or nature reserves). The size of a single study plot was 0.25 ha (square with a side of 50 m).This study presents data for 9 permanently marked study plots located in forest habitats. All study plots were located in forests classified as oak-hornbeam forest Tilio-Carpinetum Tracz. 1962. The exact coordinates of the study plots, degree of stand damage (DD) and the volume of trees before windthrow are presented in Table 1. In 1984, DD was defined as the percentage of volume of trees from 1982 which died as a result of the hurricane. In late 1983 and early 1984 a survey of standing trees taller than 1.3 m was conducted, including measurement of the basal area, and trees and shrubs shorter than 1.3 m were counted (data for 1984). Windsnaps and windthrows were also surveyed, which allowed for the reconstruction of the forest structure before the windstorm (data for 1982), except for trees and shrubs shorter than 1.3 m. Further measurements were taken in 1989 and 2014.
Trees on study plots were assigned to 5 classes: Class 0: seedlings and saplings shorter than 1.3 m, Class I: understory (advanced regeneration) with diameter at breast height (DBH) < 7 cm, Class II: trees from lower stories (story 3) with DBH 7–21 cm, Class III: trees in the canopy with DBH 21–55 cm, Class IV: the tallest emergent trees with DBH > 55 cm. The tree density per ha was determined for each class, and the basal area (BA) was calculated for each survey year for classes I–IV. Based on the number of trees of individual species, the frequency of individual species was calculated in each survey year and for all tree thickness classes.
The normality of data distribution was verified with the Shapiro–Wilk test, and the homogeneity of variance with the Levene test. Non-parametric tests were used due to numerous deviations from normality and homogeneity of data distribution. Variables were compared using the Friedman rank test and homogeneous groups were determined using the post-hoc Nemenyi test. The relationships between variables in each survey year were determined based on the Spearman correlation coefficient.
Statistical calculations were performed using R software [34]: a Shapiro–Wilk test and a Friedman test, and a Spearman’s rank correlation coefficient in the “stats” package, and the post-hoc Friedman test in the “PMCMR” package [35], and Levene’s test in the “car” package [36]. Rarefactions were performed using the iNEXT package [37] and non-metric multidimensional scaling (NMDS) was performed using the “vegan” package [38]. NMDS is commonly regarded as the most robust unconstrained ordination method in community ecology [39] and it may visualize all of the variance between the different states along only two axes [40]. The purpose of using NMDS was to visualize how each class relates to every other class and to define the correlation between distinguished categories and selected variables, which are displayed as vectors on the resulting bi-plot. The fitted vectors are arrows. The direction of the vector shows of most rapid change in the variable. The length of the arrow is proportional to the correlation between ordination and variable [41]. The number of occurrences of individuals of a tree species in each year and classes of trees was used to illustrate the similarity between classes. MetaMDS function used performs a double standardization of the raw data according to Wisconsin. Choice Bray–Curtis dissimilarity index. The maximum number of random starts was set to 20. The goodness-of-fit statistic is the stress value. The lower the value the better, the value 0.2 can still lead to a useful picture [42].

3. Results

3.1. Changes in the Density and Basal Area (BA) of Tree Stands

The mean number of trees taller than 1.3 m decreased by 13.7% after the windstorm (Table 2), but the difference was not statistically significant. 48% of damaged trees represented class II (this accounted for 20% of class II trees in 1982), and another 35% represented class III (23% of class III trees growing before the windstorm). The windstorm affected 6% of class IV trees, and 20% of trees from this class surveyed in 1982 died.
In 2014 the mean number of trees increased compared to 1984 (142%) and 1989 (53%) (Table 2). The number of class 0 trees was higher in 1989 and 2014 compared to 1984. The number of class I trees was higher in 2014 than in 1984 and 1989. There were no significant changes in the number of class II trees. The windstorm was associated with a 23% reduction in the number of class III trees between 1982 and 1984. The number of class IV trees reduced in comparison to 1982 by 26% (1984) and 32% (1989).
There were significant differences in the total BA between 1982, and 1984 and 1989 (Table 3). However, BA in 2014 did not differ significantly for that measured before the windstorm (1982). There were significant differences in BA for class II between 1984 and 2014. After the windstorm BA for class III reduced significantly between 1982 and 1984. In subsequent years BA for this class did not differ from BA calculated for 1982 or 1984. BA for class IV also reduced significantly between 1982 and 1984.

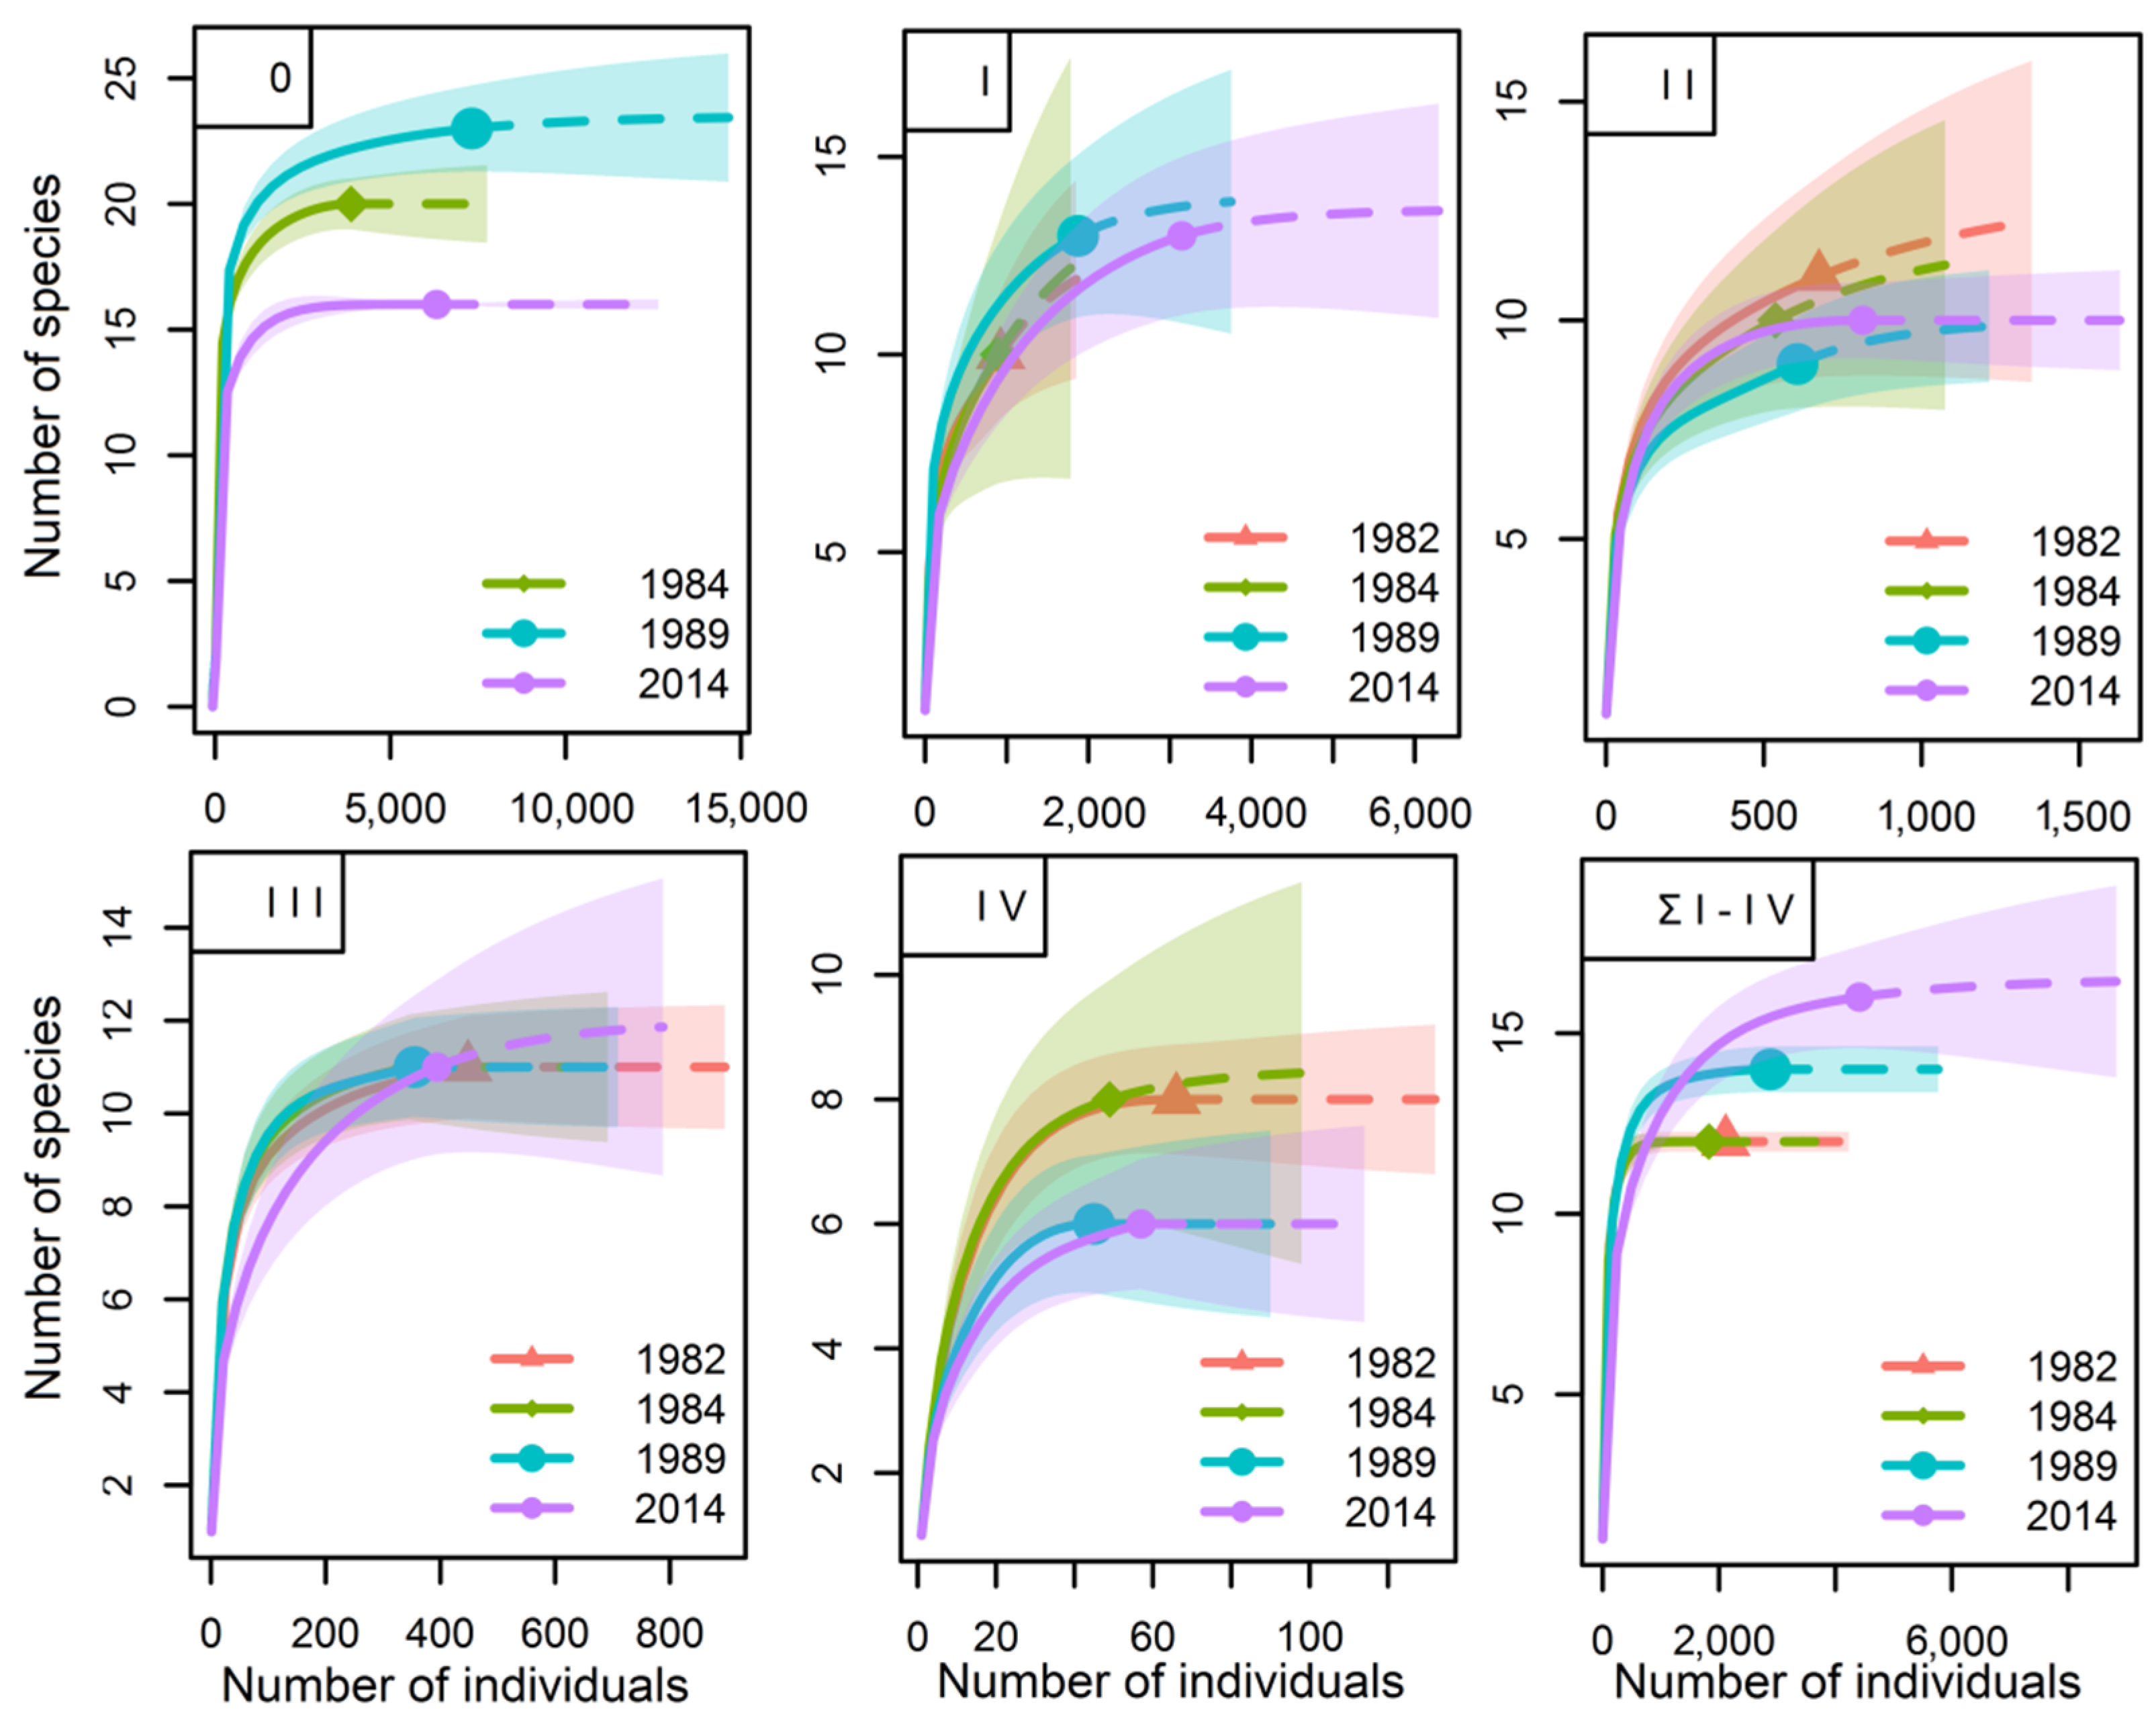
3.2. Species Richnessand Species Diversity

Species richness estimated for all 9 study plots was highest in class 0 (23 species in 1989), and lowest in class IV (6 species in 1989 and 2014) (Figure 1). Species richness in class 0 was significantly lower in 2014 (16 species) compared to 1989 (23) or 1984 (20). In class I there were 10 species in 1982 and 1984, and 13 species in 1989 and 2014. Differences in this class were not significant, and plotted curves suggested the potential increase in species richness following an increase in the number (density) of trees. There were no significant differences in classes II, III and IV. Global analysis for classes I-IV indicated a significantly lower species richness in 1982 and 1984 (12 species) compared to 1989 (14) and 2014 (16).

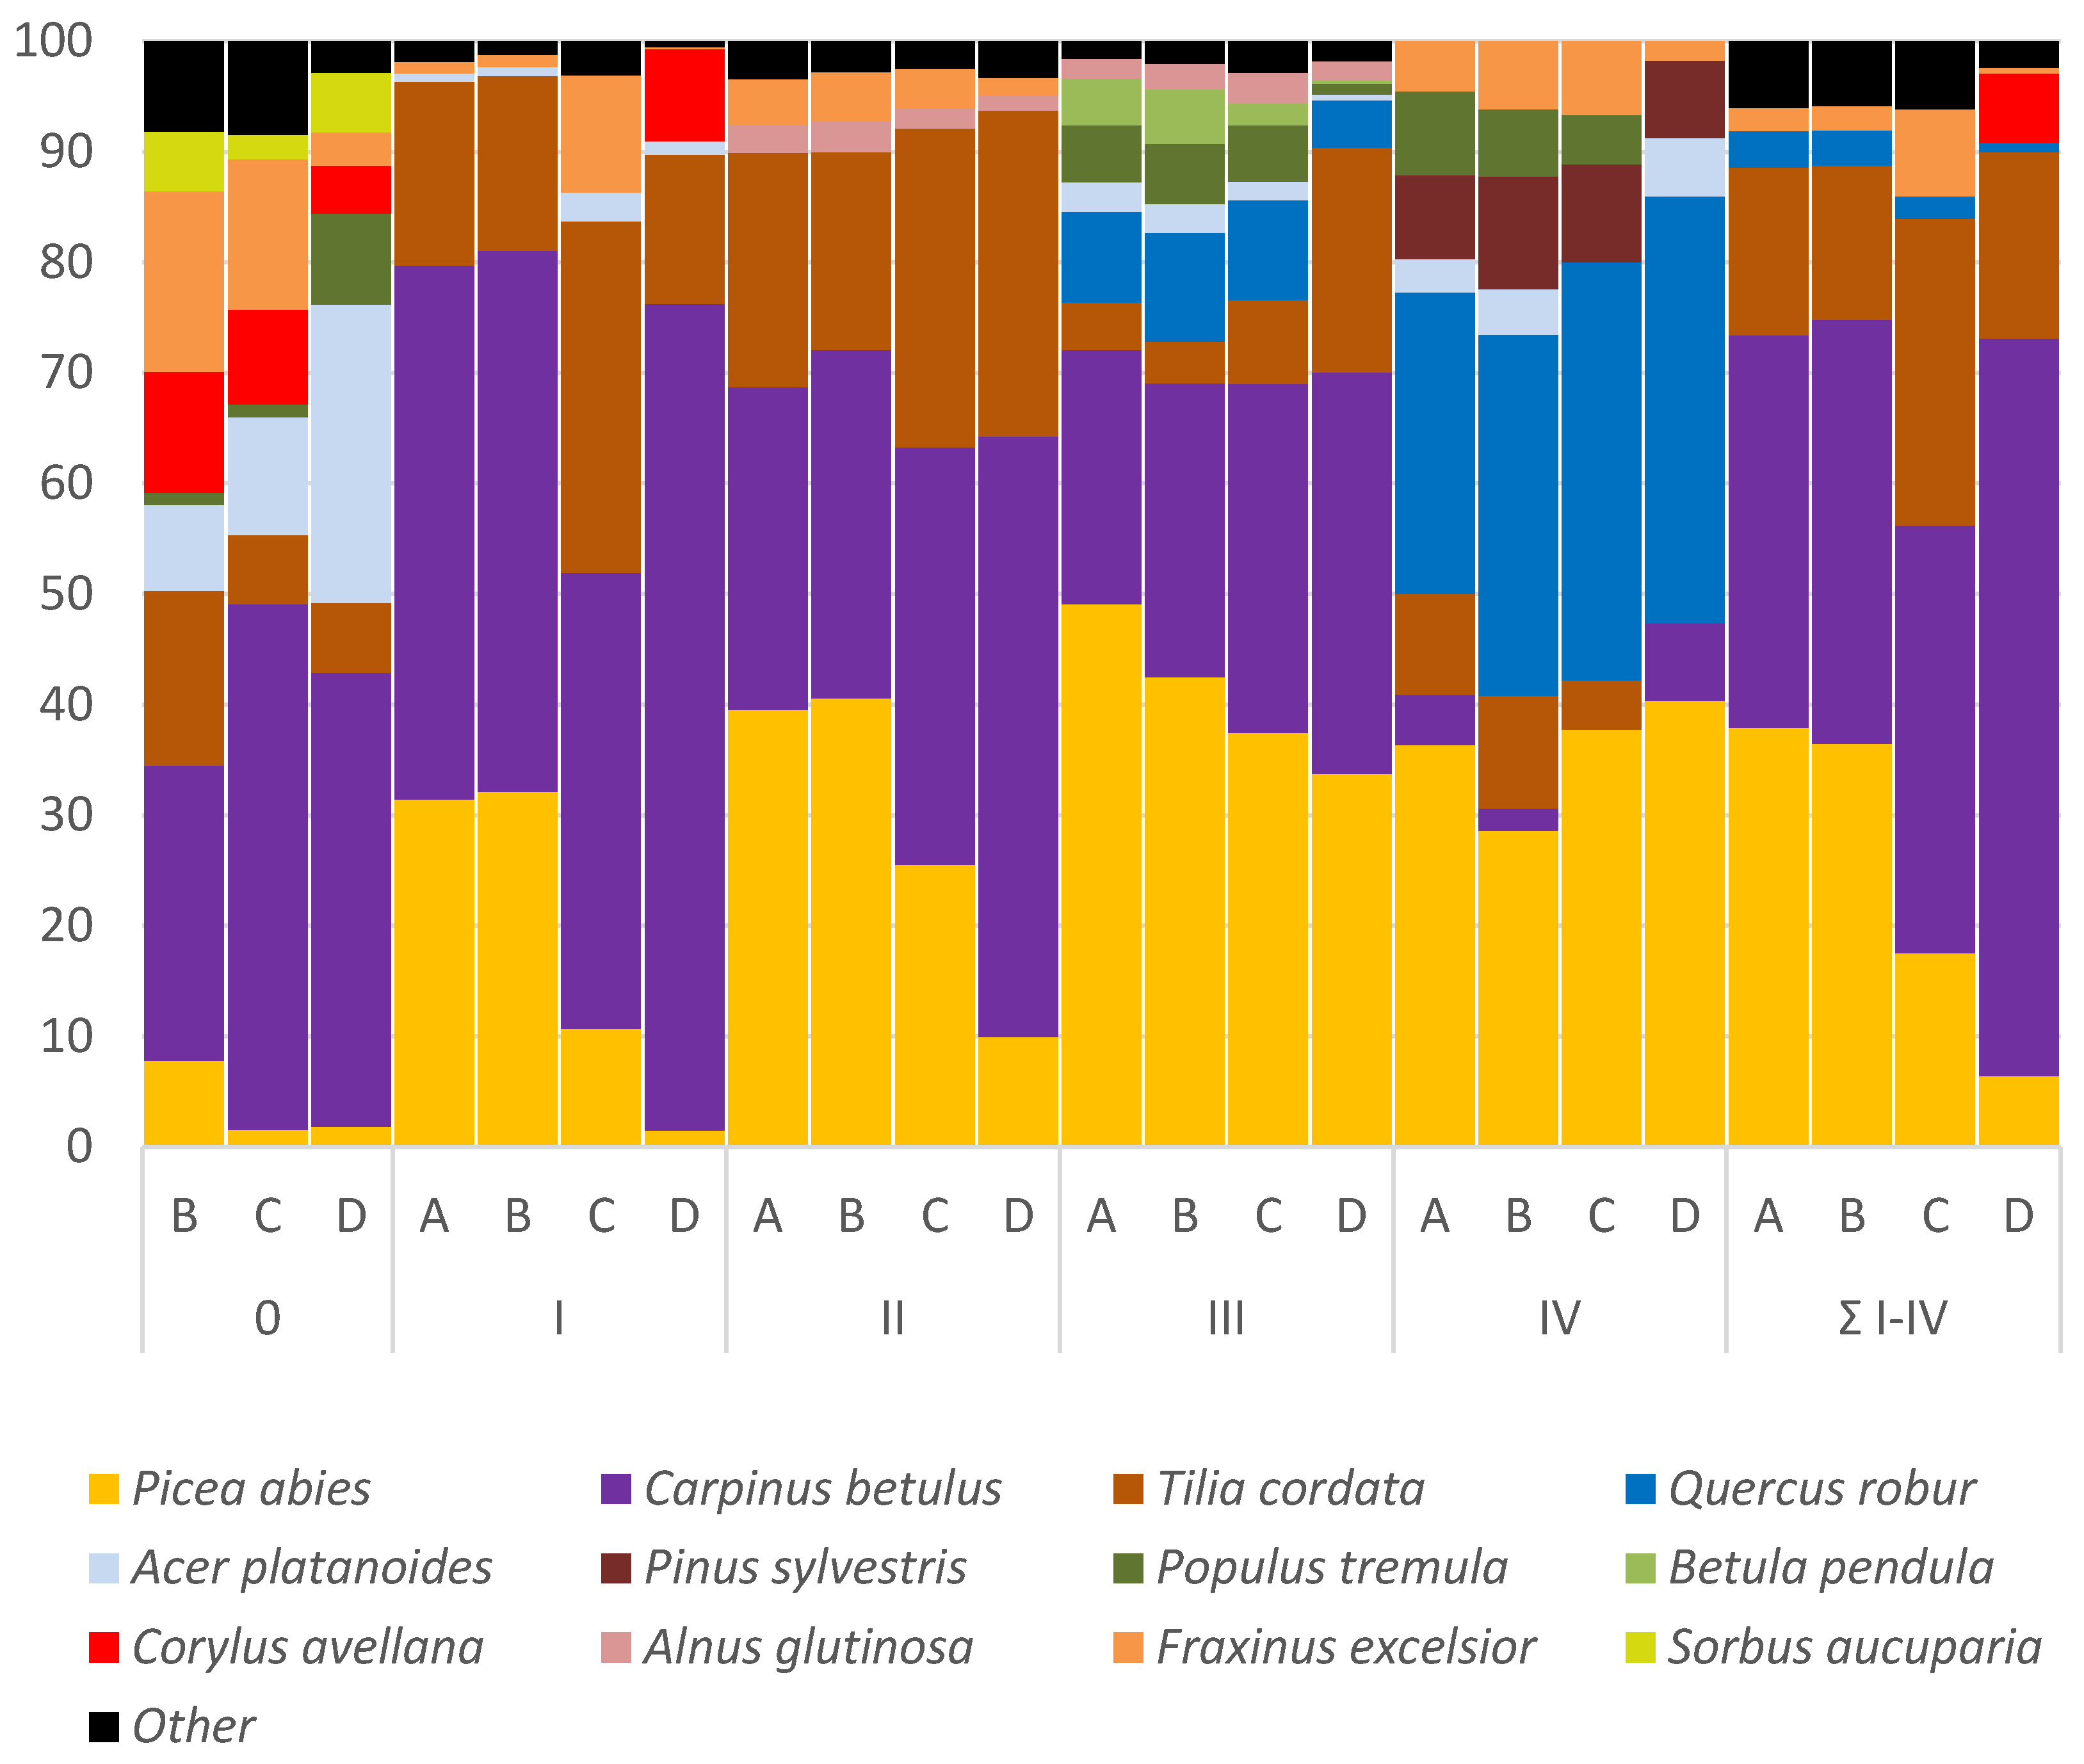
3.3. Species Composition

The rates of trees damaged by windstorm were 47% for Picea abies (L.) H. Karst., 23% for Tilia cordata Mill., and 18% for Carpinus betulus L. Other species (Betula pendula Roth, Quercus robur L., Sorbus aucuparia L., Fraxinus excelsior L., Acer platanoides L., Alnus glutinosa (L.) Gaertn., Populus tremula L., Ulmus glabra Huds.) accounted for not more than 5% of damaged trees. Before the windstorm the analysed stands were mainly formed by P. abies, C. betulus and T. cordata (Figure 2). Class IV trees included a large share of Q. robur (27.3%) and pioneer species (Pinus sylvestris L., P. tremula). Pinus sylvestris L. and P. tremula were found on 2 out of 9 study plots. Species composition of class IV did not change significantly between years, except for a significant change in the share of P. abies (post-hoc test non-significant, p > 0.1).
Before the windstorm class III trees included a considerable admixture of Q. robur (8.3%) and B. pendula (4.2%) (Figure 2). Major changes in this class consisted in the decreasing share of P. abies to 33.8% with a simultaneous increase in the share of C. betulus to 36.3% and T. cordata to 20.3%. The share of C. betulus increased significantly in 1989 and 2014 compared to 1982. The increase in the share of T. cordata was also significant, but it was not possible to identify homogeneous groups with the post-hoc test. Class III also included species with a share lower than 2.5%: F. excelsior, U. glabra (1982, 1984, 1989); P. sylvestris (1982, 1984, 1989); and Salix caprea L. (2014).
The share of P. abies in class II trees reduced significantly (to 10%) between 1982 and 2014 (Figure 2). Changes in the share of this species were also significant between 1984 and 1989 or 2014. The share of C. betulus increased significantly between 2014 (54.3%), and 1982 (29.2%) and 1984 (31.5%). Class II also included species with a share lower than 2.5%: P. tremula, U. glabra (all survey years), Q. robur (1982, 1984, 1989); A. platanoides (1982, 1989, 2014), B. pendula, S. aucuparia (1982, 1984); Corylus avellana L., and S. caprea (2014).
The share of P. abies in class I reduced significantly (chi-squared = 19.88, p ≤ 0.001) to 1.5% in 2014 (Figure 2). There was a significant change between 2014 and 1982 (p = 0.018) and 1984 (p = 0.001). In 2014 the survey revealed the presence of C. avellana (8.4% share), previously not recorded in this class. Class I also included species with a share lower than 2.5%: A. glutinosa, P. tremula, S. aucuparia, U. glabra (all survey years); Q. robur (1984, 1989, 2014); B. pendula, Malus sylvestris (L.) Mill. (1989, 2014); S. caprea (1989); Pyrus communis L. (2014).
It was impossible to reconstruct the structure and density of class 0 for the year preceding the windstorm. In 1984 this class consisted of regenerating C. betulus (26.7%), F. excelsior (16.3%), and T. cordata (15.8%) (Figure 2). There was also an abundant admixture of C. avellana (11%), P. abies (7.8%), A. platanoides (7.7%), and S. aucuparia (5.4%). The share of C. betulus increased significantly to 41.1% (chi-squared = 6.22, p = 0.045), and the change was significant between 1984 and 2014 (p = 0.048). There was also a drop in the share of regenerating P. abies to 1.8%. In class 0 P. tremula was identified in all survey years. A. platanoides was regenerating abundantly (27% in 2014). The regeneration of Q. robur was very low (<2%). Class 0 also included species with a share lower than 2.5%: Daphne mezereum L., Euonymus verrucosus Scop., M. sylvestris, U. glabra (all survey years); A. glutinosae, Rhamnus catharticus L., Ribes nigrum L., Salix cinerea L. (1984 and 1989); P. communis (1984 and 2014); Frangula alnus Mill. (1989 and 2014); Euonymus europaeus L., P. sylvestris (1984); B. pendula, Juniperus communis L., S. caprea, Salix myrsinifolia Salisb., Sambucus racemosa L. (1989); Sambucus nigra L. (2014).
P. abies was a constant component of the analyzed stands, but the share of trees of this species with DBH > 7 cm decreased significantly (chi-squared = 19.00, p < 0.001). The share of this species in 2014 differed significantly from the share in 1982 (p = 0.018) and 1984 (p = 0.001). Before the windstorm specimens of C. betulus with DBH > 7 cm were found in 8 out of 9 study plots. In 1989 and 2014 they were present on all study plots. The share of C. betulus class II–IV increased significantly both in terms of the number of trees (chi-squared = 13.85, p = 0.003), and BA (chi-squared = 15.80, p = 0.001). The change in the number was significant between 2014 and 1982 (p = 0.004) and 1984 (p = 0.024), and the change in BA was significant between 1982 and 1989 (p = 0.004) and 2014 (p = 0.008). For trees with DBH > 7 cm there was a significant change in the share of C. betulus, both in the number of trees (chi-squared = 8.76, p =0.033) and BA (chi-squared = 12.60, p = 0.006).

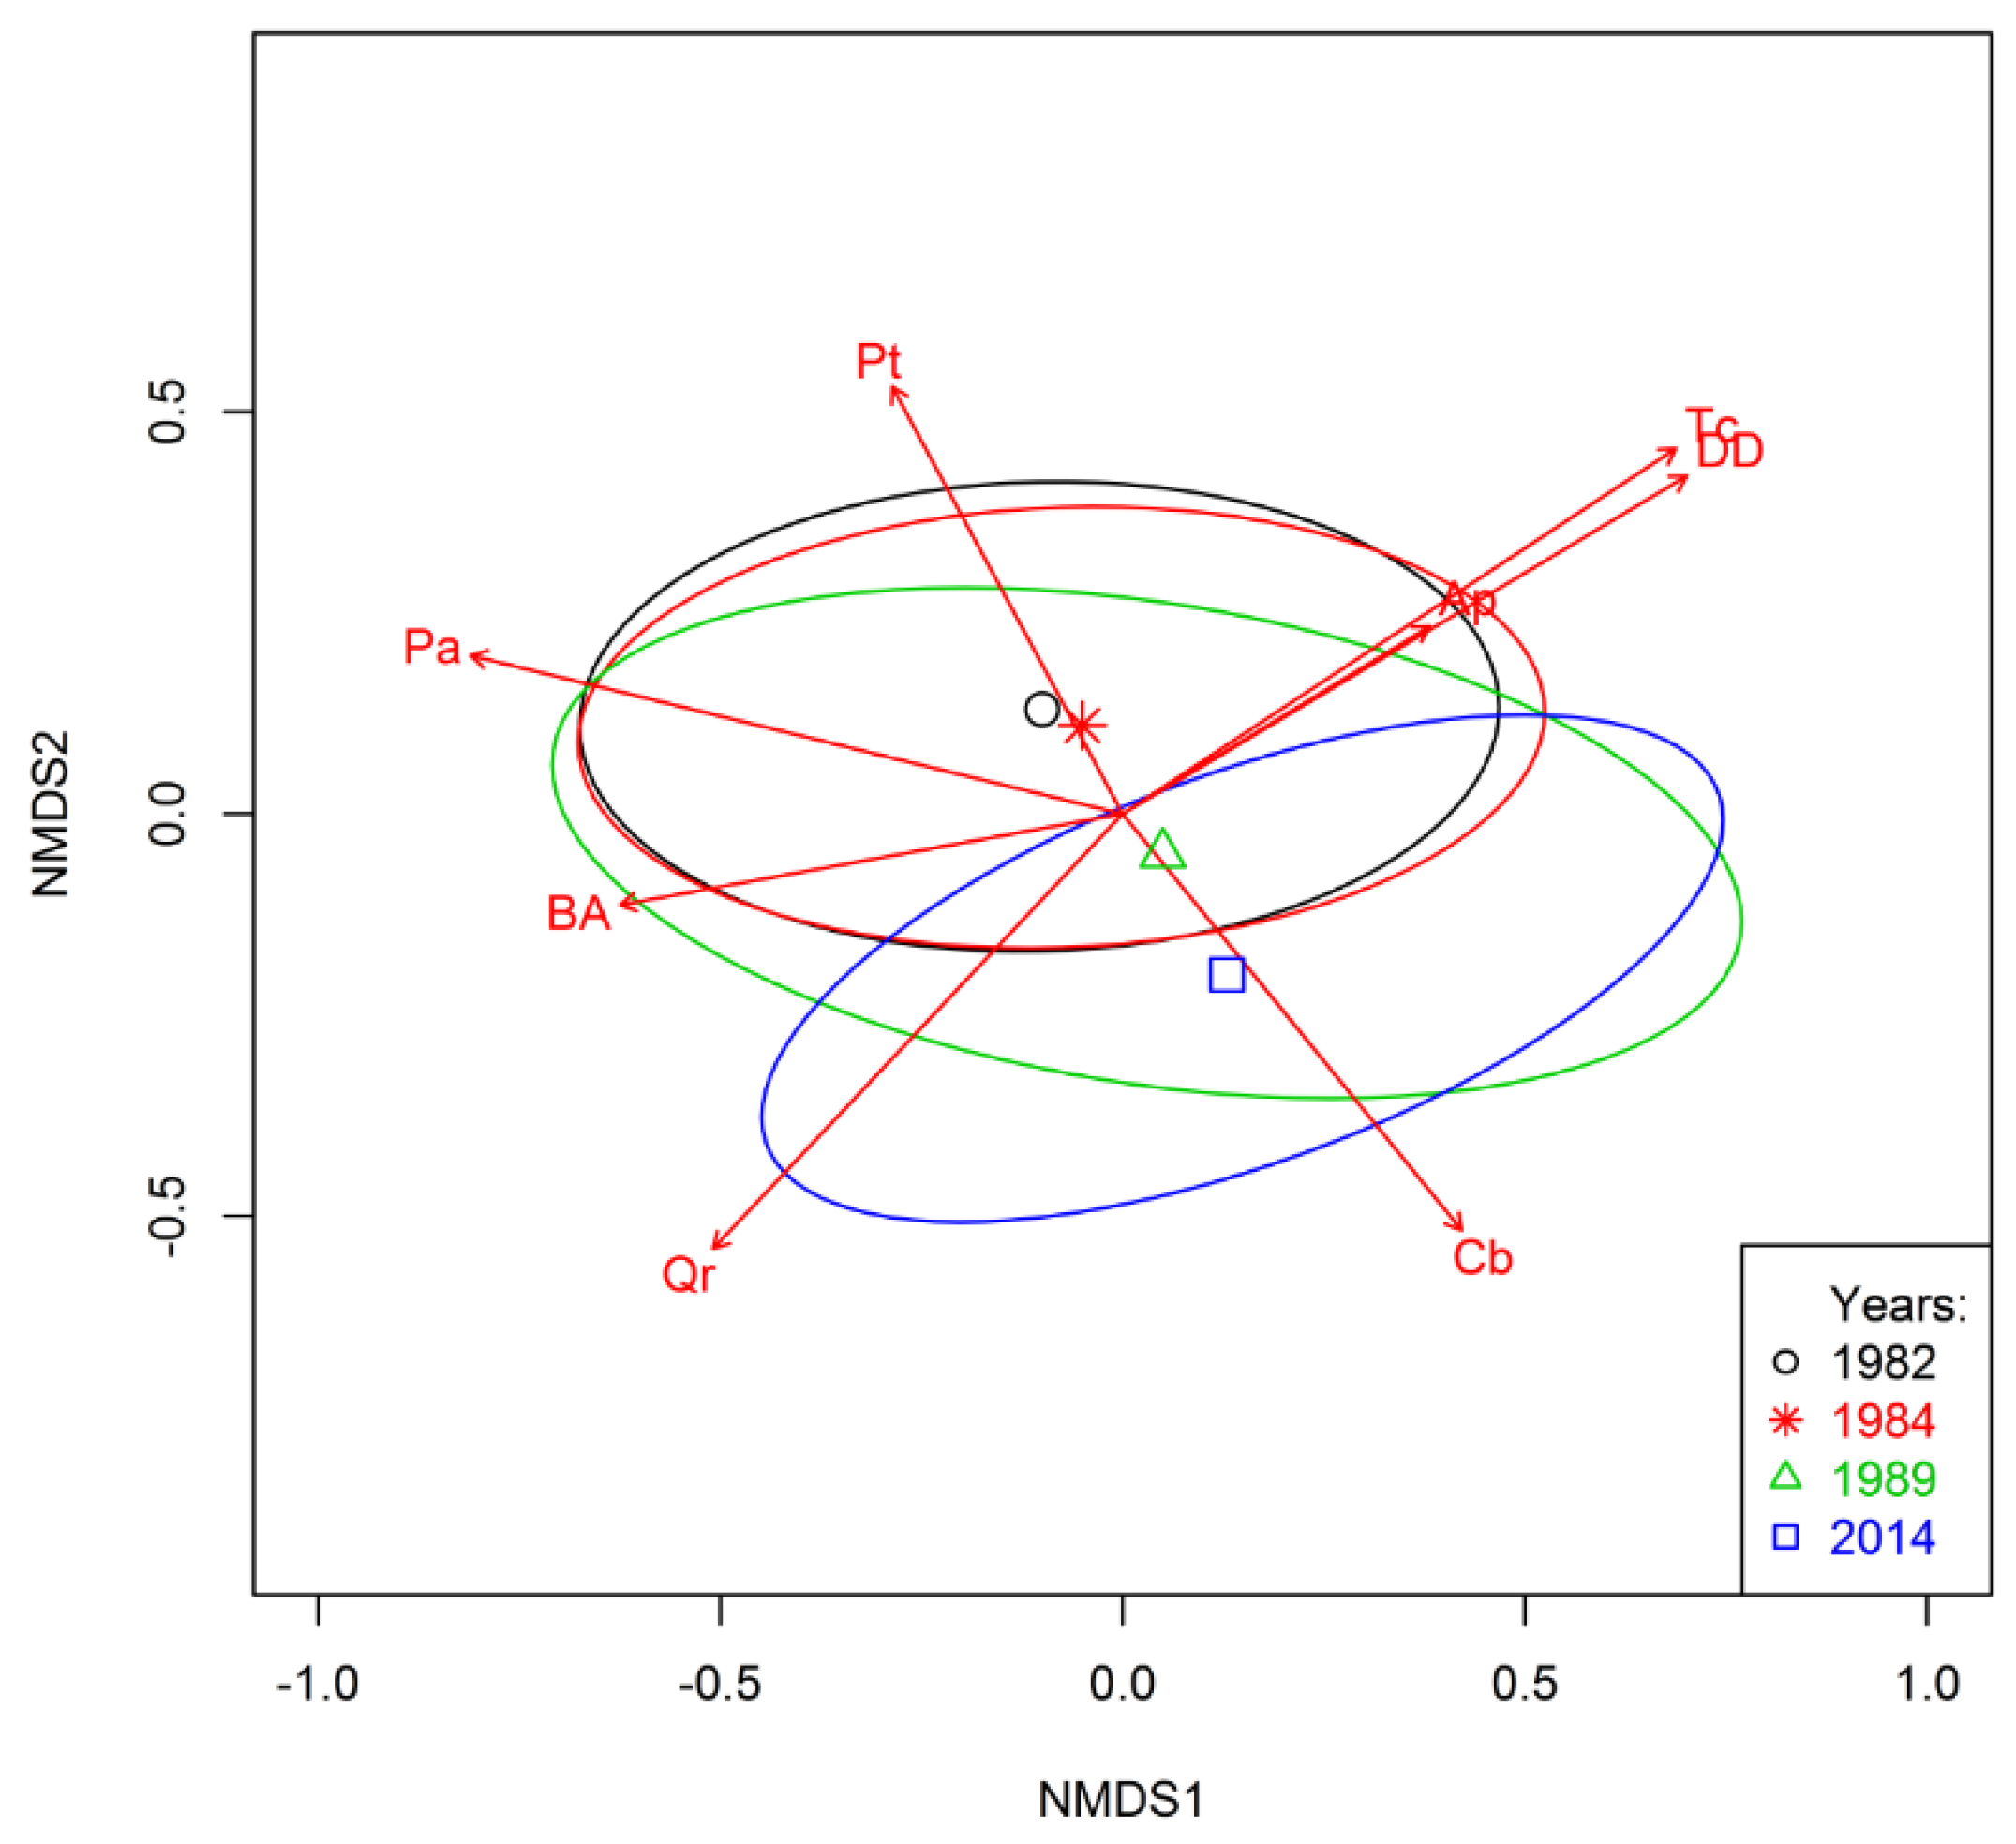
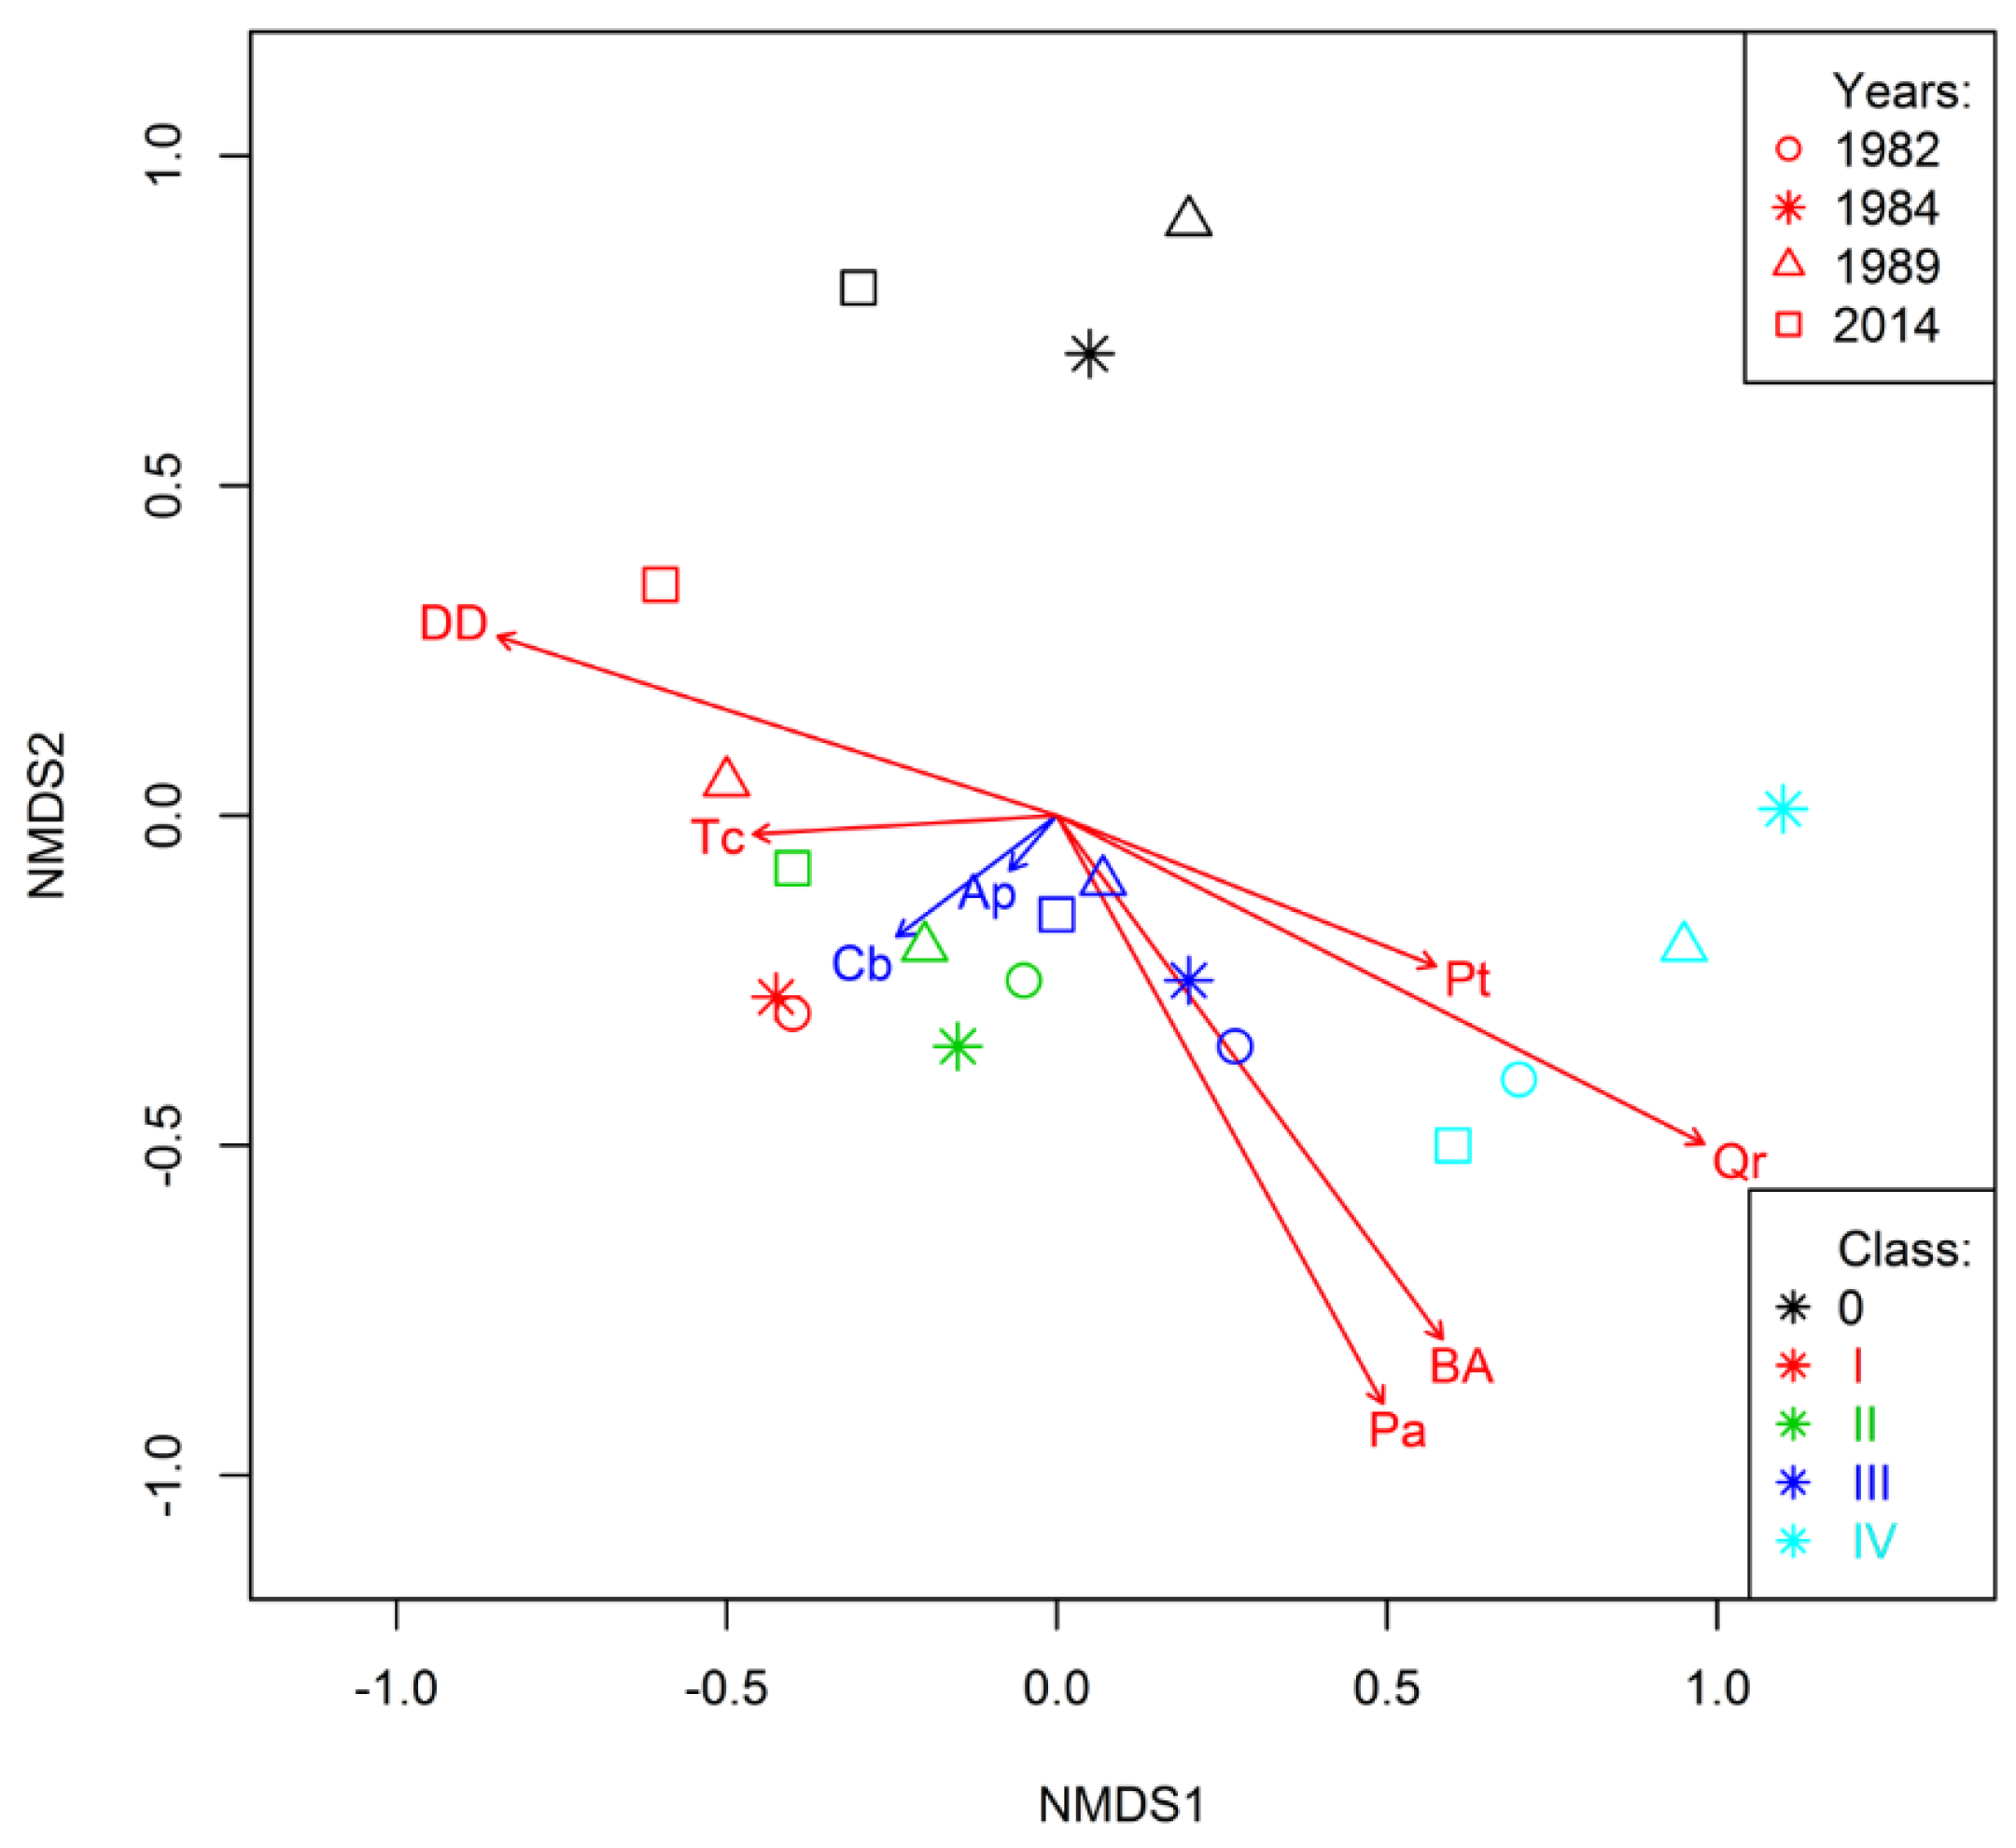
3.4. Trends Shaping Changes on Study Plots

The difference between the centroids representing study plots for 1982 and 1984 was the smallest (Figure 3). After 30 years the basal area of C. betulus increased while basal area of P. tremula decreased. The trend of changes in the position of centroids was independent from the degree of damage and total BA. The pace of changes between 1989 and 2014 was much slower than between 1984 and 1989.
Class 0 had a very distinct species composition (Figure 4). It was characterised by a high share of admixture species, such as C. avellana, M. silvatica, S. aucuparia and Salix sp. Between 1989 and 2014, the share of BA of Q. robur decreased in this class. In class I the total BA, BA of P. abies and BA of Q. robur decreased. Class I tended towards class 0 in terms of species composition. The position of centroids for class II before and after the windstorm was similar, and only in subsequent years changes similar to class I take place. In class III changes were similar to those in lower classes but on a smaller scale, and the position of the 2014 class III centroid was similar to the position of 1982 and 1984 class II centroids. Class IV was characterized by a relatively high dissimilarity of species composition (high abundance of light-seeded species and Q. robur) and, above all, minor changes in the position of centroids with respect to the total BA, BA of Q. robur and BA of P. abies. The species composition of the higher classes become similar over time to that for the lower classes. The windstorm caused the most significant changes in class IV. The degree of damage to the stand was negatively correlated with the total BA and BA of Q. robur, P. tremula and P. abies. The pace of changes after the windstorm was fastest between 1984 and 1989.
The degree of stand damage was very strongly and significantly correlated with the Bray–Curtis dissimilarity of species composition for all classes I–IV (r = 0.94 p = 0.001), class II, (r = 0.9 p = 0.001), class III (r = 0.96 p = 0.0001) and class IV (r = 0.95 p = 0.001) between 1982 and 1989, and moderately correlated for class I (r = 0.69 p = 0.01). DD was also very strongly correlated with the Bray–Curtis dissimilarity for all classes I-IV (r = 0.91, p = 0.01), class III (r = 0.89, p < 0.001) and IV (r = 0.93, p = < 0.001) between 1982 and 1989 and class IV (r = 0.77, p = 0.001) between 1982 and 2014.

4. Discussion

The 1983 windstorm did not have a direct effect on the species richness, the general species composition of stands, or the distinguished tree layers, except for class IV trees. In this class, the mean share of species before and after the windstorm remained unchanged. However, not all species were affected to the same extent on individual study plots. Changes in class IV were associated with the small number of trees in this class, with only a few trees per study plot, and the absence of species with 100% frequency. The most common species was P. abies, and the number of its individuals ranged from 1 to 9. In such circumstances, the removal of just a single tree can cause significant changes in the species composition. Nevertheless, the results show that the thickest trees are most susceptible to damage, regardless of species. The thickest trees are also the tallest, which makes them the most exposed to strong wind [10,13,15]. In class III, in contrast to class IV, the species composition did not change, and damage was most serious in the species that had the highest frequency. The thickest trees shelter the lower layers of the stand. On the other hand, lower layers of the stand may be damaged by taller blowdown trees. This is implied by the high proportion of class II and III trees damaged by the windstorm. On the other hand, the low proportion of damaged class I trees (11%) may be associated with the greater resilience of young trees, which could resist the fall of thicker trees and avoid snapping. Moreover, the number of juvenile trees from this class is high but the projection area of their canopies is relatively small, which reduces the probability of their damage. Regenerating trees are also short and protected from damage by taller ones. A significantly higher species diversity was reported by Peterson [43] 10 years after the hurricane in northwest Connecticut, USA. However, this hurricane was much stronger than the 1983 windstorm in the Białowieża Forest and caused much greater damage to the stand. Although in the discussed results the species diversity was stable, a positive correlation was found between the increase in the entropy of the species structure and the increase in the degree of damage to the stand. The 1982 windstorm led to the removal of only 14% of trees, and damaged 20%–26% of class II–IV trees growing in the forest in 1982. Furthermore, this wind disturbance cannot be compared to windstorms that affected large areas of Poland in 2002 or 2017 and which dramatically transformed both vegetation and landscape [16,17,18]. Nevertheless, local windstorms of moderate power causing the blowdown of single trees can influence forest structure in the long-term perspective and relatively quickly adjust it to the changing environmental conditions without causing a complete destruction that would initiate succession. Transformation of the stand begins with opening of numerous gaps [19] or initiation of the gap formation process that involves damage to branches or roots etc., further leading to the death of trees, e.g., due to outbreaks of bark beetle, which attacks weaker trees and kills them [3,5,7]. Small gaps provide conditions promoting the growth of underwood or initiate regeneration in sites where light availability used to be insufficient. Because of limited space, these gaps are sites for the regeneration of species typical of an oak-hornbeam forest. Moreover, the absence of sudden changes in the structure of the stand promotes the stability of the species composition in the ground cover [44].
The low intensity of disturbance is also evidenced by the low frequency of light-seeded species (early-successional, pioneering) in classes 0 and I, such as B. pendula and P. tremula, which generally prefer other habitats or emerge after fire [45,46]. A similar low proportion of regenerating tree species with low tolerance to shade after windthrow was reported by Meigs and Keeton [1], who investigated mixed hardwood-conifer forest sites in the north-eastern United States, and Szwagrzyk et al. [20] in mixed deciduous forests in Roztocze National Park. P. silvestris, present in class IV, is also a remnant of the historical methods of forest use, such as bee-keeping and the frequent fires associated with it, regularly triggered in the Białowieża Forest at the beginning of the 20th century [27] and promoting the regeneration of this species. The absence of regenerating P. silvestris at the present time results from changes in habitat conditions that followed the abandonment of many forms of forest management in the second half of the 20th century, including livestock grazing [47].
The observed changes in tree density in the lower layers of the stand prove that the regeneration process does not start immediately, but the response to disturbance is delayed, stretched over time and continues even 30 years after the windstorm. Therefore, the regeneration pace differs from that observed in the large areas affected by windbreak cf. [18]. The number of trees in classes II and III is increasing systematically and most probably it has not yet reached the maximum level. Time is needed for the development of a new generation of trees that now have better access to light and space. The windstorm reduced differences in the species composition of class II, causing the drop out of admixture trees from the stands and limiting the number of trees of dominant species. Moreover, the higher layers of the stand became more homogeneous 30 years after the windstorm because of the nature of regenerating vegetation that formed after this disturbance. In recent years, the species composition of seedlings and saplings on fertile oak-hornbeam habitats has become more homogeneous, and some species do not regenerate at all [48,49]. The absence of regenerating Q. robur in unmanaged natural forests is a frequently discussed problem [50,51], and regenerating Q. robur was also rarely found on the plots analyzed in our study. Bobiec [52] claimed that on more fertile sites in deciduous forests, areas with a high density of Q. robur are associated with various types of local human-induced disturbances and the subsequent response of natural processes. A significant share of A. platanoides in the regenerating plant cover and its low frequency in higher classes of stands is also commonly observed.
In the stands analyzed in this study, we found a decreasing abundance of P. abies, which suffered the strongest effect of the windstorm. P. abies was a constant component of the analyzed stands, but the abundance of trees with DBH > 7 cm decreased significantly. P. abies accounted for 47% of trees that died after the windstorm, which is 17% of trees of this species in the stand before the wind disturbance. The number of P. abies dropped significantly not earlier than after 1984, which may indicate that the spruce bark beetle outbreak had a greater impact on the dynamics of this tree species than the windstorm. The number of P. abies seedlings and saplings has also decreased over the years. This may indicate deteriorating conditions for the regeneration of this species in the stand. Similar trends have been observed in other stands of the Białowieża Forest [48,49]. After being weakened by summer drought, P. abies trees become susceptible to large-scale colonization by wood-boring insects. When attacked by the spruce bark beetle, they die back and are replaced by deciduous tree species better adapted to the existing habitat conditions [53].
The gaps left by P. abies are filled by C. betulus and T. cordata [48]. It could have been expected that species with a higher demand for light, such as P. tremula, P. silvestris, and Q. robur, would benefit more from the increased availability of light caused by a strong thinning of the stand. However, this did not happen on the sites analysed in our study. This effect seems to provide evidence for the successful life strategy represented by C. betulus and T. cordata, which are able to create a permanent bank of naturally regenerating seedlings and saplings under the canopy of relatively dense stands [20,54]. When disturbance occurs and the canopy opens, these species are already present on the forest floor, which gives them a competitive advantage over more light-demanding species that can only regenerate after this point. Peterson [43] concluded that a significant change in the structure of the canopy is only possible if regenerating seedlings and saplings present before the windstorm have a different species composition compared to the higher layers of the stand. The constantly growing share of C. betulus in the structure of stands and regenerating seedlings and saplings observed in our study is a common phenomenon in the analyzed area. T. cordata also benefited from the windstorm and maintained its position despite the expansion of C. betulus, although a decline in the share of this species in classes 0 and I was recorded in 2014. In general, changes that occurred due to the windstorm at the “level” of individual species are consistent with findings from long-term studies carried out in Białowieża National Park [48,49,55,56,57,58], as well as in nature reserves of the Białowieża Forest and other protected areas in north-eastern Poland [59,60].

5. Conclusions

Intermediate-severity windthrows can result in advanced regeneration without recruiting a cohort of pioneering species and trigger early regeneration of shade-tolerant trees [1,20]. In general, the post-disturbance composition of tree species depends on pre-disturbance composition, species-specific mortality effects [14], regeneration before and after disturbance [61], and environmental changes that promote competitiveness [1]. Relatively weak, dispersed, non-destructive windstorms contribute to changes and adjustments in the structure of the stand (mainly the number of species) without major changes in species richness and, at the same time, diversification of the stand structure in terms of DBH. The thickest trees, which make Białowieża Forest so specific and are inhabited by many organisms, are constantly present on the study plots and their density is higher 30 years after the windstorm than before the disturbance. These natural resources have been preserved and the stand adjusted to changing habitat conditions. At the same time, the volume of dead wood has increased and was constantly available, which is important for the survival of many organisms in the Białowieża Forest. The changes observed on the study area in 1989 and 2014 prove the long-term impact of the windstorm. Considering the time, the fastest changes were recorded between 1984 and 1989. The lack of changes in species richness is important: the pool of species was neither impoverished nor extended with ecologically and geographically alien species, which is commonly observed in other areas, including the Białowieża Forest.
In the analyzed case, the moderate-severity windstorm accelerated processes widely reported from the Białowieża Forest and other areas of north-eastern Poland (expansion of C. betulus in fertile habitats, reduced frequency of light-seeded species and problems with the natural regeneration of Q. robur). Species richness did not change, and most of the regenerating trees represent shade-tolerant species that were present in the stand before wind disturbance. This can provide implications for forest management aimed at adjusting the species composition to that reflecting more advanced stages of succession in order to imitate this type of disturbance (on a microscale).

Author Contributions

Conceptualization, K.A.G. and R.G.; methodology, R.P., R.G. and K.A.G.; software, R.G. and K.A.G.; formal analysis, K.A.G. and R.G.; investigation, K.A.G. and R.G.; data curation, K.A.G. and R.G.; writing—original draft preparation, K.A.G. and R.G.; writing—review and editing, R.P..; visualization, R.G.; supervision, K.A.G.; funding acquisition, R.P. All authors have read and agreed to the published version of the manuscript.

Funding

This research was funded by General Directorate of the State Forests, grant number 500406–field measurement and some analysis. The remaining elements were made at the authors’ own expense.

Data Availability Statement

Data available in a publicly accessible founder repository that does not issue DOIs. This data can be found here: https://tbr.lasy.gov.pl/apex/f?p=102:3:::NO::P3_TEMAT:3562 (accessed on 21 March 2021). The data is also deposited in the institutional repository of the Forest Research Institute (http://weblis.ibles.pl/libcat/index.html) (accessed on 21 March 2021).

Acknowledgments

The authors want to thanks Jerzy M. Gutowski and Aleksander W. Sokołowski, who collected field data in 1983–1989, and Kazimierz Borowski, who participated in field measurements in 2013–2015. We are also grateful to two anonymous reviewers for their valuable comments and questions to improve the manuscript.

Conflicts of Interest

The authors declare no conflict of interest.

References

  1. Meigs, G.W.; Keeton, W.S. Intermediate-severity wind disturbance in mature temperate forests: Legacy structure, carbon storage, and stand dynamics. Ecol. Appl. 2018, 28, 798–815. [Google Scholar] [CrossRef] [PubMed]
  2. Falťan, V.; Katina, S.; Minár, J.; Polčák, N.; Bánovský, M.; Maretta, M.; Zámečník, S.; Petrovič, F. Evaluation of abiotic controls on windthrow disturbance using a generalized additive model: A case study of the Tatra National Park, Slovakia. Forests 2020, 11, 1259. [Google Scholar] [CrossRef]
  3. Krišāns, O.; Matisons, R.; Kitenberga, M.; Donis, J.; Rust, S.; Elferts, D.; Jansons, Ā. Wind resistance of eastern baltic silver birch (Betula pendula Roth.) Suggests its suitability for periodically waterlogged sites. Forests 2021, 12, 21. [Google Scholar] [CrossRef]
  4. Christiansen, E.; Bakke, A. The spruce bark beetle of Euroasia. In Dynamics of Forest Insect Populations: Patterns, Causes, Implications; Berryman, A., Ed.; Springer: Boston, MA, USA, 1988; pp. 479–503. [Google Scholar] [CrossRef]
  5. Keczyński, A. Wpływ gradacji kornika drukarza na drzewostany obszaru ochrony ścisłej Białowieskiego Parku Narodowego. Kosmos 2002, 51, 471–474. [Google Scholar]
  6. Marini, L.; Lindelöw, A.; Jönsson, A.M.; Wulff, S.; Schroeder, L.M. Population dynamics of the spruce bark beetle: A long-term study. OIKOS 2013, 122, 1768–1776. [Google Scholar] [CrossRef]
  7. Hroššo, B.; Mezei, P.; Potterf, M.; Majdák, A.; Blaženec, M.; Korolyova, N.; Jakuš, R. Drivers of spruce bark beetle (Ips typographus) infestations on downed trees after severe windthrow. Forests 2020, 11, 1290. [Google Scholar] [CrossRef]
  8. Kawecka, A. Zmiany roślinności i odnowienie naturalne w drzewostanach Puszczy Białowieskiej uszkodzonych przez huragany. Parki Nar. I Rezerw. Przyr. 1992, 10, 45–67. [Google Scholar]
  9. Szwagrzyk, J. Rozległe naturalne zaburzenia w ekosystemach leśnych: Ich zasięg, charakter i znaczenie dla dynamiki lasu. Wiadomości Ekol. 2000, 1, 3–19. [Google Scholar]
  10. Mitchell, S.J. Wind as a natural disturbance agent in forests: A synthesis. Forestry 2013, 86, 147–157. [Google Scholar] [CrossRef] [Green Version]
  11. Peterson, C.J.; Pickett, S.T. Forest reorganization: A case study in an old-growth forest catastrophic blowdown. Ecology 1995, 76, 763–774. [Google Scholar] [CrossRef]
  12. Peterson, C.J. Catastrophic wind damage to North American forests and the potential impact of climate change. Sci. Total Environ. 2000, 262, 287–311. [Google Scholar] [CrossRef]
  13. Stanturf, J.A.; Goodrick, S.L.; Outcalt, K.W. Disturbance and coastal forests: A strategic approach to forest management in hurricane impact zones. For. Ecol. Manag. 2007, 250, 119–135. [Google Scholar] [CrossRef]
  14. Rich, R.L.; Frelich, L.E.; Reich, P.B. Wind-throw mortality in the southern boreal forest: Effects of species, diameter and stand age. J. Ecol. 2007, 95, 1261–1273. [Google Scholar] [CrossRef]
  15. Sławski, M. Changes in species composition and cover of understory plants in stands disturbed by a hurricane in Piska Forest in 2002. Sylwan 2014, 158, 661–668. [Google Scholar]
  16. Skłodowski, J.W.; Garbalińska, P. Ground beetle assemblages (Coleoptera, Carabidae) in the third year of regeneration after a hurricane in the Puszcza Piska pine forests. Balt. J. Coleopt. 2007, 7, 17–36. [Google Scholar]
  17. Skłodowski, J.W.; Buszyniewicz, J.; Domański, M. Spontaneous regeneration of a stand disturbed by a hurricane in July 2002. Sylwan 2014, 158, 499–508. [Google Scholar]
  18. Dobrowolska, D. Forest regeneration in northeastern Poland following a catastrophic blowdown. Can. J. For. Res. 2015, 45, 1172–1182. [Google Scholar] [CrossRef]
  19. Holeksa, J.; Jaloviar, P.; Kucbel, S.; Saniga, M.; Svoboda, M.; Szewczyk, J.; Szwagrzyk, J.; Zielonka, T.; Żywiec, M. Models of disturbance driven dynamics in the West Carpathian spruce forests. For. Ecol. Manag. 2017, 388, 79–89. [Google Scholar] [CrossRef]
  20. Szwagrzyk, J.; Gazda, A.; Dobrowolska, D.; Chećko, E.; Zaremba, J.; Tomski, A. Natural regeneration following wind disturbance increases the diversity of managed lowland forests in NE Poland. J. Veg. Sci. 2018, 29, 898–906. [Google Scholar] [CrossRef]
  21. Kujawa, A.; Orczewska, A.; Falkowski, M.; Blicharska, M.; Bohdan, A.; Buchholz, L.; Chylarecki, P.; Gutowski, J.M.; Latałowa, M.; Mysłajek, R.W.; et al. The Białowieża Forest—A UNESCO Natural Heritage Site—Protection priorities. Leśne Pr. Badaw. For. Res. Pap. 2016, 77, 302–323. [Google Scholar] [CrossRef] [Green Version]
  22. Cholewińska, O.; Adamowski, W.; Jaroszewicz, B. Homogenization of Temperate Mixed Deciduous Forests in Białowieża Forest: Similar Communities Are Becoming More Similar. Forests 2020, 11, 545. [Google Scholar] [CrossRef]
  23. Jaroszewicz, B.; Cholewińska, O.; Gutowski, J.M.; Samojlik, T.; Zimny, M.; Latałowa, M. Białowieża Forest—A relic of the high naturalness of european forests. Forests 2019, 10, 849. [Google Scholar] [CrossRef] [Green Version]
  24. Sabatini, F.M.; Burrascano, S.; Keeton, W.S.; Levers, C.; Lindner, M.; Pötschner, F.; Verkerk, P.J.; Bauhus, J.; Buchwald, E.; Chaskovsky, O.; et al. Where are Europe’s last primary forests? Divers. Distrib. 2018, 24, 1426–1439. [Google Scholar] [CrossRef] [Green Version]
  25. Bernadzki, E.; Bolibok, L.; Brzeziecki, B.; Zajączkowski, J.; Żybura, H. Rozwój Drzewostanów Naturalnych Białowieskiego Parku Narodowego w Okresie 1936 do 1996; Fundacja Rozwój SGGW: Warszawa, Poland, 1998; p. 271. [Google Scholar]
  26. Więcko, E. Puszcza Białowieska; PWN: Warszawa, Poland, 1972; p. 193. [Google Scholar]
  27. Niklasson, M.; Zin, E.; Zielonka, T.; Feijen, M.; Korczyk, A.F.; Churski, M.; Samojlik, T.; Jędrzejewska, B.; Gutowski, J.M.; Brzeziecki, B. A 350-year tree-ring fire record from Białowieża Primeval Forest, Poland: Implications for Central European lowland fire history. J. Ecol. 2010, 98, 1319–1329. [Google Scholar] [CrossRef]
  28. Brzeziecki, B.; Bielak, K.; Bolibok, L.; Drozdowski, S.; Zajączkowski, J.; Żybura, H. Structural and compositional dynamics of strictly protected woodland communities with silvicultural implications, using Białowieża Forest as an example. Ann. Sci. 2018, 75, 89. [Google Scholar] [CrossRef] [Green Version]
  29. Miścicki, S. Structure and dynamics of temperate lowland natural forest in the Białowieża National Park, Poland. Forestry 2012, 85, 473–483. [Google Scholar] [CrossRef] [Green Version]
  30. Gazda, A.; Miścicki, S. Forecast of the development of natural forest resources using a size–class growth model. Sylwan 2016, 160, 207–218. [Google Scholar]
  31. Paczoski, J. Lasy Białowieży; Państwowa Rada Ochrony Przyrody, Monografie Naukowe: Warszawa, Poland, 1930; Volume 1, p. 575. [Google Scholar]
  32. Kawecka, A.; Gutowski, J.M. Skutki huraganowych wiatrów z zimy 1982/1983r. w Puszczy Białowieskiej. Pr. Inst. Badaw. Leśnictwa 1988, 677, 113–124. [Google Scholar]
  33. Gutowski, J.M.; Kubisz, D. Entomofauna drzewostanów pohuraganowych w Puszczy Białowieskiej. Pr. Inst. Badaw. Leśnictwa Ser. A 1995, 788, 91–129. [Google Scholar]
  34. R Development Core Team. R: A Language and Environment for Statistical Computing; R Foundation for Statistical Computing: Vienna, Austria, 2019; Available online: https://www.R-project.org/ (accessed on 18 February 2021).
  35. PMCMR: Calculate Pairwise Multiple Comparisons of Mean Rank Sums. Available online: https://CRAN.R-project.org/package=PMCMR (accessed on 13 February 2021).
  36. Fox, J.; Weisberg, S. An {R} Companion to Applied Regression, 3rd ed.; Sage: Thousand Oaks, CA, USA, 2019; Available online: https://socialsciences.mcmaster.ca/jfox/Books/Companion/ (accessed on 15 February 2021).
  37. iNEXT: iNterpolation and EXTrapolation for Species Diversity. R package version 2.0.19. Available online: http://chao.stat.nthu.edu.tw/blog/software-download/ (accessed on 20 February 2021).
  38. Vegan: Community Ecology Package. Available online: https://CRAN.R-project.org/package=vegan (accessed on 10 February 2021).
  39. Minchin, P.R. An evaluation of relative robustness of techniques for ecological ordinations. Vegetatio 1987, 69, 89–107. [Google Scholar] [CrossRef]
  40. Paliy, O.; Shankar, V. Application of multivariate statistical techniques in microbial ecology. Mol. Ecol. 2016, 25, 1032–1057. [Google Scholar] [CrossRef] [PubMed] [Green Version]
  41. Oksanen, J. Vegan: An Introduction to Ordination. 2020. Available online: https://cran.r-project.org/web/packages/vegan/vignettes/intro-vegan.pdf (accessed on 9 May 2021).
  42. Clarke, K. Nonparametric Multivariate Analyses of Changes in Community Structure. Austral. Ecol. 1993, 18, 117–143. [Google Scholar] [CrossRef]
  43. Peterson, C.J. First-decade biomass and carbon accumulation, and woody community change after severe wind damage in a hemlock-white pine forest remnant. Forests 2021, 12, 231. [Google Scholar] [CrossRef]
  44. Depauw, L.; Perring, M.P.; Landuyt, D.; Maes, S.L.; Blondeel, H.; De Lombaerde, E.; Brūmelis, G.; Brunet, J.; Closset-Kopp, D.; Czerepko, J.; et al. Light availability and land-use history drive biodiversity and functional changes in forest herb layer communities. J. Ecol. 2019, 108, 1411–1425. [Google Scholar] [CrossRef]
  45. Sutinen, R.; Teirilä, A.; Pänttäjä, M.; Sutinen, M.L. Distribution and diversity of tree species with respect to soil electrical characteristics in Finnish Lapland. Can. J. Res. 2002, 32, 1158–1170. [Google Scholar] [CrossRef]
  46. Spinu, A.P.; Niklasson, M.; Zin, E. Mesophication in temperate Europe: A dendrochronological reconstruction of tree succession and fires in a mixed deciduous stand in Białowieża Forest. Ecol. Evol. 2020, 10, 2. [Google Scholar] [CrossRef] [Green Version]
  47. Sokołowski, A.W. Fitosocjologiczna charakterystyka zbiorowisk leśnych Białowieskiego Parku Narodowego. Parki Nar. I Rezerw. Przyr. 1993, 12, 5–190. [Google Scholar]
  48. Brzeziecki, B.; Pommerening, A.; Miścicki, S.; Drozdowski, D.; Żybura, H. A common lack of demographic equilibrium among tree species in Białowieża National Park (NE Poland): Evidence from long-term plots. J. Veg. Sci. 2016, 27, 460–469. [Google Scholar] [CrossRef]
  49. Brzeziecki, B.; Woods, K.; Bolibok, L.; Zajączkowski, J.; Drozdowski, S.; Bielak, K.; Żybura, H. Over 80 years without major disturbance, late-successional Białowieża woodlands exhibit complex dynamism, with coherent compositional shifts towards true old-growth conditions. J. Ecol. 2020, 108, 1138–1154. [Google Scholar] [CrossRef]
  50. Zajączkowski, J. Natural forest regeneration on the example of research area in Białowieża National Park. Sylwan 1999, 143, 5–14. [Google Scholar]
  51. Bobiec, A.; Bobiec, M. Influence of spruce decline in stands of the Białowieża National Park on natural oak regeneration. Sylwan 2012, 156, 243–251. [Google Scholar] [CrossRef]
  52. Bobiec, A. Białowieża Primeval Forest as a remnant of culturally modified ancient forest. Eur J For. Res. 2012, 131, 1269–1285. [Google Scholar] [CrossRef] [Green Version]
  53. Bobiec, A.; Buchholz, L.; Churski, M.; Chylarecki, P.; Fałtynowicz, W.; Gutowski, J.M.; Jaroszewicz, B.; Kuijper, D.P.J.; Kujawa, A.; Mikusek, R.; et al. Dlaczego martwe świerki są potrzebne w Puszczy Białowieskiej? Tech. Rap. 2016, 7, 14–16. [Google Scholar] [CrossRef]
  54. Faliński, J.B.; Pawlaczyk, P. Zarys ekologii. In Grab Zwyczajny Carpinus betulus L.; Bugała, W., Ed.; Sorus: Poznań-Kórnik, Poland, 1993; pp. 157–263. [Google Scholar]
  55. Bernadzki, E.; Bolibok, L.; Brzeziecki, B.; Zajączkowski, J.; Żybura, H. Compositional dynamics of natural forests in the Białowieża National Park, northeastern Poland. J. Veg. Sci. 1998, 9, 229–238. [Google Scholar] [CrossRef]
  56. Brzeziecki, B. Long-term dynamics of natural tree stands on the example of two forest communities of the Białowieża National Park: Pino-Quercetum Tilio-Carpinetum. Studia Nat. 2008, 54, 9–22. [Google Scholar]
  57. Brzeziecki, B.; Bernadzki, E. Langfristige Entwicklung von zwei Waldgesellschaften im Białowieża-Urwald. Schweizezerische Z. Forstwes. 2008, 159, 80–90. [Google Scholar] [CrossRef]
  58. Brzeziecki, B.; Keczyński, A.; Zajączkowski, J.; Drozdowski, S.; Gawron, L.; Buraczyk, W.; Bielak, K.; Szeligowski, H.; Dzwonkowski, M. Threatened tree species of the Białowieża National Park (the Strict Reserve). Sylwan 2012, 156, 252–261. [Google Scholar] [CrossRef]
  59. Paluch, R. Long-term changes of tree species composition in natural stands of the Białowieża Forest. Sylwan 2015, 159, 278–288. [Google Scholar] [CrossRef]
  60. Paluch, R.; Gabrysiak, K.A. Long-term changes of tree species composition in high protective regime stands in the Augustów and Knyszyn Forests. Sylwan 2019, 163, 846–854. [Google Scholar] [CrossRef]
  61. Macek, M.; Wild, J.; Kopecký, M.; Červenka, J.; Svoboda, M.; Zenáhlíková, J.; Brůna, J.; Mosandl, R.; Fischer, A. Life and death of Picea abies after bark-beetle outbreak: Ecological processes driving seedling recruitment. Ecol. Appl. 2017, 27, 156–167. [Google Scholar] [CrossRef] [PubMed] [Green Version]
Figure 1. Sample-size-based rarefaction (solid lines) and extrapolation (dashed lines) of sampling curves with 95% confidence intervals (shaded areas). Observed (reference) samples are denoted by the solid dots. 0–IV – classes of trees.
Forests 12 00600 g001
Figure 2. Species structure (frequency % of species in the total number of trees in different classes). A—1982, B—1984, C—1989, D—2014.
Forests 12 00600 g002
Figure 3. Ordination of study plots in subsequent survey years (ellipse = 1SD from centroid) vs environmental vectors based on nonmetric multidimensional scaling (NMDS). Bray-Curtis Distance. Stress = 0.13. Vectors: BA-total basal area, Qr-basal area of Quercus robur, Cb-basal area of Carpinus betulus, Ap-basal area of Acer platanoides, Tc-basal area of Tilia cordata, Pt-basal area of Populus tremula, Pa-basal area of Picea abies, DD-degree of damage (%). All vectors were significantly correlated with the location of a study plot. R2 for vectors: BA-0.31, Qr-0.33, Cb-0.37, Ap-0.16, Tc-0.52, Pt-0.24, Pa-0.70, DD-0.48.
Forests 12 00600 g003
Figure 4. Ordination of study plots in subsequent survey years and tree classes (centroids) vs environmental vectors based on nonmetric multidimensional scaling (NMDS). Bray-Curtis distance. Stress = 0.19. Designations of vectors are the same as in Figure 3. Vectors significantly correlated with the location of a study plot are marked in red. R2 for vectors: BA-0.26, Qr-0.33, Cb-0.03, Ap-< 0.01, Tc-0.06, Pt-0.10, Pa- 0.28, DD-0.22. The shape of the points corresponds to the years of measurement and the color to the class of trees.
Forests 12 00600 g004
Table 1. Study plots.
Number of Study PlotLocationVolume of Trees in 1982 (Before Windthrow) [m3/ha]Degree of Stand Damage (DD) [%]
3N52.65331 E23.65169115.810.7
4N52.65212 E23.6517188.525.9
6N52.60593 E23.62461132.77.6
7N52.60362 E23.62299141.87.6
8N52.72302 E23.86908117.449.4
9N52.72244 E23.8599977.977.4
10N52.72334 E23.8596362.359.3
11N52.73280 E23.82935108.125.8
15N52.74294 E23.86752153.217.7
Table 2. Mean density of trees (trees/ha) (± standard error) in classes in four survey years. Significant differences in the mean number of trees according to different years are marked with different letters based on the Friedman test with significance p < 0.05. The same letters (a and a, ab) indicate no significant differences, and different letters (a and b) indicate significant differences.
Class1982 1984 1989 2014
0 1724.4 ± 256.7a3256.0 ± 481.2b2809.3 ± 640.3b
I411.6 ± 84.1ab396.9 ± 80.5a833.0 ± 256.8a1398.7 ± 204.1b
II300.0 ± 41.4a238.7 ± 41.9a270.0 ± 30.9a361.8 ± 53.5a
III199.1 ± 22.4a153.8 ± 24.5b158.0 ± 21.7ab175.1 ± 11.9ab
IV29.3 ± 6.1a21.8 ± 6.2b20.0 ± 5.7b25.3 ± 7.6ab
Ʃ I-IV940.0 ± 89.7ab811.1 ± 94.7a1281.0 ± 236.5a1960.9 ± 210.7b
Table 3. Mean BA of trees in classes (m2/ha) (±standard error) in four survey years. Significant differences in the mean basal area according to different years are marked with different letters based on the Friedman test with significance p < 0.05. Letter meaning is the same as in Table 2.
Class1982 1984 1989 2014
I0.5 ± 0.1a0.5 ± 0.1a0.5 ± 0.1a1.0 ± 0.2a
II3.8 ± 0.6ab3.0 ± 0.6a3.3 ± 0.5ab4.6 ± 0.7b
III19.9 ± 2.1a15.0 ± 2.4b15.0 ± 2.3ab16.8 ± 1.1ab
IV10.8 ± 2.5a 18.1 ± 2.4b 17.4 ± 2.2ab 110.1 ± 3.3ab 1
Ʃ I-IV34.9 ± 2.7a26.5 ± 3.8b26.3 ± 3.5b32.5 ± 3.0ab
1p < 0.1 for post-hoc test.
Publisher’s Note: MDPI stays neutral with regard to jurisdictional claims in published maps and institutional affiliations.

