Article

Estimation of the Productivity Potential of Mountain Sites (Mixed Beech-Coniferous Stands) in the Romanian Carpathians

by
Avram Cicșa
1,2,
Gheorghe-Marian Tudoran
1,*,
Maria Boroeanu
1,
Alexandru-Claudiu Dobre
1,2 and
Gheorghe Spârchez
1
1
Department of Forest Engineering, Forest Management Planning and Terrestrial Measurements, Faculty of Silviculture and Forest Engineering, “Transilvania” University, Ludwig van Beethoven Str., 500123 Brașov, Romania
2
Department of Forest Monitoring, “Marin Drăcea “Romanian National Institute for Research and Development, 128 Eroilor Blvd., 077190 Voluntari, Romania
*
Author to whom correspondence should be addressed.
Forests 2021, 12(5), 549; https://doi.org/10.3390/f12050549
Submission received: 19 January 2021 / Revised: 12 April 2021 / Accepted: 25 April 2021 / Published: 28 April 2021

Abstract

:
Research Highlights: This study highlighted the possibility of estimating the productivity of mountain sites (mixed beech-coniferous stands) based on tree and stand dendrometric characteristics. Background and Objectives: The mountainous region of Romania offers suitable conditions for the formation and development of mixed beech-coniferous stands with complex, multi-aged structures. Based on the dendrometric characteristics of the trees, established indicators were used to estimate the productivity of the sites, with other quantitative indicators being proposed to better capture the particularities of mixed multi-aged stands. Materials and Methods: To evaluate the productive potential of the sites, a combined in situ mapping method was applied. Laboratory analyses of soils, and information provided indirectly by indicator plant and tree overstories, led to the characterization of soil types and the identification of forest sites for study. The productivity of the sites was estimated using quantitative indicators established based on the dendrometric characteristics of the trees and stands. Results: Indicators based on stand production and growth are relevant for multi-aged stands of mixed beech-coniferous formation. The ratio between tree volume and the basal area is the result of basal area and height increments, both of which are variable and depend on the quality of the site. Thus, a form height stand can be used as an indicator to characterize the productivity of the site in mixed multi-aged stands. Conclusions: Knowing the ecological specificity of sites in the formation of mixed beech-coniferous forests is a first condition necessary to achieving stable stands that are able to continuously fulfill multiple functions. The favorability of forest sites for a certain assortment of species is a fundamental character of the sites, which is essential for the management of these forest formations.

1. Introduction

The way in which forest biocenoses manage to use the energetic, trophic, and hydric resources of a site is a consequence of their stability, resulting from the relationship between the structure of the stand and the site conditions. A site’s ability to maintain a certain forest vegetation is reflected in its growth strength and in the species’ behavior and expresses its productive potential [1]. Thus, regardless of the function of the forest or the goals pursued in its management, the forest site characteristics become a condition for ensuring the stability of the forest, as they influence the health and vitality of trees and stands. The production and productivity of the stands are determined by the actual structure of the site. All the component elements of a site, such as the geomorphological, edaphic, and climatic factors, determine the degree of favorability of the site for the forest vegetation. The edaphic and climatic elements express the extent to which a site meets the ecological requirements of the trees and, as a result, are of greater importance in determining the degree of favorability of a site [2].
The productivity of a site can be estimated directly, based on climatic, ecological, geomorphological, and soil factors [3,4,5]. In many cases, local characteristics, including soil properties, have been assumed to be spatially homogeneous [6]. However, other studies, mainly focused on soil variability at detailed spatial scales [7,8], highlighted that they can exhibit great variability, even over short distances and small areas. Thus, many studies have focused on the evaluation of the productivity potential and its indirect classification using indicator plants [9,10,11]. This method produces better results than the direct method.
Herbaceous plants represent the expression of vegetation, determined by climatic, microclimatic, and edaphic characteristics [12]. They are a faithful indicator of soil trophicity and soil moisture but especially reflect the upper part of the soil. The indirect method also involves determining the characteristics of a stand at a given site and, based on these, ascertaining the productivity potential of the site. One biometric feature that is not so sensitive to climatic oscillations and forestry interventions has been shown to be the height of a stand at a certain age. Because tree height has a close correlation with the volume of a stand, it is a representative indicator of site productivity. The classification of sites according to the height seems quite simple because the higher the height of the stand, the more common it is for the site to be of higher productivity. The adoption of this classification criterion not only faithfully expresses productivity but also makes it easy to determine in practice. Thus, the height of a stand has become an indicator of the productivity of sites recognized for the management of even-aged forest stands [13,14]. The dominant average height (i.e., the average height of the largest 100 tree diameters per hectare at a given age) [5] relative to the age of the stand is not influenced by the density of the stand and the management measures applied. That is why, it is considered to be an indicator of site productivity [8,15,16,17]. In forest management practices, site index models are known as a measure of the potential site productivity [18]. Research has highlighted new concerns about estimating the potential of these sites using indices that include characteristics of trees and stands other than height and age. Recent studies have also pointed to the basal area increment (BAI) as an indicator for quantifying the productivity of sites in multi-aged stands [19].
Among Romania’s mixed forests, mixed beech-coniferous stands have the widest distribution (22%, according to the National Forest Inventory (2018)), due to the favorable site conditions offered by the mountainous relief. Due to the natural conditions, the formation of mixed beech-coniferous forests presents a rather accentuated non-uniformity in the mountain ranges of Romania. The trees fulfill multiple functions of protection and production, and the stands are made up of species (i.e., Norway spruce, silver fir, European beech) that naturally tend toward complex structures of the uneven-aged type. The close relationship that exists between the site and the structure of the stands leads to the need to develop an understanding of the potential of sites specific to such structures. The height is recognized as a relevant criterion for estimating the productivity of sites where pure stands are found. Height is recognized as a relevant criterion for estimating site productivity. However, the structure of the mixed stands is much more dynamic. Other indicators with a predictive capacity (e.g., BAI [15,20]), volume (hectare sum of standing volume) increment [15], or diameter increment [21]) can also be used to estimate the site’s productivity in different structural conditions of the stands. If predictive models are developed for individual species derived from mixed stands, then the values predicted by the models should reflect the mixture of species. Amongst the indicators, mean annual volume increment (MAI) (as it is deduced from the volume of the stand) could be modeled for different structures as it sums up the site index of each species in the composition of the stands. Thus, the size of the MAI can represent a measure of the site’s productivity for the species mixture. The MAI-based site index could be differentiated by mixture types and could estimate the site’s productivity of mixed stands.
Through this study, we aimed to develop models for the main biophysical characteristics of stands that can estimate the productive potential of the sites from mixed beech-coniferous formations. The models are based on direct measurements and expressed by simple and easy-to-apply equations. Finally, we analyzed the practical usefulness, accuracy, and limitations.

2. Materials and Methods

Table 1 shows the symbols for the tree variables used in this study.
Study area: The study was carried out in the Făgăraș Massif, in the Southern Carpathians in Romania. It included mixed beech and coniferous forests, occupying a large area. The forests are located at altitudes of between 800 and 1800 m, predominantly on crystalline schists but also on limestones. In the stands, the factors met a variety of site conditions. Frequently, the slope inclination ranged between 20° and 35° (Table 2). The forests are part of several production units managed by the Făgăraș and Brașov Forest Districts (Figure 1) and are spread over an area of 9107.79 ha.
Data collection and processing: In order to carry out the field measurements, we researched the physical–geographical conditions of the study area. A study of forest management plans was the next step, in order for us to obtain information about the stands and forest growing stock. Based on the information from the forest management plans (descriptions of the stands and thematic maps), we stratified the forest area in relation to the main geomorphological factors (i.e., altitude, exposure, and slope inclination) and the composition and age of the stands (Table 2).
Field observations were made through a key-area mapping method. A key area of 507.05 ha was chosen in such way as to capture the diversity of site conditions encountered in the mountain forests of mixed beech and coniferous stands in the area [22]. The working method was tested on the key area (Figure 2). The determination of the characteristics and the estimation of the productivity of the forest sites was done directly, based on study of the component elements of the sites and, indirectly, through the grass flora and forest vegetation indicators.
In the key area, five soil profiles were sampled to determine their physicochemical properties. Each stand was studied as a whole in order to obtain an overview of its structure. In each stand, plots of different sizes (400 and 2500 m2) were placed to capture the structural diversity of each stand. The tree structure was investigated, in terms of composition, density, age, level, origin, size of mean trees by species, regeneration capacity, and indicator plants. At the tree level, their dimensions were measured, and their cenotic positions and health were evaluated. For each species, the trees were grouped into dimensional classes, so as to capture the generations of trees in each species. At the stand level, the mean tree (i.e., when considering the basal area) was established, and its diameter (i.e., dg), height (i.e., hg), form height (i.e., fhg, synonymous with FH of the stand, in the case of pure-aged stands), and dominant height were determined. Age was determined from growth cores extracted from mean trees. At the stand level, the age was determined as the weighted average of current species ages, weighted by their basal area computed in the field. When two generations were identified within one species, the age was determined for each of them. Tree generations’ ages and dendrometric characteristics (e.g., basal area, height, age) were included in the data processing. In the key area, we included trees from natural regeneration with an age of minimum 10 years. For trees planted in stands characterized by natural regeneration (spruce), the age was set according to the planting year. When the differences between their age and the age of the nearest generation, characterized by natural regeneration, were more than 20 years, these trees constituted a new generation. In the case of trees aged 10–20 years, from stands with natural regeneration, their age was determined through annual-ring counting on the sample trees (stem horizontal section, extracted during tending operations). We measured the basal areas of the stand using a Criterion laser and the tree heights with a Vertex laser. The volume of the mean trees (i.e., mean-basal-area trees) was determined based on diameter and height by means of Giurgiu and Drăghiciu’s (2004) regression equation, which is used for these species in Romania:
log v = a0 + a1log d + a2log2d + a3logh + a4log2h.
In this equation, a0 = −4.46414, a1 = 2.19479, a2 = −0.12498, a3 = 1.04645, a4 = −0.016848 (for fir); a0 = −4.18161, a1 = 2.08131, a2 = −0.11819, a3 = 0.70119, a4 = 0.148181 (for spruce); and a0 = −4.11122, a1 = 1.30216, a2 = 0.23636, a3 = 1.26562, a4 = −0.079661 (for beech).
At the level of the key area, several sites were identified, out of which three were chosen as being representative of mixed beech-coniferous stands: 3.3.3.3—a mixed mountain forest site with superior productivity, large edaphic eutricambosol (eutrophic—megaphic, euhydric), with Galium–Dentaria; 3.3.3.2—a mixed mountain forest site with medium productivity, medium edaphic eutricambosol (mesotrophic, meso-eutrophic, mesohydric), with Galium–Dentaria ± acidophilic; and 3.3.3.1—a mixed mountain forest site with lower productivity, small edaphic eutricambosol (oligomesotrophic, mesohydric), with Galium–Dentaria. For soil classification, we used the Romanian Soil Taxonomy System (2003). This system was referenced with the World Reference Base for Soil Resources (1998) and is currently used for mapping forest soils by the “Marin Drăcea” Romanian National Institute for Research and Development in Forestry. For the stands included in the key area, the productivity of the sites was assessed in terms of average height in relation to the age of the stands, an indicator also used in the case of stands with aged structures. The possibility of using other indicators that included the main biometric features of the mean tree (i.e., mean-basal-area tree) was assessed. The relationships between these biometric parameters were expressed by simple and easy-to-apply models of polynomial and exponential type. The developed models at the key-area level differentiated three sites and estimated their productivity correctly; thus, their application was extended to the study area of 9107.79 ha (at the level of 1261 stands). We used the database provided by the forest management plans for this area, developed by the “Marin Drăcea” Romanian National Institute for Research and Development in Forestry in 2015 and 2018 [23]. These plans provided information on the biophysical characteristics of the stands, required by the models’ application. There were no significant differences between the theoretical distributions obtained at the level of the key surface and those at the level of the study area. However, the existing data set at the level of the key area had lower representativeness, especially in the case of the fir from the young stands. Thus, for variables such as CAI and MAI, new equations were generated, with a higher value of the coefficient of determination and better values of the other statistical indicators. In such cases, we considered the equations generated at the level of the study area. Finally, at the level of the study area, three models were developed:
-
Model 1: f (x) = a + bx + cx2, between the variables: hdom and T, hg and T, fhg and T, hg and dg, fhg and dg, vg and gg, with x being the age T, dg, or gg;
-
Model 2: f (x) = ae-bx, between the variables: Rhgg and dg, Rhgg and T, with x being dg or T;
-
Model 3: f (x) = a + bx + cx2 + dx3, between the variables: current annual volume increment (CAI) and T, MAI and T, with x being T.
These models were expressed by 99 custom regression equations for each indicator and species (54 equations established according to model 1, 18 equations from model 2, and 27 equations from model 3). Table 3 shows the shape of the equations for each variable (please see Supplementary Materials for all 99 equations).
To evaluate the quality of the models, the values of the statistical indicators were analyzed: root mean squared error (RMSE), mean absolute error (MAE), mean absolute percentage error (MAPE%), Akaike information criterion (AIC), and coefficient of determination (R2).

3. Results

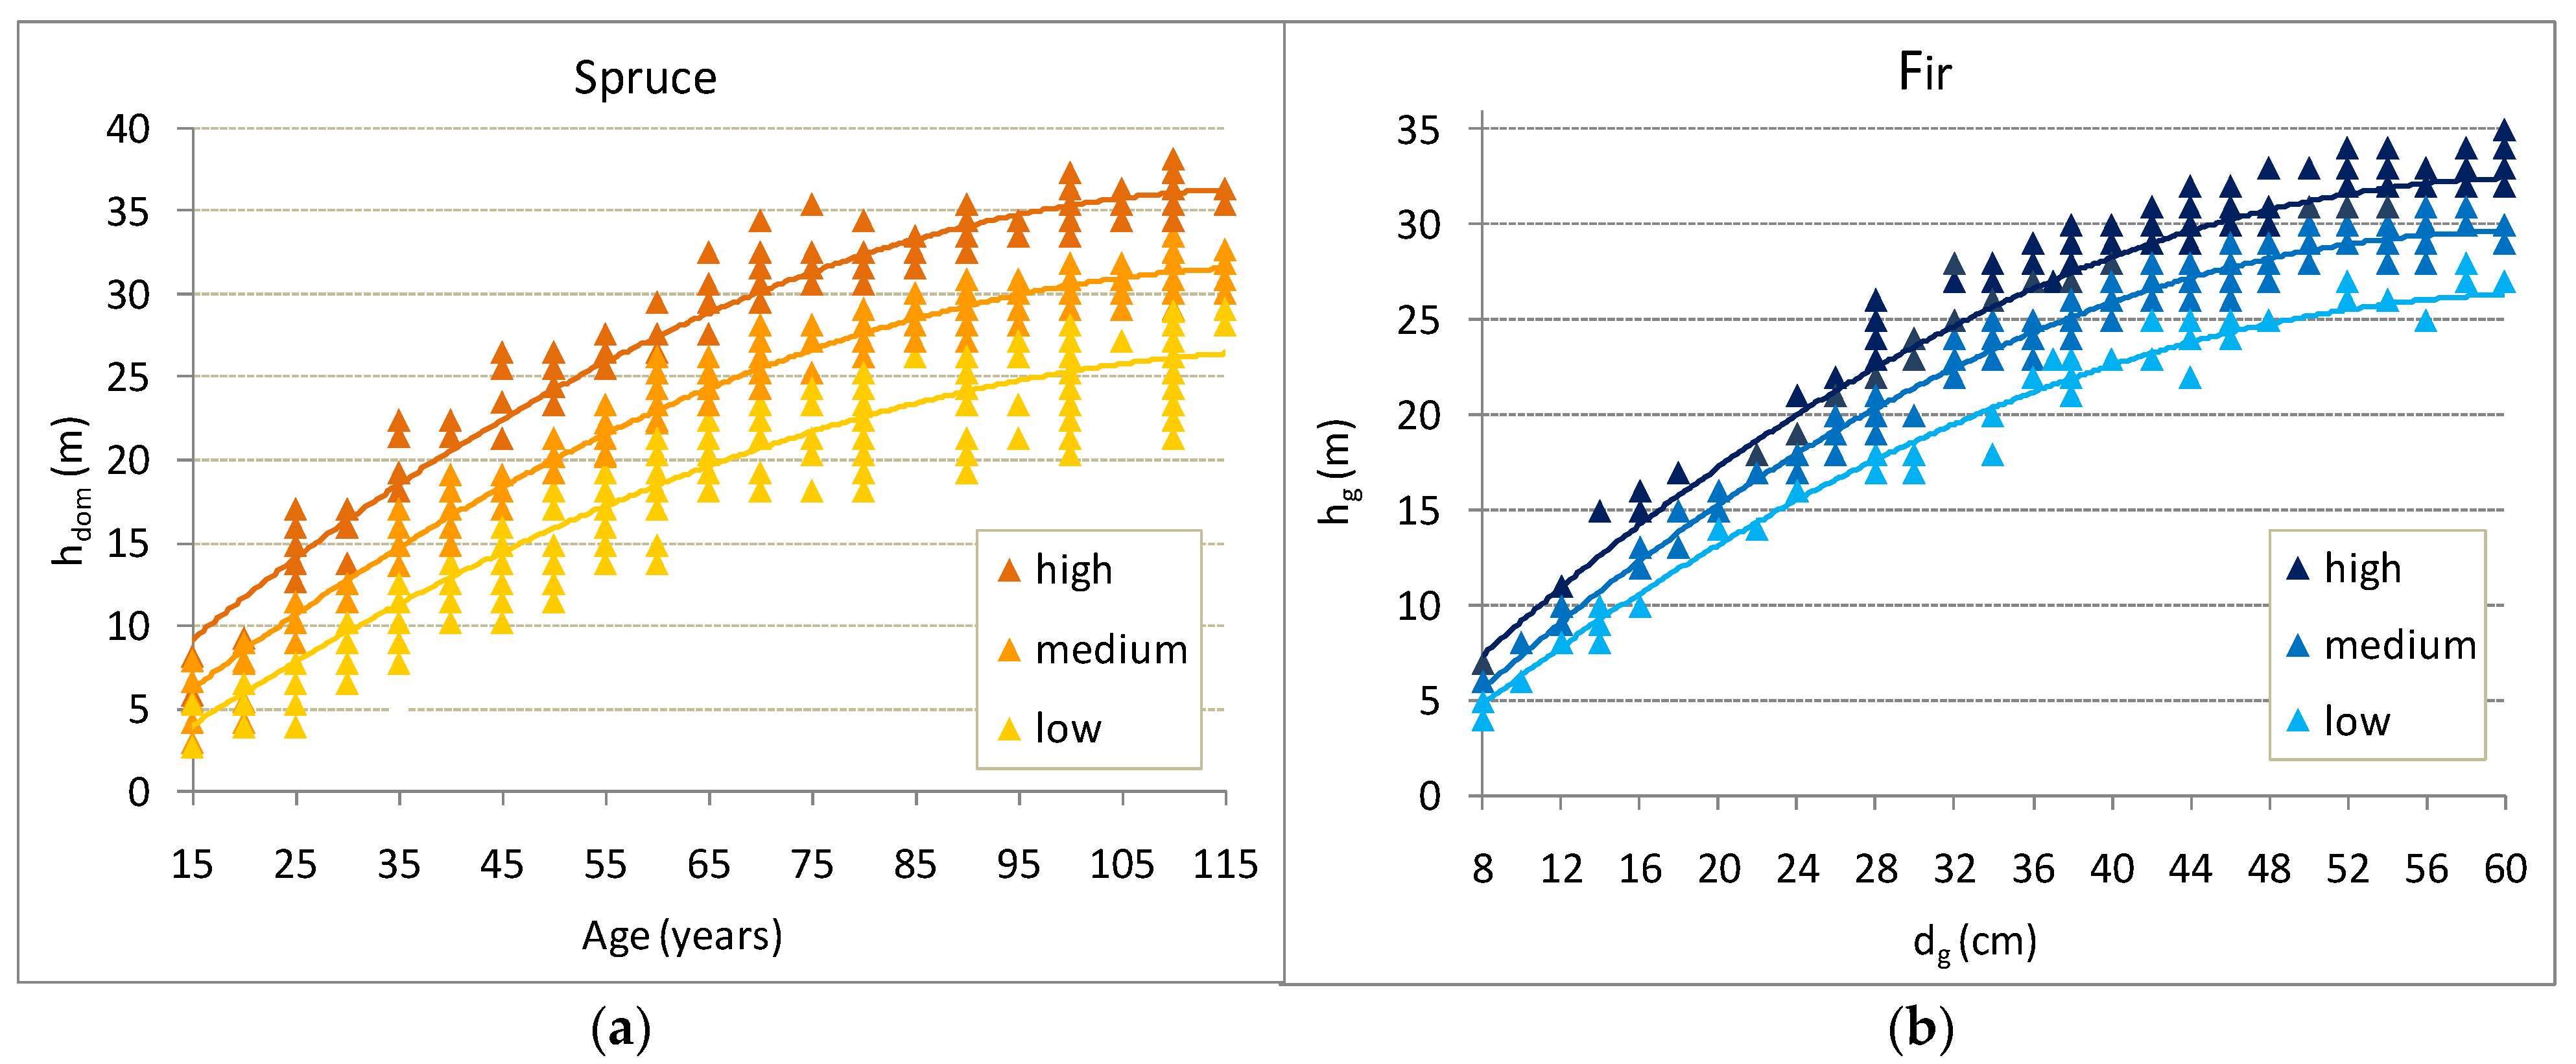
3.1. Height and Form Height (FH) of Stand as an Indicator of Site Productivity

The dynamics of the height in relation to age were established according to model 1. The dominant height for spruce, fir, and beech is an expression of their site conditions (Table 3 and Figure 3) and was estimated using nine equations. In relation to age and to the average diameter of the stands, the average stands height can also describe the productivity of the sites. The relationships between these variables were established according to model 1 and estimated using nine equations for hg–T and nine equations for hg–dg. The height curves differ by species, capturing the peculiarities of the sites. They reflect the variation of the height of stands whose densities have a value around 0.8.
Form height (fhg) increases with age, highlighting differences between sites in terms of their productivity. Similarly, in relation to the average diameter of the stands, fhg follows a trend similar to that of the average height (Figure 4). As a result, the variation in fhg in relation to the age of the trees and their average diameter was established by model 1 and can also be used in the case of average height. The fhg values were estimated by nine equations in relation to age, and by nine equations in relation to average diameter (see the Table S1a,b from Supplementary Materials for all 45 equations).
For the 45 equations, R2 had values between 0.94 and 0.98 for stands located in higher-productivity sites, 0.90 and 0.97 for medium-productivity stands, and 0.82 and 0.98 for lower-productivity stands. For conifers in mixed stands, the sites were more favorable, especially for fir trees, which achieved increased productivity by almost one production class (on a scale of 1 to 5) compared to the other species.

3.2. Ratio between Height of the Mean-Basal-Area Tree of the Stand and Its Basal Area (Rhgg)

Rhgg expresses a close link between the intensity of stand growth and the site conditions. This indicator provides satisfactory results when the stands have reached an age of at least 30 years. For the estimation of this indicator, model 2 was used, represented by 18 regression equations (see the Table S1a,b from Supplementary Materials for all 18 equations). The Rhgg values explain 88% and 98% of the variation in age of the stands (between 30 and 140 years), and 93% and 98% of the average diameter (between 14 and 60 cm). For beech, R2 had values ranging between 0.91 and 0.98.
Rhgg decreases in relation to the age of the stands (Figure 5a) and the average diameter of the stands (Figure 5b), following an exponential trend. In contrast, for the same age and diameter, Rhgg values differ in relation to the productivity of the site.

3.3. Volume of the Mean Tree (vg)

At the same average diameter, the volume of the trees differs in relation to the height of the trees and their shape as a result of the structural conditions of the stand and the site conditions. The mean-basal-area tree characterizes the basal-area increment of all trees. The dynamics of its volume in relation to the basal area is also influenced by the site conditions and has a stable character, as does the FH. In this study, the relationship between the volume and the basal area of trees was fitted by a polynomial (model 2), with nine equations (see the Table S1a,b from Supplementary Materials for all nine equations).
It is known that there is a very strong correlation between the two variables (v and g). The models explain 98% of the variance corresponding to the relationship between the volume of the mean-basal-area tree (vg) and its basal area (gg). The size of the percentage current annual basal-area increment (PBAI), in the percentage current annual volume increment, increases as the diameter of the trees increases, so that, at an age of over 80 years, the PBAI values are around 80%. This is reflected in the volume of the trees, which have an increasing trend in relation to the basal area of the trees (Figure 6).

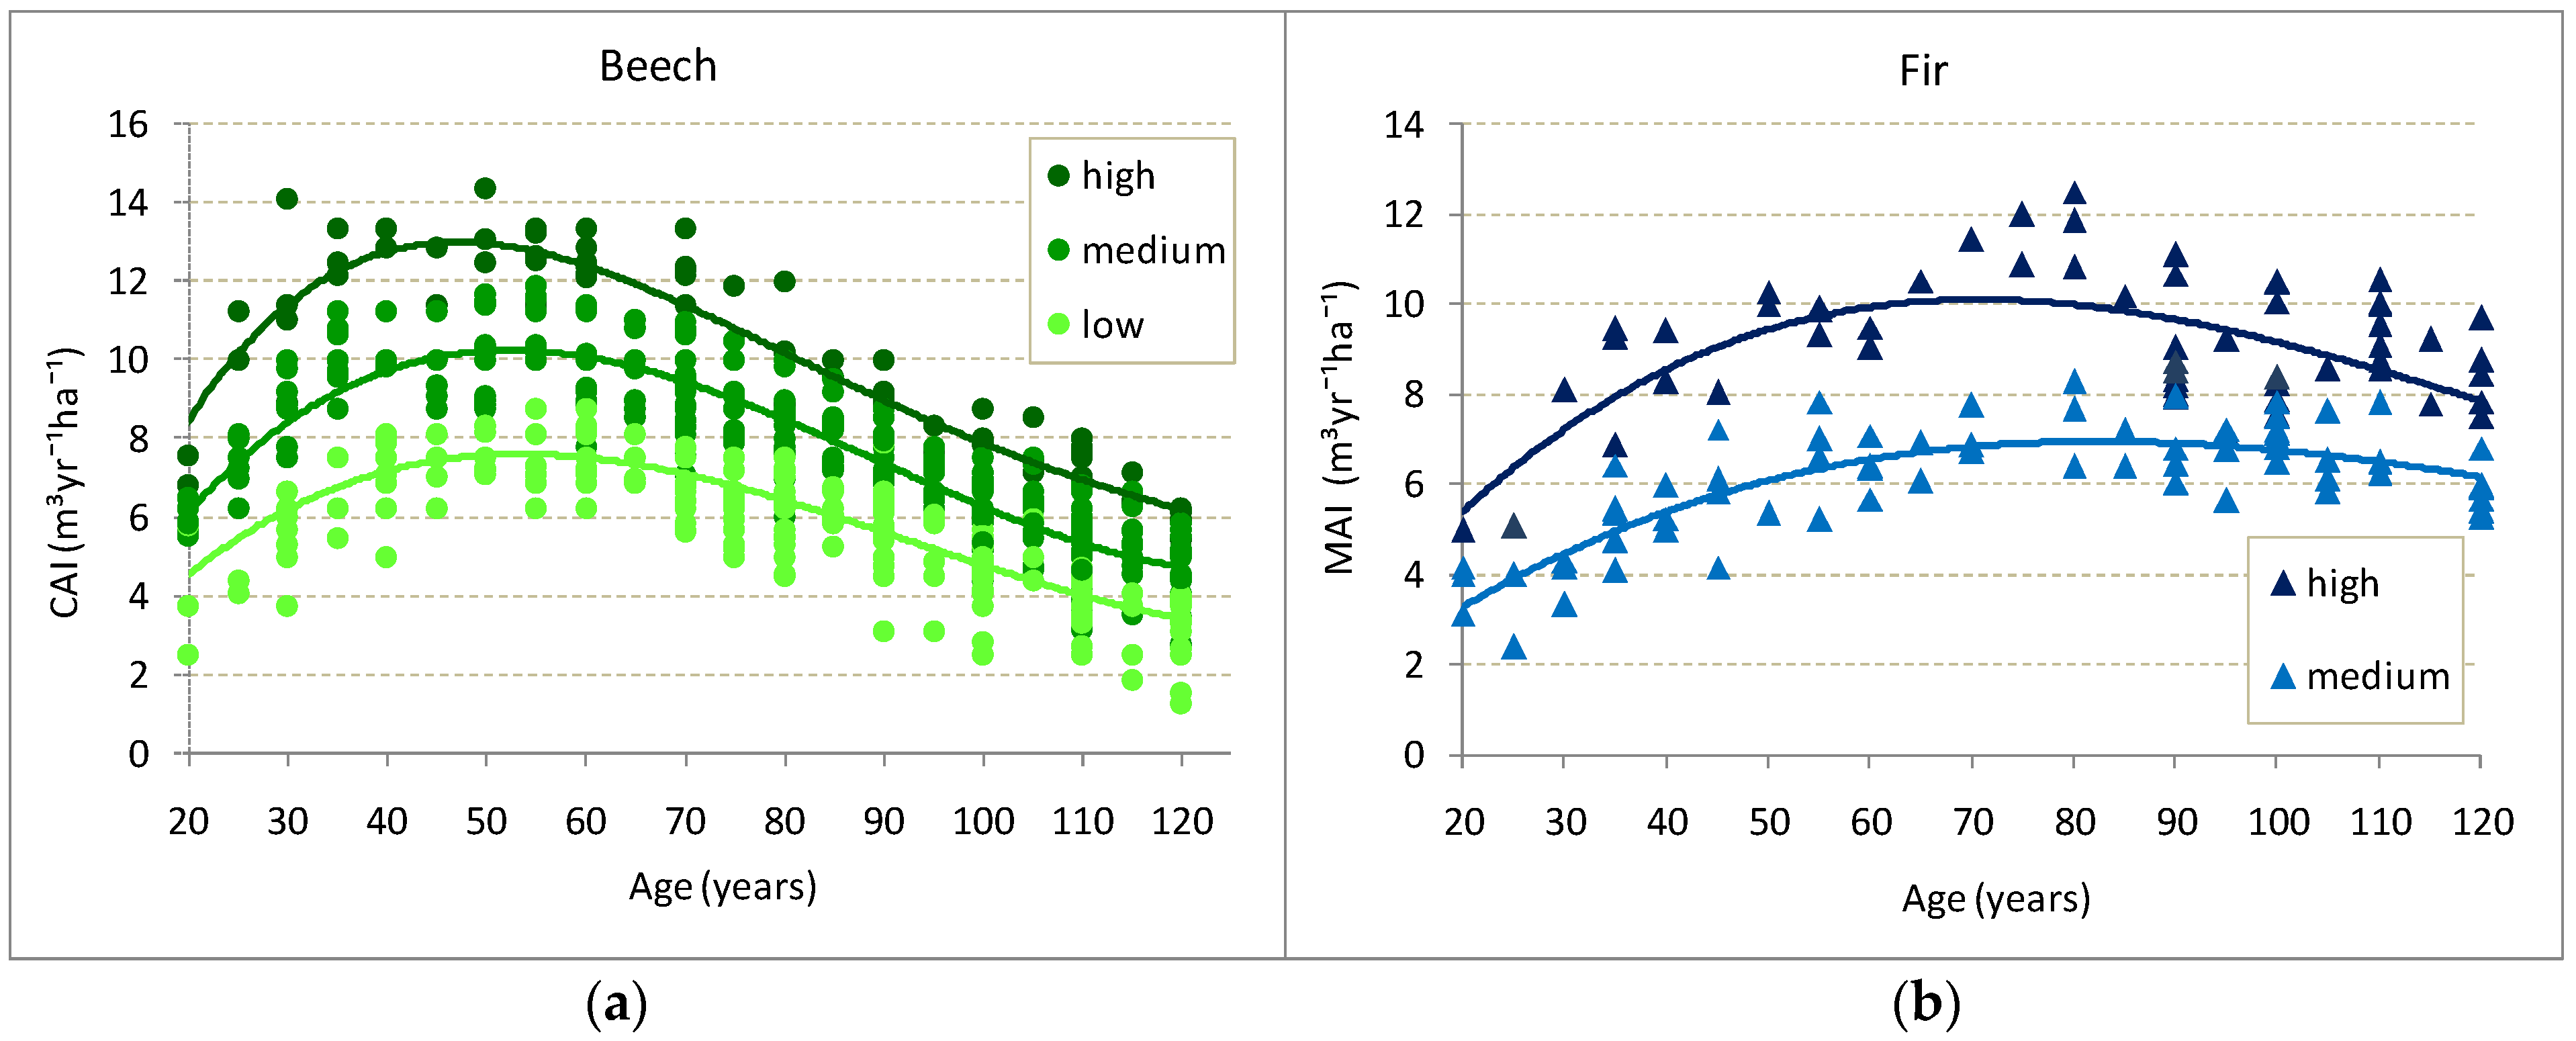
3.4. Volume Increment of the Stand

In the studied mixed stands, the spruce, fir, and beech achieved maximum CAI at ages around 50 years. The high-productivity stands achieved maximum CAIs relatively earlier (around the age of 40 years) compared to the lower-productivity stands.
The maximum MAI is achieved later than the maximum CAI, at ages between 60 and 80 years. MAI is dependent on the accumulated volume of stands and their age, but, as with CAI, it varies in relation to the site conditions. The dynamics of CAI and MAI were captured by a polynomial (model 3), whose parameters are expressed by three equations (for CAI) and two equations (for MAI) (see the Table S1a,b from Supplementary Materials).
CAI and MAI had the highest values in high-productivity sites (Figure 7). The CAI and MAI values explain between 68% and 94% of age variation (between 10 and 120 years).
The regression equations for MAI and CAI, by species, allow the development of models for mixed stands in which spruce, fir, and beech species can participate in different proportions (20–60%). Such models are shown in Figure 8 for six species-mixture types (six equations for CAI and six equations for MAI) (see the Table S1a,b from Supplementary Materials for all 12 equations).

3.5. Precision of Models

The most suitable equations for estimating the site’s productivity were selected using the values of the statistical parameters. Table 4 shows examples of regression equations for each variable. Most of the models estimate around 95% of the variable’s variance, and the estimated parameters are significant (p-value < 0.05) (see the Table S1c from Supplementary Materials for all equations). Although in the case of MAI, for beech and fir, lower values of R2 were recorded, the models were accepted based on the analysis of statistical indicators and the graphs of the residual values. For all indicators, the predictive values are in the normal variation of growth in relation to age and seasonal conditions and reflect the growth and development processes of stands.

4. Discussion

The stability of the stands is an essential objective pursued in forest management. This requires detailed knowledge of the components of the site, so that, through design decisions, the best management measures are established. Knowing the degree to which a site is becoming more or less favorable to forest species is one condition for ensuring the stability of stands and forests. The favorability of a site can be assessed indirectly through the values of the main characteristics of the stands. They can differentiate the productivity potential of the sites.
In this study, several parameters were analyzed that considered the complex structures in the vertical plane, which are generally achieved by the stands of mixed beech-coniferous formation. The age of the stands in such structures may provide little indication of the potential of a site and the productivity of the stands. A peculiarity of mixed stands is that the spruce, fir, and beech can behave differently when compared to pure stands. In mixed stands, volume losses can be recorded in one species but compensated for by increasing the volumes of the other species [24,25,26]. The sites are more advantageous in such stands. Other studies conducted in mixed stands of spruce and fir [27,28] found a higher productivity in beech in mixed stands, or spruce and fir [29], and that mixed beech-coniferous stands, under the same site conditions, are 20% more productive than pure stands [25,30].
However, the specific relationship between the site and the dendrometric characteristics of the stands (e.g., T, h, CAI, and other variables) also depends on factors other than site and species [13,14]. The relative height at a reference age is one of the most commonly used indicators in determining productivity potential [13,14]. The height growth of dominant trees is independent of stand density [15]. Recent research has modeled the height of dominant and codominant spruce in Romania [31]. The accuracy of the obtained parsimonious models justifies their use in forestry applications. In the researched mixed stands, at the level of the three analyzed species, the dominant height predicted by the models reflected the sites productivity very well. Thus, for spruce, at the age of 100, the predicted height of the models is 35.1 m for high-productivity sites, 29.6 m for medium productivity, and 24.8 m for low productivity. Average height, while an indicator of site productivity especially in pure stands [32], has nevertheless been proven to be relevant in the case of mixed multi-aged stands. Compared to the average height values for pure stands provided by the Romanian yield tables [32], only fir in the mixed stands showed an increase in height values that approached the upper limits of the yield classes. Therefore, even in mixed stands, average height can be used to differentiate between sites but only under normal conditions of density. In dense, short-lived stands, it can lead to an overestimation of productivity, just as, in those with low density, it can lead to underestimation [33]. The average height, expressed in relation to the average diameter, also differentiates the productivity of sites, but its dynamics are still influenced by stand density [33]. Therefore, in this study, other indicators that were less influenced by stands density were considered, based on the relationships between the biometric characteristics of the trees. Thus, the FH of the stand in relation to age and diameter was also analyzed. The silvicultural works that lead to the spacing of the stands determine the increase in the basal-area increment and, implicitly, the volume of the trees. However, the FH is in a very close relationship with the age and site conditions. It is deduced from the V/G ratio, and these variables result from the growth of the stand in diameter and height. Thus, in the size of the FH of the stand, both the height increment of the stand and the basal-area increment are introduced, both being elements dependent on the productivity of the site. Thus, the FH of the stand becomes an indicator that can accurately characterize the productivity of the site. It is independent of the effects of management measures because, through the V/G ratio, their effects are nullified. The resultant models fitted the data well, with the equation parameters being significant (p < 0.05). In general, the developed equations that estimate this indicator had values of R2 between 0.90 and 0.97, except for spruce and beech as it is the case of the fhg–dg relationship (for which the R2 values were lower, between 0.82 and 0.98).
BAI can be considered a useful measure of productivity [15,19]. For estimating productivity, we also considered an indicator based on the basal area (i.e., Rhgg) to be relevant, its size depending on the diameter increment. In turn, it is dependent not only on age and site conditions but also on the density of the stand. Because density decreases with age and differs from the site conditions, Rhgg can provide information on the site’s productivity. Rhgg values decrease not only with increasing age or diameter but also with the productivity of the sites. Therefore, they can be used at a benchmark age. However, Rhgg is influenced by the silvicultural works applied. The functions expressing Rhgg variation have R2 values of between 0.89 and 0.98.
The basal area may depend on several factors, including site conditions, stand age, and the ecological requirements of the species [8,34], but its variation is reflected in the size of the mean-basal-area tree, as a result of different site conditions. At the same size of basal area, high-volume values indicate a higher productivity and a high productivity potential for the sites. Therefore, Equations (65)–(73) (please see Table S1b from Supplementary Materials), which express the variation in the volume of the mean tree (vg) in relation to its basal area (gg), can be used to estimate the productivity of the sites (R2 > 0.96).
The maximum MAI is a characteristic of each species and is an expression of the site conditions. As with other indicators in its size, the influence of stand density also indirectly affects it, so its values are relevant only for stands with densities as close as possible to the normal values. CAI and MAI models (for both individual species—Figure 7—and the three-species mixture—Figure 8) predict CAI and MAI for stands with a density of 1.0. For the spruce from the researched mixed stands, located in higher-productivity sites, the models estimate values of MAI higher by up to 16% compared to the MAI values deducted from standing volume, indicated for spruce-pure stands, provided by the Romanian yield tables [32]. In the case of stands located in medium-productivity sites, the differences reach +10%. For fir, the differences reach +19% in the case of stands located in high-productivity sites, and +3% in the case of stands located in medium-productivity sites. For the beech located in higher-productivity sites, the models indicate MAI values 2% lower than the beech from pure stands located in sites of the same productivity, and 1% lower in the case of beech from medium-productivity sites, compared to the pure-stand values indicated by the yield tables [32]. In mixed stands, three species (spruce, fir, and beech) achieved the maximum MAI at the same ages as the pure stands, information collected form the yield tables [32]. As MAI, the CAI values estimated by the models follow the trend expressed by the Romanian yield tables [32] for pure stands. For the tree species in the mixed stands, the models indicate CAI values 20% higher than the CAI values deduced from standing volumes indicated by the yield tables [32] for pure stands. The maximum CAI is achieved later, after 5–10 years, in the mixed stands compared to this moment captured in the yield tables [32] for pure stands. The CAI and MAI values from mixed stands, deduced from standing volume, are higher compared to those from pure stands indicated by the yield tables [32]. It is known that stands with multiple layers are susceptible to an increase in standing volume and also the CAI and MAI can be influenced by the applied silvicultural works.
Practical Applicability and Limitations of the Models. The models allow the evaluation of the potential site’s productivity in relation to any of the spruce, fir, or beech species present in the species mixture. The indicators predicted by the models, disregarding the fact that they are generated for individual species, can be used to estimate the site productivity of mixed stands. This is possible because the values indicated by the models at the level of individual species incorporate the influence of a species mixture with a general composition of 40%NS 40%EB 20% SF(DS) and density around 0.8 (Table 1). The models can be applied in managed stands with this specific composition, having densities around 0.8, where systematic silvicultural treatments are performed. Only CAI and MAI models established for individual species could be used to generate CAI and MAI models for three-species-mixture types. CAI and MAI models (for both individual species and the three-species mixture) predict CAI and MAI for stands with a density of 1.0. If used for stands with other densities, the values indicated by the models must be corrected with the real density of each species. Using CAI and MAI models in the case of pure stands could overestimate the potential site productivity. It is known that the reduction of the stand’s density causes increases in the basal area and implicitly in the volume. Thus, especially in low-density stands, the vg and fhg indicators, and less hg, are suitable. In the case of sites with young and middle-aged stands, the Rhgg is the most appropriate indicator. Its values can be considered an indicator of the site’s productivity at the reference age of 50 years. For the other indicators, taking into account the longevity and the dynamics of the mixed stands, an age of 100 years (known in the literature as the reference age in the case of even-aged stands) can be considered [32]. The diameter can be used as an indicator instead of age.
The present research should be detailed and further analyzed. We can say that the models are valid only for the estimation of the site productivity in the case of mixed stands with a similar structure to those that were the basis of the research.
The analyzed indicators indirectly estimated the productivity site’s potential. However, their use does not exclude the possibility of estimating the potential of the site directly, by analyzing its edaphic components.

5. Conclusions

Site productivity is directly reflected in the dendrometric characteristics of trees and stands. The tree overstory faithfully expresses the productivity potential of the site, such that, if the amplitude of the natural factors changed, their dendrometric characteristics would vary. These factors are specific to a particular site and influence the development of stands. Thus, the dendrometric characteristics of the trees, expressed in mathematical relations, lead to relevant indicators for estimating the productivity of the sites. In the case of mixed stands, the potential productivity of a site is exploited differently by the species participating in the mixture. In different stand structures, the site may be more favorable for some species to the detriment of others. Between species, interpopulation, competitive and favorable relations are established, which lead to the definition of functional structures. While the height of one dominant species reflects the favorability of a site for that species, the other species may indicate a lower level of productivity, even though, overall, such stands have superior organization and great stability. Therefore, in order to express the site productivity of mixed multi-aged stands, the entire species mixture should be taken into consideration. Other indicators that include the production and growth of stands may be relevant for estimating the site productivity from mixed stands. The FH of a stand is the result of the accumulation in stand volume, as a result of the growth of the two variables, basal area and stand height. It is independent of the effect of applied silvicultural measures and can differentiate the productivity of sites. The MAI is a relevant indicator for estimating the productivity of sites at a benchmark age, but it is still based on knowing the age of the stands. However, MAI and CAI can be modeled on mixture types in relation to the proportion of species participation in the mixture. Species indicators obtained through models developed from mixed stands, incorporate the characteristics of those mixtures.

Supplementary Materials

The following are available online at https://www.mdpi.com/article/10.3390/f12050549/s1, Table S1a: Regression equation for each indicator and species of model 1, model 2 and model 3; Table S1b: Statistical characteristics of model 1, model 2 and model 3, Equations (S2)–(S88); Table S1c: Models species-mixing, Equations (S89)–(S100).

Author Contributions

Conceptualization, G.-M.T.; data curation, A.C. and M.B.; formal analysis, A.C. and G.-M.T.; investigation, A.C., G.-M.T., and M.B.; methodology, A.C. and G.-M.T.; project administration, A.-C.D.; software, A.C. and M.B.; supervision, G.-M.T., A.-C.D. and G.S.; validation, A.C. and G.-M.T.; visualization, M.B.; writing—original draft, A.C. and G.-M.T.; writing—review and editing, A.C., G.-M.T. and A.-C.D. All authors have read and agreed to the published version of the manuscript.

Funding

This research received no external funding.

Data Availability Statement

Not applicable.

Acknowledgments

This study was based on data from forest management plans developed by the “Marin Drăcea” Romanian National Institute for Research and Development in Forestry in 2015 and 2018. We appreciate the difficult fieldwork performed by our colleagues, which was undertaken to collect the dataset in the forest management plans. To them, we also express our gratitude.

Conflicts of Interest

The authors declare no conflict of interest.

References

  1. Chiriță, C.; Vlad, I.; Păunescu, C.; Pătrășcoiu, N.; Roșu, C.; Iancu, I. Stațiuni Forestiere; Editura Academiei Republicii Socialiste România: București, Romania, 1977; pp. 20–100, 158–169. [Google Scholar]
  2. Târziu, D.; Spârchez, G. Soluri și Stațiuni Forestiere; Editura Universității Transilvania: Brașov, Romania, 2013; pp. 104–109. ISBN 978-606-19-0260-6. [Google Scholar]
  3. Seynave, I.; Gégout, J.C.; Hervé, J.C.; Dhôte, J.F.; Drapier, J.; Bruno, E.; Dumé, G. Picea abies site index prediction by environmental factors and understorey vegetation: A two-scale approach based on survey databases. Can. J. For. Res. 2005, 35, 1669–1678. [Google Scholar] [CrossRef]
  4. Jensen, J.; Rasmussen, L.; Raulund-Rasmussen, K.; Borggaard, O. Influence of soil properties on the growth of sycamore (Acer pseudoplatanus L.) in Denmark. Eur. J. For. Res. 2008, 127, 263–274. [Google Scholar] [CrossRef]
  5. Kobal, M.; Grčman, H.; Zupan, M.; Levanič, T.; Simončič, P.; Kadunc, A.; Hladnik, D. Influence of soil properties on silver fir (Abies alba Mill.) growth in the Dinaric Mountains. For. Ecol. Manag. 2015, 337, 77–87. [Google Scholar] [CrossRef] [Green Version]
  6. Fajardo, A.; Mcintire, E.J.B. Distinguishing microsite and competition processes in tree growth dynamics: An a priori. Am. Nat. 2007, 169, 647–661. [Google Scholar] [CrossRef] [PubMed]
  7. Phillips, J.D.; Marion, D.A. Biomechanical effects, lithological variations, and local pedodiversity in some forest soils of Arkansas. Geoderma 2005, 124, 73–89. [Google Scholar] [CrossRef]
  8. Scharenbroch, B.C.; Bockheim, J.G. Pedodiversity in an old-growth northern hardwood forest in the Huron Mountains, Upper Peninsula, Michigan. Can. J. For. Res. 2007, 37, 1106–1117. [Google Scholar] [CrossRef]
  9. La Roi, G.H.; Strong, W.L.; Pluth, D.J. Understory plant community classifications as predictors of forest site quality for lodgepole pine and white spruce in west-central Alberta. Can. J. For. Res. 1988, 18, 875–887. [Google Scholar] [CrossRef]
  10. Strong, W.L.; Pluth, D.J.; La Roi, G.H.; Corns, I.G.W. Forest understory plants as predictors of lodgepole pine and white spruce site quality in west-central Alberta. Can. J. For. Res. 1991, 21, 1675–1683. [Google Scholar] [CrossRef]
  11. Bergès, L.; Chevalier, R.; Dumas, Y.; Franc, A.; Gilbert, J.M. Sessile oak (Quercus petraea Liebl.) site index variations in relation to climate, topography and soil in even-aged high-forest stands in northern France. Ann. For. Sci. 2005, 62, 391–402. [Google Scholar] [CrossRef] [Green Version]
  12. Beldie, A.; Chiriță, C. Flora Indicatoare din Pădurile Noastre; Editura Agro-Silvică: București, Romania, 1960; pp. 15–25, 113–141, 159–161. [Google Scholar]
  13. Skovsgaard, J.P.; Vanclay, J.K. Forest site productivity: A review of the evolution of dendrometric concepts for even-aged stands. Forestry 2008, 81, 13–31. [Google Scholar] [CrossRef] [Green Version]
  14. Skovsgaard, J.P.; Vanclay, J.K. Forest site productivity: A review of spatial and temporal variability in natural site conditions. Forestry 2013, 86, 305–315. [Google Scholar] [CrossRef]
  15. Berrill, J.; O’Hara, K.L. Estimating site productivity in irregular stand structures by indexing the basal area or volume increment of the dominant species. Can. J. For. Res. 2014, 44, 92–100. [Google Scholar] [CrossRef]
  16. Jiang, H.; Radtke, P.J.; Weiskittel, A.R.; Coulston, J.W.; Guertin, P.J. Climate- and soil-based models of site productivity in eastern US tree species. Can. J. For. Res. 2015, 45, 325–342. [Google Scholar] [CrossRef]
  17. Del Río, M.; Pretzsch, H.; Alberdi, I.; Bielak, K.; Bravo, F.; Brunner, A.; Condés, S.; Ducey, M.J.; Fonseca, T.; Von Lüpke, N.; et al. Characterization of the structure, dynamics, and productivity of mixed-species stands: Review and perspectives. Eur. J. For. Res. 2016, 135, 23–49. [Google Scholar] [CrossRef]
  18. Socha, J.; Tyminska-Czabanscka, L.; Grabska, E.; Orzel, S. Site index models for main forest-forming tree species in Poland. Forests 2020, 11, 301. [Google Scholar] [CrossRef] [Green Version]
  19. Fu, L.; Sharma, R.P.; Zhu, G.; Li, H.; Hong, L.; Guo, H.; Duan, G.; Shen, C.; Lei, Y.; Li, Y.; et al. Basal Area Increment-Based Approach of Site Productivity Evaluation for Multi-Aged and Mixed Forests. Forests 2017, 8, 119. [Google Scholar] [CrossRef] [Green Version]
  20. Pokharel, B.; Froese, R.E. Representing site productivity in the basal area increment model for FVS-Ontario. For. Ecol. Manag. 2009, 258, 657–666. [Google Scholar] [CrossRef]
  21. Vanclay, J.K. Assessing site productivity in tropical moist forests. For. Ecol. Manag. 1992, 54, 257–287. [Google Scholar] [CrossRef] [Green Version]
  22. Tudoran, G.; Zotta, M. Adapting the planning and management of Norway spruce forests in mountain areas of Romania to environmental conditions including climate change. Sci. Total Environ. 2019. [Google Scholar] [CrossRef]
  23. Marin, D. Amenajamentul U.P. I și II (O.S. Făgăraș), 2018. Amenajamentul U.P. I și II (O.S. Brașov), Romania, 2015. Romanian National Institute for Research and Development in Forestry. Available online: http://www.rosilva.ro/articole/amenajamente_silvice__p_2645.htm (accessed on 26 October 2020).
  24. Bosela, M.; Lukac, M.; Castagneri, D.; Sedmák, R.; Biber, P.; Carrer, M.; Konôpka, B.; Nola, P.; Nagel, T.A.; Popa, I.; et al. Contrasting effects of environmental change on the radial growth of co-occurring beech and fir trees across Europe. Sci. Total Environ. 2018, 615, 1460–1469. [Google Scholar] [CrossRef] [PubMed]
  25. Hilmers, T.; Avdagić, A.; Bartkowicz, L.; Bielak, K.; Binder, F.; Bončina, A.; Dobor, L.; Forrester, D.I.; Hobi, M.L.; Ibrahimspahić, A.; et al. The productivity of mixed mountain forests comprised of Fagus sylvatica, Picea abies, and Abies alba across Europe. Forestry 2019, 92, 512–522. [Google Scholar] [CrossRef] [Green Version]
  26. Pretzsch, H.; Hilmers, T.; Uhl, E.; Bielak, K.; Bosela, M.; del Rio, M.; Dobor, L.; Forrester, D.I.; Nagel, T.A.; Pach, M.; et al. European beech stem diameter grows better in mixed than in mono-specifc stands at the edge of its distribution in mountain forests. Eur. J. For. Res. 2020, 140, 127–145. [Google Scholar] [CrossRef]
  27. Pretzsch, H.; Block, J.; Dieler, J.; Dong, P.H.; Kohnle, U.; Nagel, J.; Spellmann, H.; Zingg, A. Comparison between the productivity of pure and mixed stands of Norway spruce and European beech along an ecological gradient. Ann. For. Sci. 2010, 67, 712. [Google Scholar] [CrossRef] [Green Version]
  28. Bosela, M.; Tobin, B.; Šebeň, V.; Petráš, R.; Larocque, G.R. Different mixtures of Norway spruce, silver fir, and European beech modify competitive interactions in central European mature mixed forests. Can. J. For. Res. 2015, 45, 1577–1586. [Google Scholar] [CrossRef]
  29. Forrester, D.I.; Kohnle, U.; Albrecht, A.T.; Bauhus, J. Complementarity in mixed-species stands of Abies alba and Picea abies varies with climate, site quality and stand density. For. Ecol. Manag. 2013, 304, 233–242. [Google Scholar] [CrossRef]
  30. Pretzsch, H.; Biber, P.; Uhl, E.; Dauber, E. Long-term stand dynamics of managed spruce–fir–beech mountain forests in Central Europe: Structure, productivity and regeneration success. Forestry 2015, 88, 407–428. [Google Scholar] [CrossRef]
  31. Strimbu, B.M.; Amarioarei, A.; Paun, M. Nonlinear parsimonious forest modeling assuming normal distribution of residuals. Eur. J. For. Res. 2021. [Google Scholar] [CrossRef]
  32. Giurgiu, V.; Drăghiciu, D. Modele Matematico-Auxologice și Tabele de Producție Pentru Arborete; Editura Ceres: București, Romania, 2004; pp. 544–623. [Google Scholar]
  33. Giurgiu, V. Dendrometrie şi Auxologie Forestieră; Editura Ceres: București, Romania, 1979; pp. 126–568. [Google Scholar]
  34. Kerr, G. Effects of spacing on the early growth of planted Fraxinus excelsior L. Can. J. For. Res. 2003, 33, 1196–1207. [Google Scholar] [CrossRef]
Figure 1. Location of forest management units.
Forests 12 00549 g001
Figure 2. Research method. The method was applied at the level of a 507.07 ha key area. For the soil study, samples were taken from soil profiles to determine the physicochemical properties. At the key area, the sites were identified based on soil characteristics, herbaceous plants, and stand layer. Each stand was studied as a whole. Several relevant biophysical parameters, with roles in each stand structure description, were determined. The models developed at the level of the key area differentiated three representative sites for mixed beech-coniferous stands and correctly estimated their productivity, so that the application of the models was extended to the level of the study area of 9107.79 ha. For similar sites in the study area, the models generated at the key-area level estimated the same level of productivity.
Forests 12 00549 g002
Figure 3. Relationship between dominant height (hdom) and age in spruce (a) and between average height and average diameter (dg) in fir (b).
Forests 12 00549 g003
Figure 4. Relationship between form height (fhg) and age in beech (a) and between form height (fhg) and diameter in fir (b).
Forests 12 00549 g004
Figure 5. Relationship between Rhgg and age (a) and between Rhgg and average diameter (dg) (b) in beech.
Forests 12 00549 g005
Figure 6. Relationship between mean tree volume (vg) and basal area (gg) in spruce (a) and beech (b).
Forests 12 00549 g006
Figure 7. Current annual volume increment (CAI) for beech (a) and mean annual volume increment (MAI) for fir (b).
Forests 12 00549 g007
Figure 8. Current annual volume increment (CAI) (a) and mean annual volume increment (MAI) (b) for mixed stand with the following compositions 40%NS 40%SF 20%EB, 20%NS 20%SF 60%EB, 30%NS 30%SF 30%EB, located in medium–high productivity sites (NS–spruce, SF–fir, EB–beech) .
Forests 12 00549 g008
Table 1. Abbreviations for the used tree variables, their units, and a short description.
Abbreviation VariablesUnitsDescription
hdommAverage height of dominant trees
hgmHeight of tree with dg (height of mean-basal-area tree)
fhg or FHForm height of mean-basal-area tree ( f h g = v g g g ) or form height of stand ( F H = V G )
Vm3ha−1Volume of stand
Gm2ha−1Basal area of stand
RhggHeight to basal area ratio (hg/gg)
vm3Volume of tree
CAIm3ha−1year−1Current annual volume increment
MAIm3ha−1year−1Mean annual volume increment
TyearsStand age (or age of mean-basal-area tree)
dgcmMean squared diameter or quadratic mean diameter (diameter corresponding to mean basal area of stand or diameter of the mean-basal-area tree)
vgm3Volume of mean-basal-area tree
gm2Basal area of tree (g or ba)
ggm2Mean basal area of stand ( g = G N )
Table 2. General characterization of the studied area.
ParametersClassesTotal
Altitude (m)800–10001001–12001201–14001401–1600
Area (%)6015214100
SpeciesEuropean beechSilver firNorway spruceDeciduous species
Area (%)4211443100
Density0.1–0.20.3–0.40.5–0.60.7–0.80.9–1.0
Area (%)2577160.78
ExposureShaded (N, NE)Sunny (S, SW)Semi-shaded (E, SE, W, NW)
Area (%)114940100
Inclination (degrees)<1516–3031–40>40
Area (%)644491100
Age class (20 years)IIIIIIIVVVIVII
Areaha336.16613.811167.051475.321874.011456.442185.009107.79
%471316201624100
Notes: European beech (EB), silver fir (SF), Norway spruce (NS), deciduous species (DS)–common silver birch, sycamore, common ash, wych elm.
Table 3. Statistical descriptors of models.
ModelVariableSpeciesSiteEquation
yxSymbolLevel QualityNumberabcd
1hdom (m)Age (years)Spruce3.3.3.3High(2)1.03230.5606−0.0024
hg (m)Age (years)Spruce3.3.3.3High(8)−1.23500.5693−0.0024
hg (m)dg (cm)Fir3.3.3.3High(14)−0.63481.0646−0.0086
fhg (m)Age (years)Beech3.3.3.1Low(31)0.34950.1725−0.0006
fhg (m)dg (cm)Fir3.3.3.2Medium(24)−0.98490.5511−0.0057
vg (m3)gg (m2)Spruce3.3.3.3High(62)−0.173714.7945−5.6659
2hg/ggAge (years)Beech3.3.3.2Medium(48)1137.369–0.0157
hg/ggdg (cm)Beech3.3.3.3High(38)1462.454–0.0452
3CAI (m3year−1ha−1)Age (years)Beech3.3.3.1Low(67)−1.30320.3843−0.00501.776 × 10−5
MAI (m3year−1ha−1)Age (years)Fir3.3.3.2Medium(77)0.42590.1785−0.00153.165 × 10−6
Table 4. Statistical descriptors of models.
ModelSpeciesVariableSiteEquationR2R2 Adjusted RMSEMAEMAPE(%)AIC
yxSymbolLevel QualityNumber/(p)abcd
1Firhdom (m)Age (years)3.3.3.3High(5)6.0340.4063070.9470.9461.1230.9123071.123
p3.32 × 10−78.28 × 10−261.11 × 10⁻¹¹
Sprucehdom (m)Age (years)3.3.3.2Medium(9)−3.5620.62415810.9670.9671.2591.02615811.259
p2.20 × 10−244.29 × 10−2253.25 × 10−147
Beechhg (m)Age (years)3.3.3.3High(11)−1.70570.53164.050.9770.9771.0720.8254.05734
p8.24 × 10−59.63 × 10−1291.18 × 10−82
Firhg (m)Age (years)3.3.3.2Medium(15)−2.73470.46494.880.9760.9751.130.9324.88281
p1.95 × 10−52.60 × 10−405.20 × 10⁻²¹
Sprucehg (m)Age (years)3.3.3.2Medium(18)−4.07480.54626.3480.9640.9641.2941.0536.3481566
p9.74 × 10−341.03 × 10−2031.87 ×10−121
Sprucehg (m)dg (cm)3.3.3.3High(26)−2.02721.19123.7520.9440.9441.3271.0143.752934
p0.00033.93 × 10−931.46 × 10−60
Firfhg (m)dg (cm)3.3.3.2Medium(33)−0.98490.55116.2020.9530.9530.6430.5226.202334
p8.34 × 10−102.80 × 10−625.18 × 10−39
Beechfhg (m)dg (cm)3.3.3.2Medium(39)−0.64270.22735.1340.9320.9320.6790.5655.1341307
p0.00044.91 × 10−2121.40 × 10−118
Firfhg (m)Age (years) 3.3.3.2Medium(42)−1.18260.245.2760.9700.9690.5950.4705.276149
p0.00027.55 × 10−431.40 × 10⁻²⁷
Sprucefhg (m)Age (years)3.3.3.2Medium(45)−1.18540.25375.830.9480.9480.5590.4555.83695
p5.50 × 10−121.06 × 10−1546.99 × 10−98
Beechvg (m3)gg (m2)3.3.3.3High(65)−0.089512.8754.4720.9950.9950.070.0534.472−658
p5.27 × 10−147.51 × 10−1084.96 × 10−14
Beechvg (m3)gg (m2)3.3.3.2Medium(66)−0.075611.94784.4040.9890.9890.0830.0644.404−1368
p2.80 × 10−118.92 × 10−1627.79 × 10−16
3BeechCAI (m3year−1ha−1)Age (years) 3.3.3.2Medium(75)−2.20680.55089.1232.775 × 10−50.8440.8430.8070.5979.1232078
p2.41 × 10−58.98 × 10−1076.52 × 10−983.48 × 10−74
FirCAI (m3year−1ha−1)Age (years)3.3.3.2Medium(78)−4.2880.792112.824.006 × 10−50.8110.8071.3171.00112.82478
p9.08 × 10−77.51 × 10−258.24 × 10−227.51 × 10⁻¹⁷
Publisher’s Note: MDPI stays neutral with regard to jurisdictional claims in published maps and institutional affiliations.

