Article

Wood Anatomical Traits Reveal Different Structure of Peat Bog and Lowland Populations of Pinus sylvestris L. in the Carpathian Region

1
Department of Botany, Institute of Agronomy, Hungarian University of Agriculture and Life Sciences, H-1118 Budapest, Hungary
2
Department of Applied Statistics, Institute of Mathematics and Basic Science, Hungarian University of Agriculture and Life Sciences, H-1118 Budapest, Hungary
3
Department of Tree Breeding, Forest Research Institute, H-9600 Sárvár, Hungary
4
Centre for Ecological Research, Danube Research Institute, H-1113 Budapest, Hungary
*
Author to whom correspondence should be addressed.
Forests 2021, 12(4), 494; https://doi.org/10.3390/f12040494
Submission received: 17 March 2021 / Revised: 8 April 2021 / Accepted: 11 April 2021 / Published: 16 April 2021

Abstract

:
Ecologically extreme habitats at a species’ distribution edges bear significance for biota under adverse climatic conditions and climate change. Range-edge populations adjust their functional traits to the special local ecological conditions, leading to increased intraspecific variability in their morpho-anatomical structure and, consequently, favor population survival in the absence of competitors. On the basis of wood anatomical traits, such as tracheid lumen area (CA), cell wall thickness (CWTrad), cell diameter-to-radial cell wall thickness ratio (CD/CWT), and the number of tracheids in the radial tracheid files (TNo), we investigated the xylem adjustment of Pinus sylvestris L. populations from six ecologically extreme habitats from the Eastern Carpathians and the Pannonian Basin. Results indicated significant differences among all studied sites in case of all wood anatomical traits as signs of the local adaptation of trees. Peat bog populations adapted their wood anatomical traits to the generally hydric, cool and anaerobic conditions of the peat bogs, exhibiting smaller CA and proportionally thick CWTrad to ensure the hydraulic safety of the stem, whereas, on the lowland site, trees were characterized by a more effective water-conducting system, developing larger CA with relatively thin CWTrad with lower carbon-per-conduit-costs at the expense of higher vulnerability to cavitation. Radial tree ring growth and TNo also differed markedly among sites, following the temperature and groundwater constraints of the habitats. Wood anatomical variability among tree rings and the corresponding short-term climate response of populations differed from the adaptive responses of the trees to the ecological characteristics of the habitat. In addition to the different phylogeographic origin evidenced in former studies, phenotypic differentiation by the habitat type of the studied populations linked to the variance in morpho-anatomical traits have contributed to the survival of the peripheral Scots pine populations at the species’ range margins.

1. Introduction

Ongoing climate change and the resulting interspecific competition lead to shifts in the geographic distribution of natural forest communities [1]. Cold tolerant species are predicted to expand their area of distribution towards the cooler regions of the poleward latitudes or to upslope elevations, causing local extinctions and population contractions at the southern periphery. Mostly, at the warmer range margins, populations of the cold tolerant species are expected to survive in small remnant habitats called refugia, where local conditions favor their persistence [2,3,4]. The term “refugia” originally referred to restricted full-glacial locations of temperate and high-latitude taxa [5]. Species’ survival in refuge habitats are receiving increasing attention today, as they serve as safe havens to which biota can retreat and persist under adverse climatic conditions [6]. However, sites with special local ecological characteristics where retreating populations are able to survive are also considered as being cryptic refugia [5], and such habitats are now particularly important for being identified and conserved, as they mitigate global biodiversity loss [6,7]. Species’ migration and the survival of populations due to in situ adaptive differentiation and selection within refugia strongly determine the properties of remnant communities [8,9]. When populations are at a species’ range edge, adaptive processes strongly depend on genetically coded functional traits, affecting fitness, growth, reproduction and survival [10,11]. Adaptation of species and populations to climate constraints may lead to increased intraspecific variability imprinted in the morpho-anatomical traits of populations. Wood anatomical characteristics of tree species are among the most important indicators, as trees have to adjust their xylem to the ecological conditions of the habitats, including water regime and seasonal and interannual climate variations [12].
Pinus sylvestris L. is one of the most important forest tree species of the Eurasian taiga. Its distribution spans more than 14,000 km, extending from the Iberian Peninsula towards the Siberian plain, reaching its easternmost distribution edge at the Okhotski Sea [13,14]. At the southern limit of its distribution range where, during the Pleistocene, it was more widespread, it is represented only by fragmented, island-like populations. In these regions following the Last Glacial Maximum, the warming of the climate and autogenic succession favored broadleaved competitors, forcing the Scots pine southern limit populations to fragmentation, long-term isolation and, finally, to genetic differentiation [15,16,17]. Isolation in several southern European refugia is probably responsible for the genetic diversity of modern-day populations, and for the high ecological plasticity, with which the species was able to survive in a multitude of environmental conditions, plant communities and diverse habitat types [18,19]. Such fragmented, peripheral populations are found also in East-Central Europe, in the Carpathians, growing in peatbogs with elevated groundwater table, or sustaining on sunny rocky outcrops with shallow soil layer. Small populations have also survived on the lowland area of the Pannonian Plain, where populations persist on calcareous sandy substrates with low nutrient content [20,21,22]. Despite the ongoing fragmentation and isolation, molecular genetic studies of these peripheral populations have revealed high population genetic diversity. Moreover, former molecular studies could detect two main genetic lineages that originate from two divergent glacial refugia; one extending from the Western Carpathians towards the Eastern Alps and another in the Eastern Carpathians [16,23]. Aside from their peculiar spatial genetic structure and diversity, Carpathian populations exhibit considerable phenotypic variation in both morphological and anatomical traits, most probably as signs of local adaptation to different habitat types [24,25,26].
Tree rings are among the most important traits affecting individual tree fitness, as they are the main contributors to the radial growth performance of trees. Tree ring width and characteristics depend on the site conditions and interannual climate variations that are discussed in many dendrochronological and densitometry studies [27,28,29]. Furthermore, the fundament of wood increment, wood anatomy, may offer insights into ecological adaptation through diverse anatomical parameters and fine-scale time resolutions. Studies on central temperate and northern boreal Scots pine populations have revealed long-term wood cell structure chronologies influenced by inter- and intra-annual climatic variation [30,31,32]. Traits such as cell area (CA), cell diameter (CD), cell wall thickness (CWT), and cell number (Tno) have shown correlations with the current year climate and also depend on the climate variables of the preceding year. The above-listed parameters are also strongly affected by the site conditions [33,34]. Scots pine tracheids respond to interannual and seasonal droughts in the southern range periphery [35,36], to fluctuations in temperature and precipitation evidenced in the Mediterranean region [37,38], or to continental climate variations [39] at different altitudes [40,41] and soil moisture conditions [42]. These plastic responses are either indicators of direct wood structure adaptation to extreme climatic events (e.g., [42]), or they could be related to the optimized carbon allocation and hydraulic conditions of the trees at such circumstances (e.g., [37]). Beside altitude [41], latitudinal position [43], climatic zone [44] on such rear edge locations, Scots pine may adjust its anatomical features to special local site conditions, such as aridity [42,45], constant drought, or cessation of former irrigation [46,47]; these are usually intertwined with processes perceived in interannual climate variations, as mentioned before. Moreover, predicted global warming is expected to have further strong selective pressure, especially on these rear edge populations [48].
Study results referring to wood anatomical characteristics have been reported from a wide range of locations and habitat types at the southern periphery of Scots pine area, namely the Iberian Peninsula, the Swiss Alps, the Vitosha, and South Siberia. However, the specific migration history of the Carpathian and Pannonian populations, their expansion and retreat to different refugia, beside the “geographic and genetic” marks, has left imprints in the wood of anatomical traits of populations strongly affected by natural selection acting over extended periods of time.
In this study, we aimed to (i) reveal wood anatomical trait variation of refugial Scots pine populations from the edaphically extreme habitats of the Carpathians and the Pannonian Basin; (ii) characterize the level of adaptive differentiation in these fragmented, peripheral populations; and (iii) outline seasonal/interannual climate variations reflected by the measured anatomical parameters. The observed phenotypic differentiation sheds light on the adaptive strategy of this long-living woody tree species to extreme habitats facing climate change.

2. Materials and Methods

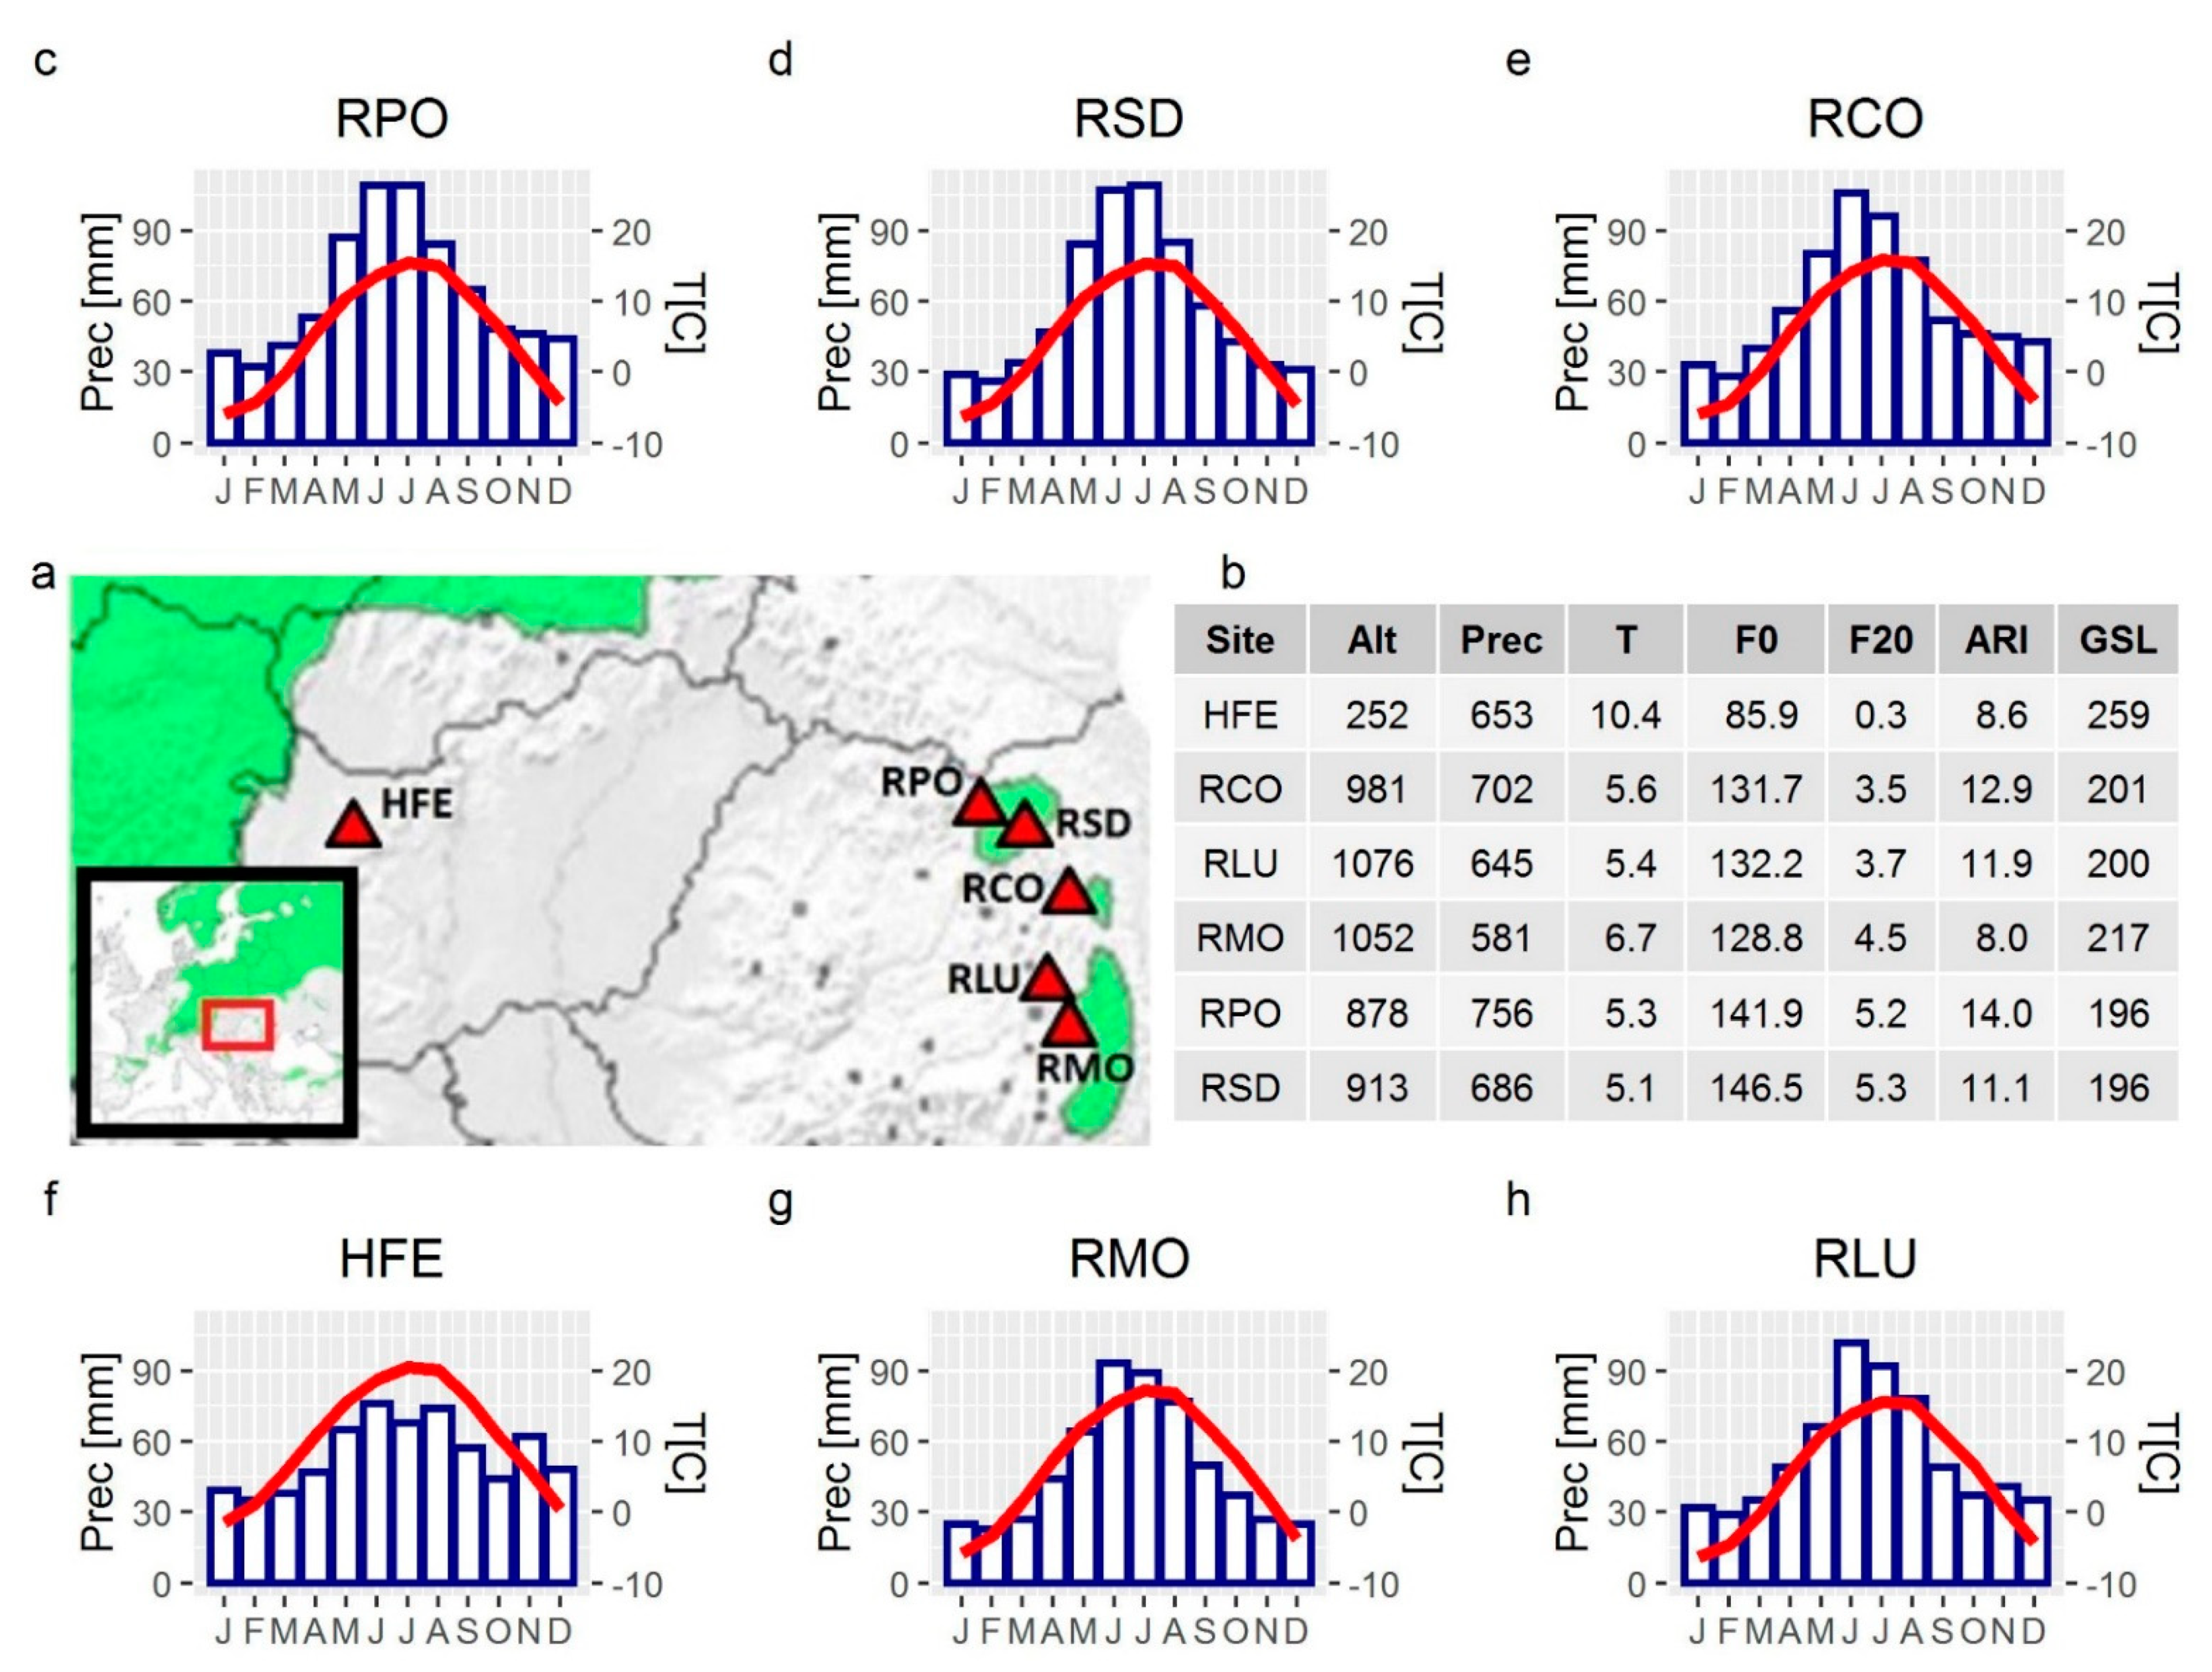
2.1. Study Sites, Sampling and Tree Ring Analyses

Six natural populations of Pinus sylvestris L. were sampled from the Carpathians and the Pannonian Basin in 2019 and 2020 (Romania: Suhardul Mic (RCO), Tinovul Luci (RLU), Băile Tusnad (RMO), Poiana Stampei (RPO), Saru Dornai (RSD), Hungary: Fenyőfő (HFE); Table 1, Figure 1). These fragmented populations in the southern margin of the natural range of the species grow in specific habitat types, such as peat bogs, dry rocky substrates or mixed forests sustaining on sandy soils and calcareous bedrock [1,20,21]. Populations were selected based on their nature conservation importance, as they are considered natural populations, sustaining on undisturbed remnant habitats. The edaphic and climatic properties of these habitats and the plant community characteristics are given in Table S1 and Figure 1, derived from the SoilGrids [49] and CARPATCLIM [50] databases, with 0.25 × 0.25 km and 10 × 10 km spatial resolution, respectively.
In total, 57 dominant, undamaged, mature trees were randomly sampled (about 10 trees per site, except RCO–Table 1). Most of the trees were of old age (Table 1). In the cases of RLU, RMO and RSD, considering their shorter generation times [51] and that trees are characterized by restricted apical growth, the sampled trees also appeared to be the oldest from these sites, representing the same mature ontogenetic phase related to the cessation of intense height growth rates [52,53]. Cores were taken with an increment borer at breast height, c. 1.3 m. Standard techniques in dendrochronology [54] were used to collect, transport and prepare the cores for tree ring width (TRW) measurements. After being glued to wooden mounts, cores were sanded and then scanned with a high resolution scanner at 2400 dpi resolution. For each core, we semiautomatically measured TRW series with the Image J 1.52 software [55], using the Object J plugin at a resolution of 0.01 mm. Visual cross-dating was verified using COFECHA [56].

2.2. Wood Anatomical Measurements

At least five tree cores from each site (except RCO) were selected for anatomical measurements from the cross-dated samples (Table 1). We preferred mature trees whose individual indexed TRW series highly correlated with the local mean chronology, in order to represent the common growth of the stands better. Five specific annual rings (1990, 1991, 1992, 1993, 2010) were selected for anatomical measurements, based on their climatic characteristics derived from the CARPATCLIM database. The period of 1990–1992 was relatively dry, based on the average yearly aridity indexes of the sites (ARI—as the ratio of mean precipitation and mean evapotranspiration; 7.55, 5.90 and 6.83 respectively) and precipitation sums (PPT; 514, 648 and 584 mm respectively). Both 1993 and 2010 were humid (ARI: 16.56 and 16.63 respectively), with the highest precipitation in the studied years (695 and 1017 mm respectively), from which the latter was one of the most humid and wet year in the last decades in the Carpathian region. In total, 185 annual rings were selected, from which 19 annual rings were excluded from the analysis due to missing rings or low quality samples, with at least 5 replicates of each annual ring per site (except RCO) remaining in the following analyses.
From the cores with the selected annual rings, 15 µm thin cross sections were made with a sliding microtome (HN40, Jung, Heidelberg, Germany) and were stained with safranin and astra blue, according to [57]. Microscopic images of the cross sections were captured with a digital camera (AxioCam HRc, Zeiss, Göttingen, Germany) mounted on a transmitted light microscope (Zeiss Axio Imager A2, Zeiss, Göttingen, Germany), with a 10× objective (image resolution: 0.9699 pixel/µm). In case the annual ring width could not be entirely covered in the field of view of the objective, consecutive images were taken and then merged together using the program PTgui 10.0.11 (New House Internet Services BV, Rotterdam, The Netherlands).
The resulting images were processed with a semiautomatic method, using the image analysis software ROXAS 3.0.1 [58]. For each analyzed ring, after the exclusion of excessive cells, we manually fine-edited the measurements of five radial tracheid files. Tracheid files showing the tangentially largest cells were selected in order to consider only those tracheids that were cut close to the middle of their longitudinal length. From the resulting measurements, the tracheid lumen area (CA), the mean radial cell wall thickness of tracheids (CWTrad), the ratio of the cell diameter and radial cell wall thickness (CD/CWT), and the number of tracheids in the radial tracheid files (TNo) were selected for further analysis. Since trees were not of the same age (Table 1), the increasing power-like ontogenetic trend of the measured CA variable in and across the sites became evident (Figure 2). This trend is most apparent in the early stages of tree life, while it ceases when trees reach their mature height [53]. To account for this trend, we separated and excluded the CA measurements taken from the juvenile wood, following the recommendations of Yang et al. [59]. The intersection of two regression lines, obtained from the mean CA-cambial age coordinate space of all measurements, was treated as a boundary point between the juvenile and mature part of the trees. According to the intersection point, the youth trend ceased at the cambial age of 18 years (Figure 2), which, in its magnitude, corresponds well to observations on Pinus sylvestris by Pritzkow et al. [31]. After the exclusion, 155 annual rings, with at least 5 replicates of each annual ring per site (except RCO), remained for the final anatomical evaluation. We found no evident ontogenetic trends in case of the CWTrad measurements, and thus no exclusions or detrending were applied. On the basis of its high correlations with TRW chronologies [30,45] and visual examination, TNo measurements were standardized with a negative exponential function [54] fitted to all pooled measurements in earlywood (y = 50.36*exp(−0.05*x) + 11.12; all p values of parameters <0.001) and latewood (y = 9.66*exp(−0.02*x) + 5.75, p values of parameters <0.001, <0.1 and <0.001, respectively) to control for the decreasing age related trend of the tracheid numbers.
The resulting ROXAS outputs were re-arranged according to the order of tracheids in each tracheid file in the pith-bark direction. From the reordered CA, CWTrad and CD/CWT measurements, initial tracheidograms were produced, following the methods of Vaganov [60]. Using a moving average normalization procedure, this method produces standard curves of cell parameter variations in the radial files as functions of cell position within an annual ring, in order to make cells comparable between growth rings, trees, and sites formed in the same period of the growing season. Based on the average cell number of all measured files, standardized tracheidograms of CA, CWTrad and CD/CWT were obtained based on a normalized number of 24 cells (16 earlywood and 8 latewood) per ring. Latewood tracheids were identified according to the Mork index [61]. Standard tracheidograms were computed with the R 3.6.3 (R foundation) package ‘tgram’ (available from CRAN; http://cran.r-project.org, accessed on 24 November 2017.).

2.3. Statistical Analysis

Linear mixed effects models (LMM) were used to test the effects of sites, years, and monthly weather on the wood anatomical variables. This method allows the modelling of non-independent, hierarchical observations as random factors (such as the normalized tracheid position inside the tree rings or the trees within the sites), aside from the analysis of independent variables (i.e., site, the year of tracheid formation and monthly weather data; [62]). Thus, models included site (S) as a fixed factor, while the normalized tracheid position (NTNo.) and the trees (T) inside the sites were treated as random factors. Moreover, to account for the effect of yearly, seasonal and monthly weather conditions, the year of tracheid formation (Y), the monthly precipitation sums (PPI) and aridity indexes (ARI) of this current year (from April to October; PPI_04–PPI_10 and ARI_04–ARI_10), and the 4-month average of the monthly precipitation sums (pPPI) and aridity indexes (pARI) of the preceding year (from January to December; pPPI_0104–pPPI_0912 and pARI_0104–pARI_0912) were also included as independent variables. The linear combination of five or four (depending on the number of significant variables) monthly and seasonal weather variables (PPI, ARI and pPPI and pARI), with the two other independent (S, Y) and two random variables (NTNo., T) were tested for nested models by Likelihood Ratio Tests, in case of all the possible combinations of the monthly and seasonal weather variables. Every variable of the tested linear combinations (full models) was considered as significant if the likelihood ratio of the reduced model (null model) not containing that certain variable was significantly lower, i.e., more, than 15,000 full models containing five monthly weather variables were tested against more than 77,000 reduced models containing four weather variables, in both earlywood and latewood subsets of three dependent variables—CA, CWTrad and TNo. In the case of the CD/CWT variable, full models included only four weather variables, and they were tested against reduced models with three weather variables. Based on the lowest p values (or the highest χ2 values), we selected those full linear combinations as final models, where the likelihood ratio tests of all their reduced (null) models were worse. Pooled over the years, statistical differences among the sites were determined by Tukey’s tests (homogeneity of variances was accepted by variance ratio test). LMM’s and Tukey’s tests were computed with the R 3.6.3 (R foundation) package ‘lme4’ and ‘multcomp’ (available from CRAN; http://cran.r-project.org, accessed on 1 December 2020 and 08 February 2021.).

3. Results

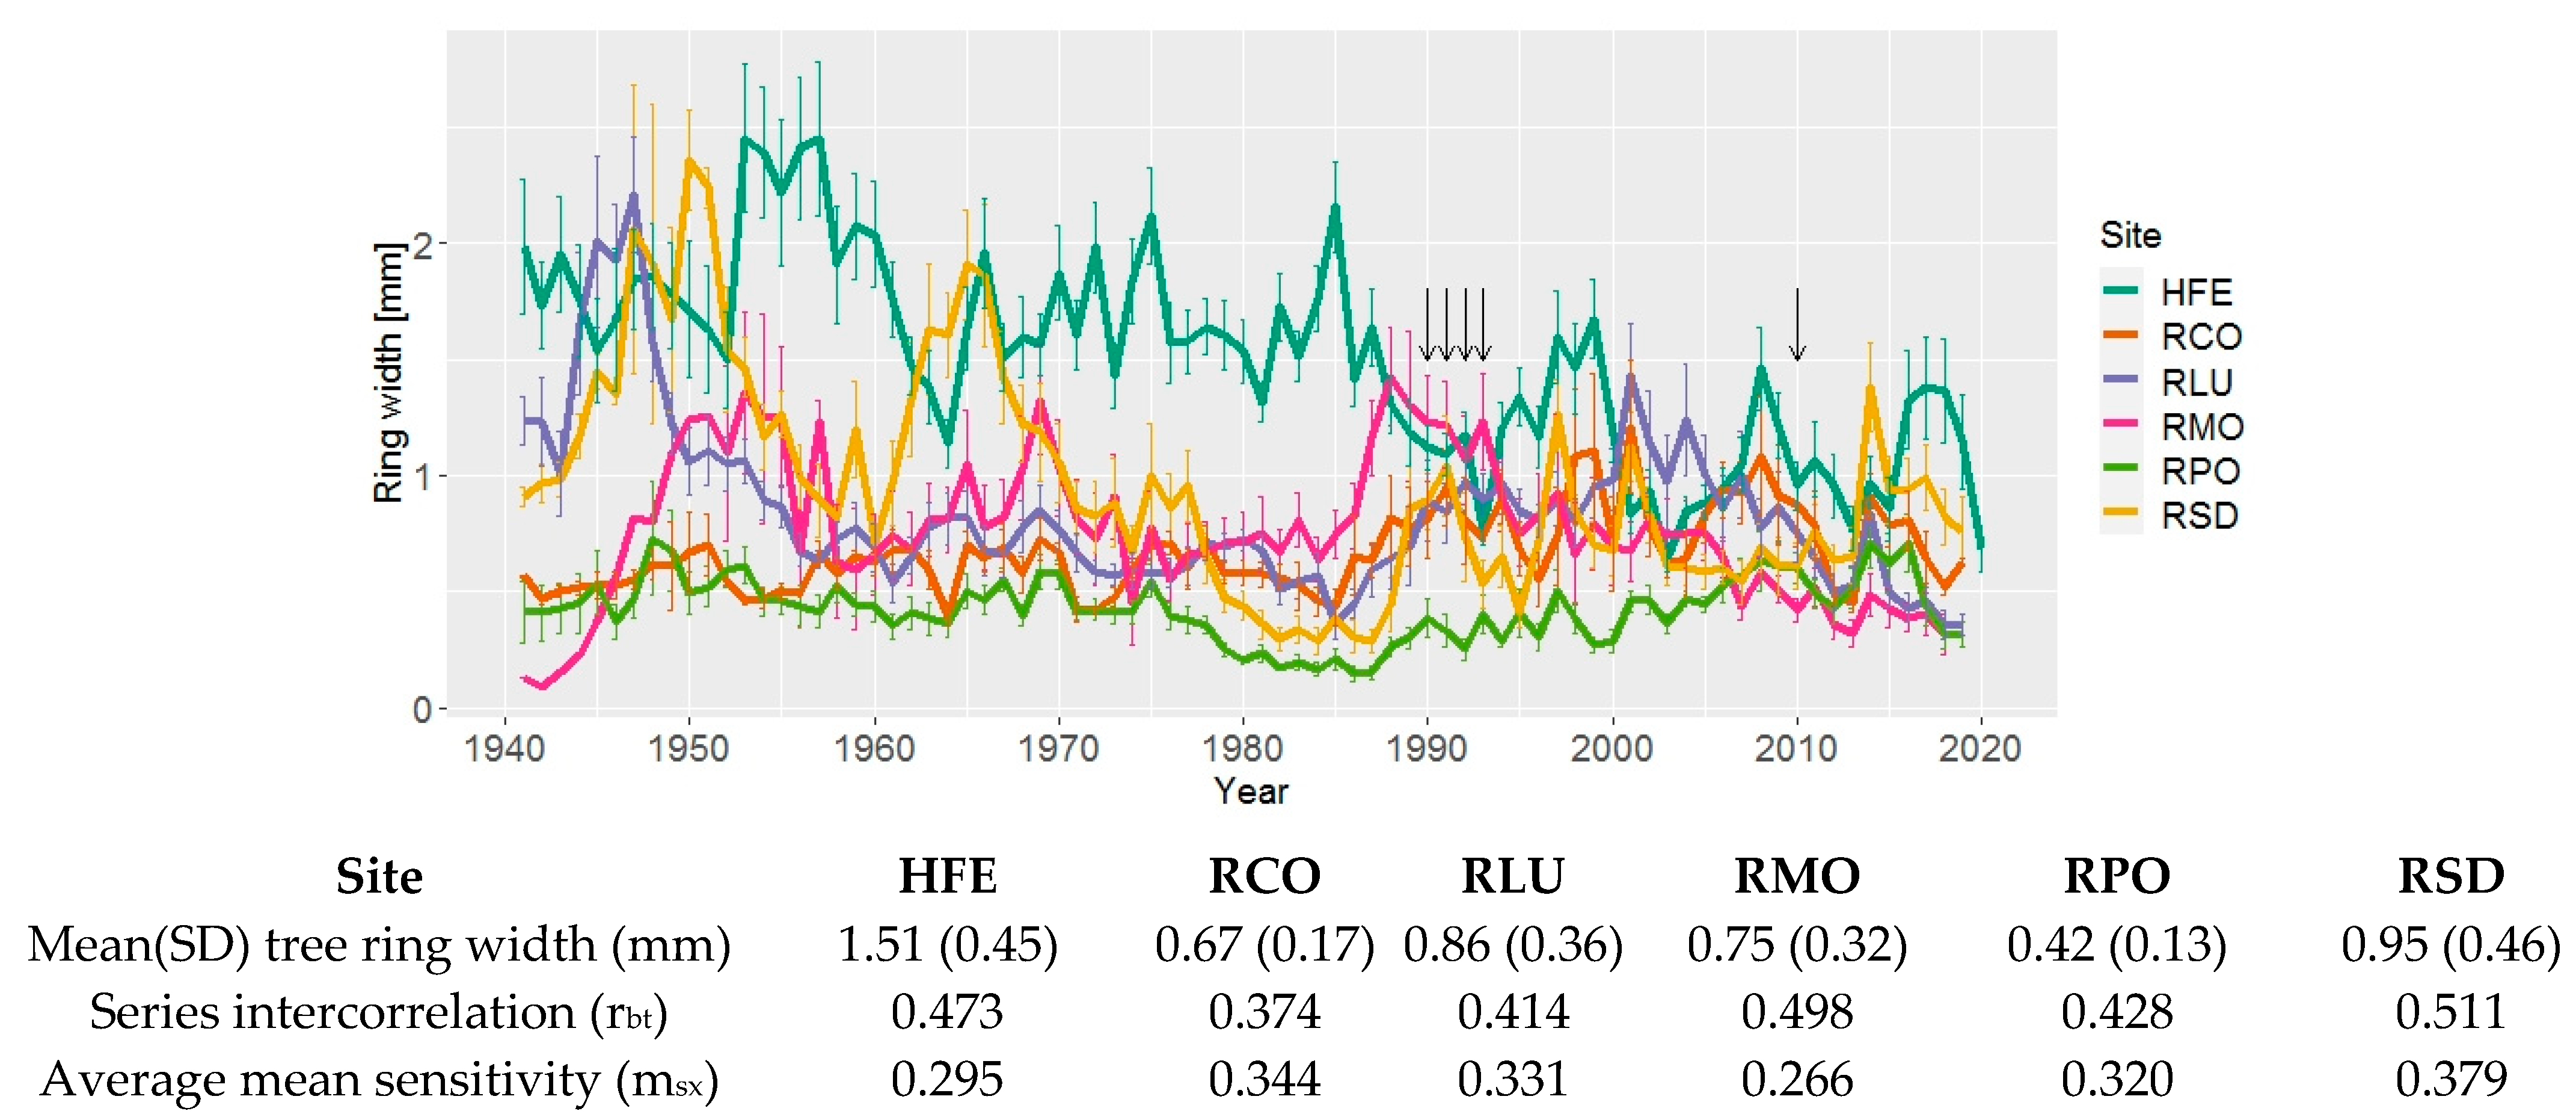
3.1. Tree Ring width Chronologies

The mean age at all sites ranged from 59 to 115 years (Table 1). Without standardization, tree ring widths of the HFE site were the largest in the common period 1938–2020, while RSD, RLU, RMO, and RCO sites had smaller increments, with RPO being the smallest (Figure 3). Series intercorrelation values (i.e., the average correlation of each series with a master chronology derived from all other series in a site, denoted by rbt) are also given for all the sites, together with the average mean sensitivity values (a measure of the relative change in ring-width from one year to the next in a given series, msx) under Figure 3.

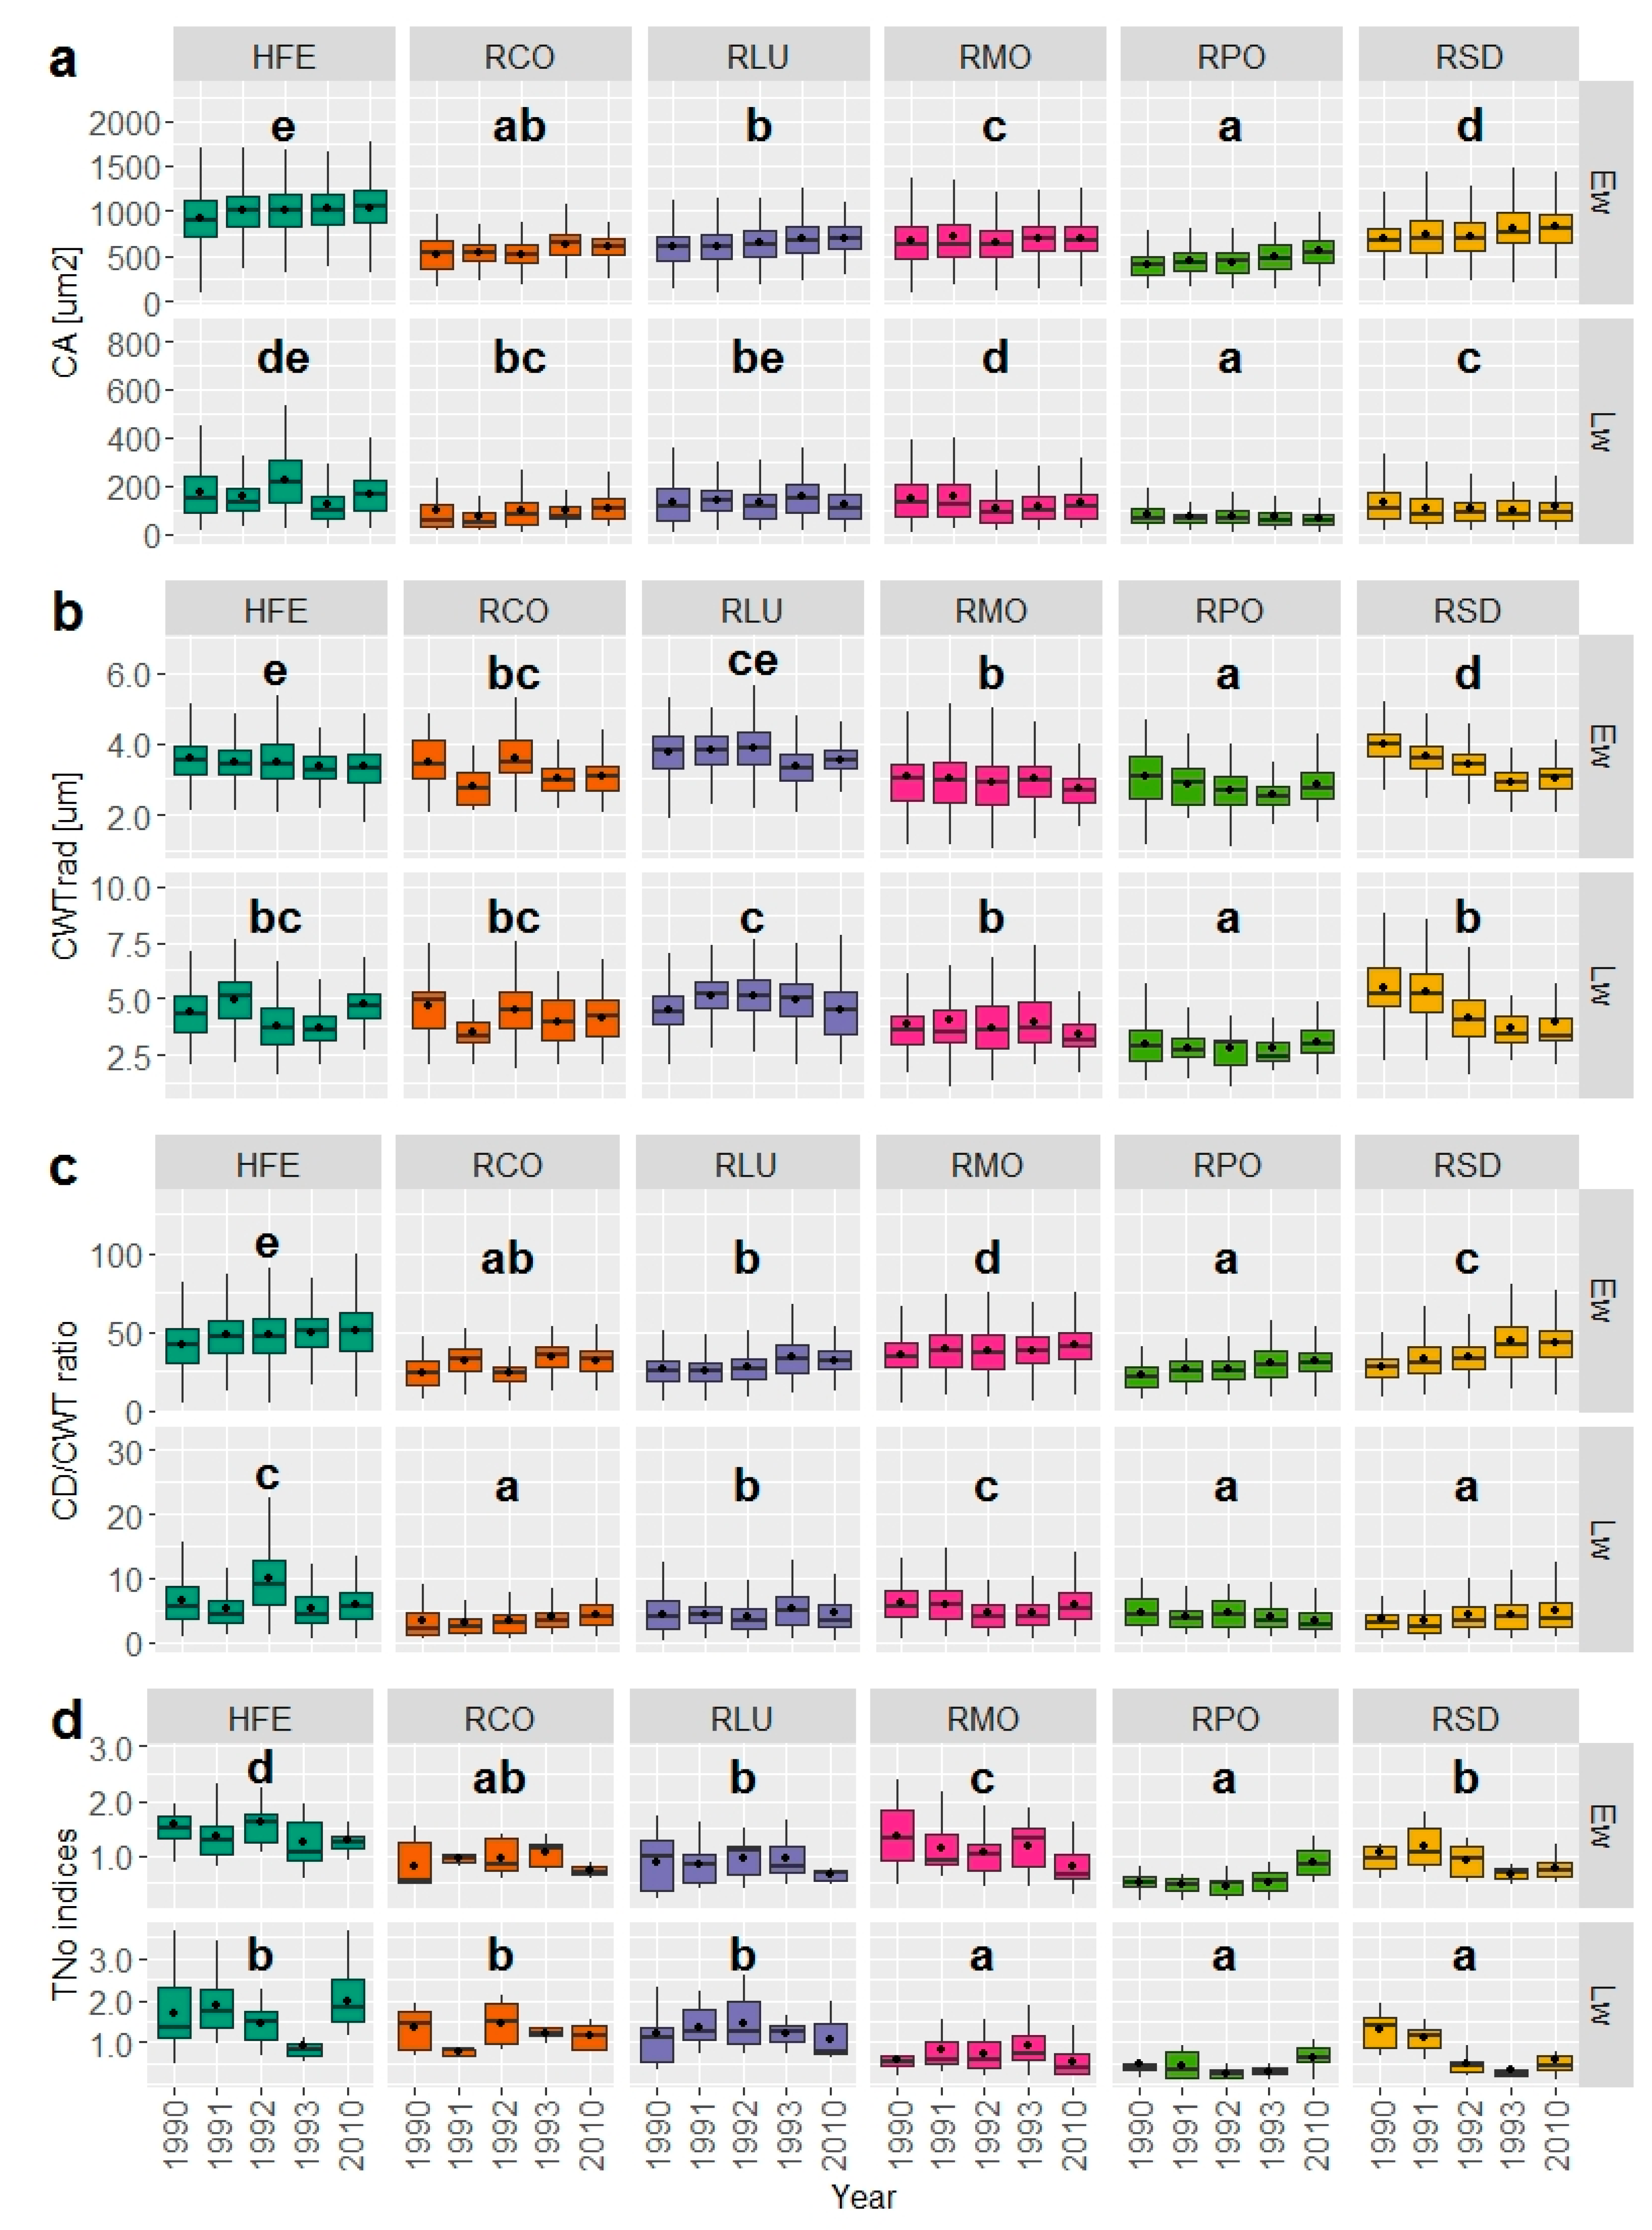
3.2. Wood Anatomical Differentiation by Habitat Types

In the earlywood, CA was significantly different between the sites (p < 0.001, Table 2), and most sites formed separate groups, where HFE had the largest and RPO had the smallest lumen areas: means varied from 914.9 to 1038.2 μm2 for HFE and from 414.0 to 554.0 μm2 for RPO in all measured years (Figure 4a). LMM coefficients reflected the same relations between the sites: the intercept (1045.59) representing HFE displayed the largest cells, while the relative coefficient of RPO (−712.27) showed the smallest cells (Table 2). CWTrad of earlywood cells were also statistically different between the sites (p < 0.001), with most sites forming separate groups. Earlywood CWTrad means varied from 3.35 to 3.58 μm for HFE, and from 3.37 to 3.90 μm for RLU, having the largest CWTrad (LMM intercept and coefficient were 4.23 and −0.47, respectively); while RPO had the thinnest earlywood cell walls (means 2.59 to 3.06 μm, Figure 4b, Table 2). The CD/CWT ratio in the earlywood was also significantly different between the sites (p < 0.001); HFE had the largest (means between 42.01 and 51.07; LMM intercept: 41.01), while RPO had the smallest CD/CWT values (means between 22.48 and 31.49; Figure 4c; Table 2). Earlywood TNo was significantly affected by sites as well (p < 0.001), where HFE had the largest mean number of tracheids per radial file (ranging from 1.24 to 1.60, LMM intercept 1.40), and RPO had the smallest (means ranged from 0.44 to 0.86, Figure 4d, Table 2).
In the latewood, sites had significant effects on the four measured parameters of CA, CWTrad, CD/CWT and TNo (all with p < 0.001; Table 2). RPO displayed significantly smaller CA (means from 66.9 to 79.6 μm2), thinner CWTrad (2.75–3.04 μm), lower CD/CWT (3.51–4.68), and lower TNo (0.25–0.64) in the latewood compared to HFE (mean CA: 121.2–174.3 μm2, mean CWTrad: 3.71–4.92 μm, mean CD/CWT: 5.17–9.95, mean TNo: 0.91–1.97, respectively). RPO was also different from the rest of the sites, except in the case of two variables CD/CWT and TNo: RPO was grouped together with RCO and RSD considering CD/CWT, while with RMO and RSD for TNo (Figure 4, Table 2).
Along the normalized tracheidograms in all sites and years, CA decreased in average from mean (SD) = 739.33(156.03) μm2 in the first tracheid position of the earlywood to mean (SD) = 62.29(18.75) μm2 in the last tracheid position of the latewood (Figure 5a,d,g,j,m). In earlywood, CWTrad increased slightly from mean (SD) = 3.16(0.32) μm to mean (SD) = 3.67(0.41) μm until the 16th tracheid position, then the latewood wall-thickening accelerated and peaked in the 19th tracheid position at mean (SD) = 4.48(0.64) μm, then, finally, decreased to mean (SD) = 3.15(0.40) μm (Figure 5b,e,h,k,n). In general, the CD/CWT ratio increased from mean (SD) = 37.71(2.23) to mean (SD) = 41.42(2.06) in the 6th tracheid position of earlywood, then it decreased to mean (SD) = 3.25(0.29) in the last tracheid position of the latewood (Figure 5c,f,i,l,o). In the first half of the earlywood, CA tracheidograms (at tracheid positions 1–5), the difference between the means of HFE with mean (SD) = 1151.19(124.03), and the rest of the sites with mean (SD) = 651.78(87.85) were conspicuous. The peat bog sites (RLU, RMO, RPO and RSD) differed from each other, as well in the whole earlywood, with RSD having the largest mean CA, then followed RMO, RLU and RPO (Table 3). This trend is also reflected in the CD/CWT tracheidograms, though the relations between the peat bog sites in the earlywood differed from that in the CA tracheidograms, as RMO was characterized by the second largest average CD/CWT values, then came RSD, RLU and RPO. In 1992, HFE in the latewood showed a deviation from the general trend that is characteristic of intra-annual density fluctuations (IADF) in the latewood (L-type IADF), with a peak in CA (Figure 5g) and CD/CWT (Figure 5i) tracheidograms at the 19th and 21st tracheid positions, with mean (SD) = 278.35(66.34) μm2 and 12.05(4.50), respectively [63]. In general, the inter- and intra-annual variability of the sites were more pronounced in the parameter CWTrad, especially in the latewood, where it varied greatly between sites, years and tracheid positions.

3.3. Effect of Yearly and Monthly Climate on Wood Anatomy

Earlywood CA, CWTrad, CD/CWT and TNo were significantly affected by the year of cell formation (all with p < 0.001, Table 2). The sites produced the smallest earlywood CA and CD/CWT in 1990 (LMM intercepts: 1045.59 and 41.01 respectively), while the largest cells with high CD/CWT were produced in 2010 (Figure 4a,c, Table 2). Earlywood CWTrad and TNo were the highest in 1990 (LMM intercepts are 4.23 and 1.40, respectively) and in 1992, while these parameters displayed the lowest values in 1993 and 2010 (Figure 4b,c, Table 2). Years also had significant effects on the latewood CA, CWTrad and CD/CWT (all with p < 0.001), as well as on TNo (p < 0.05). Similarly to the relations seen in the earlywood, latewood CWTrad and TNo values were the lowest in 2010 (CWTrad coefficient: −1.59, TNo coefficient: −0.41) and CD/CWT were highest in this same year, while CA were only slightly larger in 2010, compared to 1990 (intercept: 337.30, Figure 4, Table 2). For the means and standard errors of the four parameters in the sites and years, see Table S2. The main monthly climatic variables affecting wood parameters were dependent on the time of formation (earlywood–latewood position) of the measured tracheids. For CWTrad and TNo, earlywood tracheids correlated negatively with precipitation and positively with the current year aridity indexes (in case of all monthly variables at p < 0.05 or lower), while latewood tracheids were positively correlated with precipitation and negatively correlated with the current year aridity indexes (p < 0.05 or lower). For CA and CD/CWT, earlywood and latewood tracheids show negative correlation with the precipitation and positive correlation with the aridity indexes, at p < 0.05 or lower (Table 2).

4. Discussion

In this study, we investigated how Pinus sylvestris trees adjust their xylem to the ecological and climatic characteristics of different rear-edge habitats in the Carpathians and in the Pannonian Lowland. Through the examination of tracheid parameters lumen area (CA), radial cell wall thickness (CWTrad), ratio of radial lumen diameter to radial cell wall thickness (CD/CWT), and the number of tracheids in the radial files (TNo), we compared populations inhabiting four different peat bogs, a mountainside habitat with rocky outcrops, and a sandy, calcareous lowland site. To disentangle the influence of yearly and seasonal climate from the effect of sites, the statistical modelling included the year of tracheid formation, monthly climate data (i.e., precipitation and aridity), and the corresponding tracheid positions inside the tree rings, taken from tracheidograms.
Our results revealed significant differences among all studied sites in the case of almost all wood anatomical parameters (Table 2, Figure 4). Even populations growing on the same type of habitat with similar ecological background exhibited anatomical differences.
As expected, the most distinct population proved to be HFE population from the Pannonian Lowland, formerly reported to represent a different genetic lineage from those of the Eastern Carpathians [16]. Ecological conditions of this site were also dissimilar to other populations. Located in Northwest Hungary, at the intersection of the northern slopes of the Bakony Mountains and the Little Hungarian Plain (Figure 1a), the population is situated on less humid, calcareous sandy soil [20,22]. The thick sand layer is coupled with intensive summer evaporation and, consequently, a low groundwater table [28]. According to these circumstances, this site proved to be the most arid habitat among all investigated in this study (Figure 1b). Such long-term drought conditions could lead to enlarged lumen diameters, thinner cell walls, and an adaptive reduction of the thickness-to-span ratio [47]. This mechanism offers a more effective water-conducting system, which requires lower carbon investments in tissue production [64], at the cost of higher vulnerability of the water conducting cells exposed to cavitation failures [47,65]. Compared to larger angiosperm vessels, the narrow and short conduits of conifers—even if relatively enlarged—could be more easily refilled once cavitated, as the gas emboli in these conduits have larger surface-to-volume ratios [64], and conifer tracheids are also less exposed to eventual implosion [66]. Moreover, extreme xylem cavitation can be prevented if the increased specific hydraulic conductivity of wider tracheids in drier sites is associated with a lower leaf/sapwood area ratio [67]. This strategy is more evident if the CD/CWT ratio is taken into account (Figure 4c), and it is compared to the global aridity indexes of the sites. This optimized carbon-per-conduit-cost strategy is reflected in the wood anatomical traits of HFE: the large tracheid lumen areas (Figure 4a and Figure 5a,d,g,j,m) are combined, though with larger, but proportionally thinner, cell walls (Figure 4b and Figure 5b,e,h,k,n), resulting in the highest CD/CWT ratio Figure 4c and Figure 5c,f,i,l,o) among the studied sites. Larger tracheid lumens could also be formed due to site-specific soil conditions: though the soil is basically sandy, a thin layer of brown cambisol soil is present above the calcareous sandy substrate [68]; thus, this site is relatively less nutrient-deprived compared to the peat bog sites. This could lead to the formation of wider tracheids, as well as to more tracheids per radial files and the delayed cessation of tracheid formation [69]. The high number of TNo (Figure 4d) and the large radial increments (Figure 3) could also be attributed to (1) the high mean temperature and long growing seasons (Figure 1b) favoring physiological processes in the direction of increased radial growth performance [70,71]; and (2) the absence of the limiting effect of the over-saturated groundwater (as evidenced in peat bogs), enabling and forcing trees to produce expanded, deep-penetrating rooting systems, enhanced water uptake and promoted radial growth [72,73]. As a result of the high water permeability and low capacity of the sandy soil, the irrigating effect of precipitation is reduced, and the year-to-year growth of the tree rings is more balanced, resulting in relatively low TRW mean sensitivity (0.295; [74]).
Altogether, four peat bog populations and one from a rocky habitat were studied from the Carpathians. By comparing wood anatomical parameters, RPO was the most distinct among the peat bogs. Though the RPO site is characterized by the highest average yearly and summer precipitation and the most humid conditions (Figure 1b,c), the trees displayed the smallest ring widths (Figure 3), lowest TNo (Figure 4d; Table S2), smallest CA (Figure 4a and Figure 5a,d,g,j,m; Table S2), thinnest CWT (Figure 4b and Figure 5b,e,h,k,n; Table S2), and lowest CD/CWT ratio (Figure 4c and Figure 5c,f,i,l,o, Table S2) in both earlywood and latewood. On the other hand, RPO is one of the coldest sites, with a relatively short growing season (Figure 1b,c) compared to HFE and most of the studied peat bogs, as well as RLU and RMO. Lower yearly and seasonal temperatures generally de-escalate the physiological processes related to the growth performance of trees [34,75], with shortened periods of cambial activity [40] and shorter growing seasons resulting in the decrease of tree basal area and tree-ring growth [70,71]. Trees at RPO seem to have reduced their yearly tracheid production and radial growth to adapt to the cooler, shorter, vegetation period, and to avoid possible frost deformations of the wood caused by relatively frequent frost events (Figure 1a, [41]). The high water table at this site could also contribute to smaller increments, as a result of restricted rooting depth, decreased amount of fine root biomass and, thus, a limited nutrient uptake from the flooded soils [73]. The RPO population itself is also surrounded by a tall forest community dominated by Picea abies, inducing the more vigorous apical growth of local P. sylvestris trees in order to compete for light, resulting in thinner and narrower trunks (Table 1) and restricted radial growth. RPO trees produced the smallest lumen areas with the lowest CD/CWT ratios, probably as a result of two main reasons: (1) the higher number of extreme frost days (Figure 1b) led to the adaptation of tracheids against possible embolism-formations, related to freeze-thaw cycles [76,77,78], in parallel with the interrelation of higher altitudes and reduced tracheid lengths [33]; or (2) RPO lies in the western part of the Dornelor basin, as a part of a vast wet site complex, between the Bârgău and Călimani Mountains. As an oligotrophic peat bog, its water accumulation is mostly determined by precipitation [79], which is complemented by the irrigating effect of the rivers, Dorna and Dornişoara, in the area [80]. As this site is characterized by the highest precipitation and humidity (Figure 1b), the constantly high water table and anaerobic, hydric conditions led to reduced root and mycorrhizae growth and to shallow root systems [72,73], resulting in small, thick-walled tracheids in the trunk, probably as a consequence of hormonal adjustments [81,82,83,84].
The RSD site also resides in the Dornelor basin, between the Bârgău, Călimani and Bistrița Mountains, east of the RPO site and located in the same wet site complex [79]. This is an oligotrophic peat bog, but probably with a different soil water regime compared to RPO, due to its more centralized position in the eastern part of the basin. This fact, and the lesser amount of precipitation (Figure 1b), prevent the constant presence of a high water table and advanced anaerobic conditions, as seen in case of the RPO site. Thus, trees at the RSD site can better utilize available moisture [42,84], producing larger earlywood and latewood tracheids (Figure 4a). Low mean temperatures and a shorter growing season at this site (Figure 1b) result in fewer yearly formed earlywood tracheids (Figure 4d; Table S2), in parallel with the temperature and growing season length dependence of wood growth, as discussed above. In the latewood as well, RSD trees (as peat bog sites RPO and RMO) developed fewer cells (Figure 4d; Table S2). It seems that the higher numbers of frost days, with minimum temperatures below −20 °C at these peat bogs (Figure 1b), is the main driving force behind the reduced number of latewood tracheids. Trees at these sites possibly try to avoid severe frost damage in autumn through the early cessation of cambial activity, with reduced cell production rates and radial growth [34,85]. Shortened root growth periods with slower growth and activity could also contribute to this phenomenon [73]. The high earlywood-to-latewood TNo ratios at these three sites could also improve hydraulic efficiency in order to utilize the higher water supply of the RPO and RSD peat bogs (Figure 1b, [86]).
The RLU site has developed in one old volcano crater within the Harghita Mountains, exhibiting extreme acidic soil, about 11–12 °C summer soil temperature and summer water table at 40–50 cm depth [87]. Both earlywood and latewood CWTrad were the highest at this site, compared to other peat bogs (Figure 4b), with pronounced inter- and intra-annual variation (Figure 5b,e,h,k,n; Table 2); still, there seems to be no clear evidence of connection between the observed high CWTrad values and the long-term climate of the site (Figure 1b,h). Rosner et al. [88] suggested, that climate has a poor effect on CWT, but the conduit wall reinforcement of the tracheids (t/b)2 are responsible for preparing trees for extreme climate events. Trees with lower (t/b)2 are hydraulically more efficient in the long term, but are more prone to extreme sudden drought and eventual dieback through the higher probability of hydraulic failure. Though Borbély and Indreica [87] described P. sylvestris at the RLU site with vigorous, competitive growth, this population—at least in some parts—seemed to degrade: snags, standing, dead trees and decaying logs were commonly present in the site, accompanied by low population density. The sampled, healthy trees were possibly more prepared for the drought events of the last 25 years [87] than were dead ones, through their enlarged CWT and higher wall reinforcement [88]. As in the case of RPO and RSD, RLU trees formed fewer earlywood tracheids (Figure 4d; Table S2) due to low mean temperatures and shorter growing seasons, while, in the latewood, the smaller number of extreme cold events (T20, Figure 1b) induced higher latewood TNo compared to other peat bogs [34,85].
The peatland basin of RMO is located within the volcanic crater of the former Ciomadu volcano, situated in the Calimani-Gurghiu-Harghita range. It is an ombrotrophic peat bog, with 15 °C summer temperatures and a deep peat layer that reaches ca. 10 m, with its central part dominated by the 2–3 m tall P. sylvestris trees [89]. As pine peat bogs are already relatively more acidic and nutrient-deprived among the peat forest vegetations of Central-East Europe [1], the thick layer of peat is possibly coupled with pronounced N and P deficiency in the soil (Table S1), resulting in the restricted growth and height of P. sylvestris trees at this site. The lack of tall trees could also be connected to the cold winter air, which could be trapped in the depression of the volcanic crater of the Ciomadu, resulting in temperature inversions [1]. Despite trees at RMO having the smallest breast height diameters (12.5 ± 3.3; Table 1), the slenderness ratio of the trees—the proportion of tree height and diameter—is most probably the smallest at this site due to their extremely limited height. This is shown to be accompanied by reduced cell wall thickness (Figure 4b and Figure 5b,e,h,k,n), suggesting the adaptation of the internal regulation of the mechanical properties of the stem in the face of constrained dynamic pressure on the smaller trees caused by less windy days [90]. RMO is also characterized by the lowest amount of precipitation, and trees produced relatively large tracheids at this site (Figure 4a and Figure 5a,d,g,j,m). Since 1950, after the earlier wet hydroclimatic periods, the peat bog has been drained [89], thus, the water table became less saturated. If the over-saturated water table was a constraining factor for the anatomical development of the trees, this condition ceased, and trees adapted their tracheid lumens to the changed moisture conditions [84]. Characterized by the higher mean and more equilibrated temperature and humid conditions among the peat bogs (Figure 1b), RMO trees are represented with higher CD/CWT ratios. The RMO site produced higher number of earlywood and a smaller number of latewood cells (Figure 4d; Table S2) in parallel with the temperature and growing season lengths, as discussed above [34,85].
The rocky RCO population from the Bicaz Valley (southern Giurgeu Mountains) sustains on the southern facing cliffs above Lacul Roșu lake. Leptosol, episkeletic podzol and dystric cambisol are the dominant soil types, laying on rocky substrate with outcrops, which separates this site from the peat bogs and the lowland HFE [91]. Average yearly precipitation exceeds 700 mm, coupled with moderate temperatures and relatively high humidity (Figure 1b). Trees are characterized by small average TRW (0.67 ± 0.17, Figure 3), low earlywood TNo and CA (Figure 4a,d), and low earlywood and latewood CD/CWT ratios (Figure 4c), while latewood TNo, CA, and both earlywood and latewood CWT are around the global mean of the sites (Figure 4, Table S2). As trees growing on rocky soils are characterized by shallow root systems and reduced water accessibility, tree ring and wood formation cease earlier, accompanied by inhibited cell expansion and reduced radial earlywood cell widths [92]. On the other hand, the abovementioned carbon-per-conduit-cost strategy, in the face of the relatively high humidity of the site (Figure 1b), could have led to the reduced tracheid lumens and to the proportionally thicker cell walls [47]. Due to the low sample number at this site (Table 1), results should be treated with caution and further measurements are needed.
The patterns of site effects were influenced by local yearly and seasonal climate. The CD/CWT ratio parameter, both in earlywood and latewood, especially corresponded to the current year’s humidity conditions and precipitation: the relatively arid 1990–1992 years (lower ARI) induced smaller CD/CWT ratios as a result of smaller lumen areas and thicker cell walls, while in 1993, and especially in 2010, the increased amount of precipitation and wet, humid conditions (higher ARI) led to increased CD/CWT ratios (Table 2, Figure 4c). This trend is reflected on the monthly level as well, as current year spring and mid-summer ARI was positively correlated with the earlywood and latewood CD/CWT ratio and CA (Table 2). However, monthly precipitation showed negative correlations with these parameters, in parallel with the findings of Fernández-de-Uña et al. [38]; thus, the positive relationship between ARI and these cell parameters could be attributed to the indirect effect of corresponding temperature fluctuations [42] affecting PET, probably both on the inter- and intra-annual scale. The seasonal climatic imprint on CWT differs between earlywood and latewood, suggesting more complex effects of climate on the intra-ring scale of this parameter [39]. Regarding tracheid numbers (TNo), there seems to be a negative connection between yearly tracheid production and humidity conditions: trees in general have reduced their TNo in the humid and wet 1993 and 2010 years (Table 2), but site variability differed in this parameter (Figure 4d). While latewood TNo was affected in the same way by late spring and early autumn humidity, tracheid production in the earlywood benefited from moist summer conditions (Table 2, [37,38]). It seems that, rather, the combined effect of current year precipitation and evapotranspiration—through the indirect effect of temperature—is responsible for the short-term wood anatomical responses of the trees at these peripheral communities, as it was shown in other studies [36,37]. Furthermore, as the growing season proceeds, the within-year climate variations affect the earlywood and latewood portions of the trees differently [35,37]. The occurrence of the L-type IADFs in the latewoods of the dry HFE site in 1992 (Figure 5g,i) is probably a consequence of the late summer drought (August PPT: 2.77 mm, August ARI: 0.02) and heat (August T: 24.62 °C) in 1992, followed by a relatively wet and mild autumn (October PPT: 97.49 mm, October T: 9.78 °C) as it was shown in other cases [93,94,95]; though possible delays between the controlling climatic factor and the occurrence of the IADF makes the determination of the time for triggering difficult to assess [63,74]. It seems that the short-term plastic responses of these populations to yearly and seasonal climate fluctuations differ from the long-term adaptive responses of these trees to the ecological characteristics of their habitats [12].

5. Conclusions

Altogether, P. sylvestris in the studied peripheral peat bog populations (RPO, RSD, RLU, RMO) adapted their wood anatomical traits to ensure the hydraulic safety of the stem (smaller tracheids, with proportionally thick walls), whereas, on the sandy, lowland site (HFE), trees are building a more effective water-conducting system (larger tracheids with relatively thin walls) at the cost of higher vulnerability to cavitation. Radial tree ring growth and yearly tracheid production also differed among the habitat types. Wood structure reflected the generally hydric, cool and anaerobic conditions of the peat bogs [82,83,84], while trees at the lowland site optimized their carbon-per-conduit-cost in the face of the dry, sandy soil, coupled with the arid and long growing seasons [47]. At the same time, further studies are needed to reveal the exact small scale microclimatic effects on wood anatomy at these sites due to a lack of precise local meteorological measurements. Individually, all populations are unique, as they exhibited specificity to site conditions, suggesting the local anatomical adaptation of Scots pine trees at these peripheral habitats. This by-habitat type phenotypic differentiation is reinforced by the adaptation of the cone morphology and needle anatomy of these populations [24], though the phylogeographic history and genetic differentiation of these populations could have also contributed to the variance of the wood’s anatomical traits [16]. These phenotypic and genotypic adjustments allow P. sylvestris to prosper in these peripheral habitats in the face of climate change, as possible competitors do not pose a risk of being outcompeted through their lack of such variability and smaller ecological tolerance [1].

Supplementary Materials

The following are available online at https://www.mdpi.com/article/10.3390/f12040494/s1, Table S1: Edaphic properties of the studied sites derived from the SoilGrids database. Table S2: Mean and standard error (SE) of the wood anatomical features of earlywood and latewood for each studied site and year.

Author Contributions

Conceptualization, B.P. and M.H.; methodology, B.P.; software, B.P.; formal analysis, M.L. and B.P.; investigation, B.P.; resources, M.H. and K.C.; data curation, B.P. and K.C.; writing—original draft preparation, B.P. and M.L.; writing—review and editing, M.H., B.P., M.L. and K.B.; visualization, B.P.; supervision, M.H.; project administration, M.H. and K.B.; funding acquisition, K.B. All authors have read and agreed to the published version of the manuscript.

Funding

This research was funded by the National Research, Development and Innovation Office, Hungary, with a grant provided by the Hungarian Scientific Research Fund, grant number NKFI-EPR 119208. The authors were invited by the editor of the Special Issue.

Institutional Review Board Statement

Not applicable.

Informed Consent Statement

Not applicable.

Data Availability Statement

The data presented in this study are available in Supplementary Materials Tables S1 and S2.

Acknowledgments

The authors wish to thank the following people for providing planning, sampling, logistic support, and field and laboratory assistance: Károly Bóka, Marco Carrer, Máté Farkas, Katalin Jäger, Zoltán Kern, János Korponai, Zsófia Kovács, László Lőkös, Enikő Major, Roberto Menardi, Dávid Misi, Dániel Pifkó, Peter Prislan, and Tibor Wollner.

Conflicts of Interest

The authors declare no conflict of interest.

References

  1. Leuschner, C.; Ellenberg, H. Ecology of Central European Forests—Vegetation Ecology of Central Europe; Springer International Publishing: Cham, Switzerland, 2017; Volume I, ISBN 978-3-319-43040-9. [Google Scholar]
  2. Parmesan, C. Ecological and Evolutionary Responses to Recent Climate Change. Annu. Rev. Ecol. Evol. Syst. 2006, 37, 637–669. [Google Scholar] [CrossRef] [Green Version]
  3. Sheth, S.N.; Angert, A.L. Demographic compensation does not rescue populations at a trailing range edge. Proc. Natl. Acad. Sci. USA 2018, 115, 201715899. [Google Scholar] [CrossRef] [PubMed] [Green Version]
  4. Fadrique, B.; Báez, S.; Duque, Á.; Malizia, A.; Blundo, C.; Carilla, J.; Osinaga-Acosta, O.; Malizia, L.; Silman, M.; Farfán-Ríos, W.; et al. Widespread but heterogeneous responses of Andean forests to climate change. Nature 2018, 564, 207–212. [Google Scholar] [CrossRef] [PubMed]
  5. Bennett, K.; Provan, J. What do we mean by ‘refugia’? Quat. Sci. Rev. 2008, 27, 2449–2455. [Google Scholar] [CrossRef]
  6. Keppel, G.; Van Niel, K.P.; Wardell-Johnson, G.W.; Yates, C.J.; Byrne, M.; Mucina, L.; Schut, A.G.T.; Hopper, S.D.; Franklin, S.E. Refugia: Identifying and understanding safe havens for biodiversity under climate change. Glob. Ecol. Biogeogr. 2012, 21, 393–404. [Google Scholar] [CrossRef]
  7. Rull, V. Microrefugia. J. Biogeogr. 2009, 36, 481–484. [Google Scholar] [CrossRef]
  8. Losos, J.B. Phylogenetic Perspectives on Community Ecology. Ecology 1996, 77, 1344–1354. [Google Scholar] [CrossRef]
  9. Davis, M.B.; Shaw, R.G. Range Shifts and Adaptive Responses to Quaternary Climate Change. Science 2001, 292, 673–679. [Google Scholar] [CrossRef] [Green Version]
  10. Violle, C.; Navas, M.-L.; Vile, D.; Kazakou, E.; Fortunel, C.; Hummel, I.; Garnier, E. Let the concept of trait be functional! Oikos 2007, 116, 882–892. [Google Scholar] [CrossRef]
  11. Anderson, J.T.; Song, B. Plant adaptation to climate change—Where are we? J. Syst. Evol. 2020, 58, 533–545. [Google Scholar] [CrossRef]
  12. Fonti, P.; Von Arx, G.; García-González, I.; Eilmann, B.; Sass-Klaassen, U.; Gärtner, H.; Eckstein, D. Studying global change through investigation of the plastic responses of xylem anatomy in tree rings. New Phytol. 2010, 185, 42–53. [Google Scholar] [CrossRef] [PubMed]
  13. Labra, M.; Grassi, F.; Sgorbati, S.; Ferrari, C. Distribution of genetic variability in southern populations of Scots pine (Pinus sylvestris L.) from the Alps to the Apennines. Flora Morphol. Distrib. Funct. Ecol. Plants 2006, 201, 468–476. [Google Scholar] [CrossRef]
  14. Debreczy, Z.; Rácz, I.; Musial, K. Conifers around the World: Conifers of the Temperate Zones and Adjacent Regions; DendroPress: Budapest, Hungary, 2011; ISBN 978-9-632-19061-7. [Google Scholar]
  15. Tóth, E.G.; Köbölkuti, Z.A.; Pedryc, A.; Höhn, M. Evolutionary history and phylogeography of Scots pine (Pinus sylvestris L.) in Europe based on molecular markers. J. For. Res. 2017, 28, 637–651. [Google Scholar] [CrossRef]
  16. Tóth, E.G.; Vendramin, G.G.; Bagnoli, F.; Cseke, K.; Höhn, M. High genetic diversity and distinct origin of recently fragmented Scots pine (Pinus sylvestris L.) populations along the Carpathians and the Pannonian Basin. Tree Genet. Genomes 2017, 13, 47. [Google Scholar] [CrossRef]
  17. Rubiales, J.M.; García-Amorena, I.; Álvarez, S.G.; Manzaneque, F.G. The Late Holocene extinction of Pinus sylvestris in the western Cantabrian Range (Spain). J. Biogeogr. 2008, 35, 1840–1850. [Google Scholar] [CrossRef]
  18. Cheddadi, R.; Vendramin, G.G.; Litt, T.; Francois, L.; Kageyama, M.; Lorentz, S.; Laurent, J.-M.; de Beaulieu, J.-L.; Sadori, L.; Jost, A.; et al. Imprints of glacial refugia in the modern genetic diversity of Pinus sylvestris. Glob. Ecol. Biogeogr. 2006, 15, 271–282. [Google Scholar] [CrossRef]
  19. Prus-Głowacki, W.; Urbaniak, L.; Bujas, E.; Curtu, A.L. Genetic variation of isolated and peripheral populations of Pinus sylvestris (L.) from glacial refugia. Flora Morphol. Distrib. Funct. Ecol. Plants 2012, 207, 150–158. [Google Scholar] [CrossRef]
  20. Borhidi, A. Magyarország Növénytársulásai; Akadémiai Kiadó: Budapest, Hungary, 2003; ISBN 963-05-7983-9. [Google Scholar]
  21. Donita, N.; Popescu, A.; Pauca-Comanescu, M.; Mihailescu, S.; Biris, A. Habitatele din România; Editura Tehnicã Silvicã: Bukarest, Romania, 2005; ISBN 973-96001-4-X. [Google Scholar]
  22. Bölöni, J.; Molnár, Z.; Biró, M.; Horváth, F. Distribution of the (semi-)natural habitats in Hungary II. Woodlands and shrublands. Acta Bot. Hung. 2008, 50, 107–148. [Google Scholar] [CrossRef]
  23. Șofletea, N.; Mihai, G.; Ciocîrlan, E.; Curtu, A.L. Genetic Diversity and Spatial Genetic Structure in Isolated Scots Pine (Pinus sylvestris L.) Populations Native to Eastern and Southern Carpathians. Forests 2020, 11, 1047. [Google Scholar] [CrossRef]
  24. Köbölkuti, Z.A.; Tóth, E.G.; Ladányi, M.; Höhn, M. Morphological and anatomical differentiation in peripheral Pinus sylvestris L. populations from the Carpathian region. Dendrobiology 2017, 77, 105–117. [Google Scholar] [CrossRef]
  25. Köbölkuti, Z.A.; Höhn, M. Habitat type differentiation in peripheral Pinus sylvestris populations based on seed traits and germination data. Stud. Bot. Hung. 2018, 49, 97–119. [Google Scholar] [CrossRef]
  26. Ambroży, S.; Kapsa, M. Regeneration of Scots pine Pinus sylvestris L. in the Carpathians depends on site fertility. For. Res. Pap. 2019, 80, 189–200. [Google Scholar] [CrossRef]
  27. Bouriaud, O.; Popa, I. Comparative dendroclimatic study of Scots pine, Norway spruce, and silver fir in the Vrancea Range, Eastern Carpathian Mountains. Trees 2009, 23, 95–106. [Google Scholar] [CrossRef]
  28. Misi, D.; Náfrádi, K. Late Winter—Early Spring Thermal Conditions and Their Long-Term Effect on Tree-Ring Growth in Hungary. Balt. For. 2016, 22, 203–211. [Google Scholar]
  29. Nagavciuc, V.; Roibu, C.-C.; Ionita, M.; Mursa, A.; Cotos, M.-G.; Popa, I. Different climate response of three tree ring proxies of Pinus sylvestris from the Eastern Carpathians, Romania. Dendrochronologia 2019, 54, 56–63. [Google Scholar] [CrossRef] [Green Version]
  30. Liang, W.; Heinrich, I.; Simard, S.; Helle, G.; Linan, I.D.; Heinken, T. Climate signals derived from cell anatomy of Scots pine in NE Germany. Tree Physiol. 2013, 33, 833–844. [Google Scholar] [CrossRef]
  31. Pritzkow, C.; Heinrich, I.; Grudd, H.; Helle, G. Relationship between wood anatomy, tree-ring widths and wood density of Pinus sylvestris L. and climate at high latitudes in northern Sweden. Dendrochronologia 2014, 32, 295–302. [Google Scholar] [CrossRef]
  32. Björklund, J.; Seftigen, K.; Fonti, P.; Nievergelt, D.; von Arx, G. Dendroclimatic potential of dendroanatomy in temperature-sensitive Pinus sylvestris. Dendrochronologia 2020, 60, 125673. [Google Scholar] [CrossRef]
  33. Ståhl, E.G. Transfer effects and variations in basic density and tracheid length of Pinus sylvestris L. populations. Stud. For. Suec. 1988, 180, 1–15. [Google Scholar]
  34. Schmitt, U.; Jalkanen, R.; Eckstein, D. Cambium dynamics of Pinus sylvestris and Betula spp. in the northern boreal forest in Finland. Silva Fenn. 2004, 38, 167–178. [Google Scholar] [CrossRef] [Green Version]
  35. Eilmann, B.; Weber, P.; Rigling, A.; Eckstein, D. Growth reactions of Pinus sylvestris L. and Quercus pubescens Willd. to drought years at a xeric site in Valais, Switzerland. Dendrochronologia 2006, 23, 121–132. [Google Scholar] [CrossRef]
  36. Martin-Benito, D.; Anchukaitis, K.; Evans, M.; del Río, M.; Beeckman, H.; Cañellas, I. Effects of Drought on Xylem Anatomy and Water-Use Efficiency of Two Co-Occurring Pine Species. Forests 2017, 8, 332. [Google Scholar] [CrossRef] [Green Version]
  37. Martin-Benito, D.; Beeckman, H.; Cañellas, I. Influence of drought on tree rings and tracheid features of Pinus nigra and Pinus sylvestris in a mesic Mediterranean forest. Eur. J. For. Res. 2013, 132, 33–45. [Google Scholar] [CrossRef]
  38. Fernández-de-Uña, L.; Rossi, S.; Aranda, I.; Fonti, P.; González-González, B.D.; Cañellas, I.; Gea-Izquierdo, G. Xylem and Leaf Functional Adjustments to Drought in Pinus sylvestris and Quercus pyrenaica at Their Elevational Boundary. Front. Plant Sci. 2017, 8, 1200. [Google Scholar] [CrossRef]
  39. Belokopytova, L.V.; Babushkina, E.A.; Zhirnova, D.F.; Panyushkina, I.P.; Vaganov, E.A. Pine and larch tracheids capture seasonal variations of climatic signal at moisture-limited sites. Trees 2019, 33, 227–242. [Google Scholar] [CrossRef] [Green Version]
  40. Swidrak, I.; Gruber, A.; Oberhuber, W. Cambial activity and xylem cell development in Pinus cembra and Pinus sylvestris at their climatic limits in the Eastern Alps in 2007. Phyton 2011, 51, 299–313. [Google Scholar]
  41. Panayotov, M.P.; Zafirov, N.; Cherubini, P. Fingerprints of extreme climate events in Pinus sylvestris tree rings from Bulgaria. Trees 2013, 27, 211–227. [Google Scholar] [CrossRef] [Green Version]
  42. Babushkina, E.A.; Belokopytova, L.V.; Kostyakova, T.V.; Kokova, V.I. Earlywood and Latewood Features of Pinus sylvestris in Semiarid Natural Zones of South Siberia. Russ. J. Ecol. 2018, 49, 209–217. [Google Scholar] [CrossRef] [Green Version]
  43. Del Castillo, E.M.; Longares, L.A.; Gričar, J.; Prislan, P.; Gil-Pelegrín, E.; Čufar, K.; de Luis, M. Living on the Edge: Contrasted Wood-Formation Dynamics in Fagus sylvatica and Pinus sylvestris under Mediterranean Conditions. Front. Plant Sci. 2016, 7, 370. [Google Scholar] [CrossRef] [PubMed] [Green Version]
  44. Prislan, P.; Gričar, J.; de Luis, M.; Novak, K.; Martinez del Castillo, E.; Schmitt, U.; Koch, G.; Štrus, J.; Mrak, P.; Žnidarič, M.T.; et al. Annual Cambial Rhythm in Pinus halepensis and Pinus sylvestris as Indicator for Climate Adaptation. Front. Plant Sci. 2016, 7, 1923. [Google Scholar] [CrossRef] [Green Version]
  45. Hereş, A.-M.; Camarero, J.J.; López, B.C.; Martínez-Vilalta, J. Declining hydraulic performances and low carbon investments in tree rings predate Scots pine drought-induced mortality. Trees 2014, 28, 1737–1750. [Google Scholar] [CrossRef]
  46. Eilmann, B.; Zweifel, R.; Buchmann, N.; Graf Pannatier, E.; Rigling, A. Drought alters timing, quantity, and quality of wood formation in Scots pine. J. Exp. Bot. 2011, 62, 2763–2771. [Google Scholar] [CrossRef] [PubMed] [Green Version]
  47. Eilmann, B.; Zweifel, R.; Buchmann, N.; Fonti, P.; Rigling, A. Drought-induced adaptation of the xylem in Scots pine and pubescent oak. Tree Physiol. 2009, 29, 1011–1020. [Google Scholar] [CrossRef] [PubMed] [Green Version]
  48. Hampe, A.; Petit, R.J. Conserving biodiversity under climate change: The rear edge matters. Ecol. Lett. 2005, 8, 461–467. [Google Scholar] [CrossRef] [PubMed] [Green Version]
  49. Hengl, T.; Mendes de Jesus, J.; Heuvelink, G.B.M.; Ruiperez Gonzalez, M.; Kilibarda, M.; Blagotić, A.; Shangguan, W.; Wright, M.N.; Geng, X.; Bauer-Marschallinger, B.; et al. SoilGrids250m: Global gridded soil information based on machine learning. PLoS ONE 2017, 12, e0169748. [Google Scholar] [CrossRef] [PubMed] [Green Version]
  50. Szalai, S.; Auer, I.; Hiebl, J.; Milkovich, J.; Radim, T.; Stepanek, P.; Zahradnicek, P.; Bihari, Z.; Lakatos, M.; Szentimrey, T.; et al. Climate of the Greater Carpathian Region; Final Technical Report; European Commission, JRC: Brussels, Belgium, 2013. [Google Scholar]
  51. Tóth, E.G.; Bede-Fazekas, Á.; Vendramin, G.G.; Bagnoli, F.; Höhn, M. Mid-Pleistocene and Holocene demographic fluctuation of Scots pine (Pinus sylvestris L.) in the Carpathian Mountains and the Pannonian Basin: Signs of historical expansions and contractions. Quat. Int. 2017, 1–12. [Google Scholar] [CrossRef] [Green Version]
  52. Carrer, M.; Unterholzner, L.; Castagneri, D. Wood anatomical traits highlight complex temperature influence on Pinus cembra at high elevation in the Eastern Alps. Int. J. Biometeorol. 2018, 62, 1745–1753. [Google Scholar] [CrossRef]
  53. Carrer, M.; von Arx, G.; Castagneri, D.; Petit, G. Distilling allometric and environmental information from time series of conduit size: The standardization issue and its relationship to tree hydraulic architecture. Tree Physiol. 2015, 35, 27–33. [Google Scholar] [CrossRef] [Green Version]
  54. Cook, E.R.; Kairiukstis, L.A. (Eds.) Methods of Dendrochronology—Applications in the Environmental Sciences; Kluwer Academic Publishers: Dordrecht, The Netherlands, 1990; ISBN 0792305868. [Google Scholar]
  55. Schneider, C.A.; Rasband, W.S.; Eliceiri, K.W. NIH Image to ImageJ: 25 years of image analysis. Nat. Methods 2012, 9, 671–675. [Google Scholar] [CrossRef]
  56. Grissino-Mayer, H.D. Evaluating crossdating accuracy: A manual and tutorial for the computer program COFECHA. Tree Ring Res. 2001, 57, 205–211. [Google Scholar]
  57. Van der Werf, G.W.; Sass-Klaassen, U.G.W.; Mohren, G.M.J. The impact of the 2003 summer drought on the intra-annual growth pattern of beech (Fagus sylvatica L.) and oak (Quercus robur L.) on a dry site in the Netherlands. Dendrochronologia 2007, 25, 103–112. [Google Scholar] [CrossRef]
  58. Von Arx, G.; Carrer, M. ROXAS—A new tool to build centuries-long tracheid-lumen chronologies in conifers. Dendrochronologia 2014, 32, 290–293. [Google Scholar] [CrossRef]
  59. Yang, K.C.; Benson, C.A.; Wong, J.K. Distribution of juvenile wood in two stems of Larix laricina. Can. J. For. Res. 1986, 16, 1041–1049. [Google Scholar] [CrossRef]
  60. Vaganov, E.A. The tracheidogram method in tree-ring analysis and its application. In Methods of Dendrochronology: Applications in the Environmental Sciences; Cook, E.R., Kairiukstis, L.A., Eds.; Kluwer Academic Publishers: Dordrecht, The Netherlands, 1990; pp. 63–76. ISBN 0792305868. [Google Scholar]
  61. Denne, M.P. Definition of latewood according to Mork (1928). IAWA Bull. New. Ser. 1988, 10, 59–62. [Google Scholar] [CrossRef]
  62. Harrison, X.A.; Donaldson, L.; Correa-Cano, M.E.; Evans, J.; Fisher, D.N.; Goodwin, C.E.D.; Robinson, B.S.; Hodgson, D.J.; Inger, R. A brief introduction to mixed effects modelling and multi-model inference in ecology. PeerJ 2018, 6, e4794. [Google Scholar] [CrossRef] [PubMed] [Green Version]
  63. De Micco, V.; Campelo, F.; De Luis, M.; Bräuning, A.; Grabner, M.; Battipaglia, G.; Cherubini, P. Intra-annual Density Fluctuations in Tree Rings: How, When, Where, and Why? IAWA J. 2016, 37, 232–259. [Google Scholar] [CrossRef]
  64. Sperry, J.S. Evolution of Water Transport and Xylem Structure. Int. J. Plant Sci. 2003, 164, S115–S127. [Google Scholar] [CrossRef] [Green Version]
  65. Sperry, J.S.; Hacke, U.G.; Pittermann, J. Size and function in conifer tracheids and angiosperm vessels. Am. J. Bot. 2006, 93, 1490–1500. [Google Scholar] [CrossRef] [PubMed] [Green Version]
  66. Hacke, U.G.; Sperry, J.S.; Pockman, W.T.; Davis, S.D.; McCulloh, K.A. Trends in wood density and structure are linked to prevention of xylem implosion by negative pressure. Oecologia 2001, 126, 457–461. [Google Scholar] [CrossRef] [PubMed]
  67. Maherali, H.; DeLucia, E.H. Xylem conductivity and vulnerability to cavitation of ponderosa pine growing in contrasting climates. Tree Physiol. 2000, 20, 859–867. [Google Scholar] [CrossRef] [PubMed]
  68. Majer, A. Fenyves a Bakonyalján; Akadémiai Kiadó: Budapest, Hungary, 1988; ISBN 963-05-4461-x. [Google Scholar]
  69. Kalliokoski, T.; Makinen, H.; Jyske, T.; Nojd, P.; Linder, S. Effects of nutrient optimization on intra-annual wood formation in Norway spruce. Tree Physiol. 2013, 33, 1145–1155. [Google Scholar] [CrossRef] [PubMed] [Green Version]
  70. Jolly, W.M.; Dobbertin, M.; Zimmermann, N.E.; Reichstein, M. Divergent vegetation growth responses to the 2003 heat wave in the Swiss Alps. Geophys. Res. Lett. 2005, 32, L18409. [Google Scholar] [CrossRef] [Green Version]
  71. Piermattei, A.; Campelo, F.; Büntgen, U.; Crivellaro, A.; Garbarino, M.; Urbinati, C. Intra-annual density fluctuations (IADFs) in Pinus nigra (J. F. Arnold) at high-elevation in the central Apennines (Italy). Trees 2020, 34, 771–781. [Google Scholar] [CrossRef] [Green Version]
  72. Theodorou, C. Soil moisture and the mycorrhizal association of Pinus radiata D. don. Soil Biol. Biochem. 1978, 10, 33–37. [Google Scholar] [CrossRef]
  73. Lieffers, V.J.; Rothwell, R.L. Rooting of peatland black spruce and tamarack in relation to depth of water table. Can. J. Bot. 1987, 65, 817–821. [Google Scholar] [CrossRef]
  74. Rigling, A.; Waldner, P.O.; Forster, T.; Bräker, O.U.; Pouttu, A. Ecological interpretation of tree-ring width and intraannual density fluctuations in Pinus sylvestris on dry sites in the central Alps and Siberia. Can. J. For. Res. 2001, 31, 18–31. [Google Scholar] [CrossRef]
  75. Körner, C.; Paulsen, J. A world-wide study of high altitude treeline temperatures. J. Biogeogr. 2004, 31, 713–732. [Google Scholar] [CrossRef]
  76. Tyree, M.T.; Davis, S.D.; Cochard, H. Biophysical Perspectives of Xylem Evolution: Is there a Tradeoff of Hydraulic Efficiency for Vulnerability to Dysfunction? IAWA J. 1994, 15, 335–360. [Google Scholar] [CrossRef] [Green Version]
  77. Pittermann, J.; Sperry, J. Tracheid diameter is the key trait determining the extent of freezing-induced embolism in conifers. Tree Physiol. 2003, 23, 907–914. [Google Scholar] [CrossRef] [PubMed] [Green Version]
  78. Cavender-Bares, J. Impacts of Freezing on Long Distance Transport in Woody Plants. In Vascular Transport in Plants; Elsevier: Amsterdam, The Netherlands, 2005; pp. 401–424. ISBN 9780120884575. [Google Scholar]
  79. Mihalca, I.A. The landscape of marshes in the Land of Dorna. Analele Univ. Oradea Ser. Geogr. 2012, 22, 66–71. [Google Scholar]
  80. Aurelia, D.M.; Toader, C. Contributions to the Study of Vegetation in Tinovul Mare (Poiana Stampei—District of Suceava). Bul. Grădinii Bot. Iaşi 2007, 14, 75–80. [Google Scholar]
  81. Barker, J.E. Growth and Wood Properties of Pinus radiata in Relation to Applied Ethylene. N. Z. J. For. Sci. 1979, 9, 15–19. [Google Scholar]
  82. Yamamoto, F.; Kozlovwski, T.T. Effect of ethrel on growth and stem anatomy of Pinus halepensis seedlings. IAWA Bull. New Ser. 1987, 8, 11–19. [Google Scholar] [CrossRef]
  83. Yamamoto, F.; Kozlowski, T.T. Effects of Flooding of Soll on Growth, Stem Anatomy, and Ethylene Production of Thuja Orientalis Seedlings. IAWA J. 1987, 8, 21–29. [Google Scholar] [CrossRef]
  84. Kozlowski, T.T. Responses of woody plants to flooding and salinity. Tree Physiol. 1997, 17, 490. [Google Scholar] [CrossRef]
  85. Gindl, W.; Grabner, M.; Wimmer, R. Effects of altitude on tracheid differentiation and lignification of Norway spruce. Can. J. Bot. 2001, 79, 815–821. [Google Scholar] [CrossRef]
  86. Hevia, A.; Campelo, F.; Chambel, R.; Vieira, J.; Alía, R.; Majada, J.; Sánchez-Salguero, R. Which matters more for wood traits in Pinus halepensis Mill., provenance or climate? Ann. For. Sci. 2020, 77, 55. [Google Scholar] [CrossRef]
  87. Borbély, E.; Indreica, A. Conservation status of the rare species Betula nana in the peatbog Tinovul Luci (the Harghita Mountains, Romania). Stud. Univ. Babeş-Bolyai Biol. 2019, 64, 5–12. [Google Scholar] [CrossRef]
  88. Rosner, S.; Světlík, J.; Andreassen, K.; Børja, I.; Dalsgaard, L.; Evans, R.; Luss, S.; Tveito, O.E.; Solberg, S. Novel Hydraulic Vulnerability Proxies for a Boreal Conifer Species Reveal That Opportunists May Have Lower Survival Prospects under Extreme Climatic Events. Front. Plant Sci. 2016, 7, 1–14. [Google Scholar] [CrossRef] [Green Version]
  89. Diaconu, A.-C.; Tanţău, I.; Knorr, K.-H.; Borken, W.; Feurdean, A.; Panait, A.; Gałka, M. A multi-proxy analysis of hydroclimate trends in an ombrotrophic bog over the last millennium in the Eastern Carpathians of Romania. Palaeogeogr. Palaeoclimatol. Palaeoecol. 2020, 538, 109390. [Google Scholar] [CrossRef]
  90. Jelonek, T.; Tomczak, A.; Remlein, A.; Katrusiak, A.; Arasimowicz-Jelonek, M.; Gzyl, J. The novel relationship between the morphological characteristics of trees and ultrastructure of wood tissue in scots pine (Pinus sylvestris L.). Wood Res. 2015, 60, 519–530. [Google Scholar]
  91. Tóth, E.G. Phylogeography and Adaptive Genetic Variation of Scots Pine (Pinus sylvestris L.) Populations from the Carpathians and the Pannonian Basin. Ph.D. Thesis, Szent István University, Budapest, Hungary, 2017. [Google Scholar]
  92. Gruber, A.; Strobl, S.; Veit, B.; Oberhuber, W. Impact of drought on the temporal dynamics of wood formation in Pinus sylvestris. Tree Physiol. 2010, 30, 490–501. [Google Scholar] [CrossRef] [PubMed] [Green Version]
  93. Novak, K.; de Luís, M.; Raventós, J.; Čufar, K. Climatic signals in tree-ring widths and wood structure of Pinus halepensis in contrasted environmental conditions. Trees 2013, 27, 927–936. [Google Scholar] [CrossRef]
  94. Carvalho, A.; Nabais, C.; Vieira, J.; Rossi, S.; Campelo, F. Plastic Response of Tracheids in Pinus pinaster in a Water-Limited Environment: Adjusting Lumen Size instead of Wall Thickness. PLoS ONE 2015, 10, e0136305. [Google Scholar] [CrossRef] [PubMed] [Green Version]
  95. Pacheco, A.; Camarero, J.J.; Carrer, M. Linking wood anatomy and xylogenesis allows pinpointing of climate and drought influences on growth of coexisting conifers in continental Mediterranean climate. Tree Physiol. 2016, 36, 502–512. [Google Scholar] [CrossRef] [PubMed] [Green Version]
Figure 1. Natural distribution of Pinus sylvestris in Europe (subfigure green area) and in the Carpathian region (green area), together with the geographic position of sampled Pinus sylvestris populations (a) with the altitude (Alt), total yearly precipitations (Prec), average yearly temperatures (T), number of frost days with minimum temperatures below 0 °C (F0), number of frost days with minimum temperatures below −20 °C (F20), global aridity indexes (ARI), and average growing season length (GSL) of the sites (b), and the corresponding climate diagrams of the sites (ch). Blue bars represent monthly precipitation sums, and red lines represent monthly mean temperatures in the climate diagrams, calculated over the period 1961–2010 and derived from the CARPATCLIM database. Site abbreviations: Suhardul Mic (RCO), Tinovul Luci (RLU), Băile Tusnad (RMO), Poiana Stampei (RPO), Saru Dornei (RSD), Fenyőfő (HFE).
Forests 12 00494 g001
Figure 2. Linear regressions (blue) for the mean annual tracheid area (CA) parameter for all sites as a function of cambial age. The intersection of the two regression lines (red) represents the boundary point between the juvenile and mature wood as it was suggested by Yang et al. [59].
Forests 12 00494 g002
Figure 3. Raw ring width chronologies in the common interval of the sites in the period 1940–2020. Lines indicate mean ring widths of all individuals sampled in the sites, vertical bars indicate the standard errors, together with their values indicated in the table below, and completed with the series intercorrelation values (rbt) and the average mean sensibility values (msx). Site abbreviations: Suhardul Mic (RCO), Tinovul Luci (RLU), Băile Tusnad (RMO), Poiana Stampei (RPO), Saru Dornei (RSD), Fenyőfő (HFE). Annual rings selected for wood anatomical analyses are indicated by arrows.
Forests 12 00494 g003
Figure 4. Boxplots (displaying minimum, first quartile, median, third quartile, maximum and mean) of the four measured wood anatomical features of trunk cross sections in earlywood (Ew) and latewood (Lw) from the sampled sites (HFE-RSD) for each studied year (1990–2010): CA cell area (a); CWTrad radial cell wall thickness (b); CD/CWT ratio of the cell diameter and radial cell wall thickness (c); TNo indices standardized tracheid number within a tracheid file (d). Tukey’s HSD significant differences between sites are indicated with letters, pooled over the studied years.
Forests 12 00494 g004
Figure 5. Average tracheidograms (tracheid parameter variations as functions of their normalized positions in radial files–NTNo.) for each studied year (1990–2010) at the studied sites of three measured wood anatomical features in earlywood (Ew) and latewood (Lw): CA cell area (a,d,g,j,m); CWTrad radial cell wall thickness (b,e,h,k,n); CD/CWT ratio of the cell diameter and radial cell wall thickness (c,f,i,l,o). Tracheidograms were obtained based on a normalized number of 24 cells (16 earlywood and 8 latewood). Lines with different colors indicate different sites, error bars indicate standard errors. Site abbreviations: Suhardul Mic (RCO), Tinovul Luci (RLU), Băile Tusnad (RMO), Poiana Stampei (RPO), Saru Dornei (RSD), Fenyőfő (HFE).
Forests 12 00494 g005
Table 1. Main features of the studied peripheral Pinus sylvestris L. populations from the Carpathian Basin and the Eastern Carpathians.
CodeCountryResidential AreaHabitat TypeCommunity TypeLatitude, LongitudeAltitude (m)Slope AspectArea (km2)Sampled TreesSelected Trees for Wood AnatomyMean Age (Year) (SD)DBH (cm) (SD)
HFEHUFenyőfőMixed forestFestuco vaginatae-Pinetum sylvestris47°21′26.0″ N 17°46′08.4″ E252SE4.49108115 (47.0)55.1 (8.9)
RCOROSuhardul MicRocky substrateSeslerio-rigidae-Pinetum sylvestris46°48′06.0″ N 25°47′31.4″ E981NW0.0433101 (49.0)19.2 (3.3)
RLUROTinovul LuciPeat bogSphagnion magellanici, Vaccinio uliginosi-Pinetea46°17′51.6″ N 25°43′39.2″ E1076-2.7312777 (6.6)17.4 (2.8)
RMOROBăile TusnadPeat bogSphagnion magellanici, Vaccinio uliginosi-Pinetea46°08′07.9″ N 25°54′11.0″ E1052-0.589859 (12.0)12.5 (3.3)
RPOROPoiana StampeiPeat bogSphagnion magellanici, Vaccinio uliginosi-Pinetea47°17′56.5″ N 25°06′59.8″ E878-1.4311595 (37.7)13.6 (2.8)
RSDROSaru DorneiPeat bogSphagnion magellanici, Vaccinio uliginosi-Pinetea47°15′28.8″ N 25°21′24.3″ E913-0.4112661 (17.1)16.2 (6.1)
DBH—Diameter at breast height.
Table 2. Linear mixed effect models (LMMs) and likelihood ratio tests conducted on the fixed factors of site, year, and climate factors to test their effects on the wood’s anatomical features. Heat maps correspond to coefficient (Coef.) relations between the climate covariates (PPT, ARI) and among factor levels of the site (S) and year (Y) variables. Color hues are from the minimum to the maximum, from red–orange–yellow and light to dark green, proportionally. Reference site is HFE, reference year is 1990, both referred by Int (intercept).
Dependent Variable SiteYearClimate Variables
IntRCORLURMORPORSD1991199219932010PPT 06ARI 04ARI 06ARI 07pPPT_0508
CAEwCoef1045.59−606.72−505.64−291.49−712.27−412.491.4862.7532.6195.25−5.5457.07619.5962.40−2.54
χ2 2575.65 ***87.13 ***40.03 ***69.73 ***39.47 ***35.21 ***32.48 ***
Lw IntRCORLURMORPORSD1991199219932010PPT 05PPT 10ARI 04ARI 05pARI_0508
Coef337.20−71.17−37.42−10.74−126.87−81.41−99.8165.23−44.786.45−1.80−0.7614.21142.02−175.64
χ2 649.76 ***340.49 ***53.13 ***60.79 ***9.17 **47.81 ***196.55 ***
CWTradEw IntRCORLURMORPORSD1991199219932010PPT 04PPT 06ARI 06ARI 08pARI_0508
Coef4.23−0.442−0.467−0.648−1.493−0.929−0.4860.037−0.838−0.610−0.003−0.0292.7730.971−0.302
χ2 1776.65 ***784.54 ***36.54 ***84.26 ***67.15 ***212.96 ***6.37 *
Lw IntRCORLURMORPORSD1991199219932010PPT 07PPT 08ARI 06ARI 07pARI_0508
Coef3.25−0.120.28−0.43−1.93−0.46−0.06−0.78−0.55−1.590.040.01−0.28−5.311.69
χ2 1376.55 ***372.15 ***38.52 ***120.78 ***6.74 **39.48 ***62.72 ***
CD/CWT ratioEw IntRCORLURMORPORSD1991199219932010PPT 05ARI 04ARI 07-PPT_0508
Coef41.01−26.45−22.17−9.42−24.55−13.903.123.356.068.70−0.0183.124.21−0.03
χ2 2147.10 ***447.95 ***15.42 ***63.80 ***57.11 ***5.18 *
Lw IntRCORLURMORPORSD1991199219932010PPT 08ARI 05ARI 07ARI 10
Coef5.67−3.47−1.43−0.02−2.82−2.61−0.970.010.480.85−0.020.480.710.53
χ2 401.48 ***78.73 ***31.40 ***11.40 ***13.60 **33.19 ***
TNo indicesEw IntRCORLURMORPORSD1991199219932010PPT 05PPT 08ARI 04ARI 07ARI_08
Coef1.40−1.203−0.937−0.541−1.340−1.042−0.339−0.055−0.410−0.428−0.001−0.0140.1220.3171.882
χ2 273.81 ***53.08 ***3.91 *8.41 **7.85 **21.53 ***13.04 ***
Lw IntRCORLURMORPORSD1991199219932010PPT 05PPT 08ARI 05ARI 09pARI_0912
Coef2.01−0.05−0.31−0.99−0.90−0.730.35−0.04−0.26−0.410.020.005−1.13−0.45−0.03
χ2 156.40 ***12.70 *15.62 ***5.62 *10.36 **6.12 *13.43 ***
HFE Fenyőfő, RCO Suhardul Mic, RLU Tinovul Luci, RMO Băile Tusnad, RPO Poliana Stampei, RSD Saru Dornei. CA: cell area; CWTrad: radial cell wall thickness; TNo indices: standardized tracheid number within a tracheid file; Ew: earlywood; Lw: latewood. PPT and ARI are monthly precipitation sums and monthly mean aridity indexes, where the number index corresponds to the number of the month within the current year; climatic variables names starting with “p” refer to the previous year with 3-month-means of the monthly values indicated in the indexes. Coef coefficients of the LMM variables and their factor levels. χ2 (Chi-square values) of the likelihood ratio tests of the LMM variables, with their corresponding p values indicated by asterisks (*, p < 0.05; **, p < 0.01; ***, p < 0.001)). df(Site) = 5; df(Year) = 4; df(climatic variables) = 1.
Table 3. Mean and standard error (SE) of the wood anatomical features of earlywood and latewood for each studied site. CA: cell area; CWTrad: radial cell wall thickness; CD/CWT: ratio of the cell diameter and radial cell wall thickness. Site abbreviations: Suhardul Mic (RCO), Tinovul Luci (RLU), Băile Tusnad (RMO), Poiana Stampei (RPO), Saru Dornei (RSD), Fenyőfő (HFE).
ParameterHFERCORLURMORPORSD
Earlywoodmean(SE) CA (μm2)999.27 (5.47)570.06 (6.45)645.86 (4.54)688.37 (5.13)470.44 (3.76)758.53 (5.40)
mean(SE) CWTrad (μm)3.45 (0.01)3.25 (0.02)3.70 (0.01)2.95 (0.02)2.81 (0.01)3.38 (0.01)
mean(SE) CD/CWT47.60 (0.30)29.01 (0.38)28.61 (0.24)38.58 (0.27)27.36 (0.23)37.04 (0.31)
Latewoodmean(SE) CA (μm2)168.30 (2.66)95.92 (3.78)135.67 (2.67)129.18 (2.53)71.54 (1.34)111.07 (2.61)
mean(SE) CWTrad (μm)4.33 (0.03)4.21 (0.06)4.84 (0.04)3.78 (0.04)2.87 (0.02)4.46 (0.05)
mean(SE) CD/CWT6.51 (0.11)3.62 (0.13)4.48 (0.09)5.41 (0.08)4.17 (0.08)4.16 (0.10)
Publisher’s Note: MDPI stays neutral with regard to jurisdictional claims in published maps and institutional affiliations.

