Article

Genetic Diversity and Association Analysis among Germplasms of Diospyros kaki in Zhejiang Province Based on SSR Markers

Research Institute of Subtropical Forestry, Chinese Academy of Forestry, Hangzhou 311400, China
*
Author to whom correspondence should be addressed.
Forests 2021, 12(4), 422; https://doi.org/10.3390/f12040422
Submission received: 2 March 2021 / Revised: 26 March 2021 / Accepted: 29 March 2021 / Published: 1 April 2021
(This article belongs to the Section Forest Ecophysiology and Biology)

Abstract

:
In subtropical to temperate regions, persimmon (Diospyros kaki Thunb.) is an economically important fruit crop cultivated for its edible fruits. Persimmons are distributed abundantly and widely in Zhejiang Province, representing a valuable resource for the breeding of new cultivars and studying the origin and evolution of persimmon. In this study, we elucidated the genetic structures and diversity patterns of 179 persimmon germplasms from 16 different ecologic populations in Zhejiang Province based on the analysis of 17 SSR markers. The results show that there was a medium degree of genetic diversity for persimmon found in Zhejiang Province. With the exception of the Tiantai Mountain and Xin’an River populations, we found extensive gene exchange had occurred among the other populations. The 179 D. kaki germplasms from the 16 populations could be separated into three distinct clusters (I, II, and III) with a higher mean pairwise genetic differentiation index (FST) (0.2714). Nearly all samples of Cluster-I were distributed inland. Cluster-II and Cluster-III contained samples that were widely distributed throughout Zhejiang Province including all samples from the coastal populations and the Northeast Plain populations. In addition, we performed association mapping with nine traits (fruit crude fiber content, fruit calcium content, fruit water content, fruit longitudinal diameter, fruit aspect ratio, seed width, seed length, leaf aspect ratio, and number of lateral veins) using these markers. This led to the identification of 13 significant marker–trait associations (MTAs; p < 0.00044, 0.1/228) using a general linear model, of which, six MTAs with a correlation coefficient (R2) >10% were consistently represented in the general linear model with p < 0.00044 in the two models. The genetic structures and diversity patterns of the persimmon germplasms revealed in this study will provide a reference for the efficient conservation and further utilization of persimmon germplasms. The MTAs identified in this study will be useful for future marker-assisted breeding of persimmon.

1. Introduction

Persimmon (Diospyros kaki Thunb.) is a widespread temperate and subtropical species of the genus Diospyros belonging to the Ebenaceae family [1]. Persimmon was first cultivated in eastern China between the first to second centuries, corresponding to about 2000 years of planting history. So far, persimmon has been one of the most important fruit crops in China, Japan, and South Korea due to its deciduous fruit [2,3]. Approximately 1000 varieties of D. kaki have been found in China. The abundant diversity of the persimmon germplasm represents a valuable resource for the breeding of new cultivars and studying the origin and evolution of persimmon [4,5].
The genetic diversity among persimmon germplasms has been reported using different marker techniques such as plant morphology [6], sequence-related amplified polymorphisms (SRAPs) [7], sequence-specific amplified polymorphism (SSAPs) [8], amplified fragment length polymorphisms (AFLPs) [9,10], and simple sequence repeats (SSRs) [11,12]. However, the relationships among D. kaki germplasms have not yet been completely clarified due to the low sampling density of the germplasm resource collection in previous studies.
Zhejiang Province is located in southeast China with a long history of persimmon cultivation. The previous evaluation of phenotypic traits demonstrated that Diospyros germplasm resources are abundant and widely distributed in Zhejiang Province, and there were rich variations of agronomic traits [13,14,15], which may contain an abundance of desired genes/alleles such as for stress resistance and association with excellent flavor as a result of unique climate and diverse ecology. So far, little research has focused on evaluating and mining the genetic structures, diversity patterns, and desired genes/alleles of these sources, particularly through the use of codominant molecular markers.
The identification of loci influencing agronomic traits is the bases of marker-assisted breeding, which can effectively improve breeding efficiency [16]. Association mapping (AM) is a faster and more efficient approach for the high-resolution evaluation of complex traits and appears as a promising tool to circumvent the limitations of linkage mapping [16,17,18]. AM can effectively be used to associate genotypes with phenotypes in natural populations and identify marker–trait associations for several agronomic traits in various plant species [16,17,18,19,20,21,22,23,24]. However, due to the lack of persimmon genomic information, only a few molecular markers have been identified as linked to natural astringency loss [25,26,27] or sexual traits [28,29], which implies perhaps quality inheritance. Association studies of other quantitative traits have not been reported.
Of the many available DNA markers, microsatellites, also known as simple sequence repeat (SSR) markers, are an appropriate choice in association analysis compared to other types of molecular markers as they possess more characteristics that are advantageous for this type of application [18,19,20,21,22] such as random and wide distribution in the genome, which is genetically codominant, highly reproducible, multi-allelic, and perfectly suitable for high-throughput genotyping [18,19,20,21,22,30,31,32]. Microsatellites have been successfully used for plant crop and tree characterization and studies of genetic diversity and gene association analysis [18,19,20,21,22].
In the present study, we elucidated the genetic structures and diversity patterns of 179 persimmon sources in Zhejiang using SSR markers. We performed association mapping and identified markers associated with eleven traits of agronomic importance to determine marker–trait associations (MTAs). We explored the genetic diversity and marker–trait associations of the Zhejiang persimmon sources, which will be useful for future evolution studies and marker-assisted breeding of persimmon.

2. Materials and Methods

2.1. Plant Materials

We collected 179 semi-wild Diospyros kaki germplasms from 16 different eco-regions in Zhejiang Province from 2014 to 2015. These samples originated from the local sampling site. Each plant was collected at least 30 m away from its nearest neighbor. The 16 eco-regions is according to the long-term habitual classification of terrain in Zhejiang Province based on geographical and environmental parameters (Table 1). The climatic conditions for each collection site were estimated by the Zhejiang Climate Data 2019 [33]. We calculated the following environmental factors; detailed information of the 179 sampled individuals are listed in Table S1.
All 179 D. kaki germplasms were grafted and kept during the spring of 2015 in the Plant Nursery of Lanxi City in Zhejiang Province (29°25′ N, 119°51′ E). All stocks were “YLNO.6”, a superior line selecting from Diospyros kaki var. Silvestris. There were less differences both in the terrain and environment of the Plant Nursery. Each germplasm contained six plants at a spacing of 3 m × 4 m. The trial layout was a randomized block design with six replicates of single-tree plots. Persimmon tree management followed the standard of LY/T 1887–2010 [34]. All germplasms were in a stable fruiting period during the autumn of 2019. Six to eight normal leaves and fruits of every plant were collected, in total about 40 leaves and fruits of every germplasm, to measure six agronomic traits (fruit longitudinal diameter (FLD), fruit aspect ratio (FAR), seed width (SW), seed length (SL), leaf aspect ratio (LAR), and number of lateral veins (NLV)) of persimmon. The 6–8 normal fruits of every plant were pooled as one repetition to measure three agronomic traits (fruit crude fiber content (FCF), fruit calcium content (FCC), and fruit water content (FWC)). The correlation between traits was assessed by the Spearman correlation test using R software [35]. The mean values (Table S2) of these agronomic traits were used for the association study.

2.2. Simple Sequence Repeat (SSR) Genotyping

Genomic DNA was extracted from selected tender leaf tissue using an improved Cetyltrimethylammonium Bromide (CTAB) method [36] and the quality assessed using 1% agarose gel electrophoresis. The concentration was then determined using ultraviolet spectrophotometry.
The 17 microsatellite markers were selected from various sources [37,38,39] (Table S3). The amplification of the SSR reaction was carried out in an ABI Applied Biosystems Polymerase Chain Reaction (PCR) machine. The 10 μL reaction volume contained 50–100 ng total genomic DNA, 50 pmol primers, 0.25 U Taq DNA polymerase (Promega, Sunnyvale, CA, USA), 10× buffer, 200 μmolL−1 dNTP, and 2 mmolL−1 Mg2+. The PCR conditions were as follows: predenaturation at 94 °C for 3 min followed by 30 cycles of PCR amplification. Each cycle consisted of denaturation at 94 °C for 30 s, annealing for 30 s using the designated temperature depending on the primer pair, and extension at 72 °C for 1 min. The PCR products were finally extended at 72 °C for 5 min and then stored at 4 °C. The PCR products were resolved on 8% denaturing polyacrylamide gels, which were silver stained to detect SSR bands [35]. A 100 bp DNA ladder was included for the estimation of allele sizes. When estimating allele doses in polyploids, the situation is more complicated because there may be genotypic ambiguity even for codominant markers [40]. In addition we still do not know if the persimmon is allohexaploid or autohexaploid, or whether different germplasms are mostly like different types of hexaploidy [25]. Therefore, all alleles of the SSR markers were regarded as the dominant markers according to previous research of polyploids such as potato (Solanum tuberosum L.) (tetraploid) [41], cotton (Gossypium hirsutum L.) (allotetraploid) [42], wheat (Triticum aestivum L.) (hexaploid) [43], persimmon (hexaploid) [12], and sugarcane (Saccharum officinarum L.) (octoploid) [44,45]. The result obtained at the DKMP8 marker is displayed in Figure 1. SSR data were scored visually for allele size and presence or absence of each primer. SSR bands were scored as a qualitative character (e.g., present (1) or absent (0)) to create a binary matrix. All genotypic data can be found in Table S4. Next, the phenotypes of the 0/1 matrix were used for genetic diversity assessments and association analyses following the analytical methods of dominant markers.

2.3. Data Analysis

POPGENE 1.31 (University of Alberta, Edmonton, Canada) [46] was used to evaluate the following genetic diversity parameters: the allele frequency (MAF), number of alleles (Na) and effective number of alleles (Ne) per locus, heterozygosity observed (Ho), expected heterozygosity (He), Nei’s gene diversity index (Nei), and Shannon’s diversity index (I). The polymorphic information content (PIC) was calculated for each locus using the online program PICcalc [47]. The formula of main genetic variation parameters is listed as follows. The information of allele frequencies is shown in Table S5.
MAF = Common_allele/n
where Common_allele is the number of highest genotypes detected at a site, and n is the total number of genotypes detected at a site.
N e = 1 / i = 1 i P i 2
H e = 1 i = 1 i p i 2
where i is the number of distinct alleles at a locus and Pi (i = 1,2, 3, …, I) is the frequency of allelei in the population.
Nei = (2N/(2N − 1)) × He
where N is the number of samples.
I = ( P i × L n P i )
where Pi is the frequency of the ith allele.
GenAlEx v.6.5 was used to determine the average pairwise genetic differentiation index (FST) between populations [48]. The analysis of molecular variance (AMOVA) was used to partition the genetic variance and was carried out using Arlequin 3.11 [49]. Genetic relationships between the sampled germplasms were elucidated through the construction of an unrooted neighbor joining (NJ) dendrogram based on simple matching coefficients using MEGA5 [50]. A bootstrap value of 1000 replicates was used to test the reliability of the NJ dendrogram. Principal component analysis (PCA) was performed using EIGENSOFT [51]. To summarize the patterns of variation in the multi locus data set, principal coordinate analysis (PCoA) was performed by GenAlEx version 6.5 based on the pairwise FST matrix. The isolation-by-distance pattern (IBD) was detected by Mantel tests [52] with 1000 permutations based on matrices of pairwise genetic distance (FST/1-FST) and geographic distance among populations performed in GenAlEx 6.5.
The population genetic structure was studied using the Bayesian clustering method implemented in STRUCTURE version 2.3.4 [53]. To determine the optimum number of subgroups (K), three independent runs were performed to estimate each K value from 1 to 10. For each run, a burn-in length of 5000 followed by 50,000 Markov chain Monte Carlo (MCMC) iterations were performed assuming an admixture model with default settings and allele frequencies. Structure Harvester [54] was used to visualize the best K value based on delta K (ΔK) and maximum log likelihood L (K). Repeated sampling analysis and genetic structural plots were analyzed by CLUMPP [55]. POPHelper [56] was used to render the histogram base on the K value matrix after merging.
The associations between SSR markers and traits were tested using TASSEL 3.0 software [57]. Association mapping analysis was conducted using TASSEL through the general linear model (GLM) with the Q matrix as well as the mixed linear model (MLM) with the Q matrix and kinship (K matrix) procedures. The significant threshold for the association was set at different levels p < 0.00043 (0.01/number of loci). The phenotypic variation explained by each marker–trait association was studied using the correlation coefficient (R2).

3. Results

3.1. Characterization of Morphological Traits Persimmon Germplasms

The range and mean values of the nine morphological traits of the persimmon germplasms are provided in Table 2. All traits showed broad ranges across the germplasm accessions. Eight morphological traits had about two to six times difference (maximum/minimum). The highest FCR was approximately sixteen times the lowest. There were many different responses of correlations among the morphological traits and environmental factors (Table 3). There were no significant relationships between SumPR, SumMT, WinMT, altitude, and morphological traits. SprPR, WinPR, SumSR, AutSR, and SprMT showed negative correlation to more than one morphological trait. AutPR, longitude, WinSR, and AutMT showed a positive correlation to the morphological traits. Latitude showed a negative correlation to FCC and FCR, and positive correlation to LAR. Perhaps because of the influences of environmental factors on phenotypes, the morphological traits of the accessions were significantly different by geographical area (Table 2). FCC and FWC were both significantly high in germplasms from the Eastern Coastal Plain (e.g., Pop 15 and Pop 3). The lowest FCR, FCC, and SW were in both germplasms from Pop 8. These fruit and seed shape indices (e.g., FLD, FAR, and SL) had similar geographical distribution patterns that were higher in eastern coastal areas (e.g., Pop 3 and Pop 13), and lower in Pop 10 and the JingQu Basin overall (e.g., Pop 12).
The correlation among the nine agronomic traits was also analyzed. The pairwise correlation coefficients among fruit aspect ratio and fruit longitudinal diameter, fruit longitudinal diameter, fruit aspect ratio, and seed length were greater than 0.5, indicating strong associations (correlations) between each pair of these traits (Table S6).

3.2. Characterization of Microsatellite Marker Polymorphism

A total of 228 polymorphic alleles with high polymorphic rates were generated for 179 D. kaki using 17 SSR markers (Table S7). The number of alleles per locus ranged from seven (MDP21) to 22 (DKMP13), with an average of 13.41 alleles per locus. Due to the hexaploid nature of the D. kaki genome, other parameters (e.g., the expected heterozygosity) were not calculated. The high polymorphic levels of the examined SSR markers are reflected by the PIC values for each marker, which ranged from 0.8566 to 0.9437; all were above 0.5 with an average of 0.8965 alleles per marker. We found 25 unique alleles for five markers at eight loci. Two unique alleles (Mdp16-150 and Mdp16-158) were only found in Pop 2 (Hanning4). One unique allele (Mdp8-284) were only found in Pop 7 (ChunAn8). As hexaploid species, high Na and Ho were observed within each accession, which ranged from 67 to 132 and 0.6471 to 1, respectively (Table S8). In addition, we detected significant relationships between Na and environmental factors (such as SprPR, AutPR, WinPR, SumSR, AutSR, WinSR, SprMT, longitude, and altitude). However, Ho was not related (Table S9). We observed that the Na of Mdp21 showed significant relationships only with altitude; another fifteen of these markers showed significant relationships with more than two factors. Therefore, these SSR markers were suitable for studying the genetic diversity of persimmon germplasms. We further analyzed the correlation between pairwise FST and geographical distance (Figure 2) using the Mantel test. The results showed that there was a significant correlation between genetic distance and geographic distance (r = 0.117, p = 0.010), indicating a clear geographic origin-based structuring or predominate isolation by distance among the investigated germplasms.

3.3. Establishment of Genetic Information in Germplasms Populations

The genetic diversity of 179 genotypes of D. kaki sampled from 16 areas was analyzed and the results are shown in Table 4. The number of polymorphic alleles (Np) ranged from 143 to 215, with an average of 189.4 alleles for one population. There was considerable diversity both in the value of Nei, PIC and I among these populations. The Nei, PIC, He, and I ranged from 0.2242 to 0.3718, 0.1725 to 0.2831, 0.2082 to 0.3571, and 0.336 to 0.5268, with averages of 0.3279, 0.2473, 0.3109, and 0.4604, respectively. An examination of the correlation between population genetic diversity parameters and population size showed that only Np was significantly related to the population size (Figure 3). Interestingly, the highest Ne (1.6224 and 1.6287), Nei (0.3694 and 0.3718), PIC (0.2831 and 0.2813), and I (0.5268 and 0.5232) were all found in the populations of the eastern hills of JingQu Basin as well as for JingQu Basin overall. Low indexes were found in Pop 6 (the lowest), Pop 8, Pop 5, Pop 9, and Pop 13, which were all located in the eastern hills area of Zhejiang Province.
The differentiation among the 16 populations was measured by pairwise FST (Table 5). High FST values (>0.25), which are representative of a very high level of genetic differentiation as suggested by Wright [58], were mainly found between Pop 6 and other populations, and between Pop 8 and other populations. The highest pairwise FST value of 0.497 was found between Pop 6 and Pop 8 and indicates strong genetic differentiation. Other pairwise FST values between populations were nearly all lower than 0.25, indicating that the weak genetic differentiation among these populations may be due to existing extensive gene exchange.

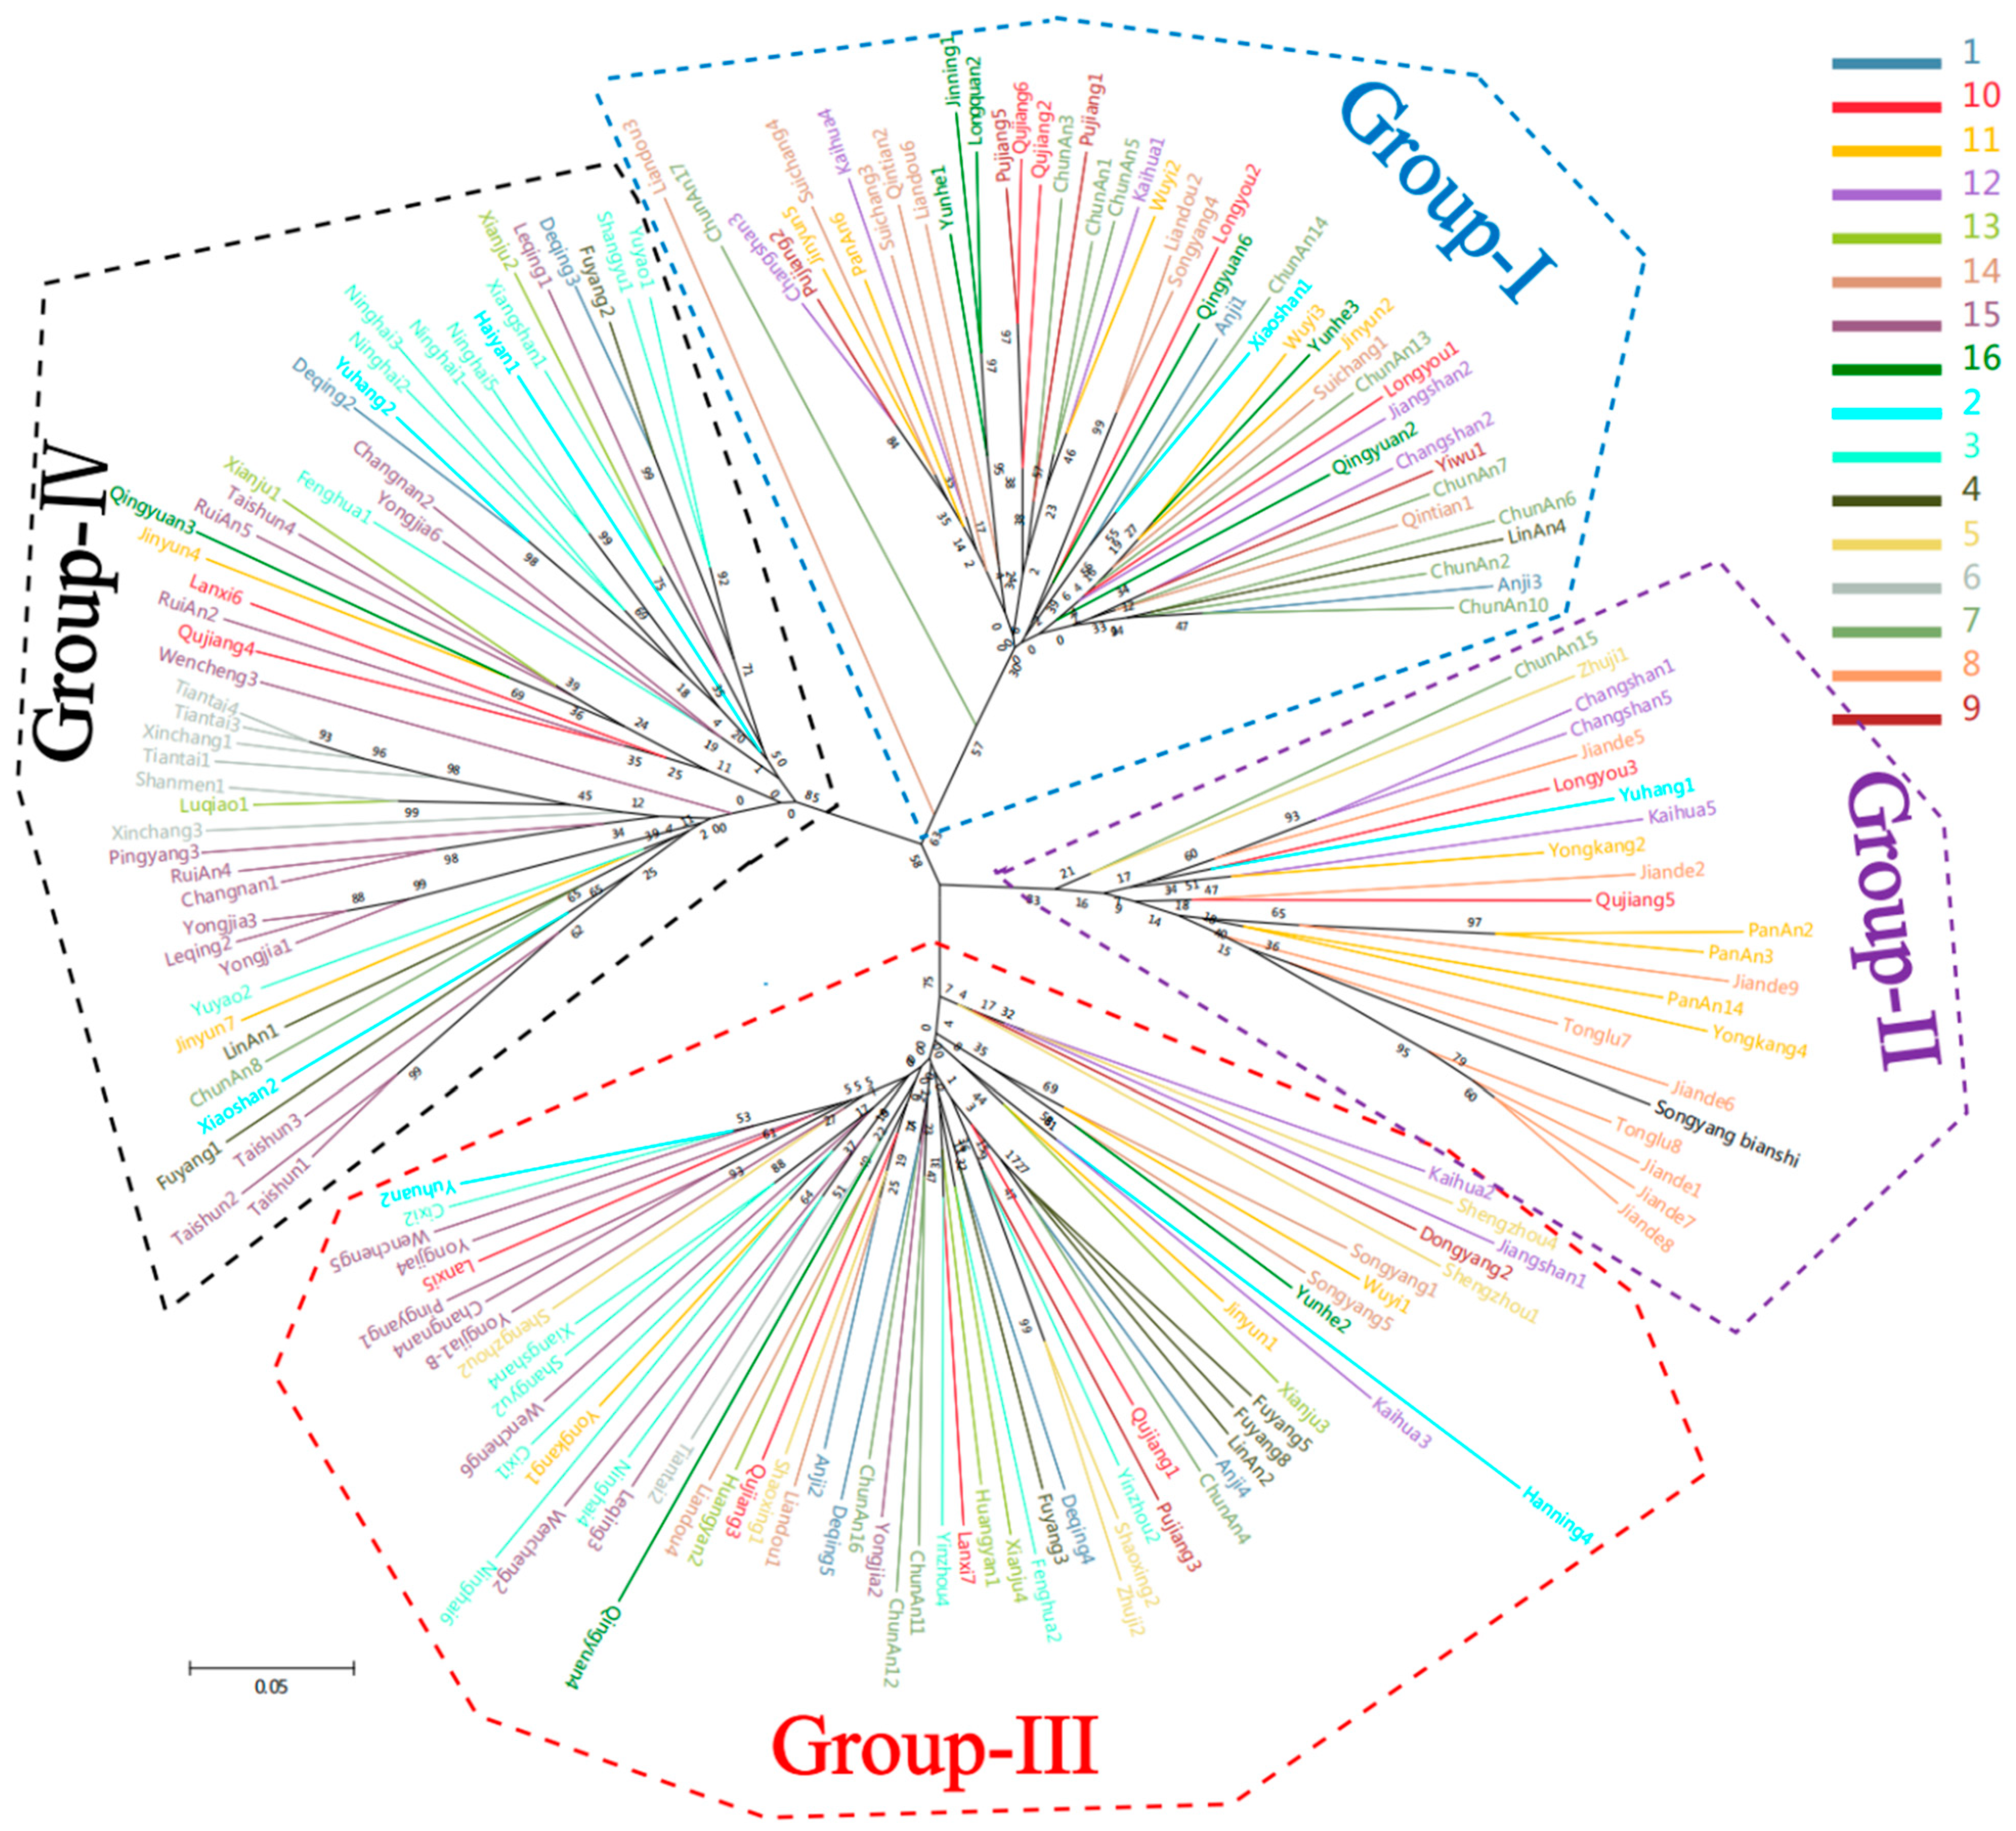
3.4. Establishment of Genetic Information in Clusters

Using the SSR genotypic data, an unrooted neighbor joining (NJ) dendrogram (Figure 4) was constructed showing the genetic relationships among the populations. In the dendrogram, the 179 genotypes of D. kaki were clustered into four groups (I, II, III, and IV). Group-I was comprised of 48 germplasms, accounting for 26.8% of the total germplasms and comprising most germplasms (90%) from Pop 14, while about 60% of germplasms were from Pop 7, 9, and 16. Group-II comprised 22 germplasms, comprising most germplasms (89%) from Pop 8, while about 60% of germplasms were from Pop 7, 9, and 16. Group-III was found to contain 61 germplasms including six materials from Pop 5, which accounted for 85.7% of this population as well as the majority (≥50%) of germplasms from Pop 1, 3, 4, and 13. Group-IV contained 48 germplasms including the majority from Pop 6 and 15 with the remainder from Pop 1, 3, 9, 10, 11, and 16, but no germplasms were found to originate from the mountains in the northeast (Pop 8 and 9), southwest (Pop 12) and south (Pop 14) of JingQu Basin.
Principal component analysis (PCA) and STRUCTURE analysis were also used to evaluate the relationships among germplasms. In the PCA (Figure 5), all germplasms were more clearly divided into three groups than the NJ classification. STRUCTURE analysis also indicated the optimal cluster number as K = 3 based on delta K (Figure 6 and Figure 7). However, the membership of the STRUCTURE and PCA clusters corresponded closely with those delineated by the NJ dendrogram. The slight difference in group 1 and group 2 by the NJ dendrogram corresponded to one cluster of STRUCTURE and PCA. Therefore, these germplasms were grouped into three clusters based on the comprehensive results of the NJ dendrogram, PCA, and STRUCTURE analyses. All persimmon germplasms, labeled in blue, red, and black, according to the three gene pools determined by STRUCTURE analyses, were then positioned on a map based on their origins. As Figure 8 shows, germplasms of the same group were mostly admixtures of different clusters (e.g., the samples of Pop 6 were divided into Cluster-I and Cluster-II, while Pop 5 consisted of samples of Cluster-I and Cluster-II). Notably, the classification pattern of the clusters was consistent with the geographical distribution. Nearly all samples of Cluster-I were those distributed inland while samples of Cluster-II and Cluster-III were mainly from coastal areas.
Significant differences of genetic parameters were observed between clusters and the primary population. The Ne, Nei, He, PIC, and I among clusters tended to be more uniform with values of 0.2985–0.3211, 1.86–1.96, 0.2954–0.3188, 0.2367–0.2546, and 0.443–0.4781, respectively (Table 6), which demonstrated considerable diversity among the populations. The high pairwise FST value (Table S10) between clusters indicated that each cluster was clearly differentiated from the others. The percentage of variation also increased from 9.87% among populations (Table S11) to 26.23% among clusters (Table S12). All clusters contained private alleles, with four (DK26-152, DK26-126, Mdp8-200 and Mdp8-224) found in Cluster-I, four (Mdp16-158, Mdp16-150, DKMP13-212, and DKMP13-230) in Cluster-II, two (Mdp8-284 and DKMP15-500) in Cluster-III. While, four, five, twelve alleles were not found in Cluster-I, Cluster-II, and Cluster-III, respectively (Figure 9).

3.5. Association Mapping

We identified 18 significant marker–trait associations (p < 0.00044, 0.1/228) for the nine traits using GLM and MLM models in association mapping. A greater number of significant marker–trait associations were observed using GLM (13) compared to MLM (5).
Six of the detected MTAs exhibited R2 ≥ 10% in the general linear model or p < 0.00044 in the two models and were retained for further analysis (Table 7). As an exception, we included the significant MTAs for loci DKMP17-282 associated with FCR, DK11-297 and DK11-271 associated with NLV both in GLM and MLM analysis with R2 values ranging from 9% to 9.2%, 7.63% to 7.73%, 6.87% to 8.48%, 9.48% to 9.51%, and 10.18% to 10.19%, respectively. Notably, the SSR loci MDP18-310 was associated with both SL and FAR, with R2 ranging from 10.01% to 13.53% in the GLM models. A significant MTA for DKMP18-156 with FCC was also detected using GLM analysis with R2 as 10.19%.

4. Discussion

Plant germplasms are valuable resources that can be used for the breeding of new cultivars as well as evolution studies. Persimmon is abundantly and widely distributed in Zhejiang Province [13,14], which may represent an abundant variability resource comprising desired genes/alleles due to unique climate and diverse ecology. In the study, all morphological traits of the persimmon germplasms showed broad ranges, indicating that the association panel includes diverse germplasms that can be used in breeding programs. Therefore, the elucidation of genetic structures and diversity patterns of these sources and the identification markers associated with agronomic traits using 17 SSR markers was performed in this study.
In accordance with the present results, previous studies [12,13,15] have demonstrated that there are many differences in the morphological traits of persimmon germplasm from different eco-regions population, while few analyses have looked into the relationship between morphological traits and environmental factors in persimmon and similar species. In this study, mean temperature of the quarter showed little significance in morphological traits, perhaps due to all sampling sites belonging to the subtropical monsoon climate and no strict temperature limit for persimmon survival. Consistent with previous studies of many fruit trees, which revealed that light [59,60,61] and water supply [62,63,64,65,66] played an important cue in both leaf and fruit development, and precipitation and solar radiation were the main climate factors affecting the morphological traits of persimmon in Zhejiang Province. There were also longitudinal differences in morphological trait diversity. These can be attributed to the comprehensive climatic and terrain factors at the establishment site.
The studied SSR markers exhibited a high level of genetic diversity. The mean PIC values were 0.8965 (i.e., all were above 0.5), the threshold indicating the existence of a very high level of marker polymorphism as suggested by Botstein [67]. The mean PIC value was much higher than those of available reports in Luo within a few germplasms [68], and comparable to 0.72 and 0.827 in the evaluation reports of 228 persimmon accessions through 12 gSSR markers [12] and 71 persimmon accessions through 19 gSSR markers [69], respectively, although this may be due to the diverse accessions in the present and other studies. The abundance of genetic information as demonstrated by the highly polymorphic SSRs will be helpful in understanding the genetic structure of the persimmon population in our study.
Compared to the nationwide accessions or germplasms, the population mean value of I (0.3694) from the persimmon sources in Zhejiang Province were lower than the I (1.6014) in 133 accessions originating from China, Japan, and America using 17 neutral SSR markers in Liang’s report [11]. The diversity of persimmon sources in Zhejiang Province was higher than in the evaluation of 189 D. kaki germplasms in Guangxi Province through 13 gSSR markers, with a higher mean value of Nei (0.3694) and I (0.3694) in this study compared with the Nei (0.149) and I (0.231) in Guangxi Province [70]. This indicates that persimmon sources were distributed differently in the two provinces, which may have been caused by differences in the terrain and persimmon source evolutionary history or different SSR markers used in these studies.
In addition, we detected significant relationships between Na and environmental factors. These results seem to be consistent with other research that found AFLP loci in European beech (Fagus sylvatica L.) [71] and European white birch (Betula pendula Roth.) [72], SSR loci in Eucalyptus gomphocephala DC. [73] and American chestnut (Castanea dentata (Marshall) Borkh.) [74]. Among them, the most highly correlated climatic factor was WinPR, WinSR, and SprMT, while SumMT and SumPR did not show any significance. This result indicates that the climate conditions in winter were more correlated to genetic traits than those in summer. Specifically, less precipitation and more solar radiation in the winter were indicative of a greater number of alleles within a population. SprMT was also a close factor affecting genetic parameters. A possible explanation for this might be that a cold spell in later spring is a serious obstacle for persimmon leaf germination. The distribution of persimmon resources might result from the natural selection and adaptation to the local climate, which may be one of the major causes of the longitudinal gradient in genetic diversity. A significant correlation between genetic distance and geographic distance was detected by the Mantel test. Additionally, a clear geographic origin-based population structuring was performed through comparing the genetic parameters and morphological traits among the population. For example, coastal populations, with low polymorphism levels but high fruit calcium content, fruit water content, and fruit and seed shape indices, may be marginal populations according to the central-marginal hypothesis that marginal populations show less genetic variation and higher differentiation than central populations [75,76,77]. The formation reason may partly be explained as these populations being located in the seaside, and these high mountains in eastern coastal areas also dampen the genetic exchange between coastal populations and inland populations, which was also supported by the low pairwise FST values. Meanwhile, there was extensive genetic exchange among populations that originated inland or in a neighboring province though the long history of persimmon cultivation. The similar geographic patterns of gene exchange have also been found in China fir (Cunninghamia lanceolata (Lamb.) Hook.) [78], Sakhalin fir (Abies sachalinensis (F.Schmidt) Mast.) [79], and Mongolian oak (Quercus mongolica Fisch. ex Ledeb.) [80].
The 179 D. kaki germplasms from the 16 populations were broken up into three distinct clusters (I, II, and III) based on the comprehensive results of the NJ dendrogram, PCA and STRUCTURE, with a higher mean FST (0.2714). Nearly all samples of Cluster-I were distributed inland, possibly due to a lack of adaptation genes (such as resistance to salinity or to higher groundwater levels). The samples from coastal populations were mostly classified as Cluster-II and Cluster-III. The samples from Cluster-II and Cluster-III were widely distributed throughout Zhejiang Province. There may still be less gene (or germplasm) exchange between these coastal populations and inland populations. These germplasms from Cluster-I may be eliminated by coastal climate and environmental conditions (e.g., many typhoons, highly alkaline soils), and samples from the coastal region may contain advantageous genes that allow for survival under a wide range of environments. Although the formation mechanism of the distribution and genetic structure characteristics of persimmon resources in Zhejiang Province require further research, the information in the germplasms suggests that a gene locus of differential adaptability in a corresponding cluster will be an important resource for future environmental adaptation research in persimmon.
Identification of the loci influencing agronomic traits is the basis of marker-assisted breeding. However, due to a lack of genomic information, association studies of other quantitative traits have not been reported in persimmon. In the present study, we performed association mapping and identified markers associated with nine traits of agronomic importance.
Improvement in fruit taste was the main breeding target of persimmon fruit. The fruit crude fiber content and calcium content were both closely related to fruit taste [81]. The DKMP17-282 loci was strongly correlated with FCR, as supported by a high correlation coefficient in both GLM and MLM analysis (R2 ranging from 9% to 9.2%). The DKMP18-156 (R2 = 10.19%) loci were identified as strongly correlated with the FCC in the GLM analysis. Hence, these SSR locus can be used in molecular-assisted breeding of persimmon fruit to improve their taste.
Among horticultural crops, fruit size and shape are also important considerations for consumers. However, little has been done regarding studies on persimmon fruit shape due to the difficulty of quantitatively characterizing fruit shape features. By using association mapping in this study, we identified loci DK26-184 and MDP18-310 as linked with the FLD and FAR in persimmon, respectively. Among these loci, MDP18-310 (R2 = 7.39–13.53%) was consistently associated with the FAR in both models. In the present study, strong positive correlations between the shape traits of fruit and seed, with higher pairwise correlation coefficients and some geographic distribution pattern, consistent with previous observations in F1 progenies [82] and germplasm resources [15,83]. These results might be explained in part by immature seeds producing a mass of a gibberellin-like substance to promote fruit development [84]. Intriguingly, among the four MTAs of seed width or length, the loci MDP18-310, associated with the FAR, was also associated with SL in GLM analysis (R2 = 10.01%). Our results further support Haruka’s description [85] that variations in fruit and seed shapes among cultivars are coordinately controlled, and that MDP18-310 may be located in the genome region for controlling both these traits.
Due to the complexity of the observed quantitative traits, these MTAs explain a small portion of phenotypic variance (about 10%) consistent with previous association mapping studies [86,87,88,89] while, the breeding of quantitative traits in plants usually utilized the significant association combinations by cumulative genetic effects. In this study, the loci were both strongly correlated with the NLV, which was significantly associated with two MTAs (DK11-297 and DK11-271) with additive effects, which could add up to explain 19.7% of phenotypic variation without considering the intermarker effect.
Although these significant marker–trait associations have still not been documented sufficiently due to lack of information on genomic location and gene function of these SSRs, our study will provide a reference for a genome-wide association study (GWAS) in persimmon. These MTAs will be useful for the future marker-assisted breeding of persimmon.

5. Conclusions

In this work, large-scale evaluation of persimmon germplasm in Zhejiang Province based on SSR markers was carried out for the first time. The results showed that there was a medium degree of genetic diversity found for persimmon in Zhejiang Province. The 179 D. kaki germplasms from the 16 populations could be separated into three clusters with distinct geographical pattern distribution. These provide a good basis for further research on the genetic basis of adaptation in D. kaki, and therefore the selection of suitable environment-marker associations for further breeding. In our study, 13 significant marker–trait associations were identified through the general linear model with nine traits of agronomic importance, of which, six MTAs with correlation coefficients (R2) > 10% were consistently represented in the general linear model or p < 0.00044 both in the general linear model and mixed linear model. As the first association mapping in D. kaki, the study will provide a reference for large scale MTA identification though a genome-wide association study (GWAS) in persimmon. The potential marker–trait associations identified in this study will be useful in facilitating marker-assisted breeding for D. kaki improvement and identification of candidate genes for trait variability in D. kaki.

Supplementary Materials

The following are available online at https://www.mdpi.com/article/10.3390/f12040422/s1, Table S1: Environmental factors, population, group, and cluster information of the 179 sampled D. kaki germplasms; Table S2: The statistics of the nine agronomic traits of the 179 D. kaki germplasms; Table S3: Characteristics of the 17 SSR markers used in this study; Table S4: All genotypic data across 179 D. kaki germplasms by 17 SSR markers; Table S5: The information of allele frequencies; Table S6: Correlation analysis between morphological traits for the 179 persimmon germplasms; Table S7: Genetic diversity of the 17 SSR markers in 179 persimmon germplasms; Table S8: The Na and Ho within each accession; Table S9: Correlation analysis between heterozygosity observed, number of alleles, and environmental factors for the 179 persimmon germplasms; Table S10: Pairwise FST estimates for groups resulting from the cluster analyses; Table S11: The molecular analyses of variance (AMOVA) among the germplasms according to origin of the populations; Table S12: Molecular analyses of variance (AMOVA) among the persimmon germplasm clusters.

Author Contributions

Y.X. and B.G. conceived and designed the study; Y.X., B.G., X.J., and K.W. organized and conducted the trial sampling and managed the samples; Y.X., W.C., and C.X. carried out the laboratory analyses; Y.X. and W.C. collated, managed, and analyzed data; Y.X. and B.G. wrote the paper. All authors have read and agreed to the published version of the manuscript.

Funding

The study was financially supported by the Fundamental Research Funds of CAF (CAFYBB2017ZA004-3 and CAFYBB2017SY015) and the Key Agricultural New Varieties Breeding Projects (New Varieties of Persimmon and Jujube Breeding Projects) funded by the Zhejiang Province Science and Technology Department.

Data Availability Statement

The data presented in this study are available in the supplementary material here.

Acknowledgments

The survey and sample collection work was kindly supported by numerous local forestry sectors such as the Fuyang Forestry Bureau and Lanxi Forestry Bureau. We are particularly grateful to the Plant Nursery of Lanxi City for their efforts in maintaining living plant materials for this study.

Conflicts of Interest

The authors declare no conflict of interest.

References

  1. Duangjai, S.; Wallnöfer, B.; Samuel, R.; Munzinger, J.; Chase, M.W. Generic delimitation and relationships in Ebenaceae sensu lato: Evidence from six plastid DNA regions. Am. J. Bot. 2006, 93, 1808–1827. [Google Scholar] [CrossRef]
  2. Luo, Z.R.; Wang, R.Z. Persimmon in China: Domestication and traditional utilizations of genetic resources. Adv. Hortic. Sci. 2008, 22, 239–243. [Google Scholar]
  3. Yonemori, K.; Sugiura, A.; Yamada, M. Persimmon genetics and breeding. Plant Breed. Rev. 2000, 19, 191–225. [Google Scholar]
  4. Tang, D.L.; Zhang, Q.L.; Xu, L.Q.; Guo, D.L.; Luo, Z.R. Number of species and geographical distribution of Diospyros L. (Ebenaceae) in China. Hortic. Plant J. 2018, 5, 59–69. [Google Scholar] [CrossRef]
  5. Wang, R.Z.; Yang, Y.; Li, G.C. Chinese persimmon germplasm resources. Acta Hortic. 1997, 436, 43–50. [Google Scholar]
  6. Yang, Y.; Yang, T.T.; Jing, Z.B. Genetic diversity and taxonomic studies of date plum (Diospyros lotus L.) using morphological traits and SCoT markers. Biochem. Syst. Ecol. 2015, 61, 253–259. [Google Scholar] [CrossRef]
  7. Guo, D.L.; Luo, Z.R. Genetic relationships of some PCNA persimmons (Diospyros kaki Thunb.) from China and Japan revealed by SRAP analysis. Genet. Resour. Crop. Evol. 2006, 53, 1597–1603. [Google Scholar] [CrossRef]
  8. Du, X.Y.; Zhang, Q.L.; Luo, Z.R. Development of retrotransposon primers and their utilization for germplasm identification in Diospyros spp. (Ebenaceae). Tree Genet. Genomes 2009, 5, 235–245. [Google Scholar] [CrossRef]
  9. Yonemori, K.; Honsho, C.; Kitajima, A.; Aradhya, M.; Giordani, E.; Bellini, E.; Parfitt, D.E. Relationship of European persimmon (Diospyros kaki Thunb.) cultivars to Asian cultivars, characterized using AFLPs. Genet. Resour. Crop. Evol. 2008, 55, 81–89. [Google Scholar] [CrossRef]
  10. Parfitt, D.E.; Yonemori, K.; Honsho, C.; Nozaka, M.; Kanzaki, S.; Sato, A.; Yamada, M. Relationships among Asian persimmon cultivars, astringent and non-astringent types. Tree Genet. Genomes 2015, 51, 1–9. [Google Scholar] [CrossRef] [Green Version]
  11. Liang, Y.Q.; Han, W.J.; Sun, P.; Liang, J.; Wuyun, T.N.; Li, F.D.; Fu, J.M. Genetic diversity among germplasms of Diospyros kaki based on SSR markers. Sci. Hortic. 2015, 186, 180–189. [Google Scholar] [CrossRef]
  12. Guan, C.F.; Zhang, P.X.; Hu, C.Q.; Chachar, S.; Riaz, A.; Wang, R.Z.; Yang, Y. Genetic diversity, germplasm identification and population structure of Diospyros kaki Thunb. from different geographic regions in china using SSR markers. Sci. Hortic. 2019, 251, 233–240. [Google Scholar] [CrossRef]
  13. Zhao, X.M.; Gong, B.C.; Wu, K.Y.; Chen, H.X.; Lv, X.; Wang, N. Research on quantitative classification of native persimmon varieties in Zhejiang province. For. Res. 2012, 25, 77–87. (In Chinese) [Google Scholar]
  14. Zhao, X.M.; Gong, B.C.; Wu, K.Y.; Jiang, X.B.; Deng, Q.E.; Xiong, C.Y.; Zheng, X.F.; Chen, W.H. Variation analysis of fruit nutrients of native persimmon in Zhejiang province. J. Northwest. A. F. Univ. (Nat. Sci. Ed.) 2015, 43, 125–133. (In Chinese) [Google Scholar]
  15. Sun, W.M.; Xu, Y.; Gong, B.C.; Wu, K.Y. Study on fruit shape diversity of persimmon germplasm resources in Zhejiang province. For. Res. 2019, 32, 42–50. (In Chinese) [Google Scholar]
  16. Yu, J.; Buckler, E.S. Genetic association mapping and genome organization of maize. Curr. Opin. Biotechnol. 2006, 17, 155–160. [Google Scholar] [CrossRef] [PubMed]
  17. Abdurakhmonov, I.Y.; Abdukarimov, A. Application of association mapping to understanding the genetic diversity of plant germplasm resources. Int. J. Plant. Genom. 2008, 574927. [Google Scholar] [CrossRef] [PubMed] [Green Version]
  18. Ambreen, H.; Kumar, S.; Kumar, A.; Agarwal, M.; Jagannath, A.; Goel, S. Association mapping for important agronomic traits in safflower (Carthamus tinctorius L.) core collection using microsatellite markers. Front. Plant. Sci. 2018, 9, 402. [Google Scholar] [CrossRef] [PubMed] [Green Version]
  19. Mei, Y.J.; Yu, J.W.; Xue, A.G.; Fan, S.L.; Song, M.Z.; Pang, C.Y.; Pei, W.F.; Yu, S.X.; Zhu, J. Dissecting genetic network of fruit branch traits in upland cotton by association mapping using SSR markers. PLoS ONE 2017, 12, e0162815. [Google Scholar] [CrossRef]
  20. Zheng, T.C.; Qin, B.; Li, S.Z.; Cai, M.; Zhang, Q.X. Screening of applicable SSR molecular markers linked to creeping trait in crape myrtle. Forests 2019, 10, 429. [Google Scholar] [CrossRef] [Green Version]
  21. Liao, G.L.; Li, Z.Y.; Huang, C.H.; Zhong, M.; Tao, J.J.; Qu, X.Y.; Chen, L.; Xu, X.X. Genetic diversity of inner quality and SSR association analysis of wild kiwifruit (Actinidia eriantha). Sci. Hortic. 2019, 248, 241–247. [Google Scholar] [CrossRef]
  22. Breria, C.M.; Hsieh, C.H.; Yen, J.Y.; Nair, R.; Schafleitner, R. Population structure of the world vegetable center mungbean mini core collection and genome-wide association mapping of loci associated with variation of seed coat luster. Trop Plant. Biol. 2019, 13, 1–12. [Google Scholar] [CrossRef]
  23. Ali, N.; Li, D.; Eltahawy, M.S.; Abdulmajid, D.; Bux, L.; Liu, E.; Dang, X.; Hong, D. Mining of favorable alleles for seed reserve utilization efficiency in Oryza sativa by means of association mapping. BMC Genet. 2020, 21, 4. [Google Scholar] [CrossRef] [Green Version]
  24. Liu, N.; Cheng, F.Y. Association mapping for yield traits in Paeonia rockii based on SSR markers within transcription factors of comparative transcriptome. BMC Plant. Biol. 2020, 20, 245. [Google Scholar] [CrossRef] [PubMed]
  25. Akagi, T.; Tao, R.; Tsujimoto, T.; Kono, A.; Yonemori, K. Fine genotyping of a highly polymorphic astringency-linked locus reveals variable hexasomic inheritance in persimmon (Diospyros kaki Thunb.) cultivars. Tree Genet. Genomes 2012, 8, 195–204. [Google Scholar] [CrossRef]
  26. Onoue, N.; Kobayashi, S.; Kono, A.; Sato, A. SSR-based molecular profiling of 237 persimmon (Diospyros kaki Thunb.) germplasms using an astringency-linked marker. Tree Genet. Genomes 2018, 14, 28. [Google Scholar] [CrossRef]
  27. Pei, X.; Zhang, Q.L.; Guo, D.Y.; Luo, Z.R. Effectiveness of the RO2 marker for the identification of non-astringency trait in Chinese PCNA persimmon and its possible segregation ratio in hybrid F1 population. Sci. Hortic. 2013, 150, 227–231. [Google Scholar] [CrossRef]
  28. Akagi, T.; Kajita, K.; Kibe, T.; Morimura, H.; Tsujimoto, T.; Nishiyama, S.; Kawai, T.; Yamane, H.; Tao, R. Development of molecular markers associated with sexuality in Diospyros lotus L. and their application in D. kaki Thunb. J. Jpn. Soc. Hortic. Sci. 2013, 83, 214–221. [Google Scholar] [CrossRef] [Green Version]
  29. Zhang, P.X.; Yang, S.C.; Liu, Y.F.; Zhang, Q.L.; Xu, L.Q.; Luo, Z.R. Validation of a male-linked gene locus (OGI) for sex identification in persimmon (Diospyros kaki Thunb.) and its application in F1 progeny. Plant. Breed. 2016, 135, 721–727. [Google Scholar] [CrossRef]
  30. Tong, Y.W.; Lewis, B.J.; Zhou, W.M.; Mao, C.R.; Wang, Y.; Zhou, L.; Yu, D.P.; Dai, L.M.; Qi, L. Genetic Diversity and Population Structure of Natural Pinus koraiensis Populations. Forests 2020, 11, 39. [Google Scholar] [CrossRef] [Green Version]
  31. Zuzana, B.; Jiri, K.; Jakub, D.; Jan, B.; Dagmar, Z.; Vaclav, J.; Milan, L. Genetic structure of norway spruce ecotypes studied by SSR markers. Forests 2020, 11, 110. [Google Scholar]
  32. Shi, X.M.; Wen, Q.; Cao, M.; Guo, X.; Xu, L.A. Genetic diversity and structure of natural Quercus variabilis population in china as revealed by microsatellites markers. Forests 2017, 8, 495. [Google Scholar] [CrossRef] [Green Version]
  33. Zhejiang Climate. Available online: http://zj.weather.com.cn/hyqx/index.shtml (accessed on 16 February 2020).
  34. State forestry administration of the People’s Republic of China. Technical Regulation of Cultivation for Japanese Persimmon (Diospyros kaki Thunb); LY/T 1887-2010 [S]; Standards Press of China: Beijing, China, 2010; pp. 06–10. [Google Scholar]
  35. Ross, I.; Robert, G. R: A Language for Data Analysis and Graphics. J. Comput. Graph. Stat. 1996, 5, 299–314. [Google Scholar]
  36. Doyle, J.J.; Doyle, J.L. Isolation of plant DNA from fresh tissue. Focus 1990, 12, 13–15. [Google Scholar]
  37. Soriano, J.M.; Pecchioli, S.; Romero, C.; Vilanova, S.; Llácer, G.; Giordani, E.; Badenes, M.L. Development of microsatellite markers in polyploid persimmon (Diospyros kaki Lf) from an enriched genomic library. Mol. Ecol. Notes 2006, 6, 368–370. [Google Scholar] [CrossRef]
  38. Ruan, X.F.; Gabi, K.; Yang, Y. Isolation of Microsatellite in Diospyros kaki by magnetic beads. J. Northwest. A. F. Univ. (Nat. Sci. Ed.) 2008, 36, 97–102. [Google Scholar]
  39. Guo, D.L. Establishment of Several Molecular Markers and Analysis of Genetic Relationships in Diospyros Linn. Ph.D. Thesis, Huazhong Agricultural University, Wuhan, China, 2006. [Google Scholar]
  40. Hubisz, M.J.; Falush, D.; Stephens, M.; Pritchard, J.K. Inferring weak population structure with the assistance of sample group information. Mol. Ecol. Resour. 2009, 9, 1322–1332. [Google Scholar] [CrossRef] [Green Version]
  41. Wang, Y.; Rashid, M.A.R.; Li, X.; Yao, C.; Lu, L.; Bai, J.; Li, Y.; Xu, N.; Yang, Q.; Zhang, L.; et al. Collection and Evaluation of Genetic Diversity and Population Structure of Potato Landraces and Varieties in China. Front. Plant. Sci. 2019, 10, 139. [Google Scholar] [CrossRef] [Green Version]
  42. Baytar, A.A.; Erdogan, O.; Frary, A.; Frary, A.; Doganlar, S. Molecular diversity and identification of alleles for Verticillium wilt resistance in elite cotton (Gossypium hirsutum L.) germplasm. Euphytica 2017, 213, 31. [Google Scholar] [CrossRef]
  43. Al-Ashkar, I.; Alderfasi, A.; Romdhane, W.B.; Seleiman, M.F.; EI-Said, R.A.; Al-Doss, A. Morphological and Genetic Diversity within Salt Tolerance Detection in Eighteen Wheat Genotypes. Plants 2020, 9, 287. [Google Scholar] [CrossRef] [PubMed] [Green Version]
  44. Singh, R.B.; Singh, B.; Singh, R.K. Development of potential dbEST-derived microsatellite markers for genetic evaluation of sugarcane and related cereal grasses. Ind. Crop. Prod. 2019, 128, 38–47. [Google Scholar] [CrossRef]
  45. Singh, R.B.; Mahenderakar, M.D.; Jugran, A.K.; Singh, R.K.; Srivastava, R.K. Assessing genetic diversity and population structure of sugarcane cultivars, progenitor species and genera using microsatellite (SSR) markers. Gene 2020, 753, 144800. [Google Scholar] [CrossRef] [PubMed]
  46. Yeh, F.C.; Boyle, J. POPGENE, the user-friendly shareware for population genetic analysis. Mol. Biol. Biotechnol. 1997, 434, 724–731. [Google Scholar]
  47. Nagy, S.; Poczai, P.; Cernák, I.; Gorji, A.M.; Hegedűs, G.; Taller, J. PICcalc: An online program to calculate polymorphic information content for molecular genetic studies. Biochem. Genet. 2012, 50, 670–672. [Google Scholar] [CrossRef] [Green Version]
  48. Smouse, P.E.; Banks, S.C.; Peakall, R. Converting quadratic entropy to diversity: Both animals and alleles are diverse, but some are more diverse than others. PLoS ONE 2017, 12, e0185499. [Google Scholar] [CrossRef]
  49. Excoffier, L.; Laval, G.; Schneider, S. Arlequin (version 3.0): An integrated software package for population genetics data analysis. Evol. Bioinform. 2005, 1, 47–50. [Google Scholar] [CrossRef] [Green Version]
  50. Tamura, K.; Peterson, D.; Peterson, N.; Stecher, G.; Nei, M.; Kumar, S. MEGA5: Molecular evolutionary genetics analysis using maximum likelihood, evolutionary distance, and maximum parsimony methods. Mol. Biol. Evol. 2011, 28, 2731–2739. [Google Scholar] [CrossRef] [PubMed] [Green Version]
  51. Price, A.L.; Patterson, N.J.; Plenge, R.M.; Weinblatt, M.E.; Shadick, N.A.; Reich, D. Principal components analysis corrects for stratification in genome-wide association studies. Nat. Genet. 2006, 38, 904–909. [Google Scholar] [CrossRef]
  52. Manel, S.; Schwartz, M.K.; Luikart, G.; Taberlet, P. Landscape genetics combining landscape ecology and population genetics. Trends Ecol. Evol. 2003, 18, 189–197. [Google Scholar] [CrossRef]
  53. Pritchard, J.K.; Stephens, M.; Donnelly, P. Inference of population structure using multilocus genotype data. Genetics 2000, 155, 945–959. [Google Scholar]
  54. Earl, D.A.; Vonholdt, B.M. Structure Harvester: A website and program for visualizing STRUCTURE output and implementing the Evanno method. Conserv. Genet. Resour. 2012, 4, 359–361. [Google Scholar] [CrossRef]
  55. Jakobsson, M.; Rosenberg, N.A. CLUMPP: A cluster matching and permutation program for dealing with label switching and multimodality in analysis of population structure. Bioinformatics 2007, 23, 1801–1806. [Google Scholar] [CrossRef] [Green Version]
  56. Francis, R.M. Pophelper: An R package and web app to analyse and visualize population structure. Mol. Ecol. Resour. 2017, 17, 27–32. [Google Scholar] [CrossRef] [Green Version]
  57. Bradbury, P.J.; Zhang, Z.; Kroon, D.E.; Casstevens, T.M.; Ramdoss, Y.; Buckler, E.S. TASSEL: Software for association mapping of complex traits in diverse samples. Bioinformatics 2007, 23, 2633–2635. [Google Scholar] [CrossRef] [PubMed]
  58. Wright, S. Genetic structure of populations. Br. Med. J. 1950, 2, 36. [Google Scholar] [PubMed] [Green Version]
  59. Quian-Ulloa, R.; Stange, C. Carotenoid Biosynthesis and Plastid Development in Plants: The Role of Light. Int. J. Mol. Sci. 2021, 22, 1184. [Google Scholar] [CrossRef]
  60. Mpai, S.; Sivakumar, D. Stimulation of Light-Emitting Diode Treatment on Defence System and Changes in Mesocarp Metabolites of Avocados Cultivars (Hass and Fuerte) during Simulated Market Shelf Conditions. Agronomy 2020, 10, 1654. [Google Scholar] [CrossRef]
  61. Peavey, M.; Goodwin, I.; McClymont, L. The Effects of Canopy Height and Bud Light Exposure on the Early Stages of Flower Development in Prunus persica (L.) Batsch. Plants 2020, 9, 1073. [Google Scholar] [CrossRef] [PubMed]
  62. Reid, M.; Kalcsits, L. Water Deficit Timing Affects Physiological Drought Response, Fruit Size, and Bitter Pit Development for ‘Honeycrisp’ Apple. Plants 2020, 9, 874. [Google Scholar] [CrossRef] [PubMed]
  63. Silva, R.B.; Gabira, M.M.; Prado, D.Z.; Uesugi, G.; Simões, D.; Silva, M.R. Influence of Mean Leaf Angles and Irrigation Volumes on Water Capture, Leaching, and Growth of Tropical Tree Seedlings. Forests 2020, 11, 1198. [Google Scholar] [CrossRef]
  64. Anna, K.-I.; Sylwia, Ł.; Marcin, Z.; Ewa, S.-O.; Wojtan, B. Variability of Leaf Wetting and Water Storage Capacity of Branches of 12 Deciduous Tree Species. Forests 2020, 11, 1158. [Google Scholar] [CrossRef]
  65. Arenas-Navarro, M.; García-Oliva, F.; Terrazas, T.; Torres-Miranda, A.; Oyama, K. Leaf Habit and Stem Hydraulic Traits Determine Functional Segregation of Multiple Oak Species along a Water Availability Gradient. Forests 2020, 11, 894. [Google Scholar] [CrossRef]
  66. Kim, C.-B.; Kim, Y.S.; Choi, H.T.; Kim, J.; Kim, S.; Cha, S.; Gao, G.-L.; Bao, Y.-F.; Son, Y.; Kwon, J.; et al. Sand Dune Height Increases Water Use Efficiency at the Expense of Growth and Leaf Area in Mongolian Pine Growing in Hulunbeier Steppe, Inner Mongolia, China. Forests 2019, 10, 558. [Google Scholar] [CrossRef] [Green Version]
  67. Botstein, D.; White, R.L.; Skolnick, M.; Davis, R.W. Construction of a genetic linkage map in man using restriction fragment length polymorphisms. Am. J. Hum. Genet. 1980, 32, 314–331. [Google Scholar]
  68. Luo, C.; Zhang, F.; Zhang, Q.L.; Guo, D.Y.; Luo, Z.R. Characterization and comparison of EST-SSR and TRAP markers for genetic analysis of the Japanese persimmon Diospyros kaki. Genet. Mol. Res. 2013, 12, 2841–2851. [Google Scholar] [CrossRef]
  69. Naval, M.D.M.; Zuriaga, E.; Pecchioli, S.; Llácer, G.; Giordani, E.; Badenes, M.L. Analysis of genetic diversity among persimmon cultivars using microsatellite markers. Tree Genet. Genomes 2010, 6, 677–687. [Google Scholar] [CrossRef] [Green Version]
  70. Deng, L.B.; Liang, Q.Z.; He, X.H.; Luo, C.; Chen, H.; Qin, Z.S. Investigation and Analysis of Genetic Diversity of Diospyros Germplasms Using SCoT Molecular Markers in Guangxi. PLoS ONE 2015, 10, e0136510. [Google Scholar] [CrossRef]
  71. Jump, A.S.; Hunt, J.M.; Martínez-Izquierdo, J.A.; Peñuelas, J. Natural selection and climate change: Temperature-linked spatial and temporal trends in gene frequency in Fagus sylvatica. Mol. Ecol. 2006, 15, 3469–3480. [Google Scholar] [CrossRef]
  72. Kelly, C.K.; Chase, M.W.; De Bruijn, A.; Fay, M.F.; Woodward, F.I. Temperature-based population segregation in birch. Ecol. Lett. 2003, 6, 87–89. [Google Scholar] [CrossRef]
  73. Bradbury, D.; Smithson, A.; Krauss, S.L. Signatures of diversifying selection at EST-SSR loci and association with climate in natural Eucalyptus populations. Mol. Ecol. 2013, 22, 5112–5129. [Google Scholar] [CrossRef]
  74. Müller, M.; Nelson, C.D.; Gailing, O. Analysis of Environment-Marker Associations in American Chestnut. Forests 2018, 9, 695. [Google Scholar] [CrossRef] [Green Version]
  75. Chen, Z.; Wu, B.; Li, J.; Zhao, T.; Zhou, X.; Zhang, Y. Germination of the seeds and growth of the seedlings of Cinnamomum camphora (L.) Presl. Plant. Species Biol. 2004, 19, 55–58. [Google Scholar] [CrossRef]
  76. Doh, E.J.; Kim, J.H.; Oh, S.E.; Lee, G. Identification and monitoring of Korean medicines derived from Cinnamomum spp. by using ITS and DNA marker. Genes Genom. 2017, 39, 101–109. [Google Scholar] [CrossRef]
  77. Panetta, F.D. Seedling emergence and seed longevity of the tree weeds Celtis sinensis and Cinnamomum camphora. Weed Res. 2010, 41, 83–95. [Google Scholar] [CrossRef]
  78. Xu, Y.; Chen, J.H.; Zhao, Y.Q.; Wang, Y.; Wang, X.M.; Liu, W.D.; Shi, J.S. Variation of EST-SSR molecular markers among provenances of Chinese fir. J. Nanjing For. Univ. (Nat. Sci. Ed.) 2014, 57, 1–8. [Google Scholar]
  79. Kitamura, K.; Uchiyama, K.; Ueno, S.; Ishizuka, W.; Tsuyama, I.; Goto, S. Geographical Gradients of Genetic Diversity and Differentiation among the Southernmost Marginal Populations of Abies sachalinensis Revealed by EST-SSR Polymorphism. Forests 2020, 11, 233. [Google Scholar] [CrossRef] [Green Version]
  80. Zeng, Y.F.; Wang, W.T.; Liao, W.J.; Wang, H.F.; Zhang, D.Y. Multiple glacial refugia for cool-temperate deciduous trees in northern East Asia: The Mongolian oak as a case study. Mol. Ecol. 2015, 24, 5676–5691. [Google Scholar] [CrossRef]
  81. Aghdam, M.S.; Hassanpouraghdam, M.B.; Paliyath, G.; Farmani, B. The language of calcium in postharvest life of fruits, vegetables and flowers. Sci. Hortic. 2012, 144, 102–115. [Google Scholar] [CrossRef]
  82. Katayama-Ikegami, A.; Yonemori, K.; Sato, A.; Yamada, M.; Habu, T.; Kitajima, A. Relationship between astringency type and fruit shape in progenies of Chinese PCNA persimmon. Hortic. Res. 2013, 12, 29–34. (In Japanese) [Google Scholar] [CrossRef]
  83. Maeda, H.; Akagi, T.; Tao, R. Quantitative characterization of fruit shape and its differentiation pattern in diverse persimmon (Diospyros kaki) cultivars. Sci. Hortic. 2018, 228, 41–48. [Google Scholar] [CrossRef]
  84. Yamamura, H.; Naito, R. GA-like substances in immature fruit of kaki (Diospyros kaki L.). J. Jpn. Soc. Hort. Sci. 1973, 42, 1–6. [Google Scholar] [CrossRef]
  85. Maeda, H.; Akagi, T.; Onoue, N.; Kono, A.; Tao, R. Evolution of Lineage-Specific Gene Networks Underlying the Considerable Fruit Shape Diversity in Persimmon. Plant. Cell Physiol. 2019, 60, 2464–2477. [Google Scholar] [CrossRef]
  86. Resende, R.T.; Resende, M.D.; Silva, F.F.; Azevedo, C.F.; Takahashi, E.K.; Silva-Junior, O.B.; Grattapaglia, D. Regional heritability mapping and genome-wide association identify loci for complex growth, wood and disease resistance traits in Eucalyptus. New Phytol. 2017, 213, 1287–1300. [Google Scholar] [CrossRef] [Green Version]
  87. Cao, K.; Zhou, Z.; Wang, Q.; Guo, J.; Zhao, P.; Zhu, G.; Fang, W.; Chen, C.; Wang, X.; Wang, X.; et al. Genome-wide association study of 12 agronomic traits in peach. Nat. Commun. 2016, 7, 13246. [Google Scholar] [CrossRef] [PubMed] [Green Version]
  88. Farneti, B.; Di Guardo, M.; Khomenko, I.; Cappellin, L.; Biasioli, F.; Velasco, R.; Costa, F. Genome-wide association study unravels the genetic control of the apple volatilome and its interplay with fruit texture. J. Exp. Bot. 2017, 68, 1467–1478. [Google Scholar] [CrossRef] [PubMed]
  89. Herrera, C.M. Post-floral perianth functionality: Contribution of persistent sepals to seed development in Helleborus foetidus (Ranunculaceae). Am. J. Bot. 2005, 92, 1486–1491. [Google Scholar] [CrossRef]
Figure 1. Polyacrylamide gel obtained in simple sequence repeat (SSR) marker A1. The number at the top of the figure represents the sample order; the number beside the right of the figure represents the size of DNA marker; each locus of the DKMP8 SSR marker is labeled in the figure with the black arrow. Sample genotypic data of DKMP8 were created based on the presence (1) or absence (0) of each loci (e.g., in sample 48, the genotypic data of DKMP8 marker are DKMP8-284 (0), DKMP8-294(1), DKMP8-308(0), DKMP8-320(0), DKMP8-328(1), DKMP8-336(0), DKMP8-352(0), DKMP8-390(1).
Forests 12 00422 g001
Figure 2. Mantel correlation between the genetic and geographic distances.
Forests 12 00422 g002
Figure 3. The correlation coefficient between population genetic diversity parameters and the sample size of germplasm populations.
Forests 12 00422 g003
Figure 4. A neighbor joining dendrogram showing the genetic affiliation of the 179 persimmon germplasms. All germplasms were divided into four groups (I, II III, and IV).
Forests 12 00422 g004
Figure 5. Genetic structure of the 179 persimmon germplasms revealed by principal component analysis (PCA).
Forests 12 00422 g005
Figure 6. Diagnostic plots of delta-K from the STRUCTURE analysis of the 179 D. kaki germplasms populations.
Forests 12 00422 g006
Figure 7. Genetic structure of the 179 persimmon germplasms revealed by STRUCTURE analysis.
Forests 12 00422 g007
Figure 8. Distribution and quantity of 179 D. kaki samples from different regions in Zhejiang Province. Each circle represents different ecologic regions of sampled D. kaki germplasms. P1–P16 represents the 16 populations of germplasms. The pie chart with different color parts represents the different clusters, and the blue parts represent Cluster-I (C-I), the red parts represent Cluster-II (C-II), and the black parts represent Cluster-III (C-III). Every dot represents every germplasm, the blue dot represent the germplasm of Cluster-I, the red dots represent the germplasm of Cluster-II, and the black dots represent the germplasm of Cluster-III.
Forests 12 00422 g008
Figure 9. Distribution of alleles among clusters per locus. The pie chart with different color parts represents the different allele numbers of each locus among clusters, and the green pie represents zero allele of the loci existing in the cluster, the red pie represents one allele of the loci existing in the cluster, and the yellow pie represents more than one allele of the loci existing in the cluster.
Forests 12 00422 g009
Table 1. Abbreviation and full name of population and climatic factor in this research.
Pop No.Full Name of PopulationAbbreviationFull Name of Climatic Factor
Pop 1Hill north of Hang Jia Hu PlainSprPRPrecipitation in spring (March to May)
Pop 2Hang Jia Hu PlainSumPRPrecipitation in summer (June to August)
Pop 3Ningshao PlainAutPRPrecipitation in autumn (September to November)
Pop 4Western Hang Jia Hu PlainWinPRPrecipitation in winter (December to February)
Pop 5Eastern Zhejiang HillSprSRSolar radiation in spring (March to May)
Pop 6Tiantai MountainSumSRSolar radiation in summer (June to August)
Pop 7Thousand Island LakeAutSRSolar radiation in autumn (September to November)
Pop 8Xin’an RiverWinSRSolar radiation in winter (December to February)
Pop 9Eastern Qujing BasinSprMTMean temperature in spring (March to May)
Pop 10JingQu BasinSumMTMean temperature in summer (June to August)
Pop 11The eastern hills of JingQu BasinAutMTMean temperature in autumn
(September to November)
Pop 12Xianxia Mountain and Qian Li GangWinMTMean temperature in winter (December to February)
Pop 13Wenhuang Plain
Pop 14Songgu Basin and Lishui Basin
Pop 15Yandang Mountain and Wenrui Plain
Pop 16Cave mountain range
Table 2. Nine morphological traits present in persimmon germplasms.
Pop No.FCR (mg/100 g)FCC (mg/100 g)FWC (%)FLDFARSW (mm)SL (mm)LARNLV
Pop 10.89 ± 0.26 a,b,c7.81 ± 2.45 a,b,c,d78.35 ± 2.14 b,c,d,e50.65 ± 8.26 b,c0.93 ± 0.18 a,b11.27 ± 1.3 a,b20.75 ± 4.35 b,c,d,e1.74 ± 0.2 a3.61 ± 0.26 e
Pop 20.88 ± 0.39 a,b,c8.71 ± 1.92 a,b,c77.11 ± 6.23 c,d,e49.87 ± 10.26 c0.86 ± 0.24 b11.19 ± 1.83 a,b18.15 ± 3.59 e1.74 ± 0.13 a4.22 ± 0.73 b,c,d
Pop 30.75 ± 0.15 a,b,c,d8.97 ± 1.81 a,b83.39 ± 1.51 a53.68 ± 9.51 a,b,c0.91 ± 0.25 a,b11.66 ± 2.62 a,b22.06 ± 3.79 a,b,c,d1.66 ± 0.22 a4.91 ± 0.28 a
Pop 41.18 ± 0.29 a,b7.66 ± 2.94 a,b,c,d79.44 ± 2.72 b,c,d55.66 ± 8.72 a,b,c1.03 ± 0.15 a,b12.1 ± 2.03 a20.1 ± 1.62 c,d,e1.77 ± 0.14 a4.41 ± 0.4 b,c,d
Pop 50.67 ± 0.07 c,d6.46 ± 1.73 b,c,d78.89 ± 3.17 b,c,d,e49.57 ± 6.8 c1.03 ± 0.25 a,b11.63 ± 4.65 a,b21.08 ± 3.96 a,b,c,d,e1.65 ± 0.07 a4.6 ± 0.93 a,b,c
Pop 60.91 ± 0.33 a,b,c7.71 ± 1.28 a,b,c,d80.66 ± 3.06 a,b61.62 ± 8.24 a1.16 ± 0.27 a10.69 ± 1.22 a,b24.55 ± 3.58 a1.6 ± 0.12 a,b4.19 ± 0.81 b,c,d
Pop 70.77 ± 0.19 a,b,c,d6.19 ± 3.26 c,d75.94 ± 3.96 e55.79 ± 8.87 a,b,c1.08 ± 0.18 a,b9.75 ± 1.11 b22.06 ± 2.76 a,b,c,d1.77 ± 0.23 a4.08 ± 0.49 d,e
Pop 80.43 ± 0.09 d5.34 ± 2.03 d80.4 ± 1.57 a,b52.56 ± 8.23 a,b,c0.96 ± 0.17 a,b10.08 ± 0.82 b19.79 ± 3.75 c,d,e1.64 ± 0.2 a3.61 ± 0.31 e
Pop 90.79 ± 0.18 a,b,c,d6.42 ± 2.62 b,c,d77.91 ± 1.2 b,c,d,e56.04 ± 13.46 a,b,c1.12 ± 0.36 a10.15 ± 1.13 b19.1 ± 4.86 d,e1.68 ± 0.11 a4.15 ± 0.42 c,d
Pop 100.69 ± 0.14 c,d7.18 ± 2.24 a,b,c,d80.32 ± 2.47 a,b,c47.49 ± 9.55 c0.92 ± 0.2 a,b11.09 ± 1.4 a,b21.08 ± 2.84 a,b,c,d,e1.65 ± 0.17 a3.95 ± 0.15 d,e
Pop 110.85 ± 0.34 a,b,c,d8.75 ± 3.02 a,b,c78.49 ± 4.18 b,c,d,e48.14 ± 9.67 c1.04 ± 0.26 a,b10.48 ± 1.67 a,b19.45 ± 3.19 c,d,e1.7 ± 0.17 a4.45 ± 0.42 a,b,c,d
Pop 121.19 ± 1.38 a7.04 ± 1.59 a,b,c,d76.23 ± 2.65 d,e50.59 ± 6.66 b,c1.12 ± 0.14 a10.14 ± 1.23 b19.41 ± 1.9 c,d,e1.61 ± 0.13 a,b4.68 ± 0.48 a,b
Pop 130.74 ± 0.17 b,c,d6.97 ± 0.99 a,b,c,d80.01 ± 0.48 b,c60.82 ± 11.49 a,b1.17 ± 0.34 a10.85 ± 1.29 a,b23.86 ± 2.48 a,b1.61 ± 0.17 a,b4.43 ± 0.33 b,c,d
Pop 140.84 ± 0.22 a,b,c,d8.71 ± 3.2 a,b,c76.66 ± 4.29 d,e54.49 ± 9.39 a,b,c1.13 ± 0.22 a9.8 ± 1 b21.02 ± 2.82 a,b,c,d,e1.61 ± 0.2 a,b4.09 ± 0.4 d,e
Pop 150.81 ± 0.16 a,b,c,d9.18 ± 2.49 a80.94 ± 2.21 a,b57.25 ± 11.72 a,b,c1.09 ± 0.28 a,b11.21 ± 1.62 a,b22.85 ± 3.99 a,b,c1.72 ± 0.16 a4.42 ± 0.47 b,c,d
Pop 160.9 ± 0.41 a,b,c6.74 ± 2.55 a,b,c,d78.72 ± 2.79 b,c,d,e49.36 ± 12.42 c1 ± 0.2 a,b9.92 ± 1.07 b21.09 ± 3.02 a,b,c,d,e1.44 ± 0.12 b3.66 ± 0.55 e
All0.82 ± 0.427.74 ± 2.6279.16 ± 3.6653.39 ± 10.181.03 ± 0.2410.74 ± 1.8421.21 ± 3.571.67 ± 0.184.26 ± 0.58
Min *0.322.6164.1324.90.6310.116.462.971.11
Max #5.3216.0185.6381.561.7430.9821.9862.16
Note: Different lowercase letters for each parameter indicate significant differences among populations according to two-way analysis of variance (ANOVA) followed by Duncan multiple- range test (α = 0.05); * represents the minimum value of morphological traits in all 179 persimmon germplasms; # represents the maximum value of morphological traits in all 179 persimmon germplasms.
Table 3. Correlation analysis between the morphological traits and environmental factors for the 179 persimmon germplasms.
ItemSprPRSumPRAutPRWinPRSprSRSumSRAutSRWinSRSprMTSumMTAutMTWinMTLongitudeLatitudeAltitude
FCR0.081−0.089−0.0310.013−0.0560.0140.04−0.0260.0710.0640.0950.06−0.093−0.0280.021
FCC−0.159 *0.1220.190 *−0.187 *−0.082−0.232 **−0.155 *0.156 *−0.1420.0370.0790.1250.250 **−0.190 *−0.004
FWC−0.248 **0.0910.369 **−0.1420.116−0.195 **−0.270 **0.208 **−0.312 **−0.0180.0610.0030.410 **−0.052−0.09
FLD−0.085−0.090.127−0.225 **0.058−0.109−0.1220.098−0.082−0.0150.1020.1420.198 **−0.023−0.041
FAR0.117−0.076−0.042−0.177 *−0.146−0.0910.0190.0160.063−0.083−0.0180.0670.006−0.148 *0.071
SW−0.218 **−0.0940.228 **−0.040.161 *−0.056−0.179 *0.044−0.175 *0.130.070.0260.233 **0.077−0.141
SL−0.1330.040.188 *−0.187 *0.004−0.171 *−0.1210.111−0.0610.0630.164 *0.1460.187 *−0.118−0.075
LAR−0.218 **−0.0960.0390.0520.166 *0.145−0.055−0.133−0.050.140.041−0.075−0.0110.217 **−0.076
NLV−0.067−0.0020.320**−0.0460.106−0.081−0.206 **−0.111−0.173 *0.0590.0090.0440.329 **−0.006−0.039
Note: * represents significant difference at p < 0.05; ** represents significant difference at p < 0.01.
Table 4. Comparison of the genetic diversity for the germplasms populations.
Pop No.Sample SizeNpNeNeiIHePIC
Pop 181901.58260.35240.48360.33040.2606
Pop 271961.59630.36550.49750.33940.2681
Pop 3182081.59320.35070.50420.3410.2707
Pop 481891.56240.34240.47210.3210.254
Pop 571741.49840.3110.42750.28870.2299
Pop 671511.32410.22420.32360.20820.1725
Pop 7162041.53880.3250.47110.31490.2519
Pop 891431.3840.23790.3360.22470.1799
Pop 961771.50780.32370.43920.29670.2367
Pop 10122101.62870.37180.52320.35630.2813
Pop 11152151.62240.36940.52680.35710.2831
Pop 12111971.5650.3410.48140.32550.2586
Pop 1371781.52510.32520.44490.30190.2395
Pop 14141911.54460.32430.46240.31270.2482
Pop 15252081.61130.35270.50760.34560.2725
Pop 1691991.52810.32930.4660.3110.2495
Mean11.19189.371.53830.32790.46040.31090.2473
Table 5. Pairwise genetic differentiation index (FST) estimates for groups resulting from the cluster analyses.
PopP7P16P9P14P1P10P4P2P11P12P8P5P3P13P15P6
P70
P160.08260
P90.03210.05970
P140.0610.0560.04620
P10.06790.09910.07220.07490
P100.07060.07430.05830.07550.04360
P40.11850.1450.130.12840.04010.05280
P20.10660.1160.12790.11890.04460.06080.06650
P110.07080.07620.04940.05510.05470.04580.09810.08670
P120.06650.07440.04140.04470.08510.06120.14680.11440.02890
P80.30130.3360.32430.30020.30950.23510.33480.30230.19470.22960
P50.17910.19430.17270.1610.09740.09180.12220.17250.12790.15420.33370
P30.15080.15920.1690.16110.04860.07430.05670.04960.11820.16530.30950.12940
P130.18760.19810.21930.1930.08660.10440.09860.09510.15830.20830.39120.15110.05520
P150.16390.15390.17690.16460.07870.08340.08910.06280.12240.16590.31010.15630.04270.06640
P60.31440.32770.35790.32330.25090.24530.23050.20630.27170.33620.4970.37970.1770.22360.1510
Note: All FST estimates were highly significant (p < 0.01).
Table 6. Comparison of genetic diversity parameters for the germplasm clusters.
ClusterSample SizeNpNeNeiIHePIC
Cluster-I702131.51270.30410.45540.30150.2422
Cluster-II612201.54930.32110.47810.31880.2546
Cluster-III481981.50260.29850.44330.29540.2367
Mean59.7210.331.52150.30790.458930.30520.2445
Table 7. Marker–trait associations identified through the general linear model (GLM) and mixed linear model (MLM).
OrganTraitsSSR Locus *GLMMLM
p-ValueR2 (%)p-ValueR2 (%)
FruitFruit crude fiber contentDKMP17-2820.000244049.20.000334129
DK11-1970.000244048.560.002166.5
Fruit calcium contentDKMP18-1560.00007215210.190.016114.24
Fruit water contentDKMP13-4400.00041816.280.011584.02
Fruit longitudinal diameterDK26-1840.000229227.420.017373.4
Fruit aspect ratioMDP18-3107.6122 × 10−713.530.000560657.39
SeedSeed widthDKMP7-6000.00017777.810.00216.14
MDP8-2880.0000736318.690.000468598.01
Seed lengthDKMP18-1900.000289867.940.016013.87
MDP18-3100.00004284810.010.006035.06
LeafLeaf aspect ratioDKMP15-5140.000209459.290.010054.81
Number of lateral veinsDK11-2970.000132189.480.000272519.51
DK11-2710.00007232710.180.0001683610.19
Note: * SSR locus, SSR maker-the size of allele (bp).
Publisher’s Note: MDPI stays neutral with regard to jurisdictional claims in published maps and institutional affiliations.

